Copyright
©The Author(s) 2025.
World J Gastroenterol. May 28, 2025; 31(20): 105554
Published online May 28, 2025. doi: 10.3748/wjg.v31.i20.105554
Published online May 28, 2025. doi: 10.3748/wjg.v31.i20.105554
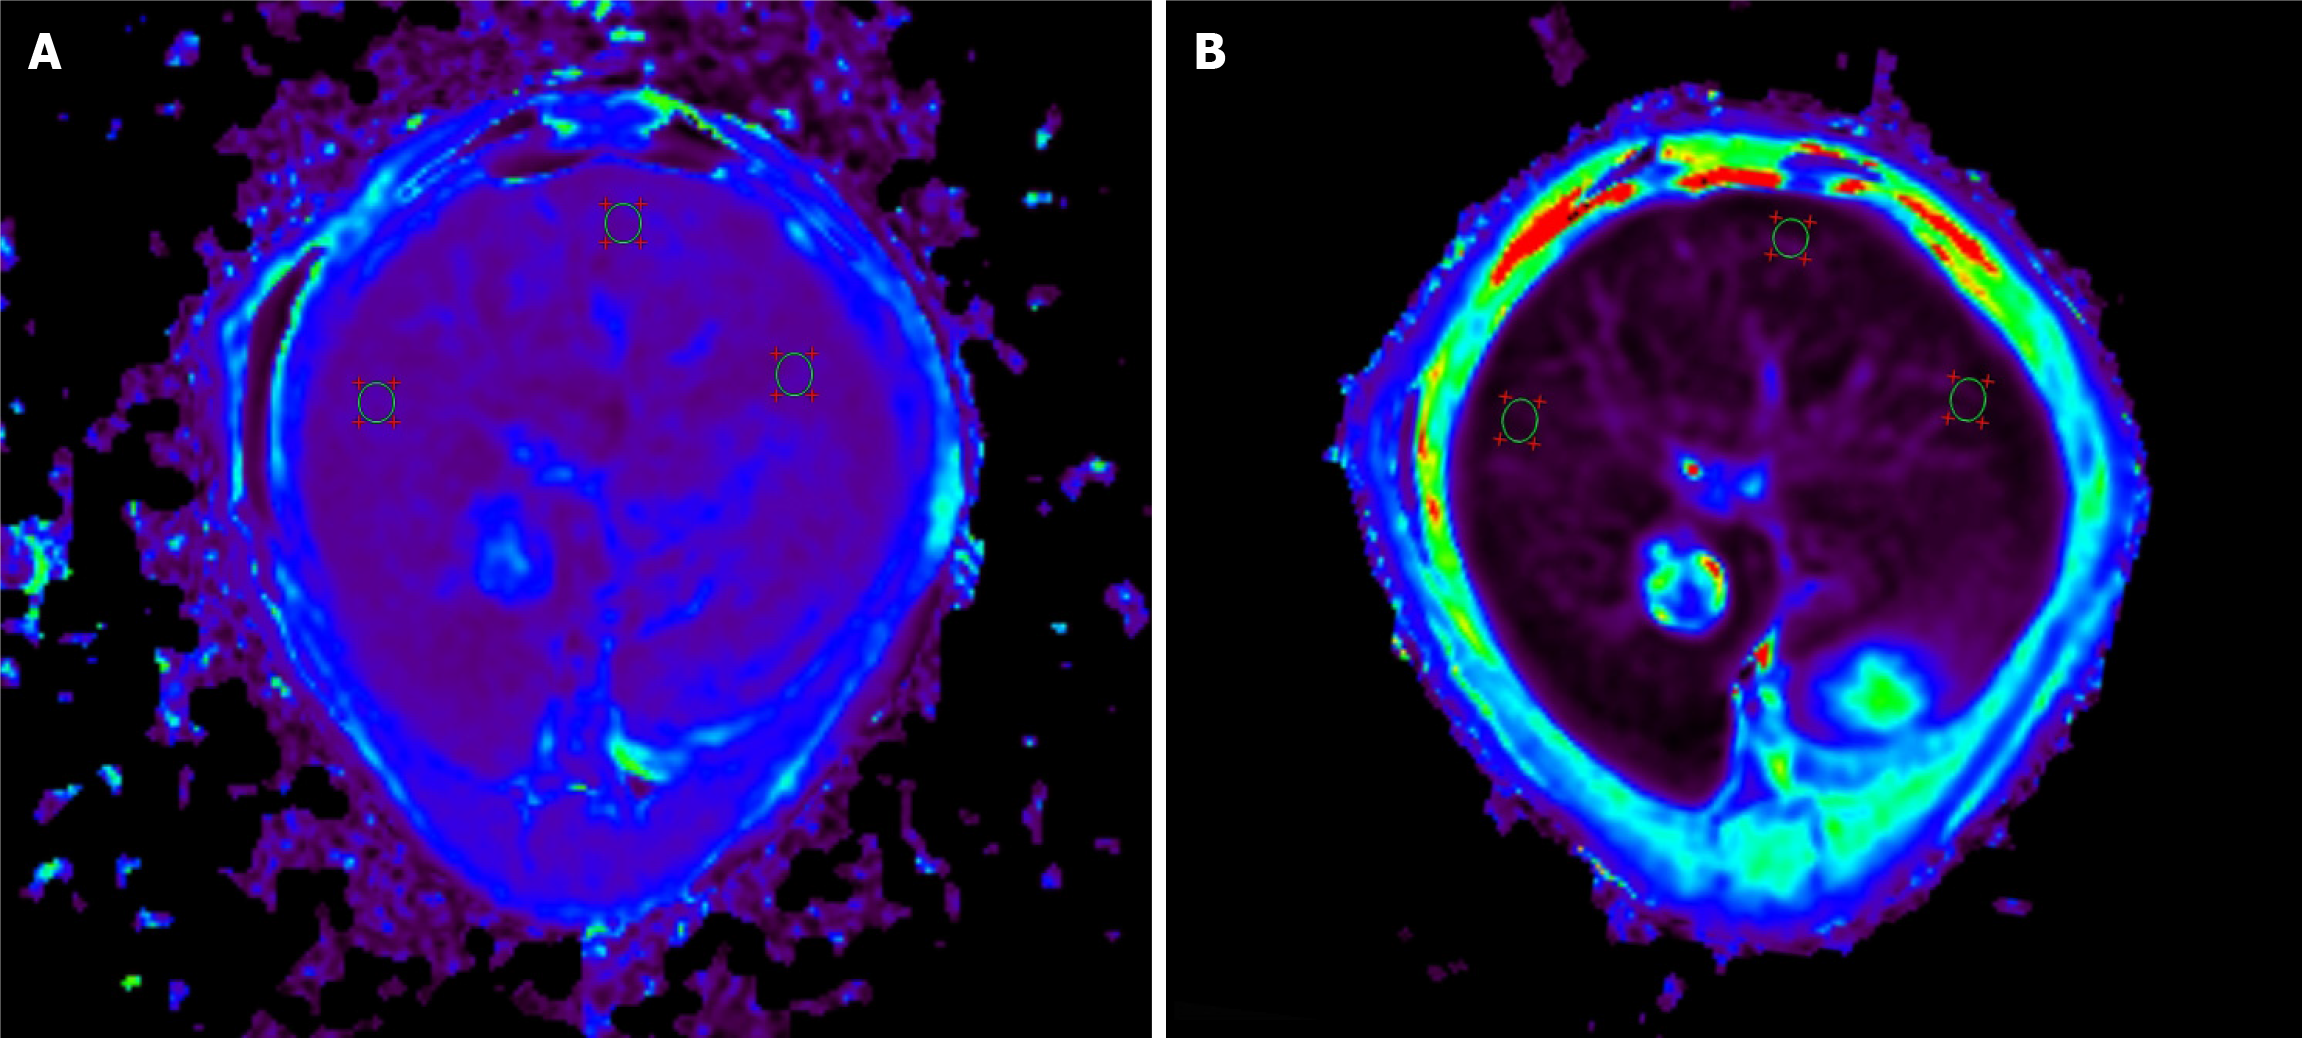
Figure 1 Example of region of interest placement in Balb/C mice.
A: Three regions of interest (ROIs) were allocated to the same liver-parenchyma region in the plain stage, and T1 relaxation time was measured; B: Three ROIs were allocated to the same liver-parenchyma region in the hepatobiliary stage, and T1 relaxation time was measured.
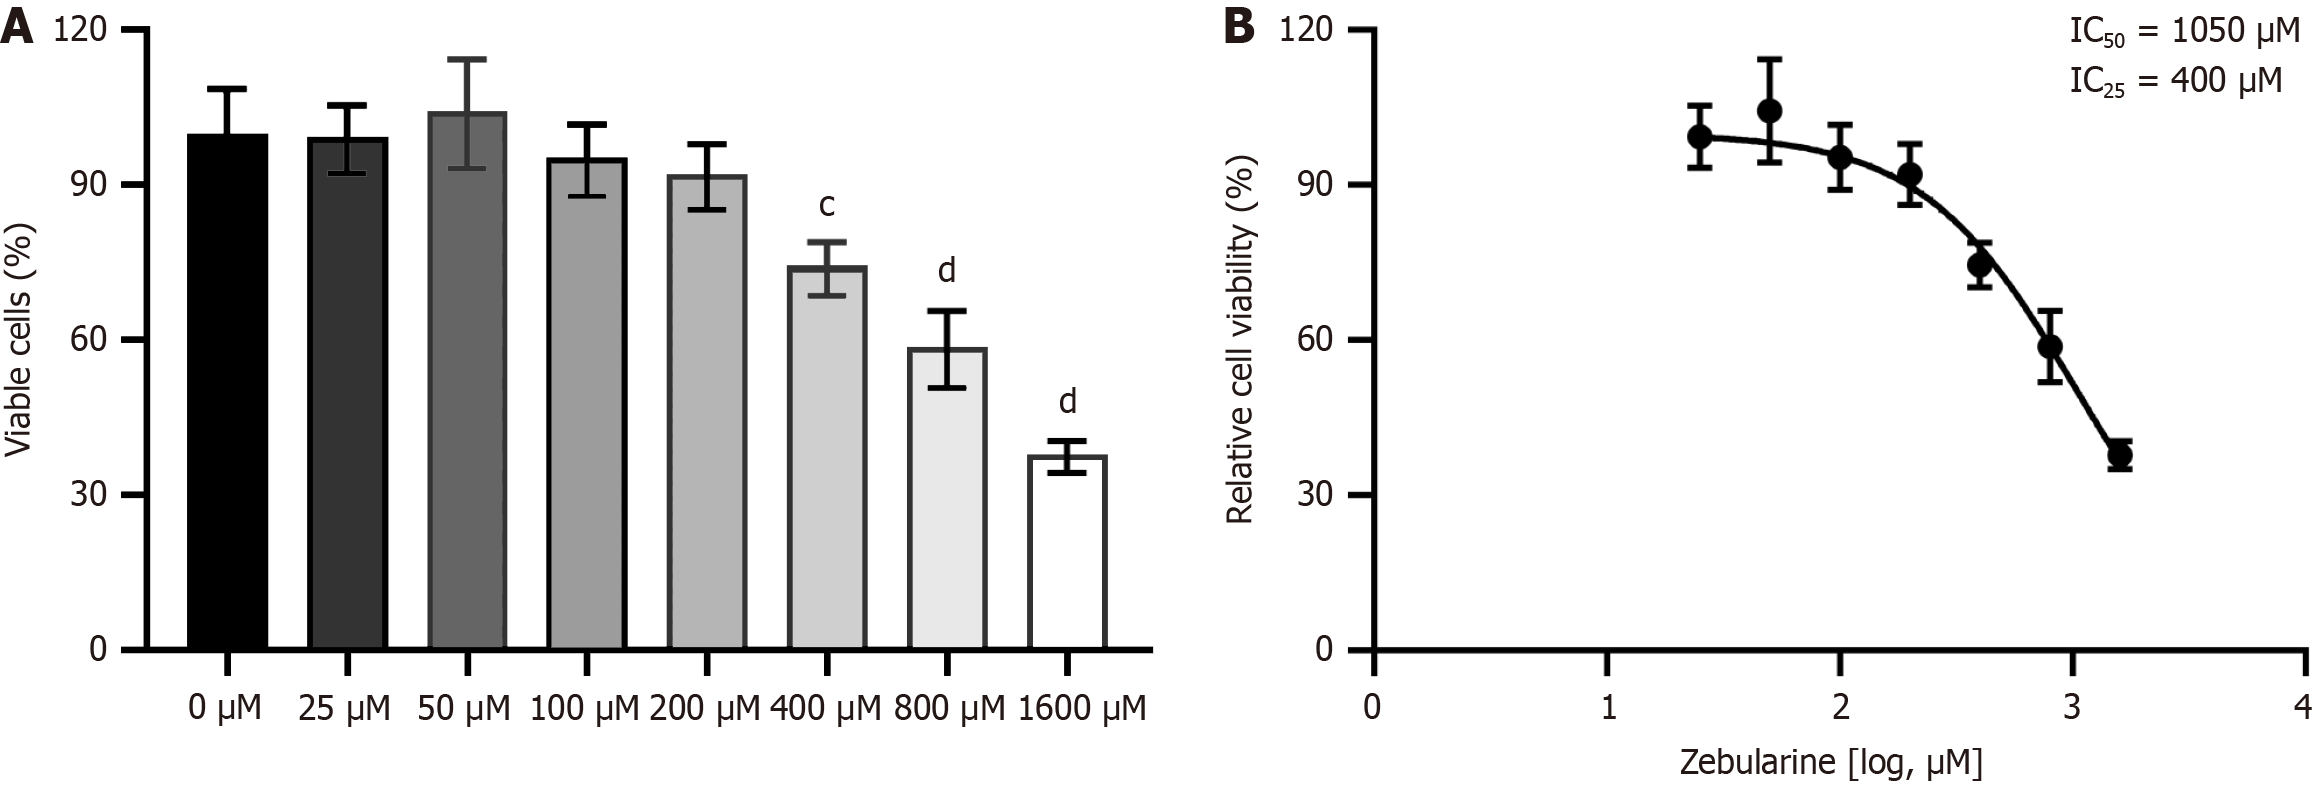
Figure 2 Toxicity of zebularine in LX-2 cells.
A: Histogram showing zebularine concentration-cell viability; B: Nonlinear regression curves [log (zebularine) - relative cell viability]. cP < 0.001. dP < 0.0001.
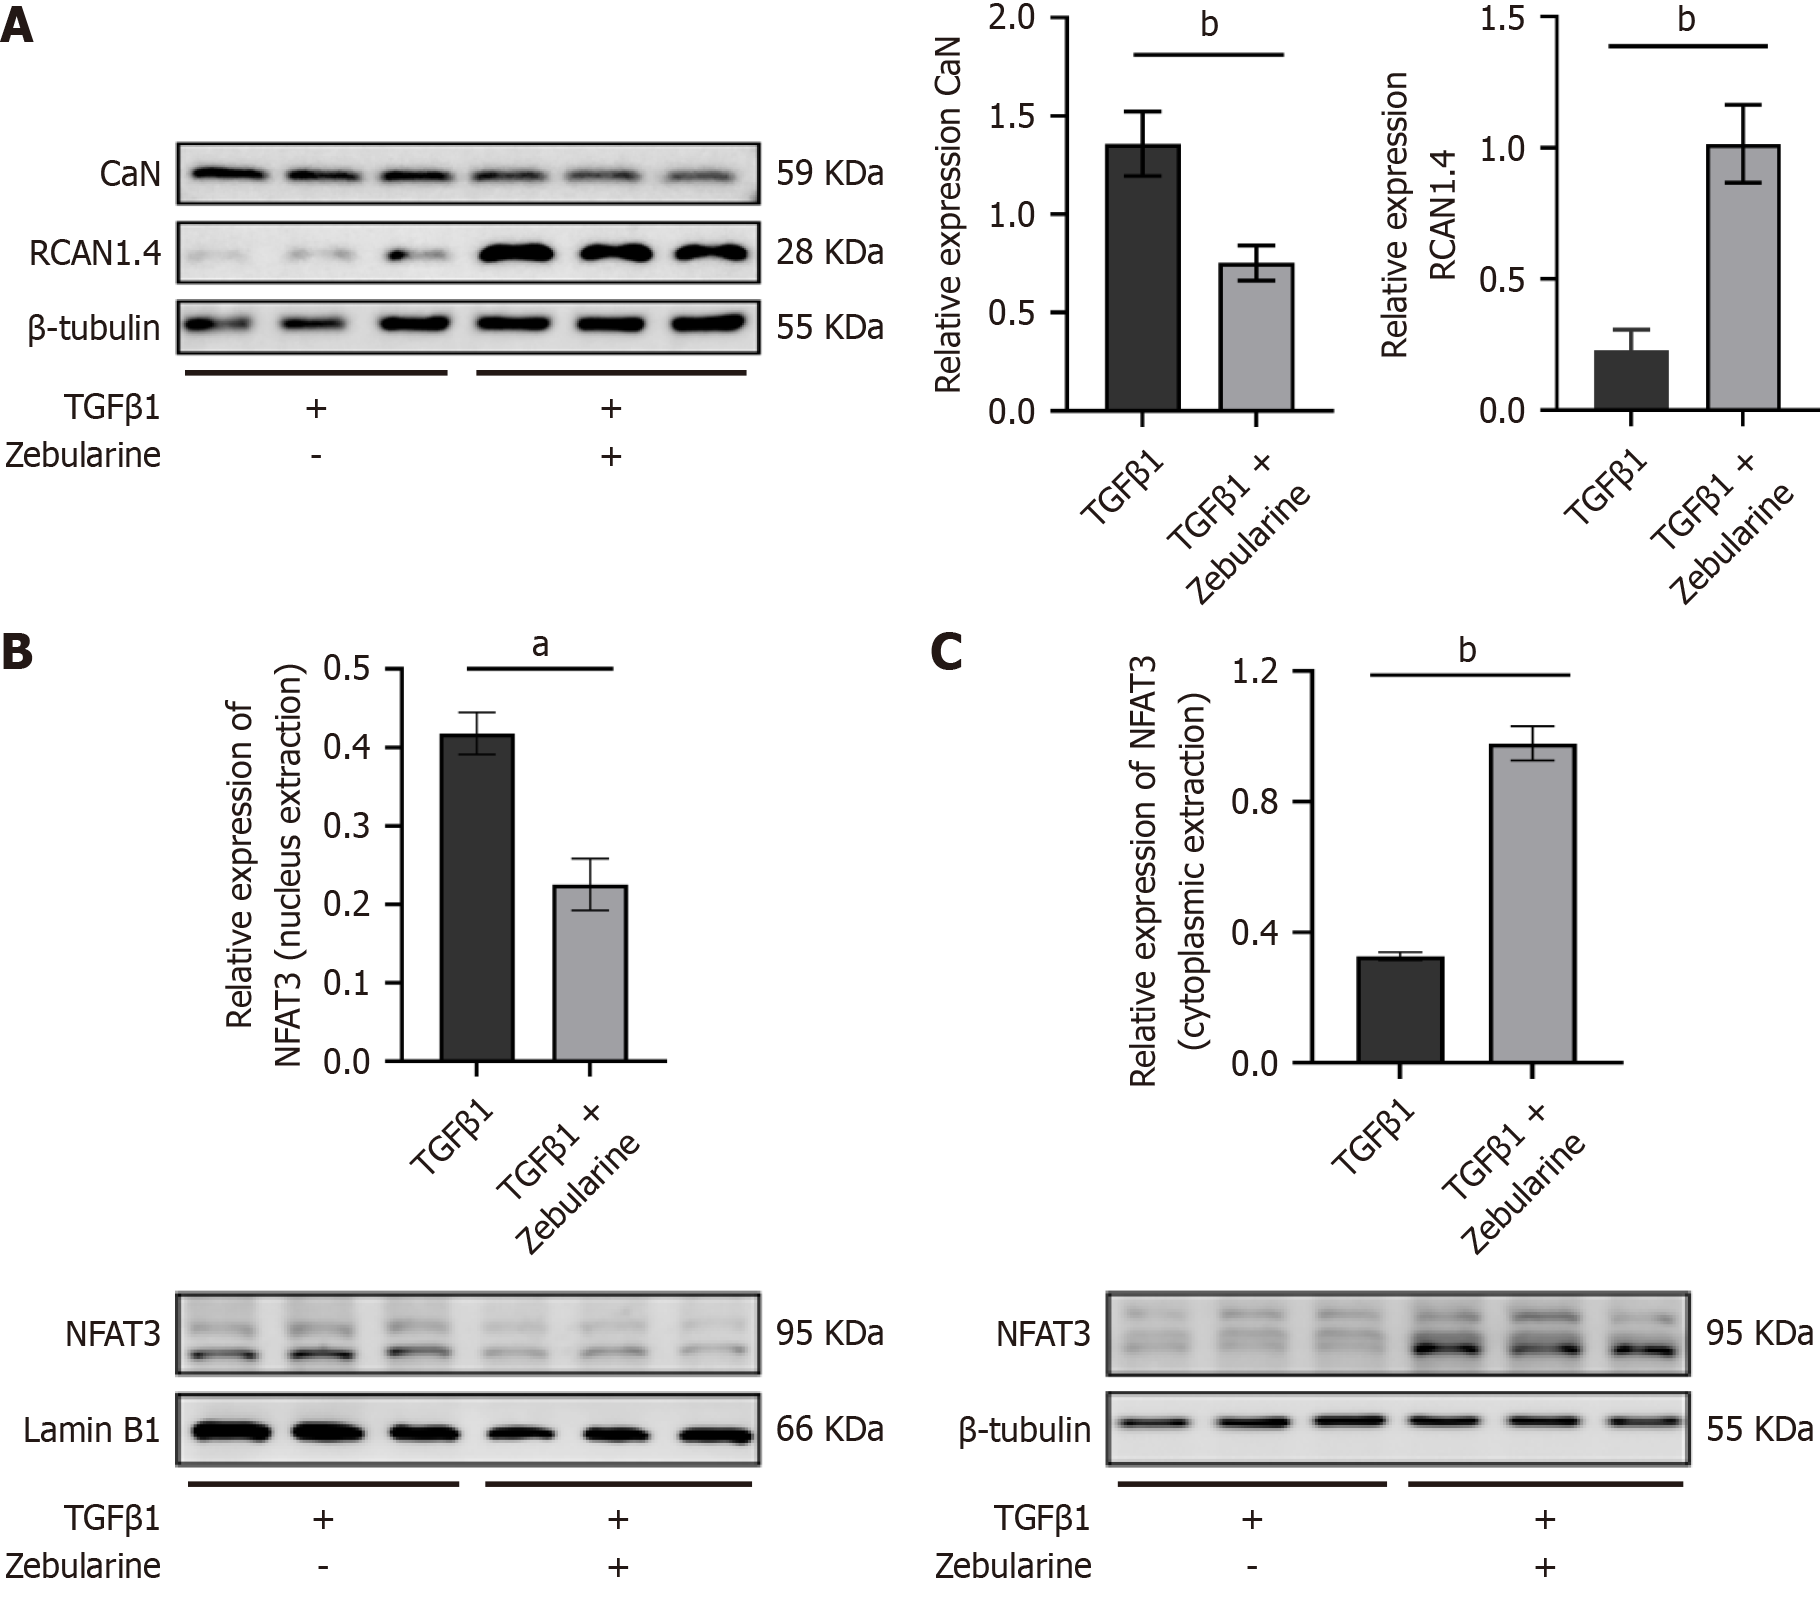
Figure 3 Expression of regulator of calcineurin1.
4, calcineurin, and NFAT3 pairs in transforming growth factor-β1-activated LX-2 by zebularine action. A: Expression of regulator of calcineurin1.4 and calcineurin proteins; B: Intranuclear protein expression of NFAT3; C: Cytoplasmic protein expression of NFAT3. aP < 0.05. bP < 0.01. RCAN: Regulator of calcineurin; CaN: Calcineurin; TGF: Transforming growth factor.
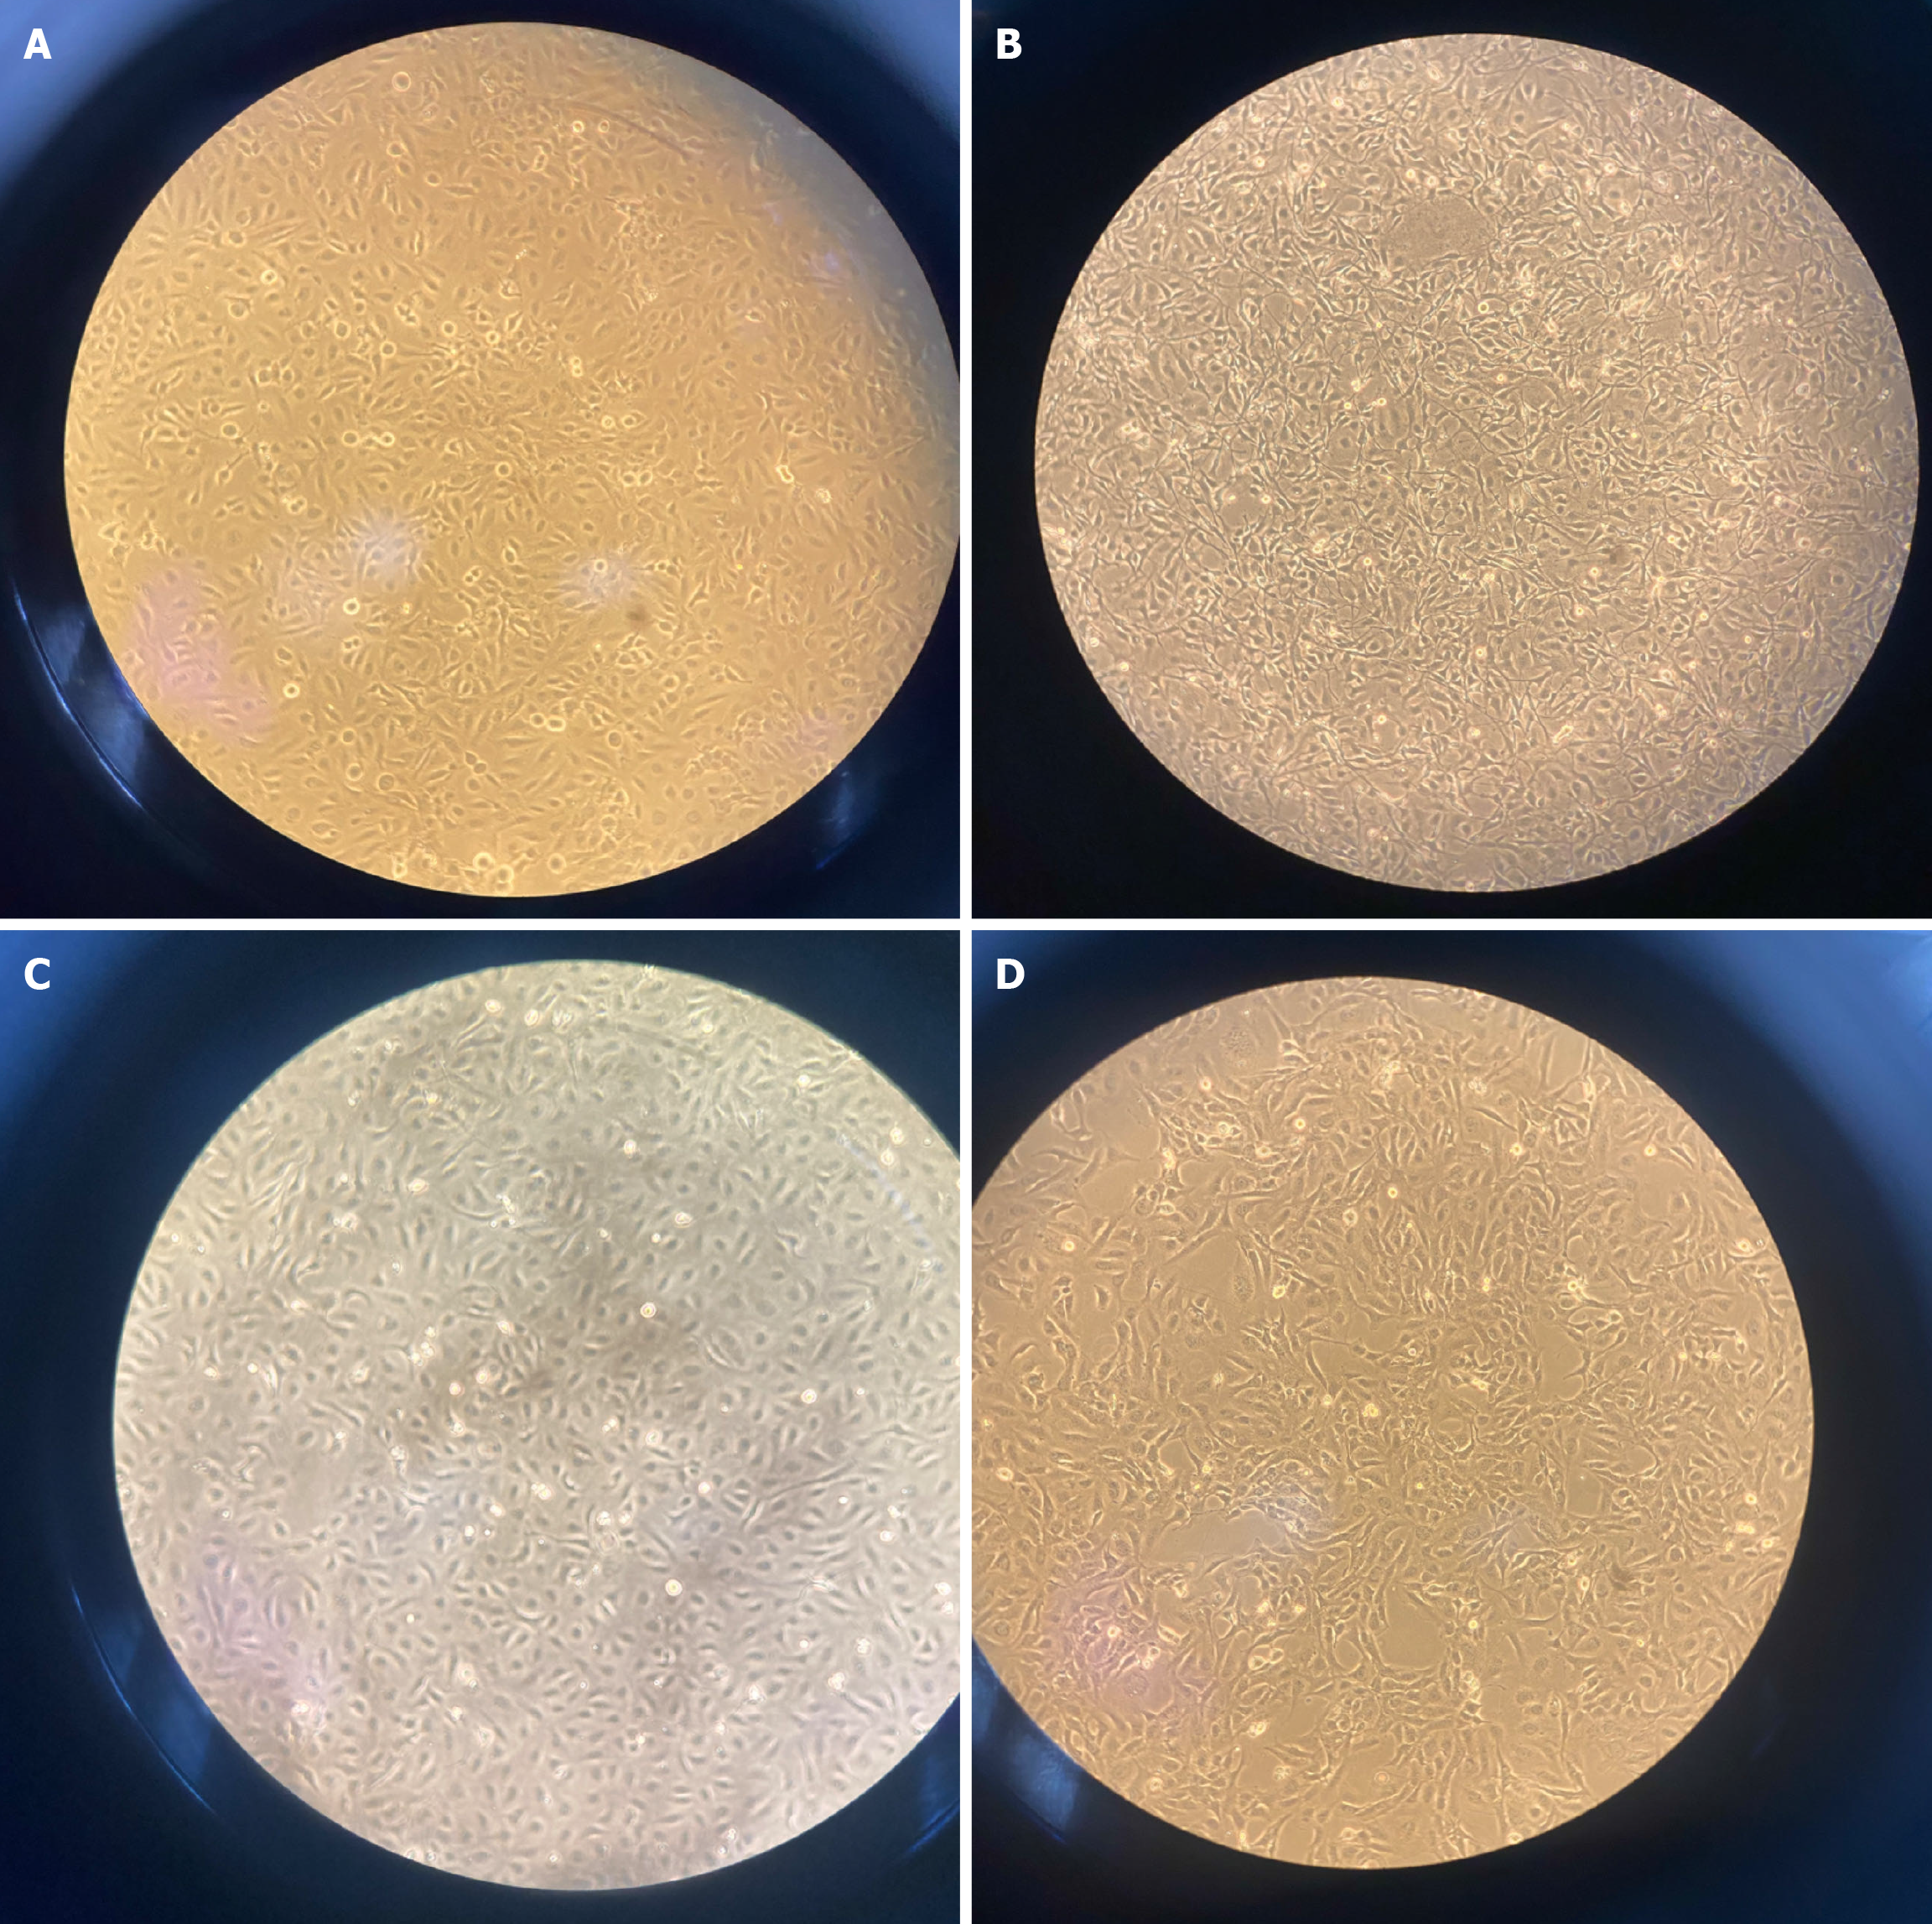
Figure 4 Microscopic changes of LX-2 cells activated by transforming growth factor-β1 by zebularine action.
A: Control group; B: Transforming growth factor-β1 group; C: Zebularine group; D: Transforming growth factor-β1 + zebularine group.
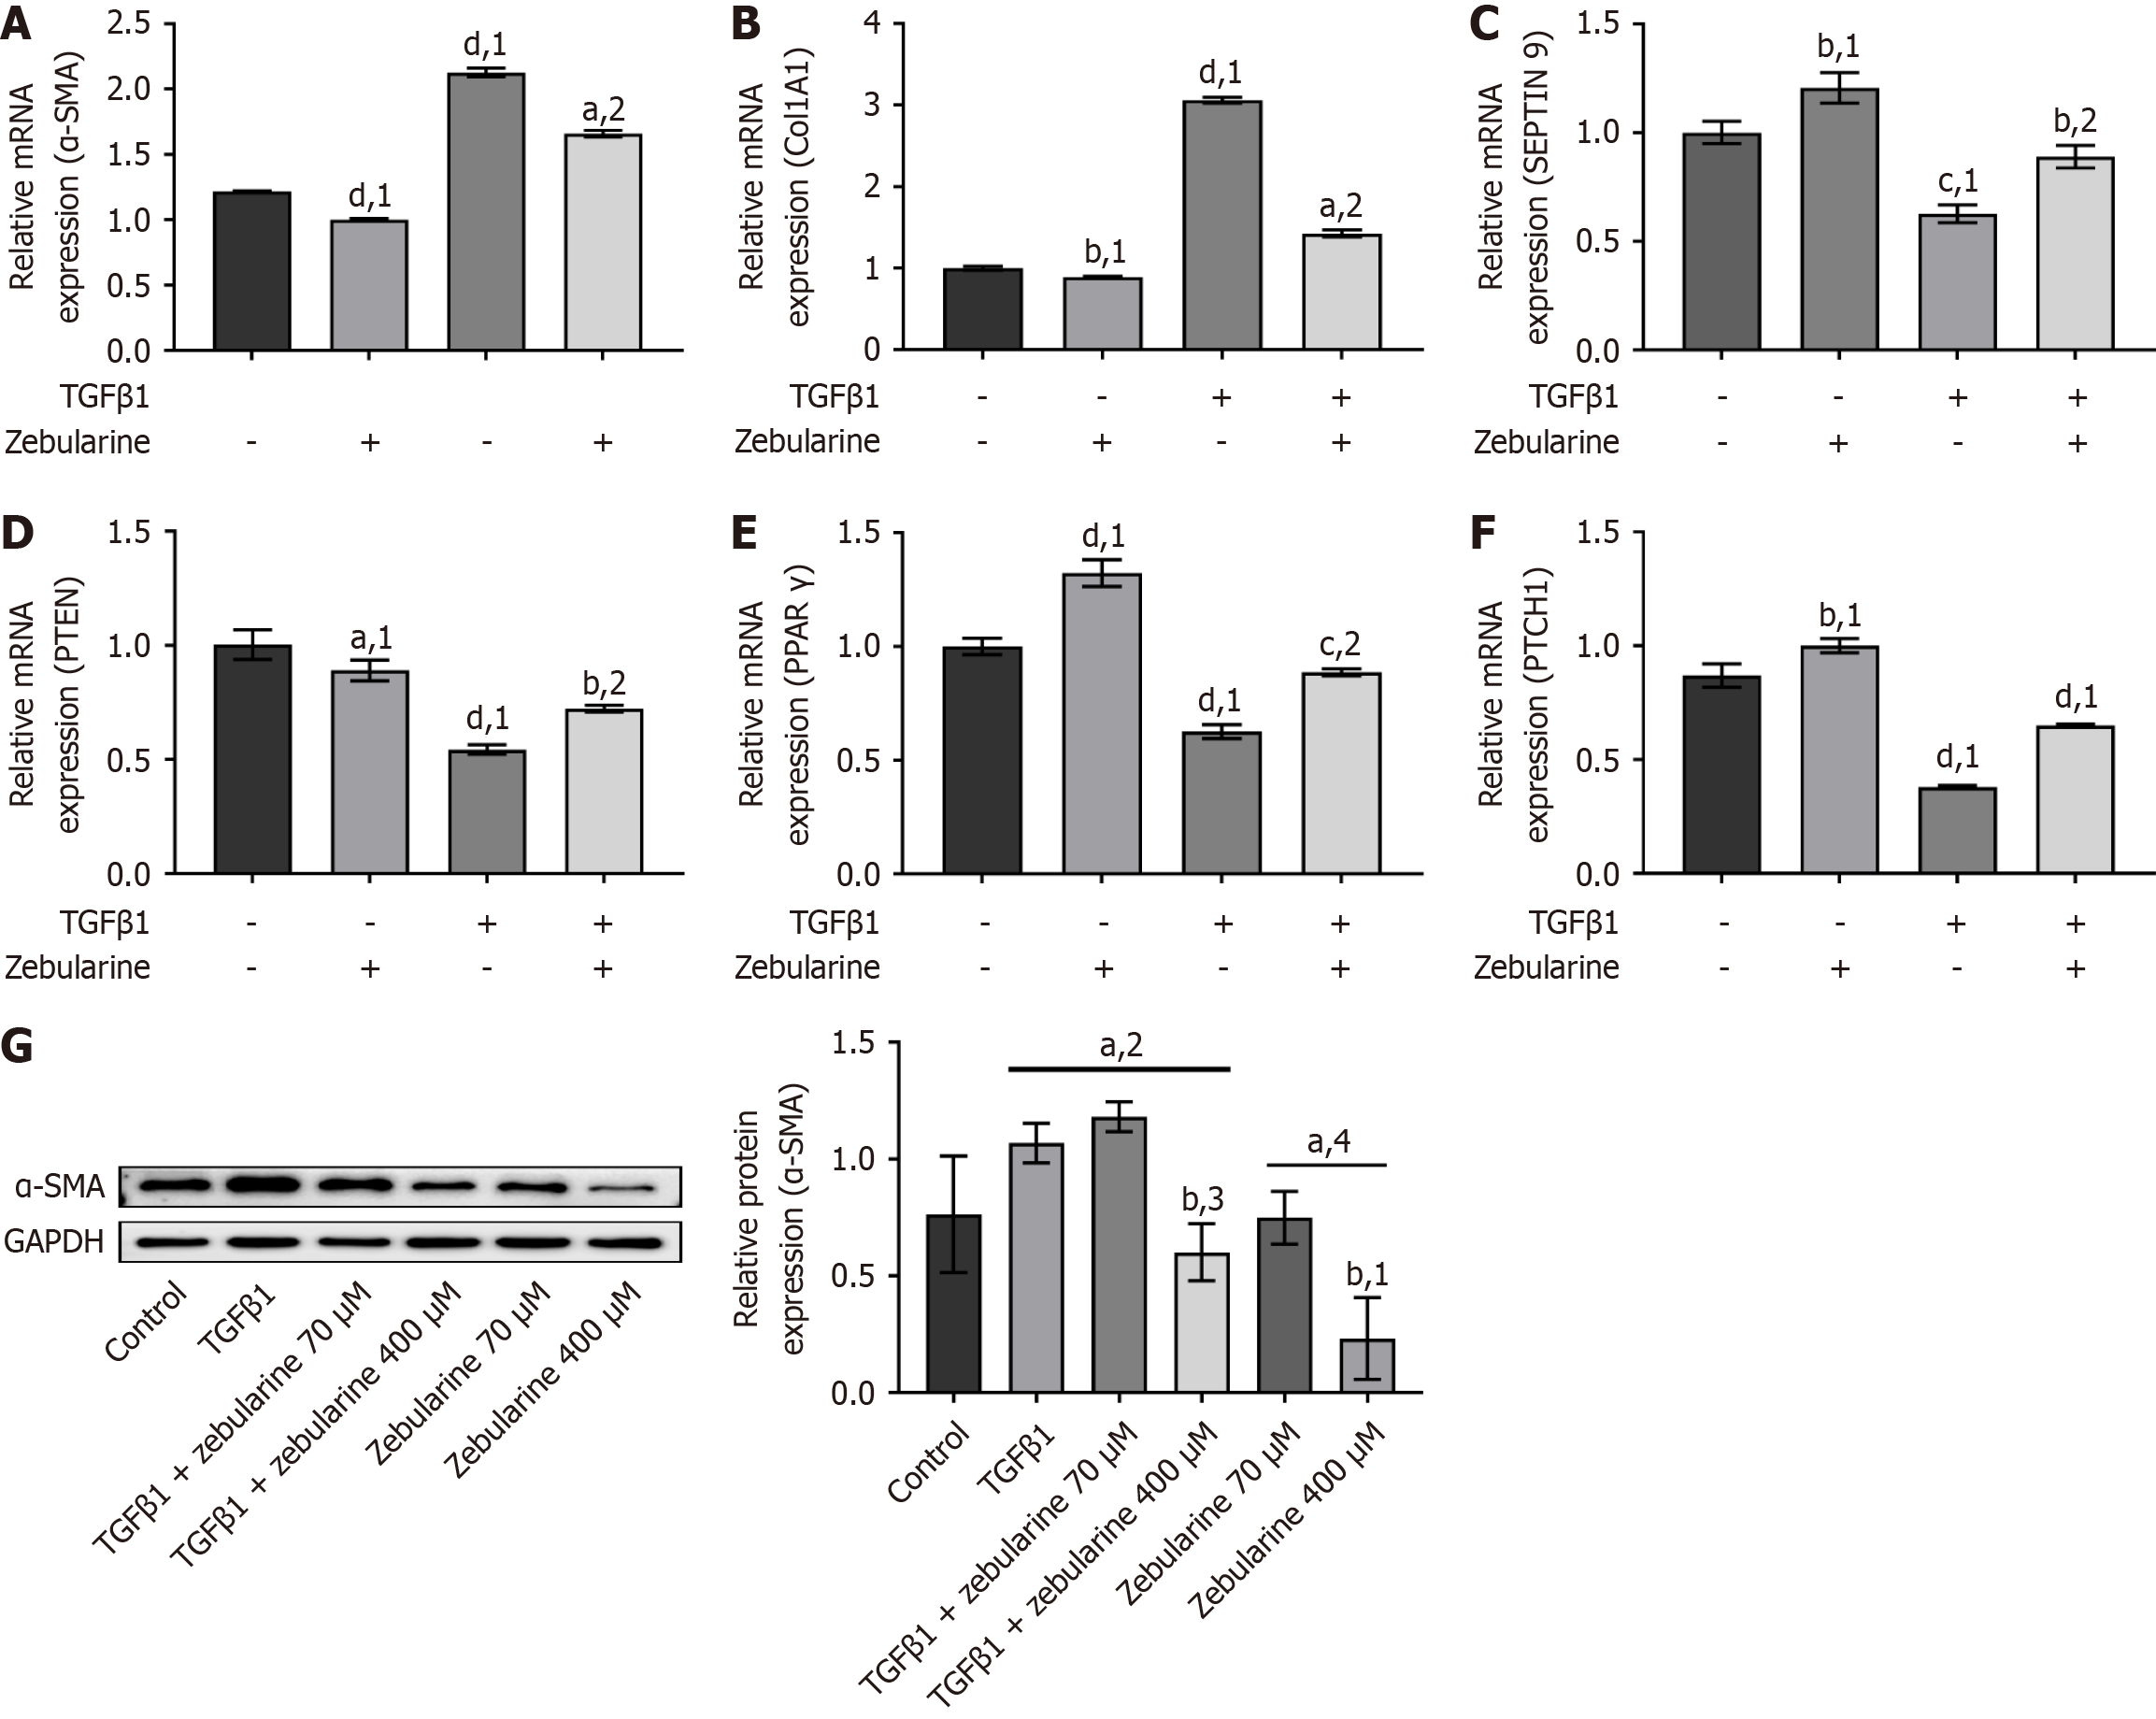
Figure 5 Effect of zebularine on anti-fibrotic and fibrotic gene expression in transforming growth factor-β1-activated LX-2.
The message RNA levels of the following genes in LX-2 cells were measured before and after transforming growth factor-β1 activation and after zebularine treatment. A: α-smooth muscle actin (α-SMA); B: Type I collagen; C: SEPTIN9; D: PTEN; E: PPAR-γ; F: PTCH1; G: Protein expression of α-SMA in LX-2 cells following zebularine intervention at varying concentrations. aP < 0.05. bP < 0.01. cP < 0.001. dP < 0.0001. 1P vs control. 2P vs transforming growth factor-β1. 3P vs transforming growth factor-β1 + zebularine 70 mmol/L. 4P vs zebularine 70 mM. α-SMA: α-smooth muscle actin; TGF: Transforming growth factor; CoL1a1: Type I collagen; GAPDH: Glyceraldehyde-3-phosphate dehydrogenase.
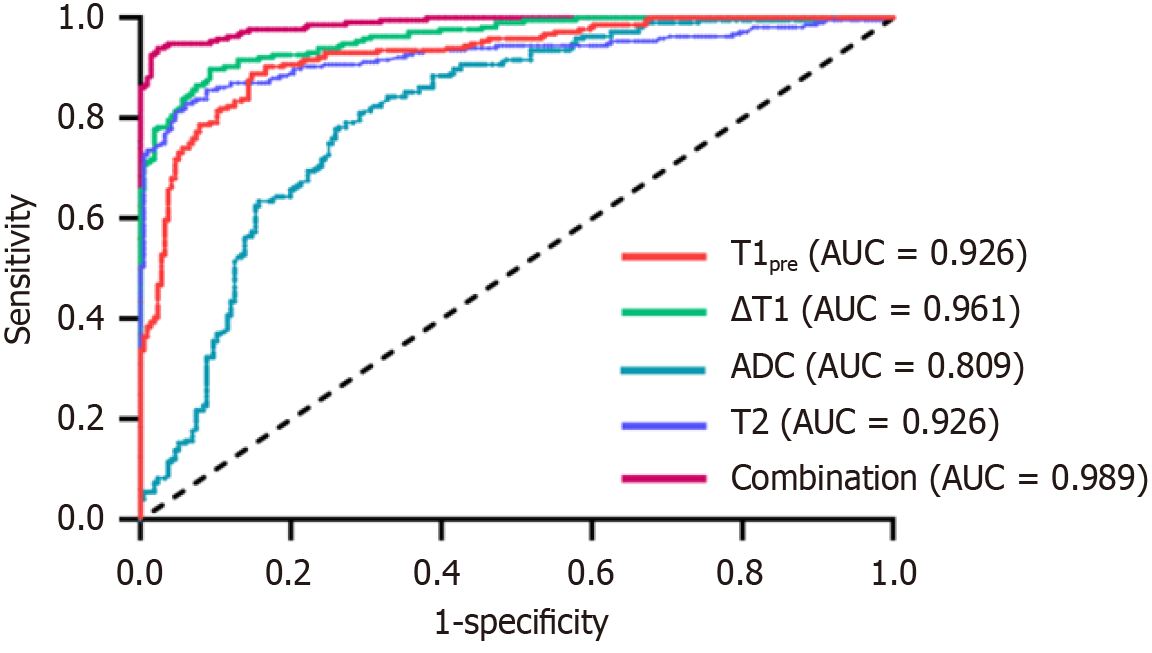
Figure 6 Receiver operating characteristic curves for T1pre, DT1, apparent diffusion coefficient, T2, and the combined diagnostic approach for liver fibrosis.
AUC: Area under the receiver operating characteristic curve; ADC: Apparent diffusion coefficient; Combination: Combined diagnosis.
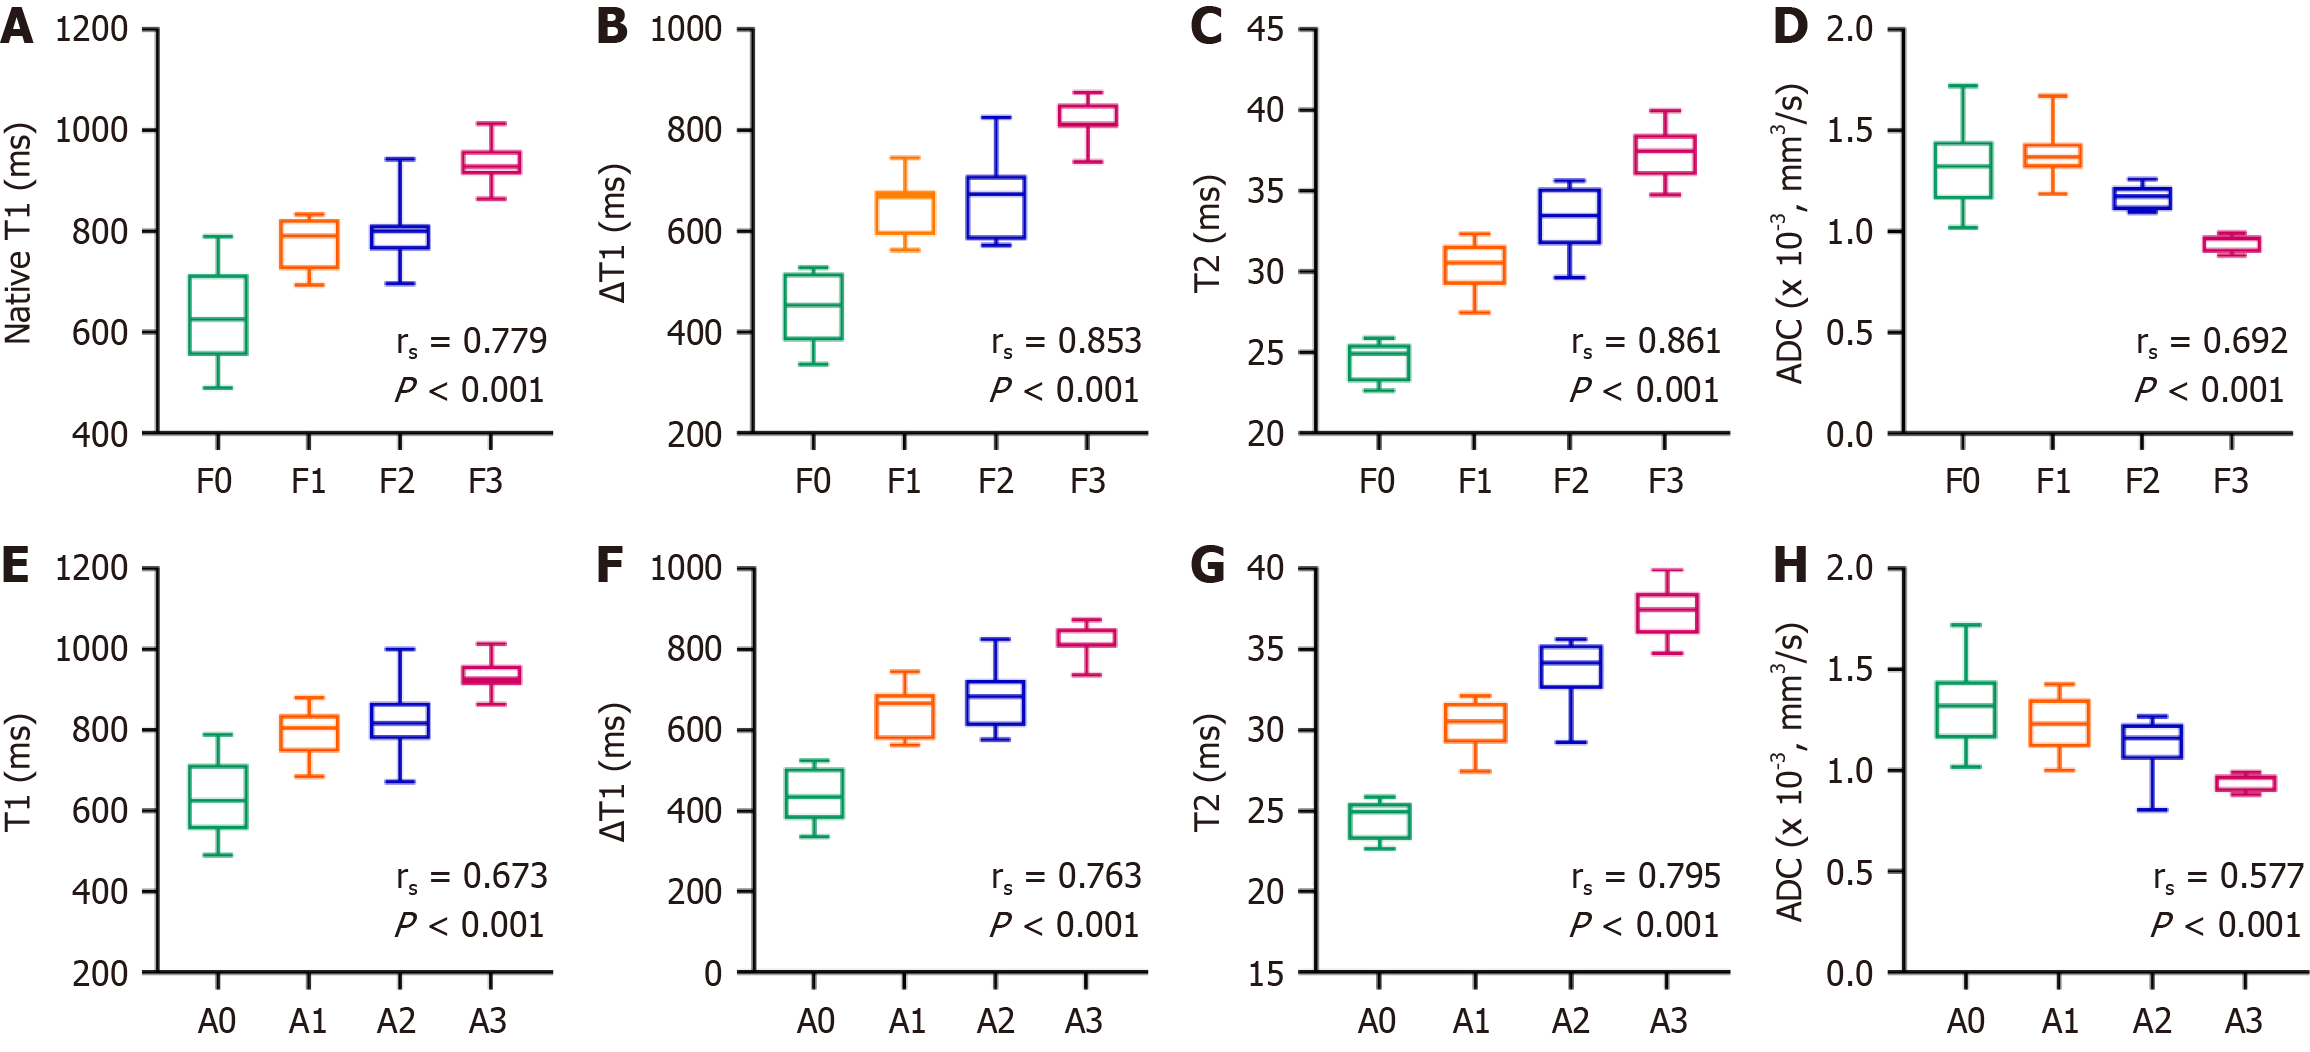
Figure 7 Spearman correlation analysis of magnetic resonance parameters with fibrosis and inflammation.
A-D: Fibrosis; E-H: Inflammation. ADC: Apparent diffusion coefficient.
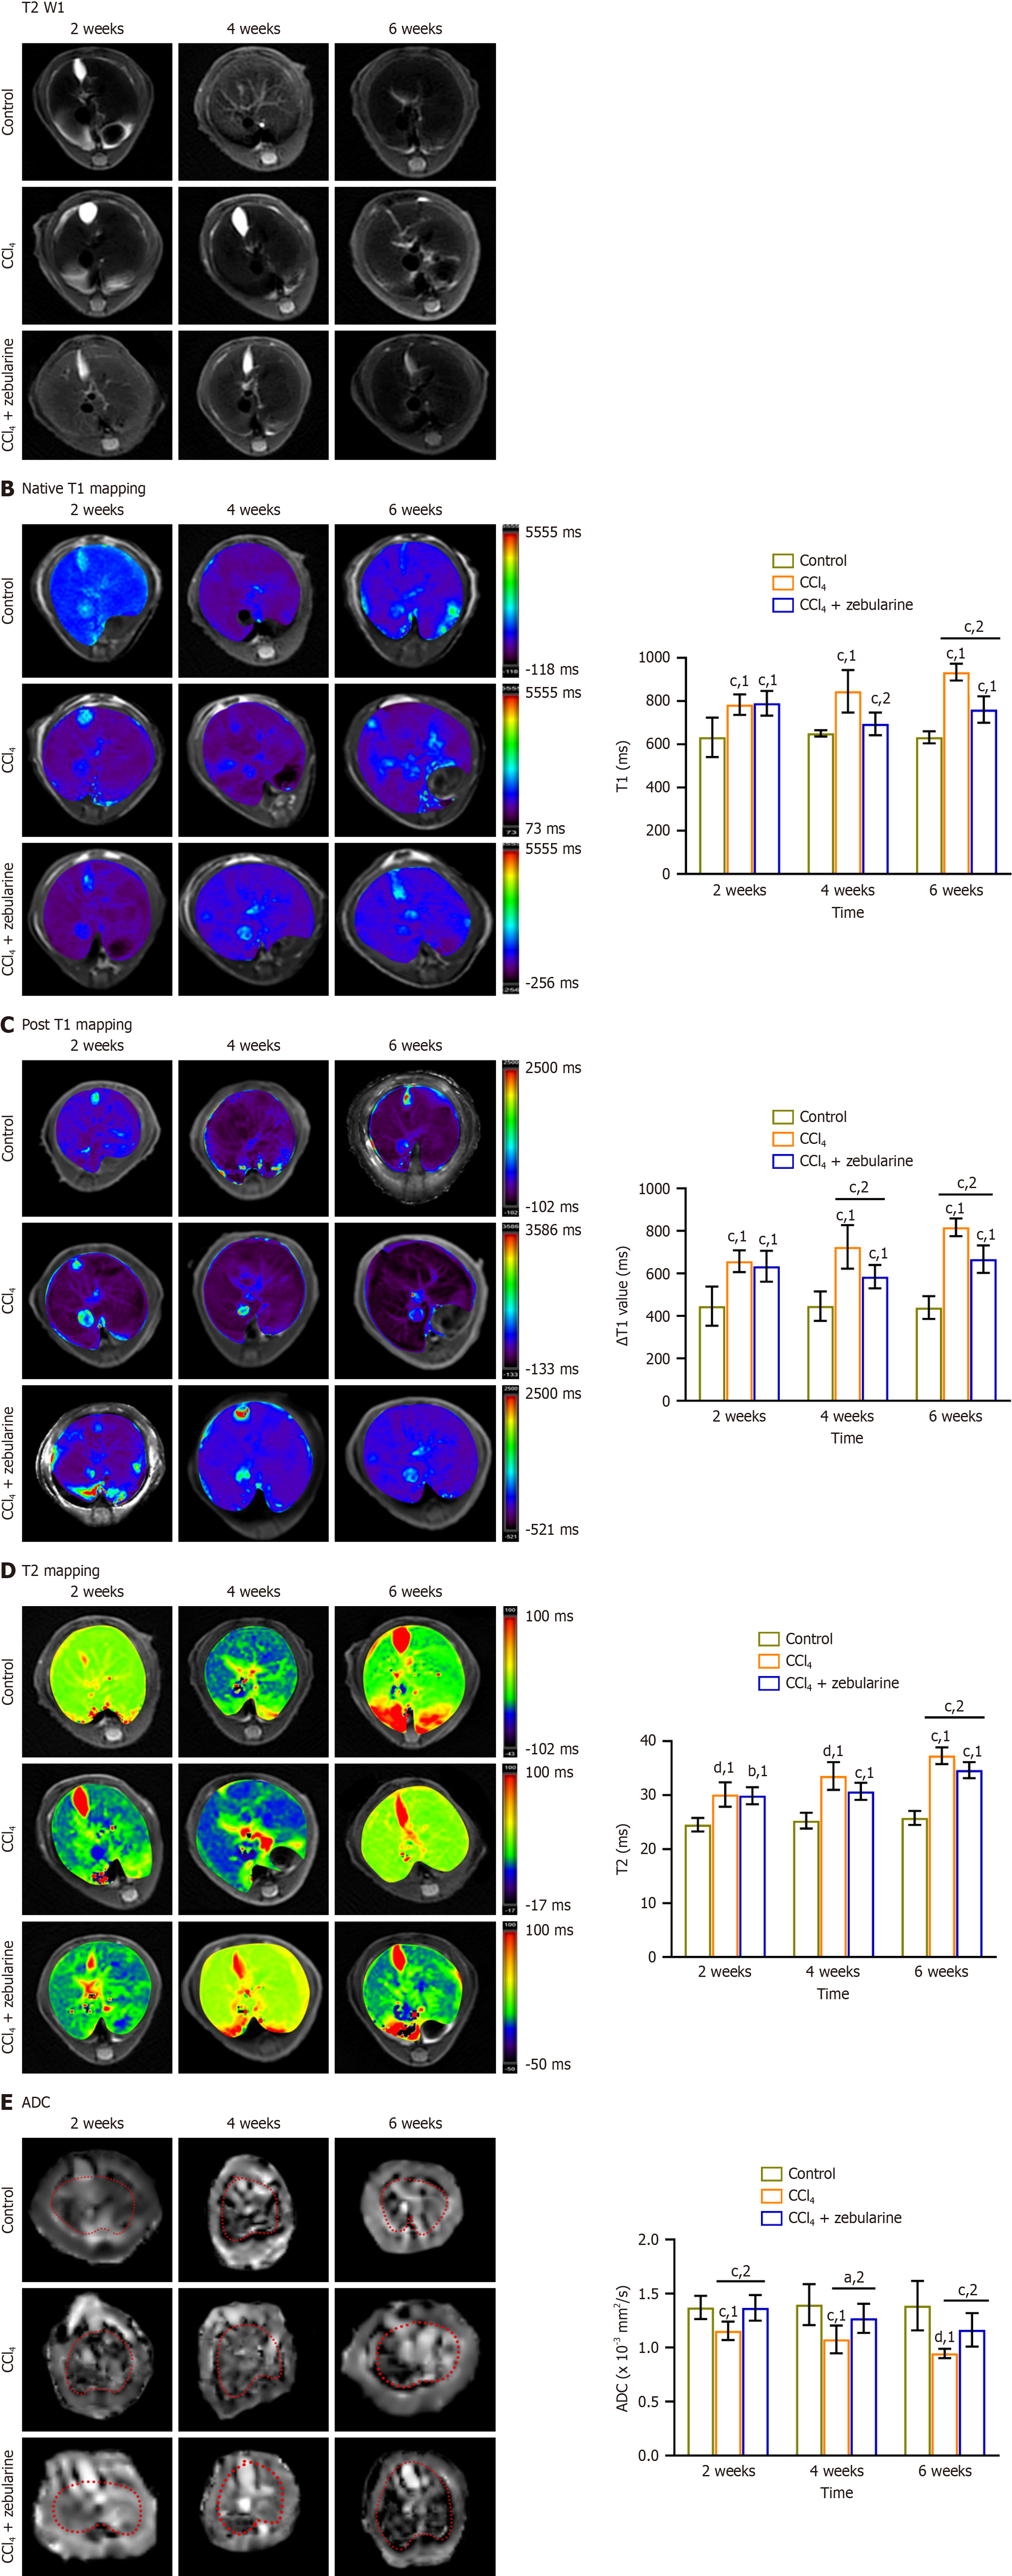
Figure 8 Changes in magnetic resonance parameters in the control, carbon tetrachloride, and carbon tetrachloride + zebularine groups.
Red dotted lines indicate the entire liver border in: A: T2-weighted images; B: Pre-contrast T1 maps; C: Post-contrast T1 maps; D: T2 maps; E: Apparent diffusion coefficient maps. aP < 0.05. bP < 0.01. cP < 0.001. dP < 0.0001. 1P vs control. 2P vs carbon tetrachloride. T2WI: T2-weighted imaging; CCl4: Carbon tetrachloride; ADC: Apparent diffusion coefficient.
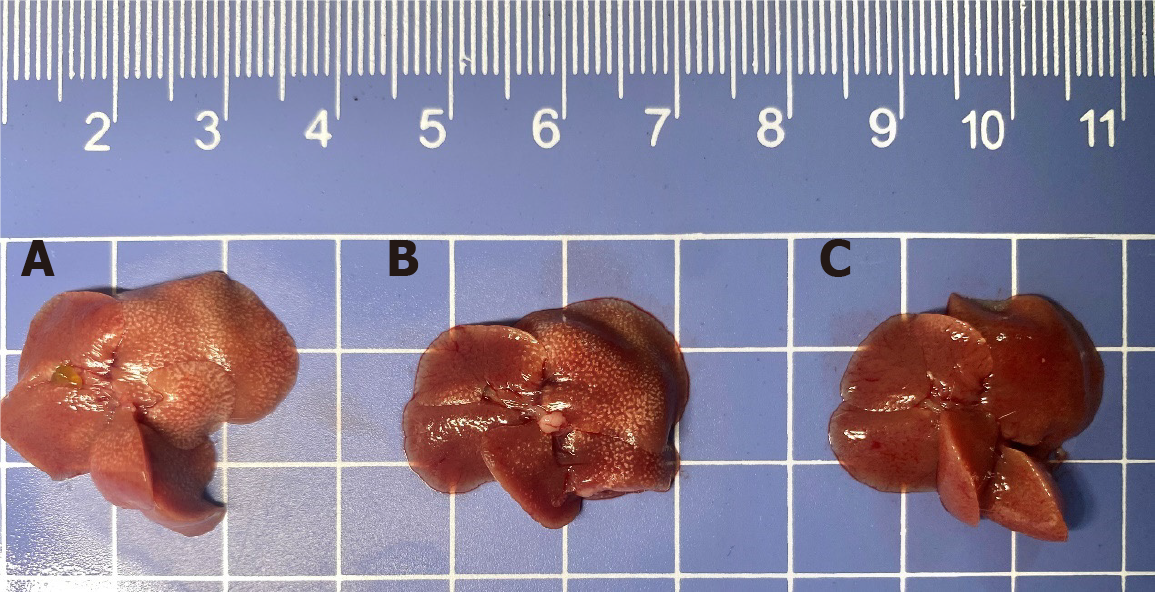
Figure 9 Representative images of mouse livers after carbon tetrachloride and zebularine treatment.
A: Carbon tetrachloride group; B: Carbon tetrachloride + zebularine group; C: Control group.
Figure 10 Changes in body weight, liver weight, and hepatosomatic index in mice treated with carbon tetrachloride and zebularine.
A: Body weight at 2, 4, and 6 weeks; B: Mouse liver mass-timed histograms for each group; C: Hepatosomatic index-timed histograms for each group (n = 12). aP < 0.05. bP < 0.01. dP < 0.0001. 1P vs control. 2P vs carbon tetrachloride. CCl4: Carbon tetrachloride.
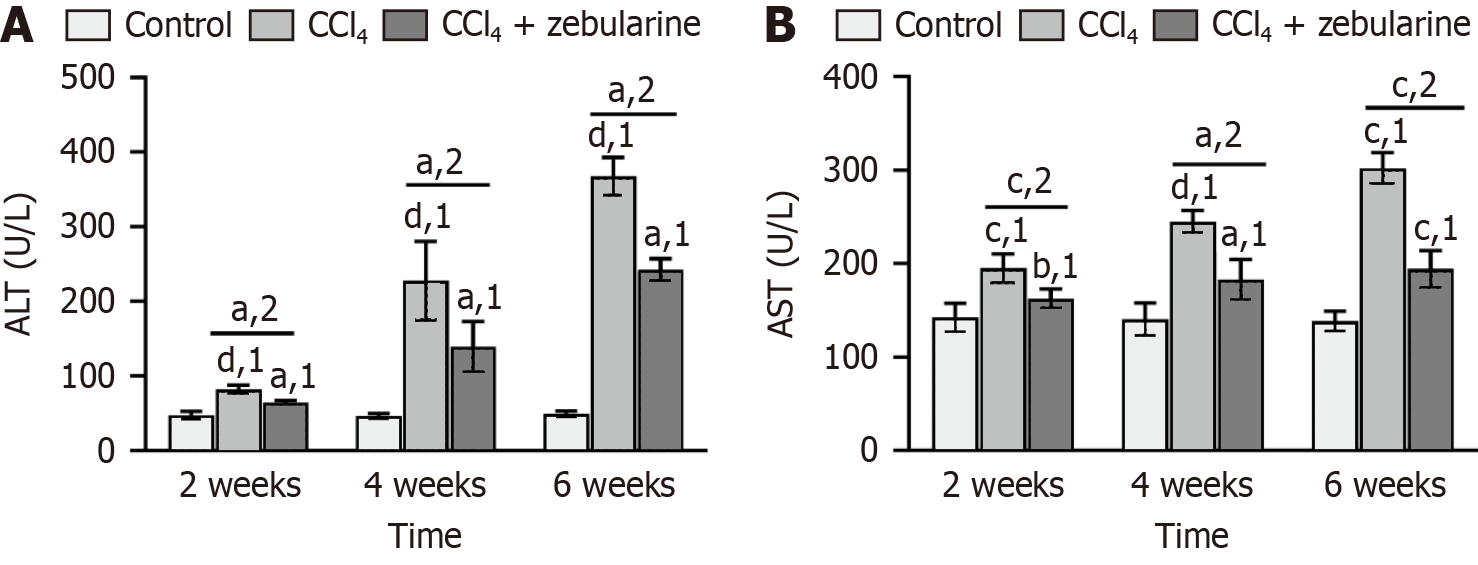
Figure 11 Effects of carbon tetrachloride and zebularine treatments on serum aspartate aminotransferase and aspartate aminotrans
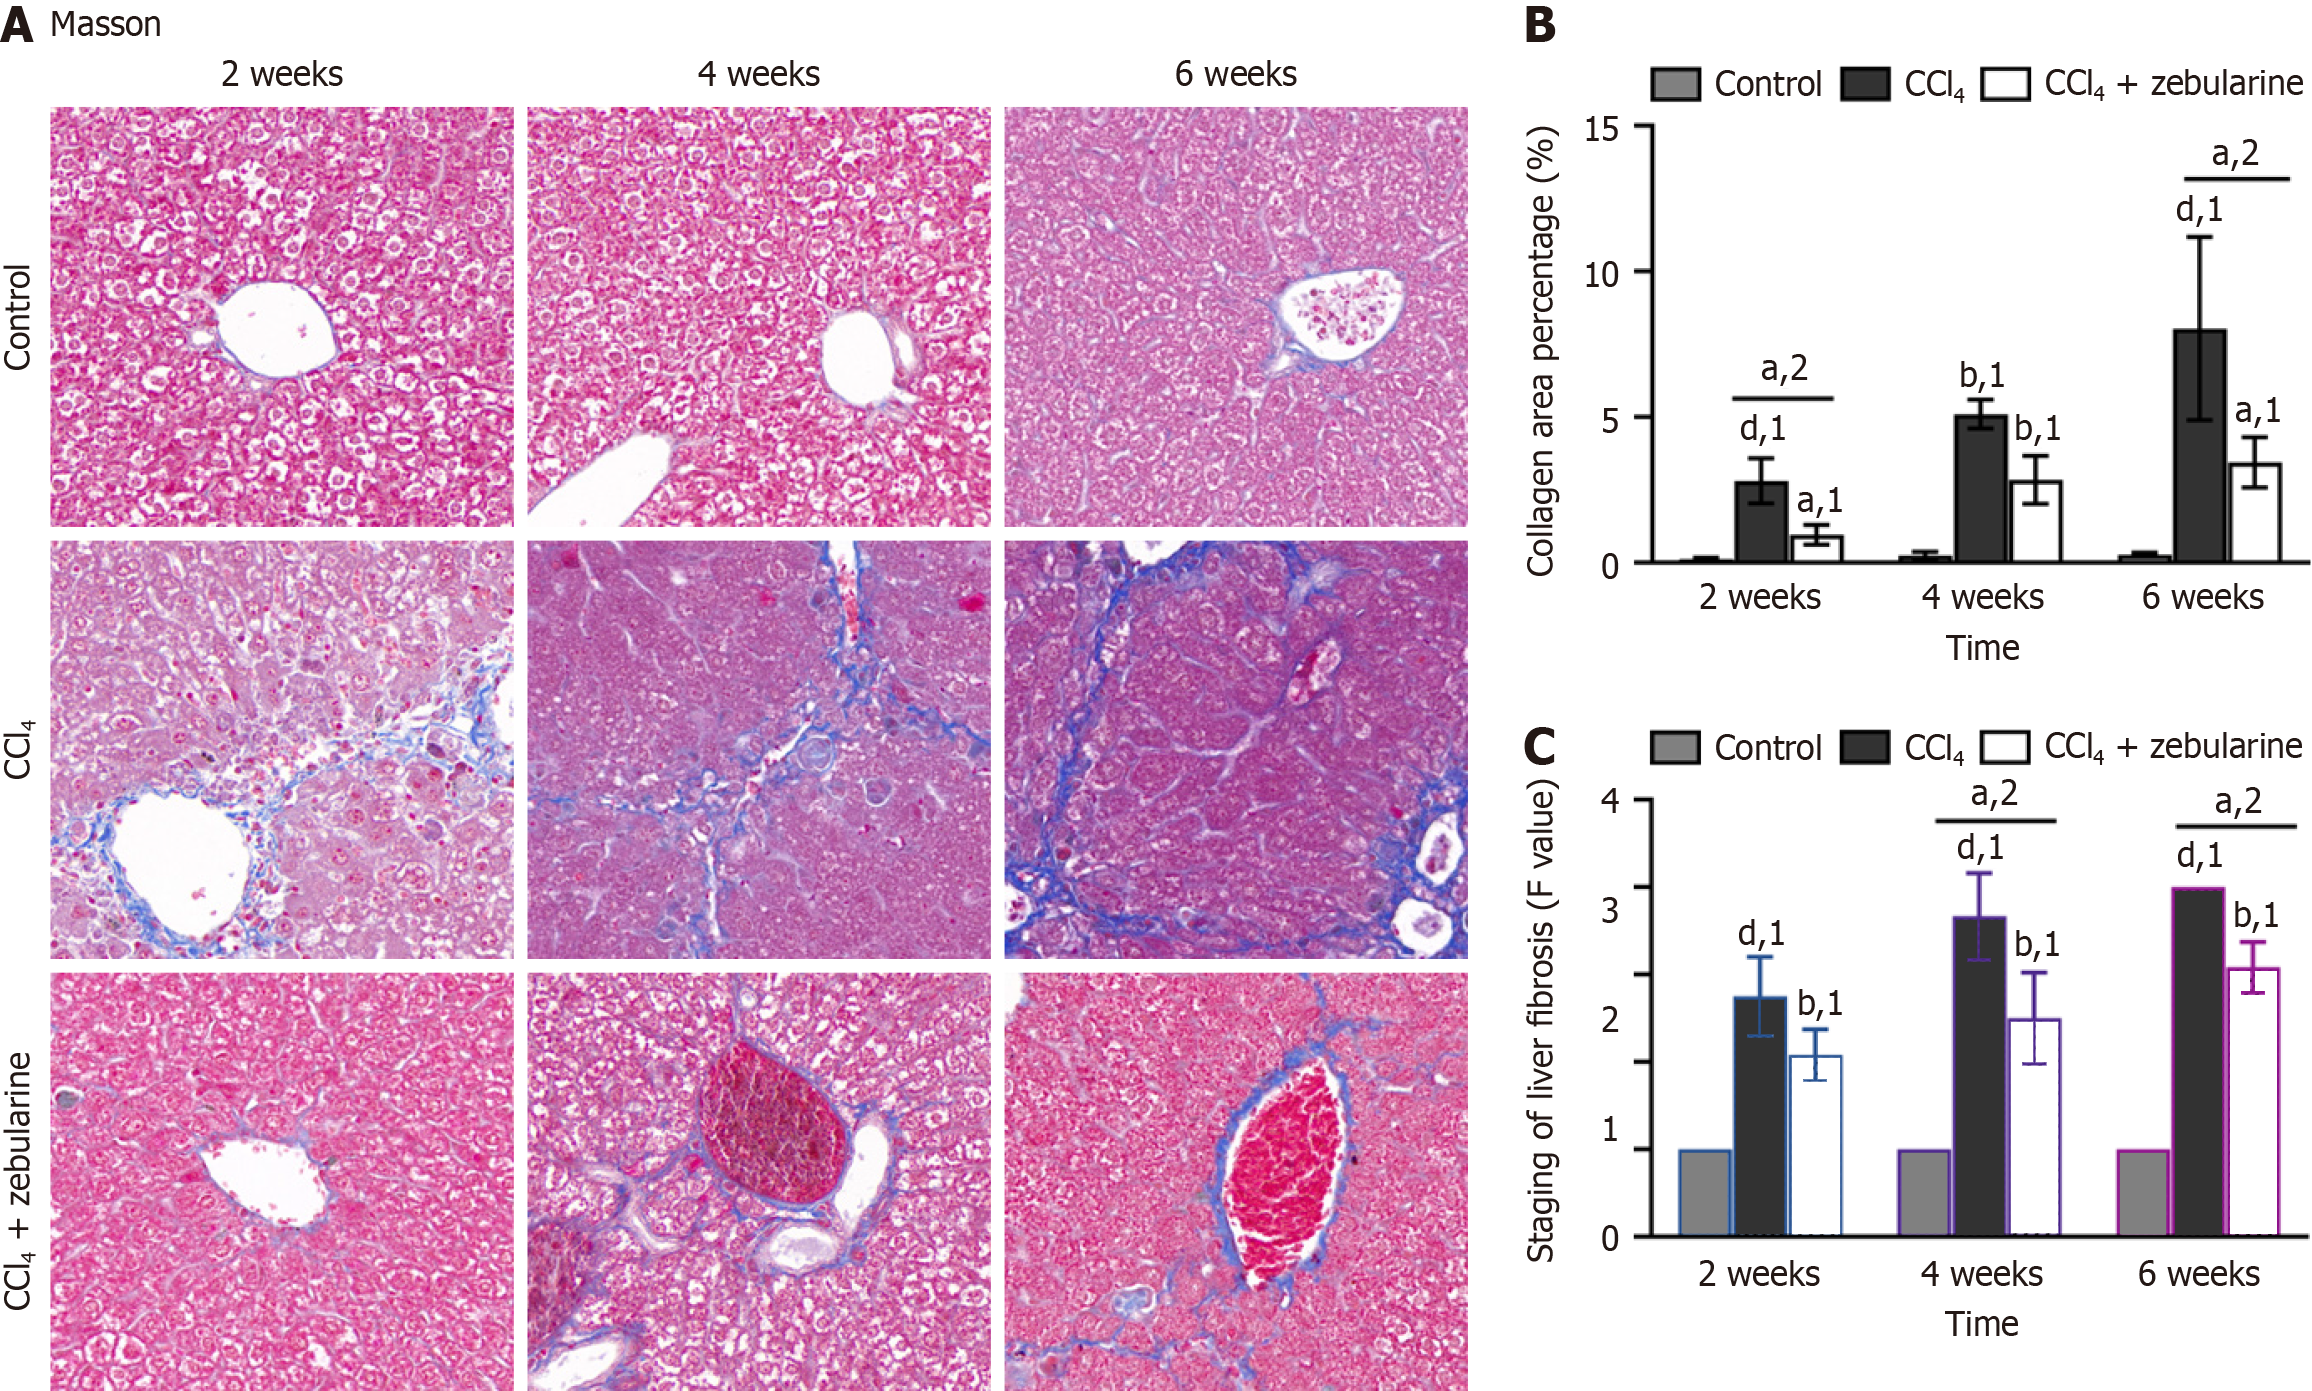
Figure 12 Masson’s staining showing the effect of carbon tetrachloride and zebularine treatment on collagen fibers in mouse liver tissue.
A: Representative images of liver sections stained with Masson’s trichrome; B: Collagen fiber percentage at 2, 4, and 6 weeks; C: METAVIR fibrosis grading at 2, 4, and 6 weeks (n = 12 mice/group). Original magnification: × 200. aP < 0.05. bP < 0.01. dP < 0.0001. 1P vs control. 2P vs carbon tetrachloride. CCl4: Carbon tetrachloride.
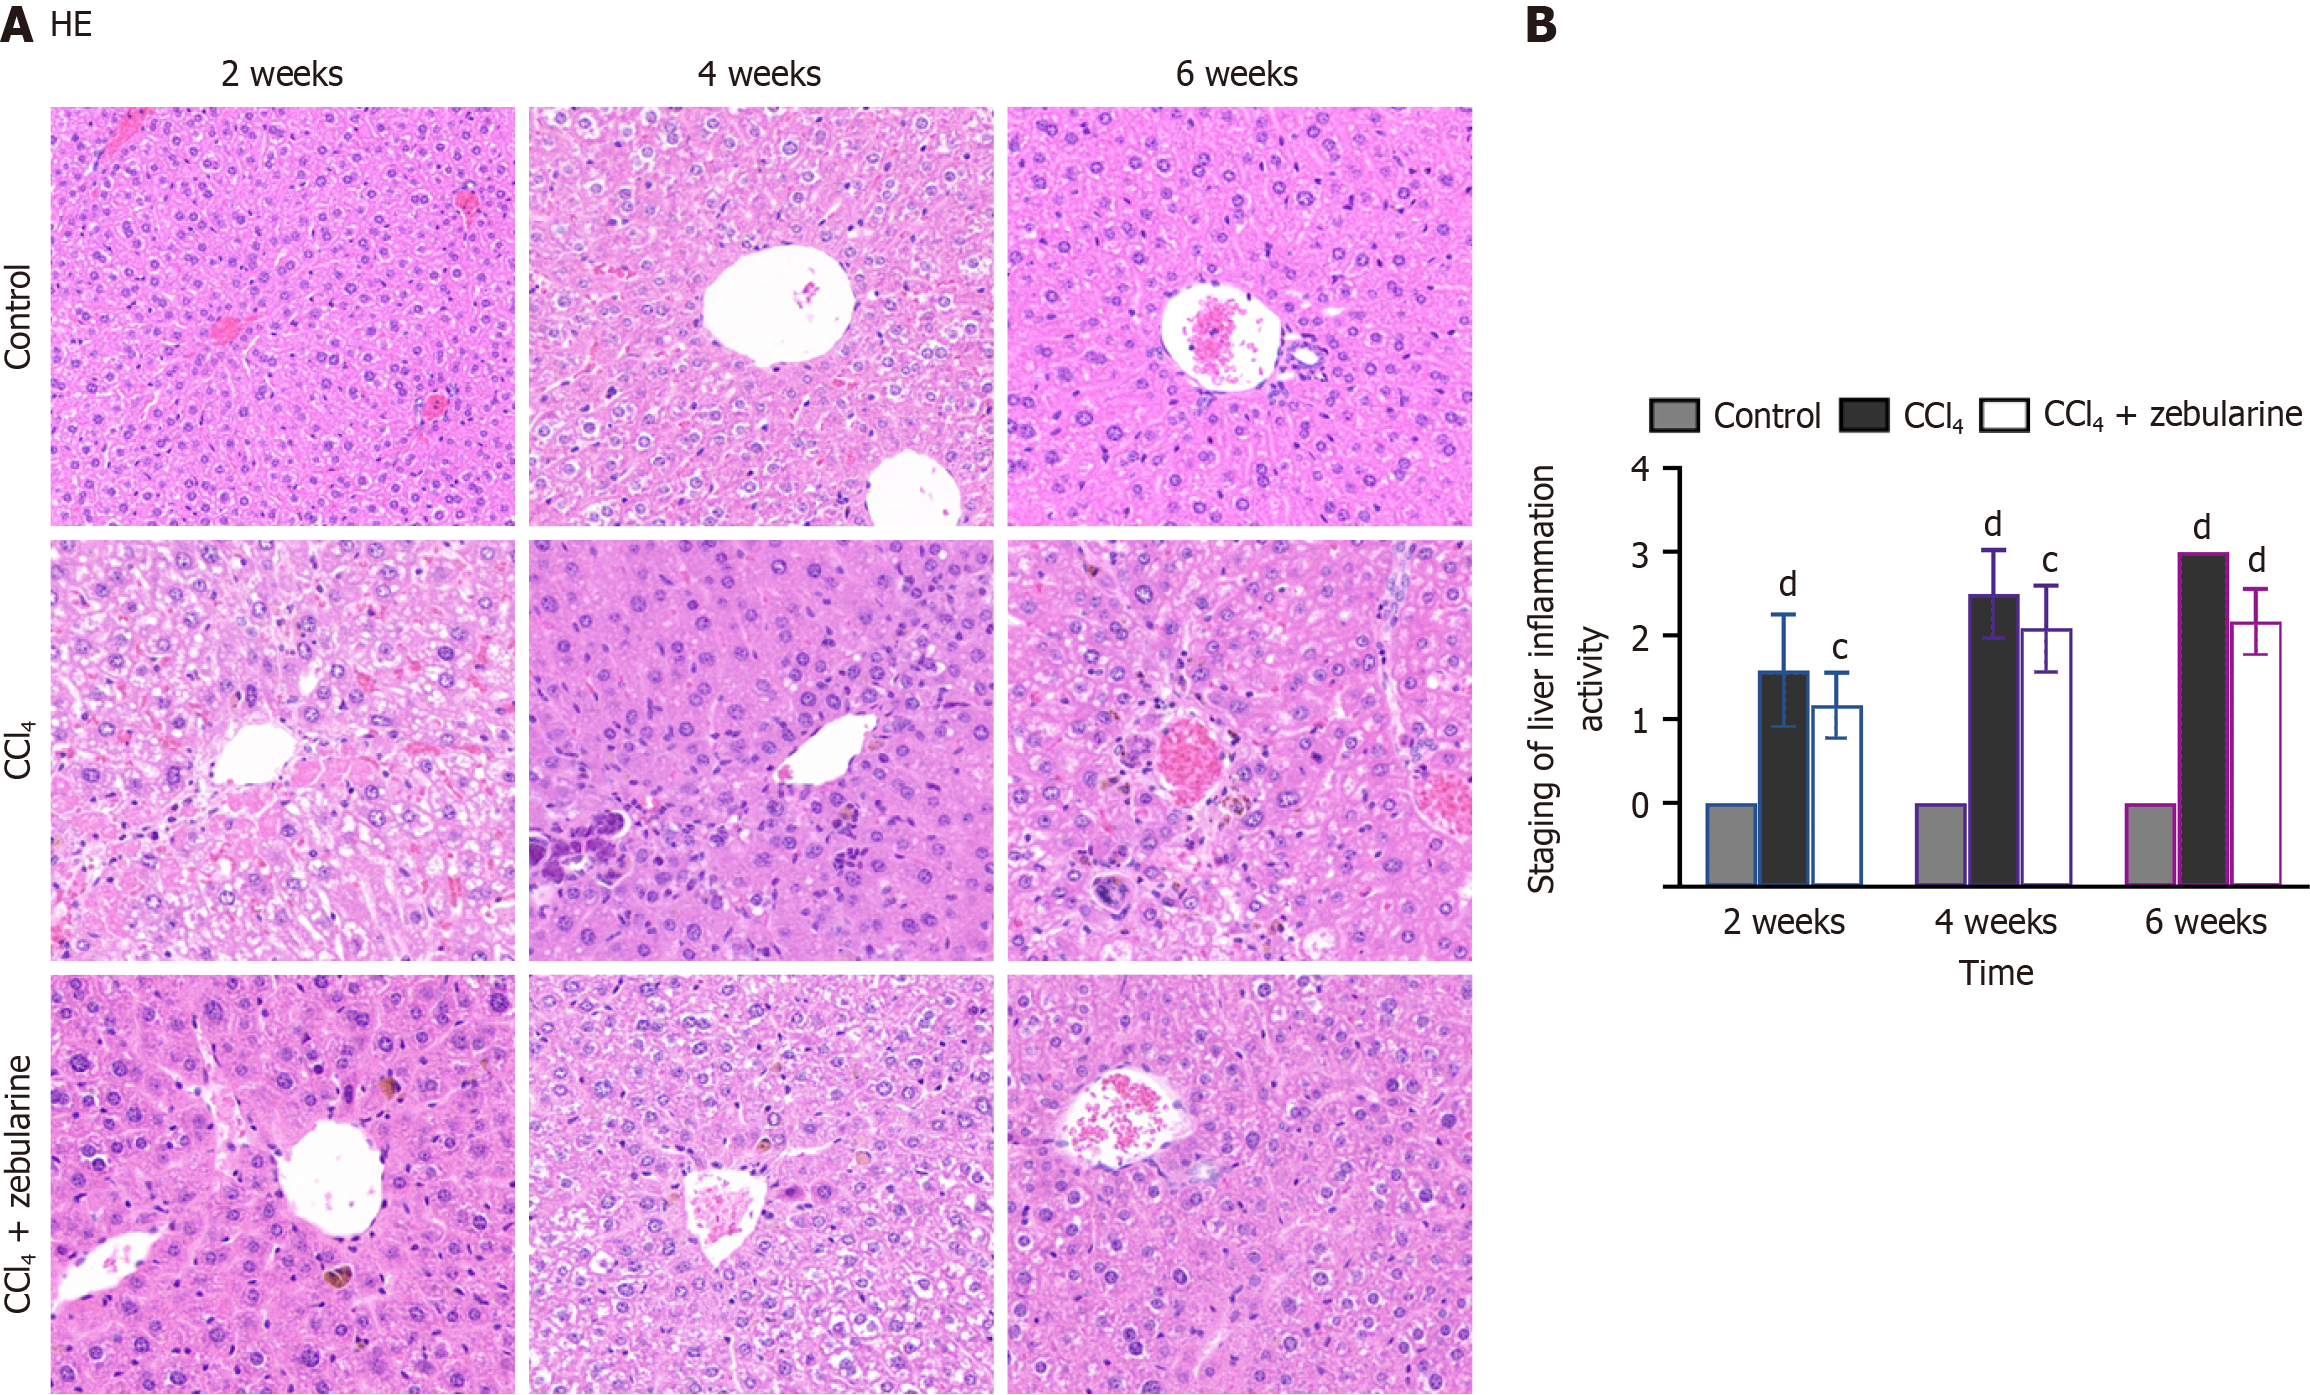
Figure 13 Hematoxylin and eosin staining showing the effect of carbon tetrachloride and zebularine on inflammation in mouse liver tissue.
A: Hematoxylin and eosin staining of liver sections from each experimental group; B: Liver inflammation grading (METAVIR) at 2, 4, and 6 weeks (n = 12 mice/group). Original magnification: × 200. cP < 0.001. dP < 0.0001. P vs control. HE: Hematoxylin and eosin; CCl4: Carbon tetrachloride.
- Citation: Lyu SY, Xiao W, Chen YJ, Liao QL, Cai YY, Yu C, Liu JY, Liu H, Zhang MP, Ren YL, Yu QL, Qi YM, Xiao EH, Luo YH. Multi-parameter magnetic resonance imaging of zebularine in liver fibrosis treatment and calcineurin/NFAT3 mechanism. World J Gastroenterol 2025; 31(20): 105554
- URL: https://www.wjgnet.com/1007-9327/full/v31/i20/105554.htm
- DOI: https://dx.doi.org/10.3748/wjg.v31.i20.105554


