Copyright
©The Author(s) 2025.
World J Gastroenterol. Jan 14, 2025; 31(2): 99082
Published online Jan 14, 2025. doi: 10.3748/wjg.v31.i2.99082
Published online Jan 14, 2025. doi: 10.3748/wjg.v31.i2.99082
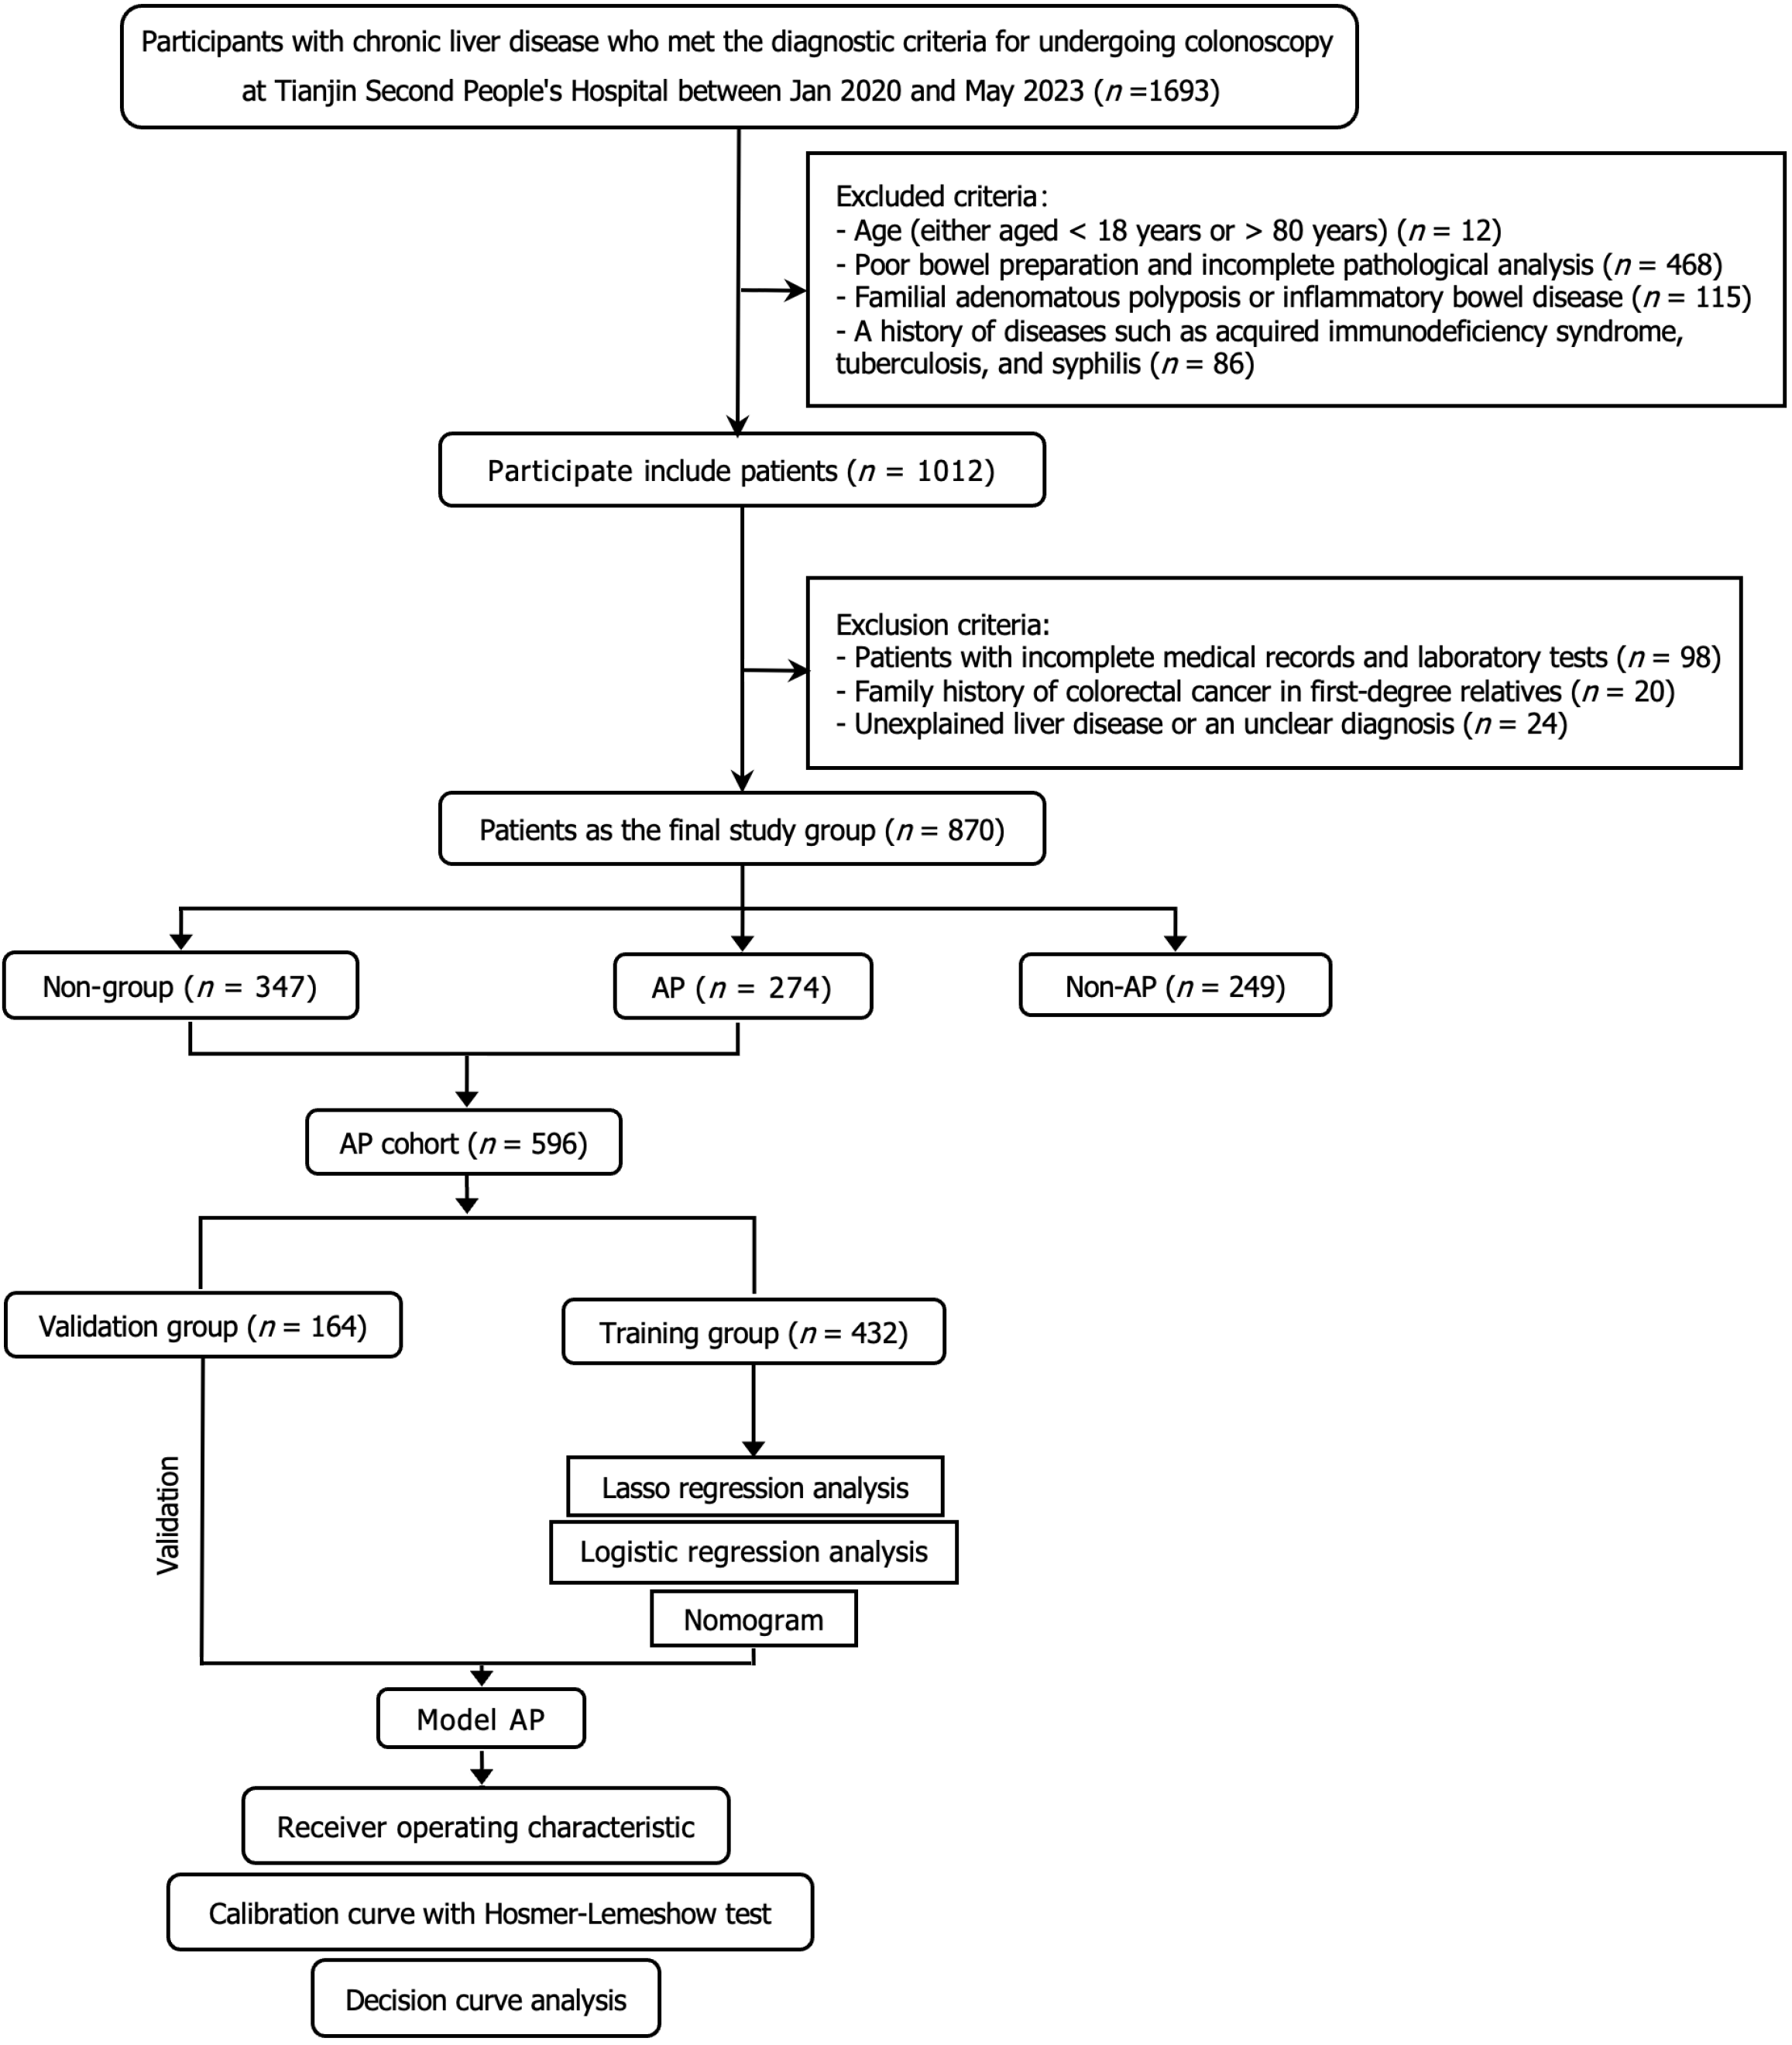
Figure 1 Flowchart of this study.
AP: Adenomatous polyps.
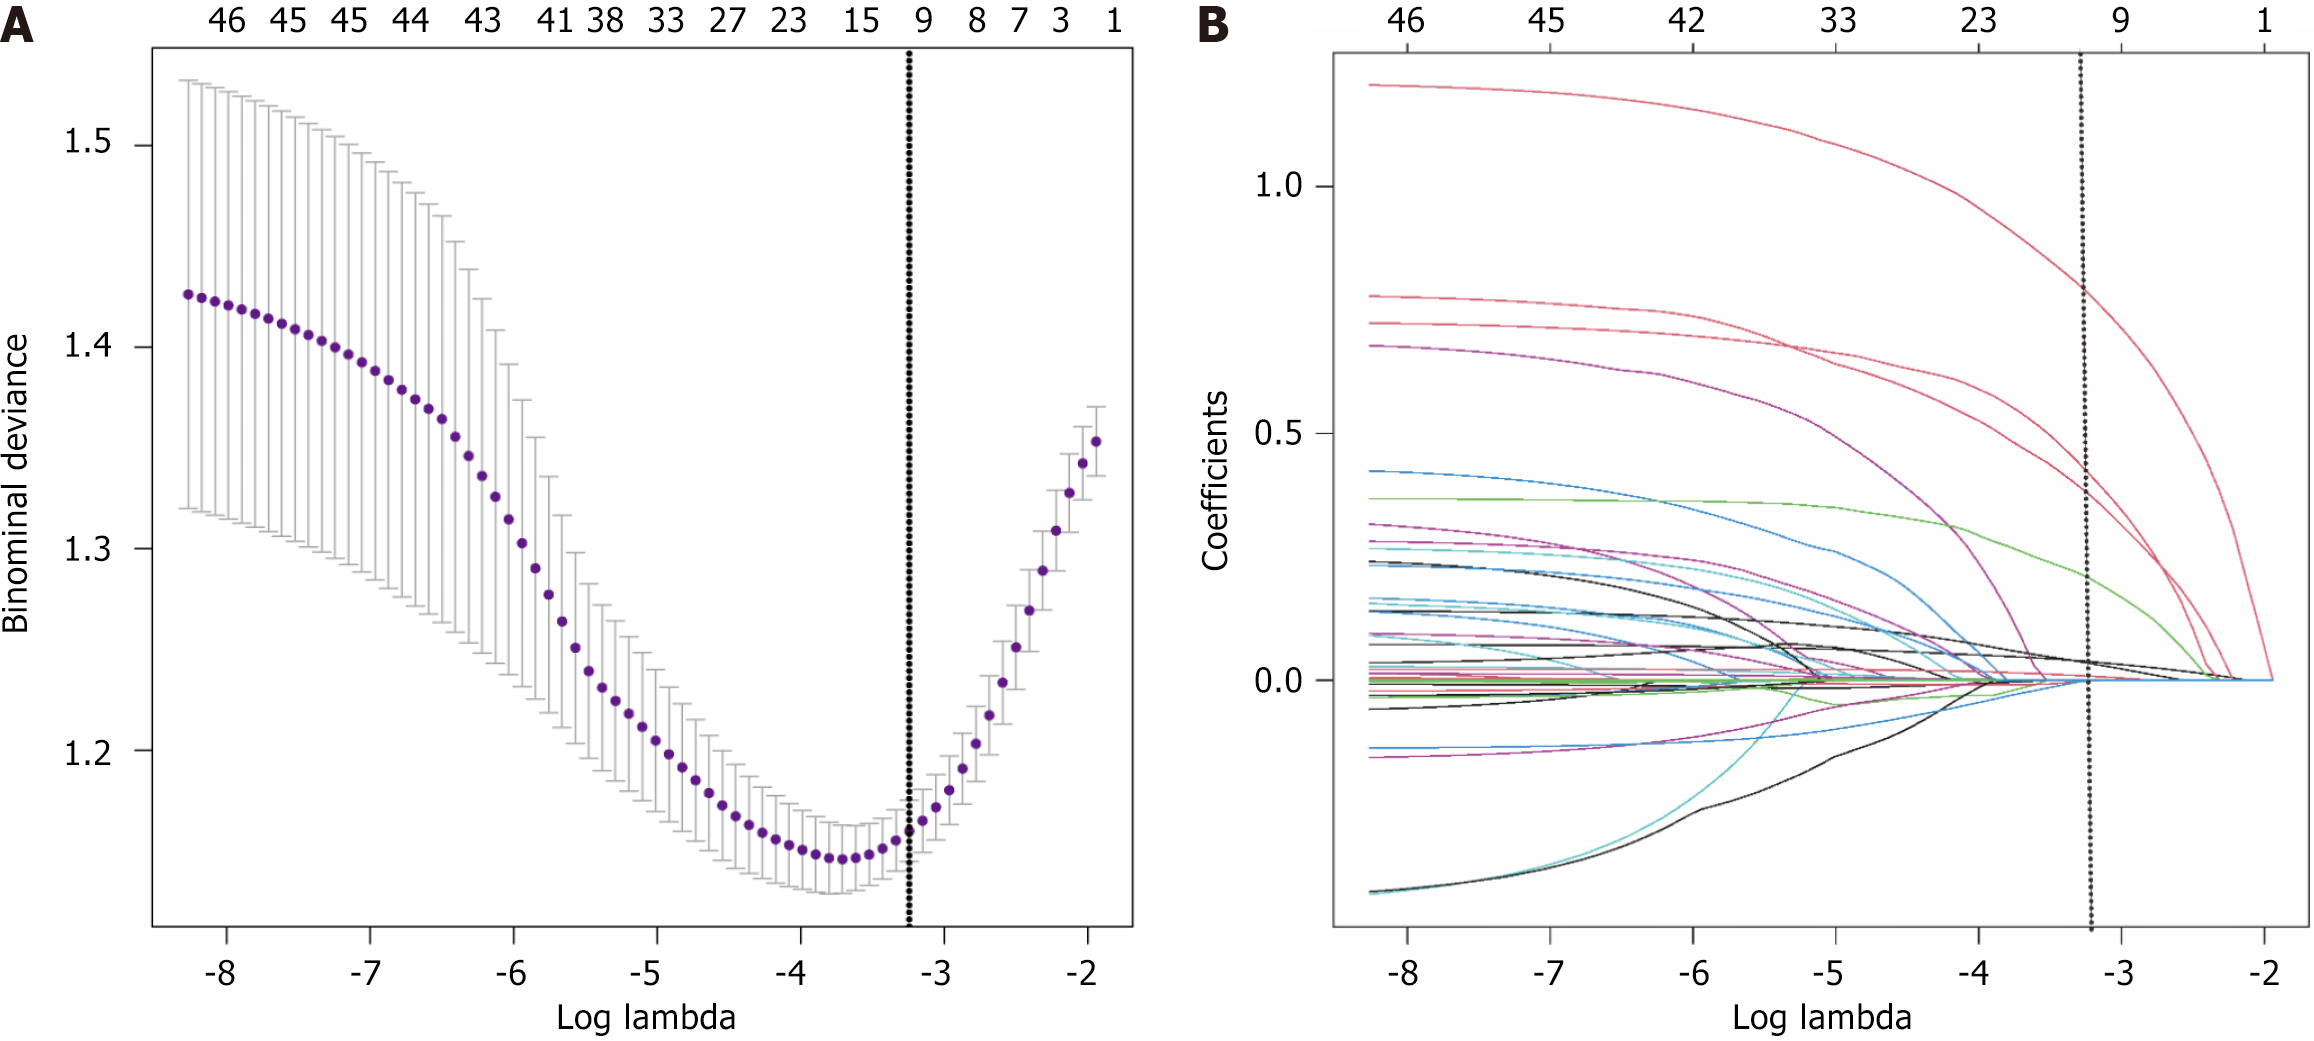
Figure 2 Least absolute shrinkage and selection operator regression analysis identified potential predictive factors.
A: The least absolute shrinkage and selection operator model was optimized by selecting parameters based on the criteria method, which added one standard error to the minimum error. This process utilized five-fold cross-validation, resulting in λ = 0.03902279 and log(λ) = -3.241, satisfying the one standard error criteria for a simpler and more regularized model; B: The regression coefficients varied as λ increased, smaller λ values were associated with larger coefficients for most features, while larger λ values resulted in coefficients being reduced towards zero or reaching zero, a total of nine variables with non-zero coefficients were identified.
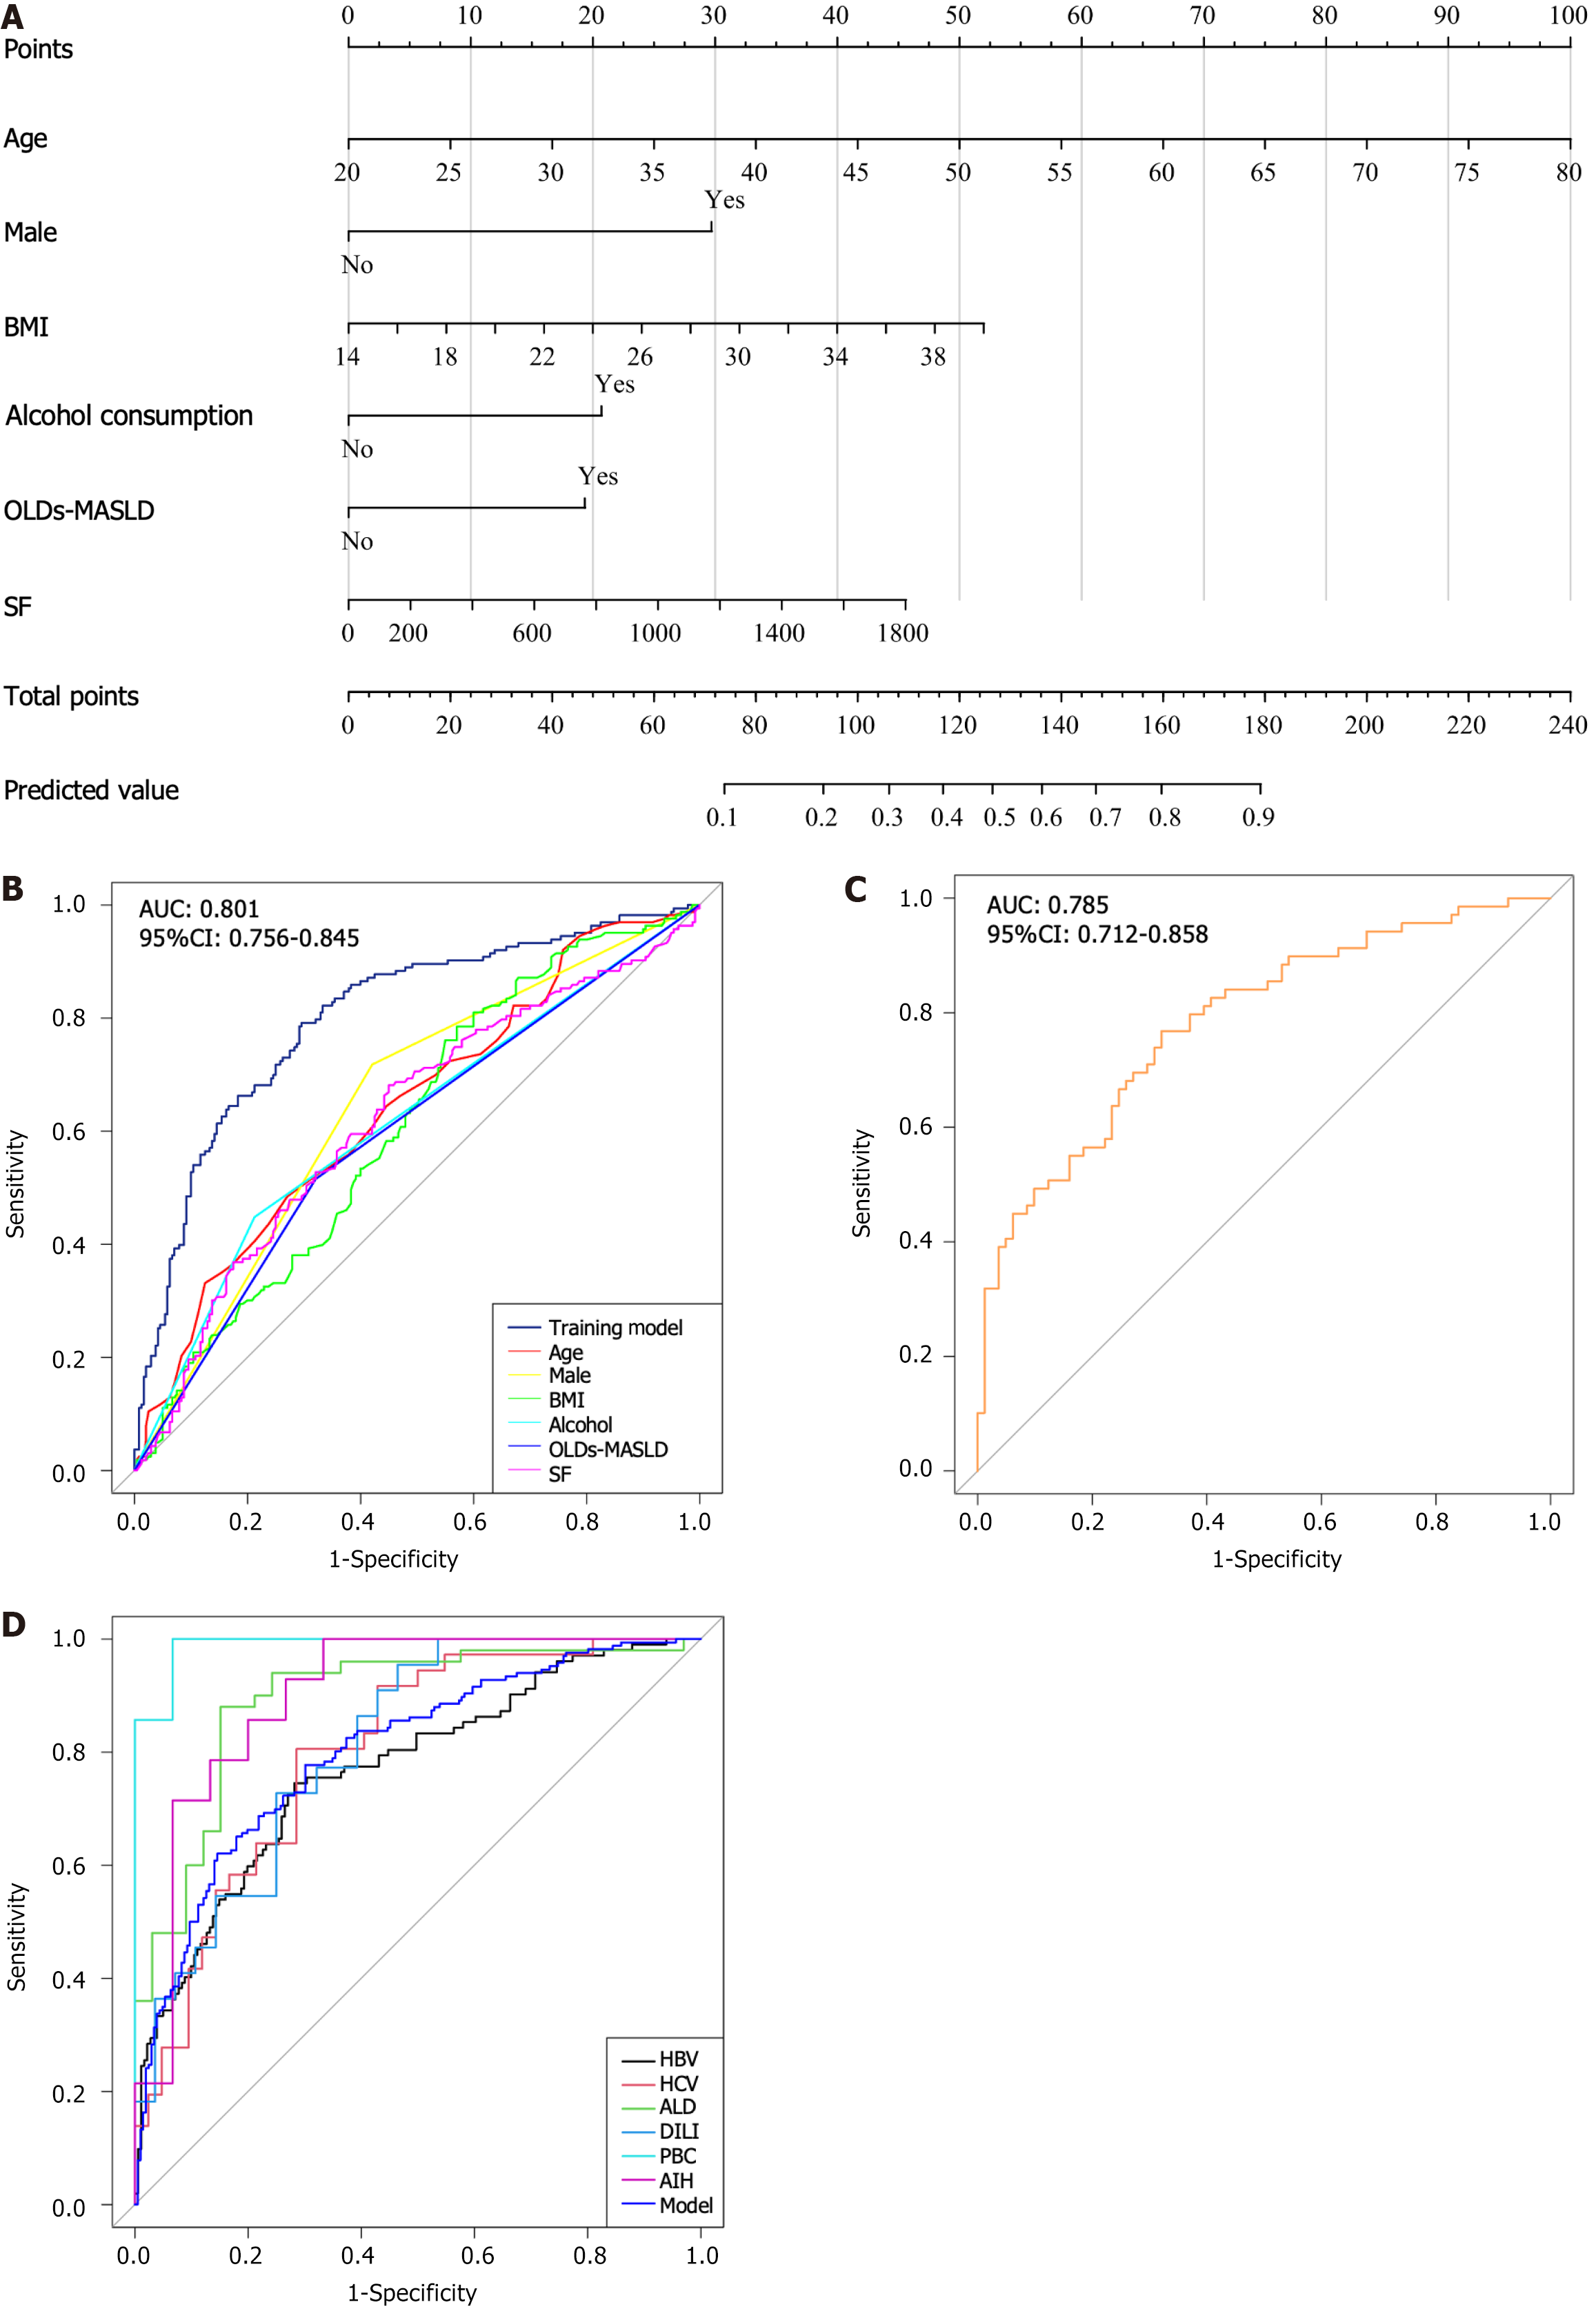
Figure 3 Nomogram and performance metrics for predicting the risk of adenomatous polyps.
A: Nomogram; B: In the training group, the area under curve (AUC) was 0.801 (95% confidence interval: 0.756-0.854). The impact on AUC from age, gender, body mass index, alcohol consumption, serum ferritin, and overlapping metabolic dysfunction-associated steatotic liver disease was 0.64, 0.65, 0.61, 0.62, 0.62, and 0.60, respectively; C: In the validation group, the AUC was 0.785 (95% confidence interval: 0.712-0.858); D: Internal validation among chronic liver disease patients yielded the following AUCs: Hepatitis B virus: 0.769, hepatitis C virus: 0.800, alcoholic liver disease: 0.892, drug-induced liver injury: 0.812, primary biliary cholangitis: 0.970, autoimmune hepatitis: 0.900. BMI: Body mass index; OLDs-MASLD: Other liver diseases overlapping metabolic dysfunction associated steatotic liver disease; SF: Serum ferritin; AUC: Area under curve; CI: Confidence interval; HBV: Hepatitis B virus; HCV: Hepatitis C virus; ALD: Alcoholic liver disease; DILI: Drug-induced liver injury; PBC: Primary biliary cholangitis; AIH: Autoimmune hepatitis.
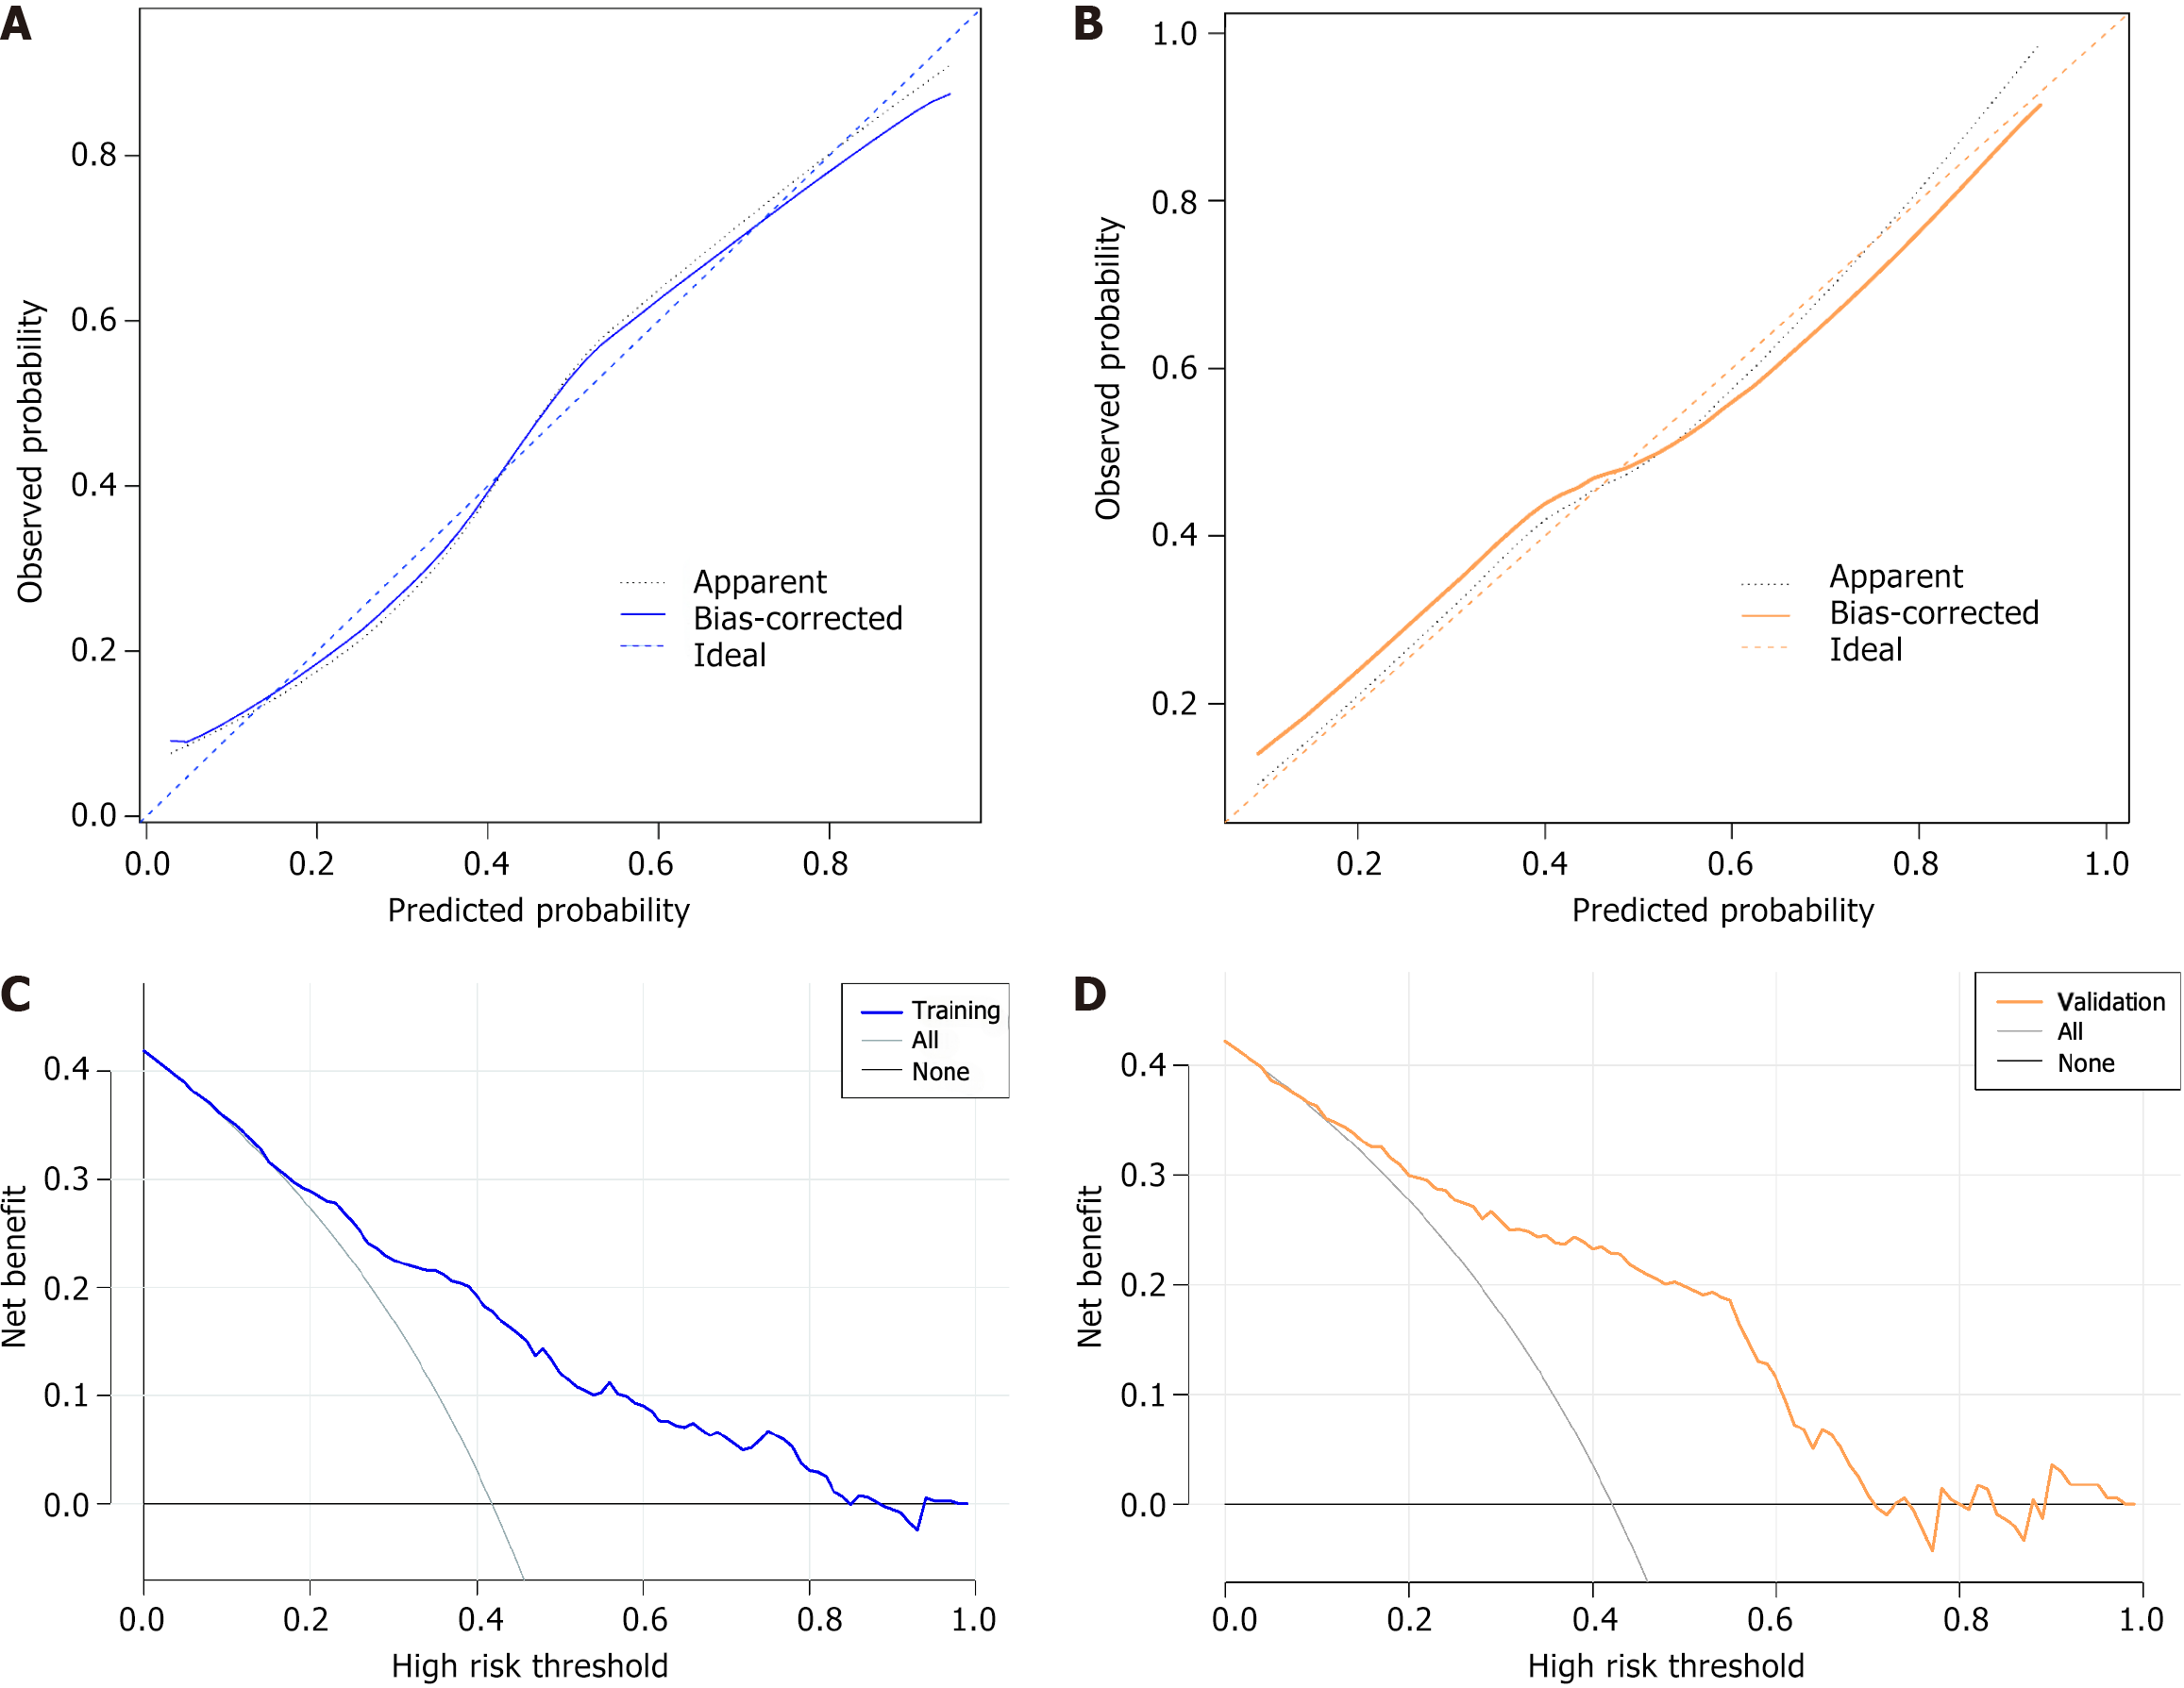
Figure 4 Calibration and decision curve analysis for predicting adenomatous polyps.
A: The training group (χ2 = 11.860, P = 0.157); B: The validation group (χ2 = 7.055, P = 0.530); C and D: Decision curve analysis for the adenomatous polyps (AP) nomogram, blue line and orange line corresponds to the risk nomogram results for the training group and validation group, respectively. Black line: The assumption of no patient having AP; gray line: Assumes that all patients experienced AP.
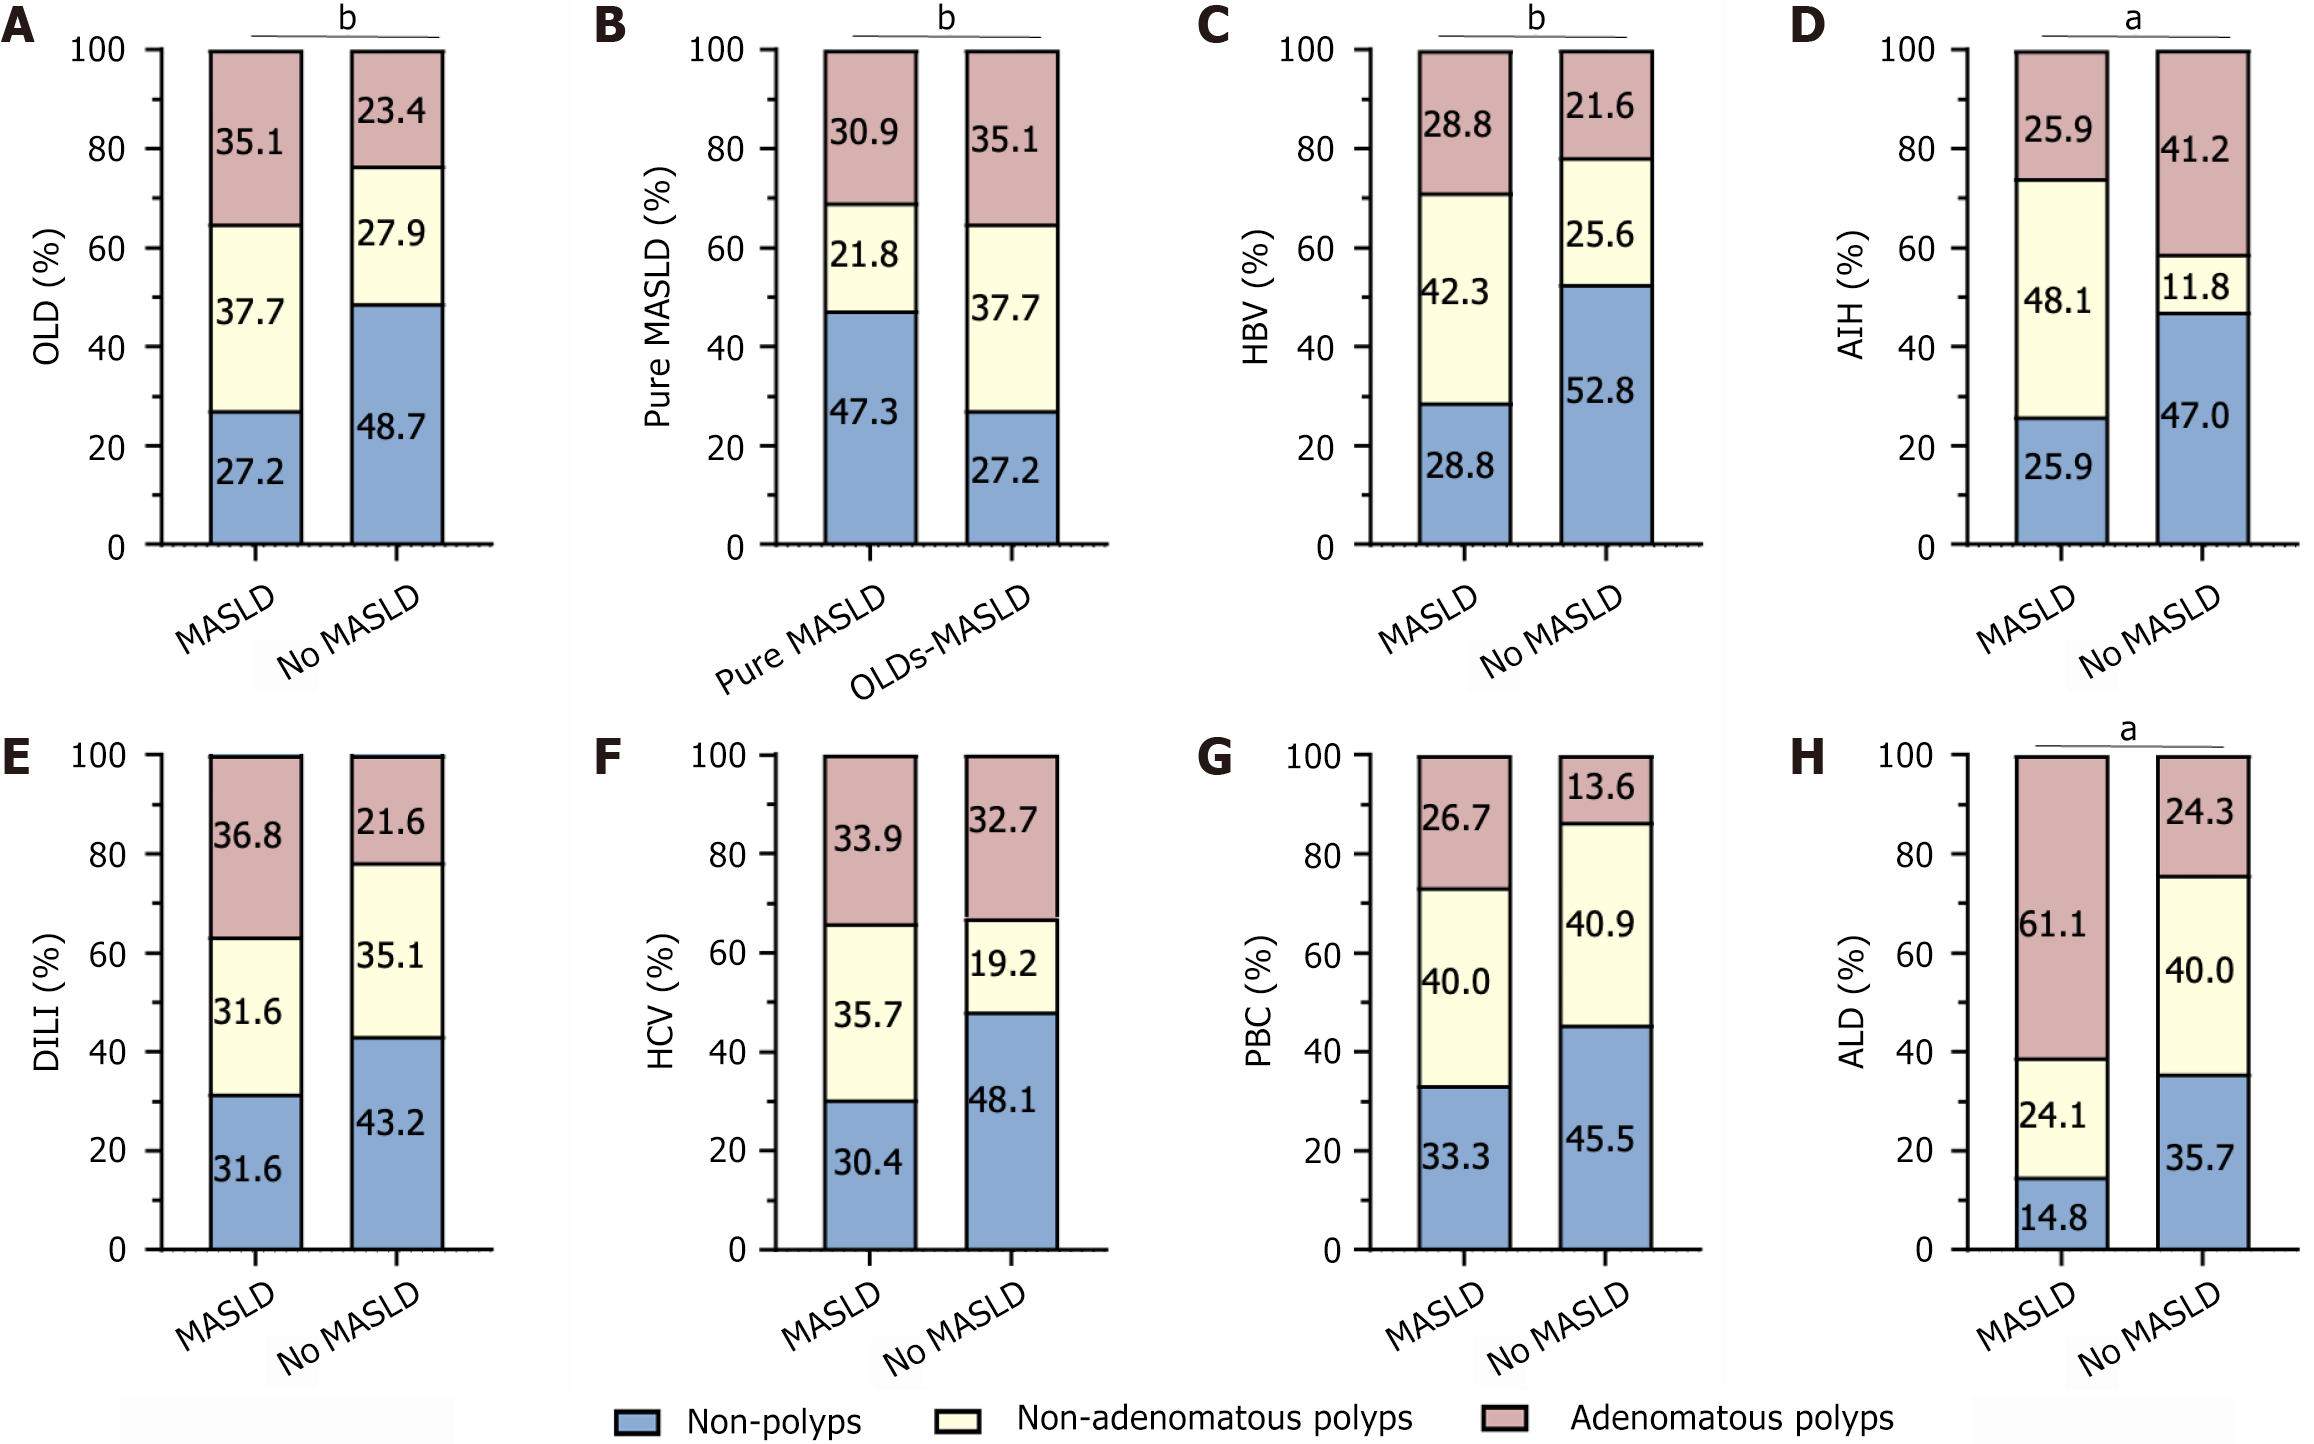
Figure 5 Percentage of chronic liver disease etiology combined with metabolic dysfunction-associated steatotic liver disease and no metabolic dysfunction-associated steatotic liver disease.
A: Other liver diseases; B: Pure metabolic dysfunction-associated steatotic liver disease; C: Hepatitis B virus; D: Autoimmune hepatitis; E: Drug-induced liver injury; F: Hepatitis C virus; G: Primary biliary cholangitis; H: Alcoholic liver disease. aP < 0.05; bP < 0.01. OLD: Other liver diseases; MASLD: Metabolic dysfunction-associated steatotic liver disease; HBV: Hepatitis B virus; AIH: Autoimmune hepatitis; DILI: Drug-induced liver injury; HCV: Hepatitis C virus; PBC: Primary biliary cholangitis; ALD: Alcoholic liver disease.
- Citation: Li YQ, Kuai WT, Chen L, Zeng MH, Tao XM, Han JX, Wang YK, Xu LX, Ge LY, Liu YG, Li S, Xu L, Mi YQ. Predicting colorectal adenomatous polyps in patients with chronic liver disease: A novel nomogram. World J Gastroenterol 2025; 31(2): 99082
- URL: https://www.wjgnet.com/1007-9327/full/v31/i2/99082.htm
- DOI: https://dx.doi.org/10.3748/wjg.v31.i2.99082


