Copyright
©The Author(s) 2025.
World J Gastroenterol. Jan 14, 2025; 31(2): 101292
Published online Jan 14, 2025. doi: 10.3748/wjg.v31.i2.101292
Published online Jan 14, 2025. doi: 10.3748/wjg.v31.i2.101292
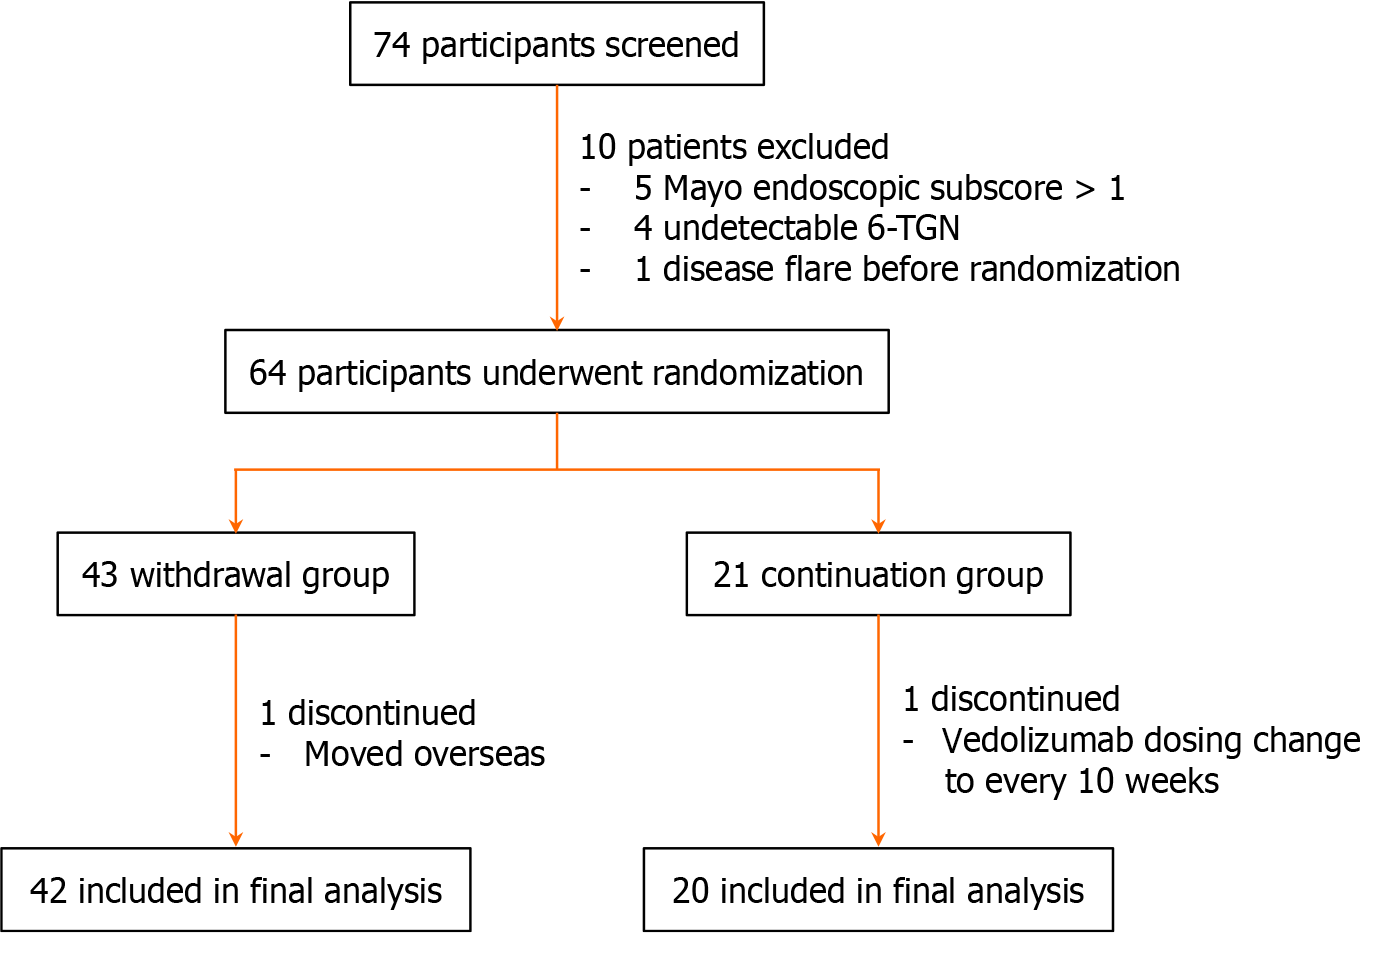
Figure 1 Study enrollment process.
TGN: Thioguanine nucleotides.
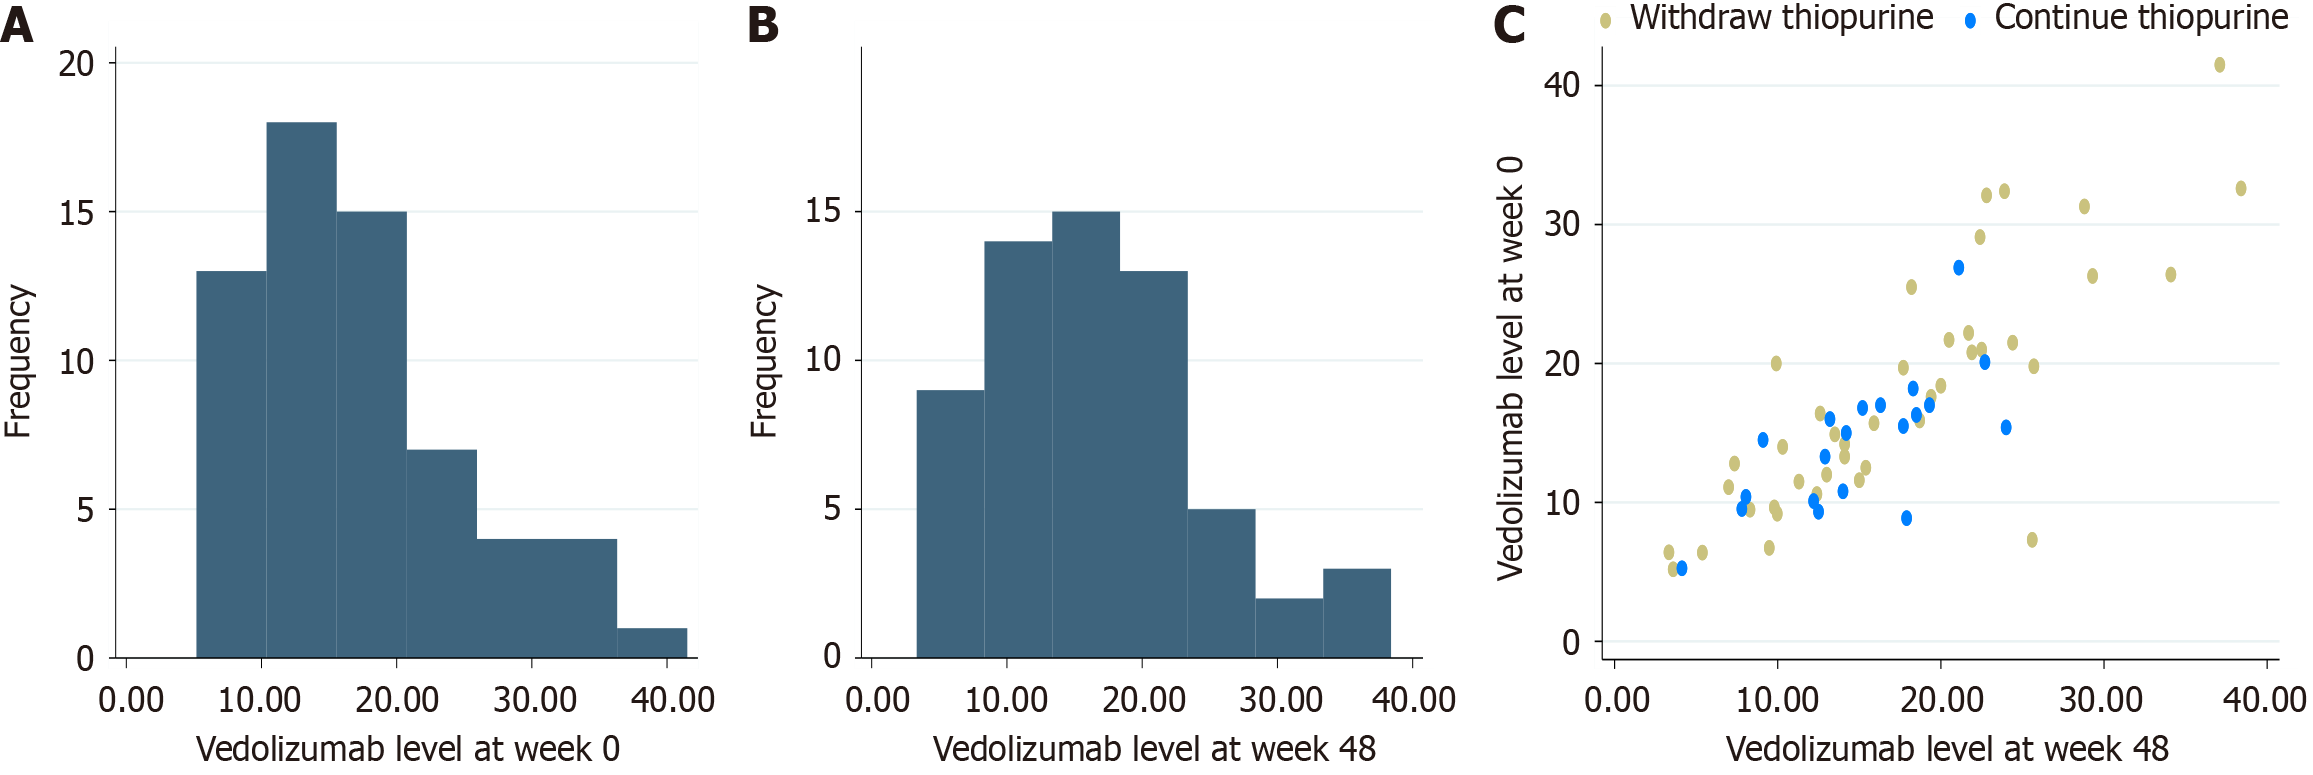
Figure 2 Histograms demonstrates the distribution of vedolizumab serum trough concentrations.
A: At week 0; B: At week 48; C: Scatter plot illustrates the relationship between vedolizumab serum trough concentrations at week 0 and week 48, categorized by thiopurine use.
Figure 3 Association of vedolizumab serum trough concentrations (µg/mL) with clinical remission.
A: Concentration at week 0 vs clinical remission at week 48; B: Concentration at week 48 vs clinical remission at week 48; C: Concentration at week 48 vs clinical remission at 2 years.
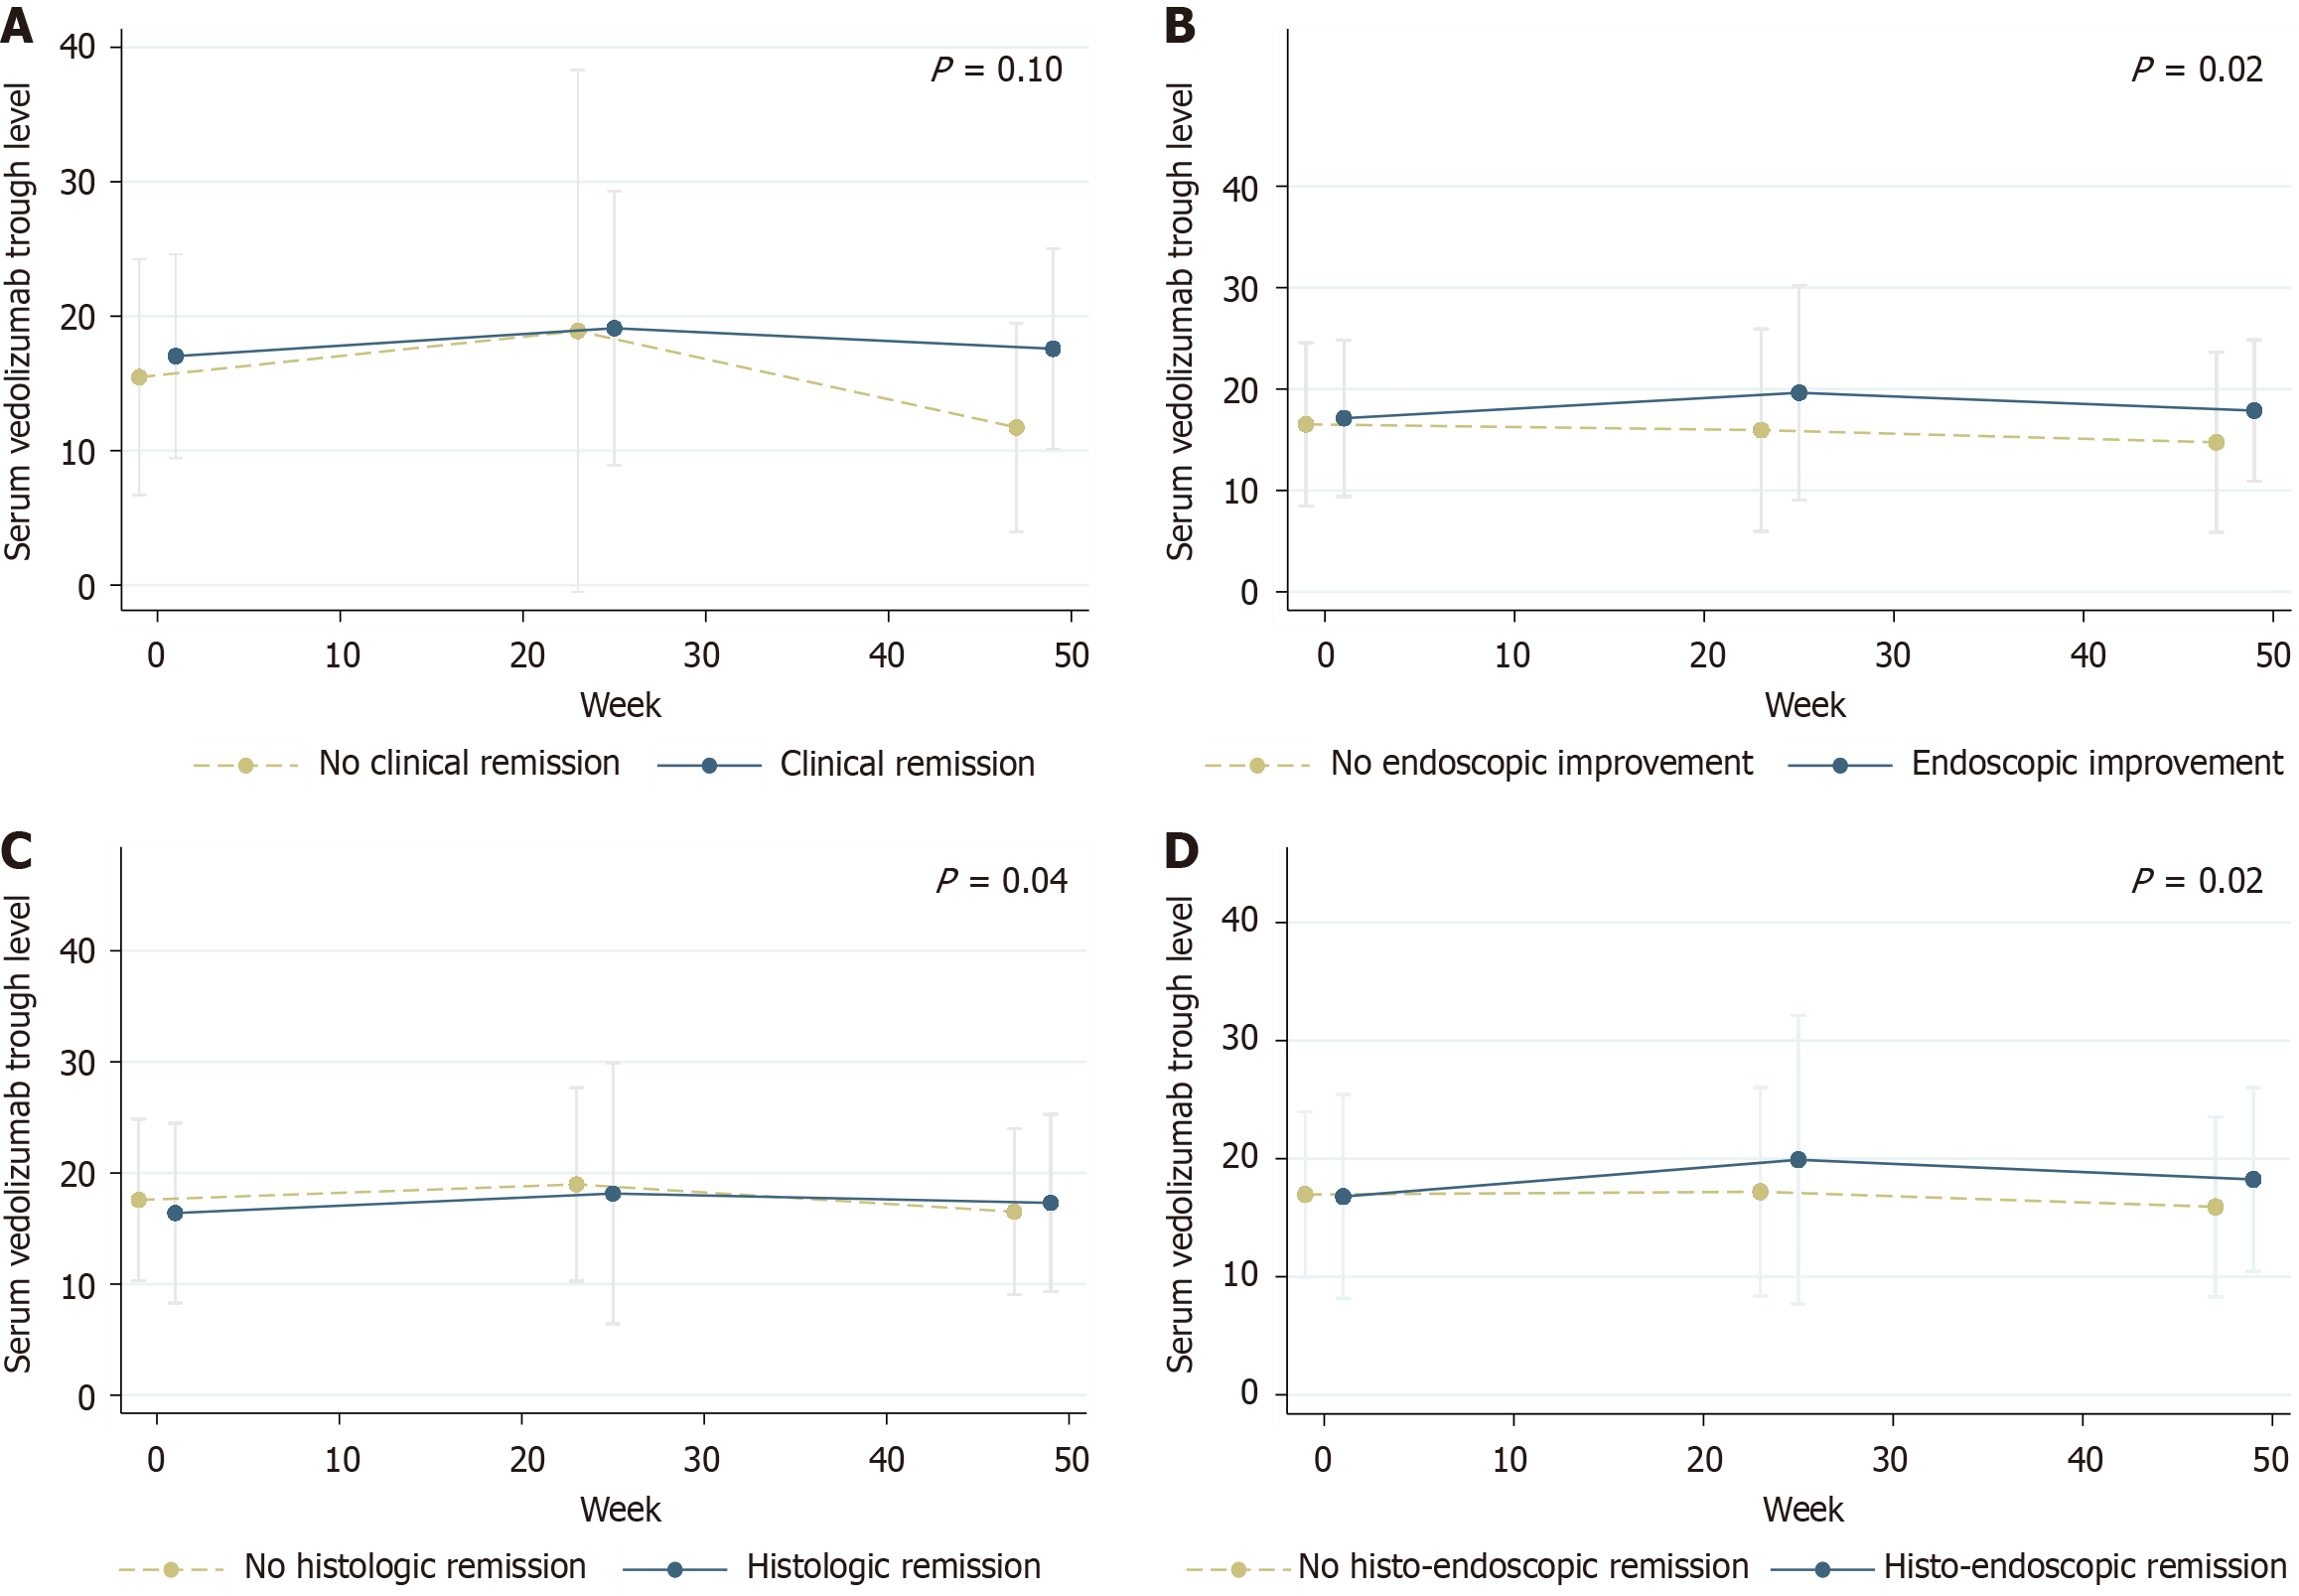
Figure 4 Longitudinal association between vedolizumab serum trough concentrations at 3 distinct time points.
A: Clinical; B: Endoscopy; C: Histology; D: Histo-endoscopic outcomes over 48 weeks.
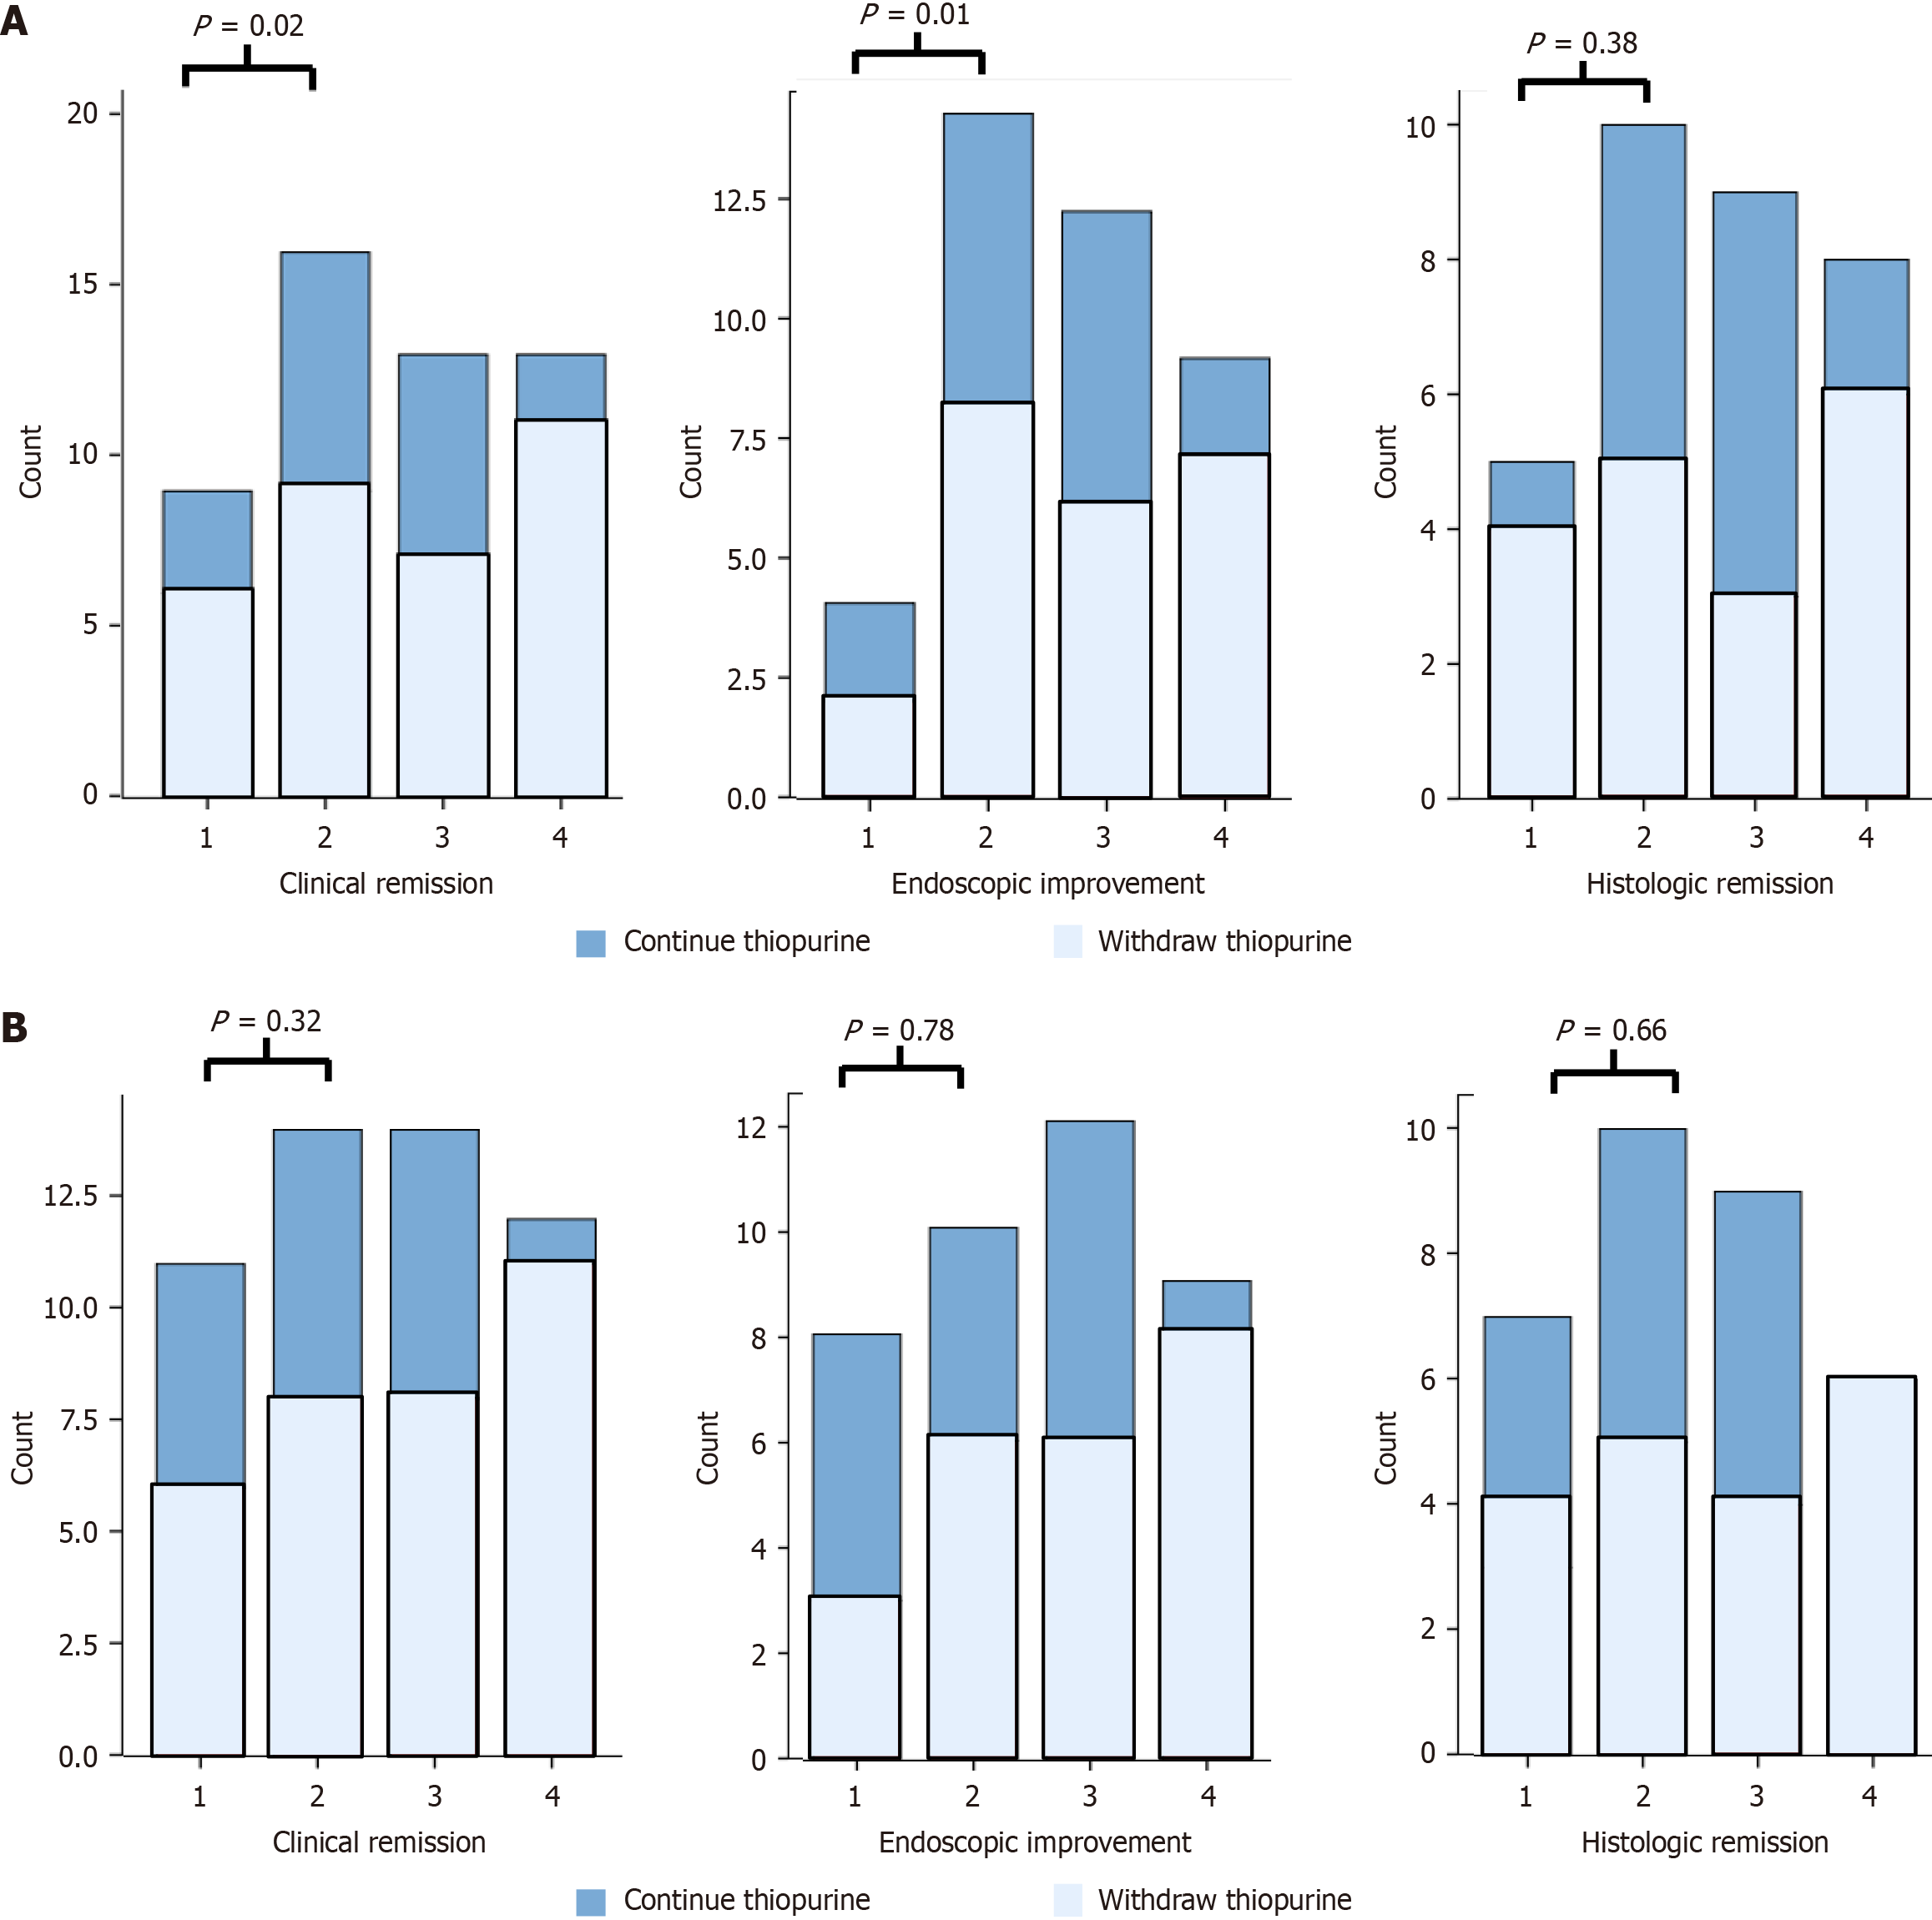
Figure 5 Remission rates expressed per quartile.
A: At week 0; B: At week 48.
- Citation: Chaemsupaphan T, Pudipeddi A, Lin HY, Paramsothy S, Kariyawasam VC, Kermeen M, Leong RW. Vedolizumab serum trough concentrations with and without thiopurines in ulcerative colitis: The prospective VIEWS pharmacokinetics study. World J Gastroenterol 2025; 31(2): 101292
- URL: https://www.wjgnet.com/1007-9327/full/v31/i2/101292.htm
- DOI: https://dx.doi.org/10.3748/wjg.v31.i2.101292


