Copyright
©The Author(s) 2025.
World J Gastroenterol. Jan 14, 2025; 31(2): 100234
Published online Jan 14, 2025. doi: 10.3748/wjg.v31.i2.100234
Published online Jan 14, 2025. doi: 10.3748/wjg.v31.i2.100234
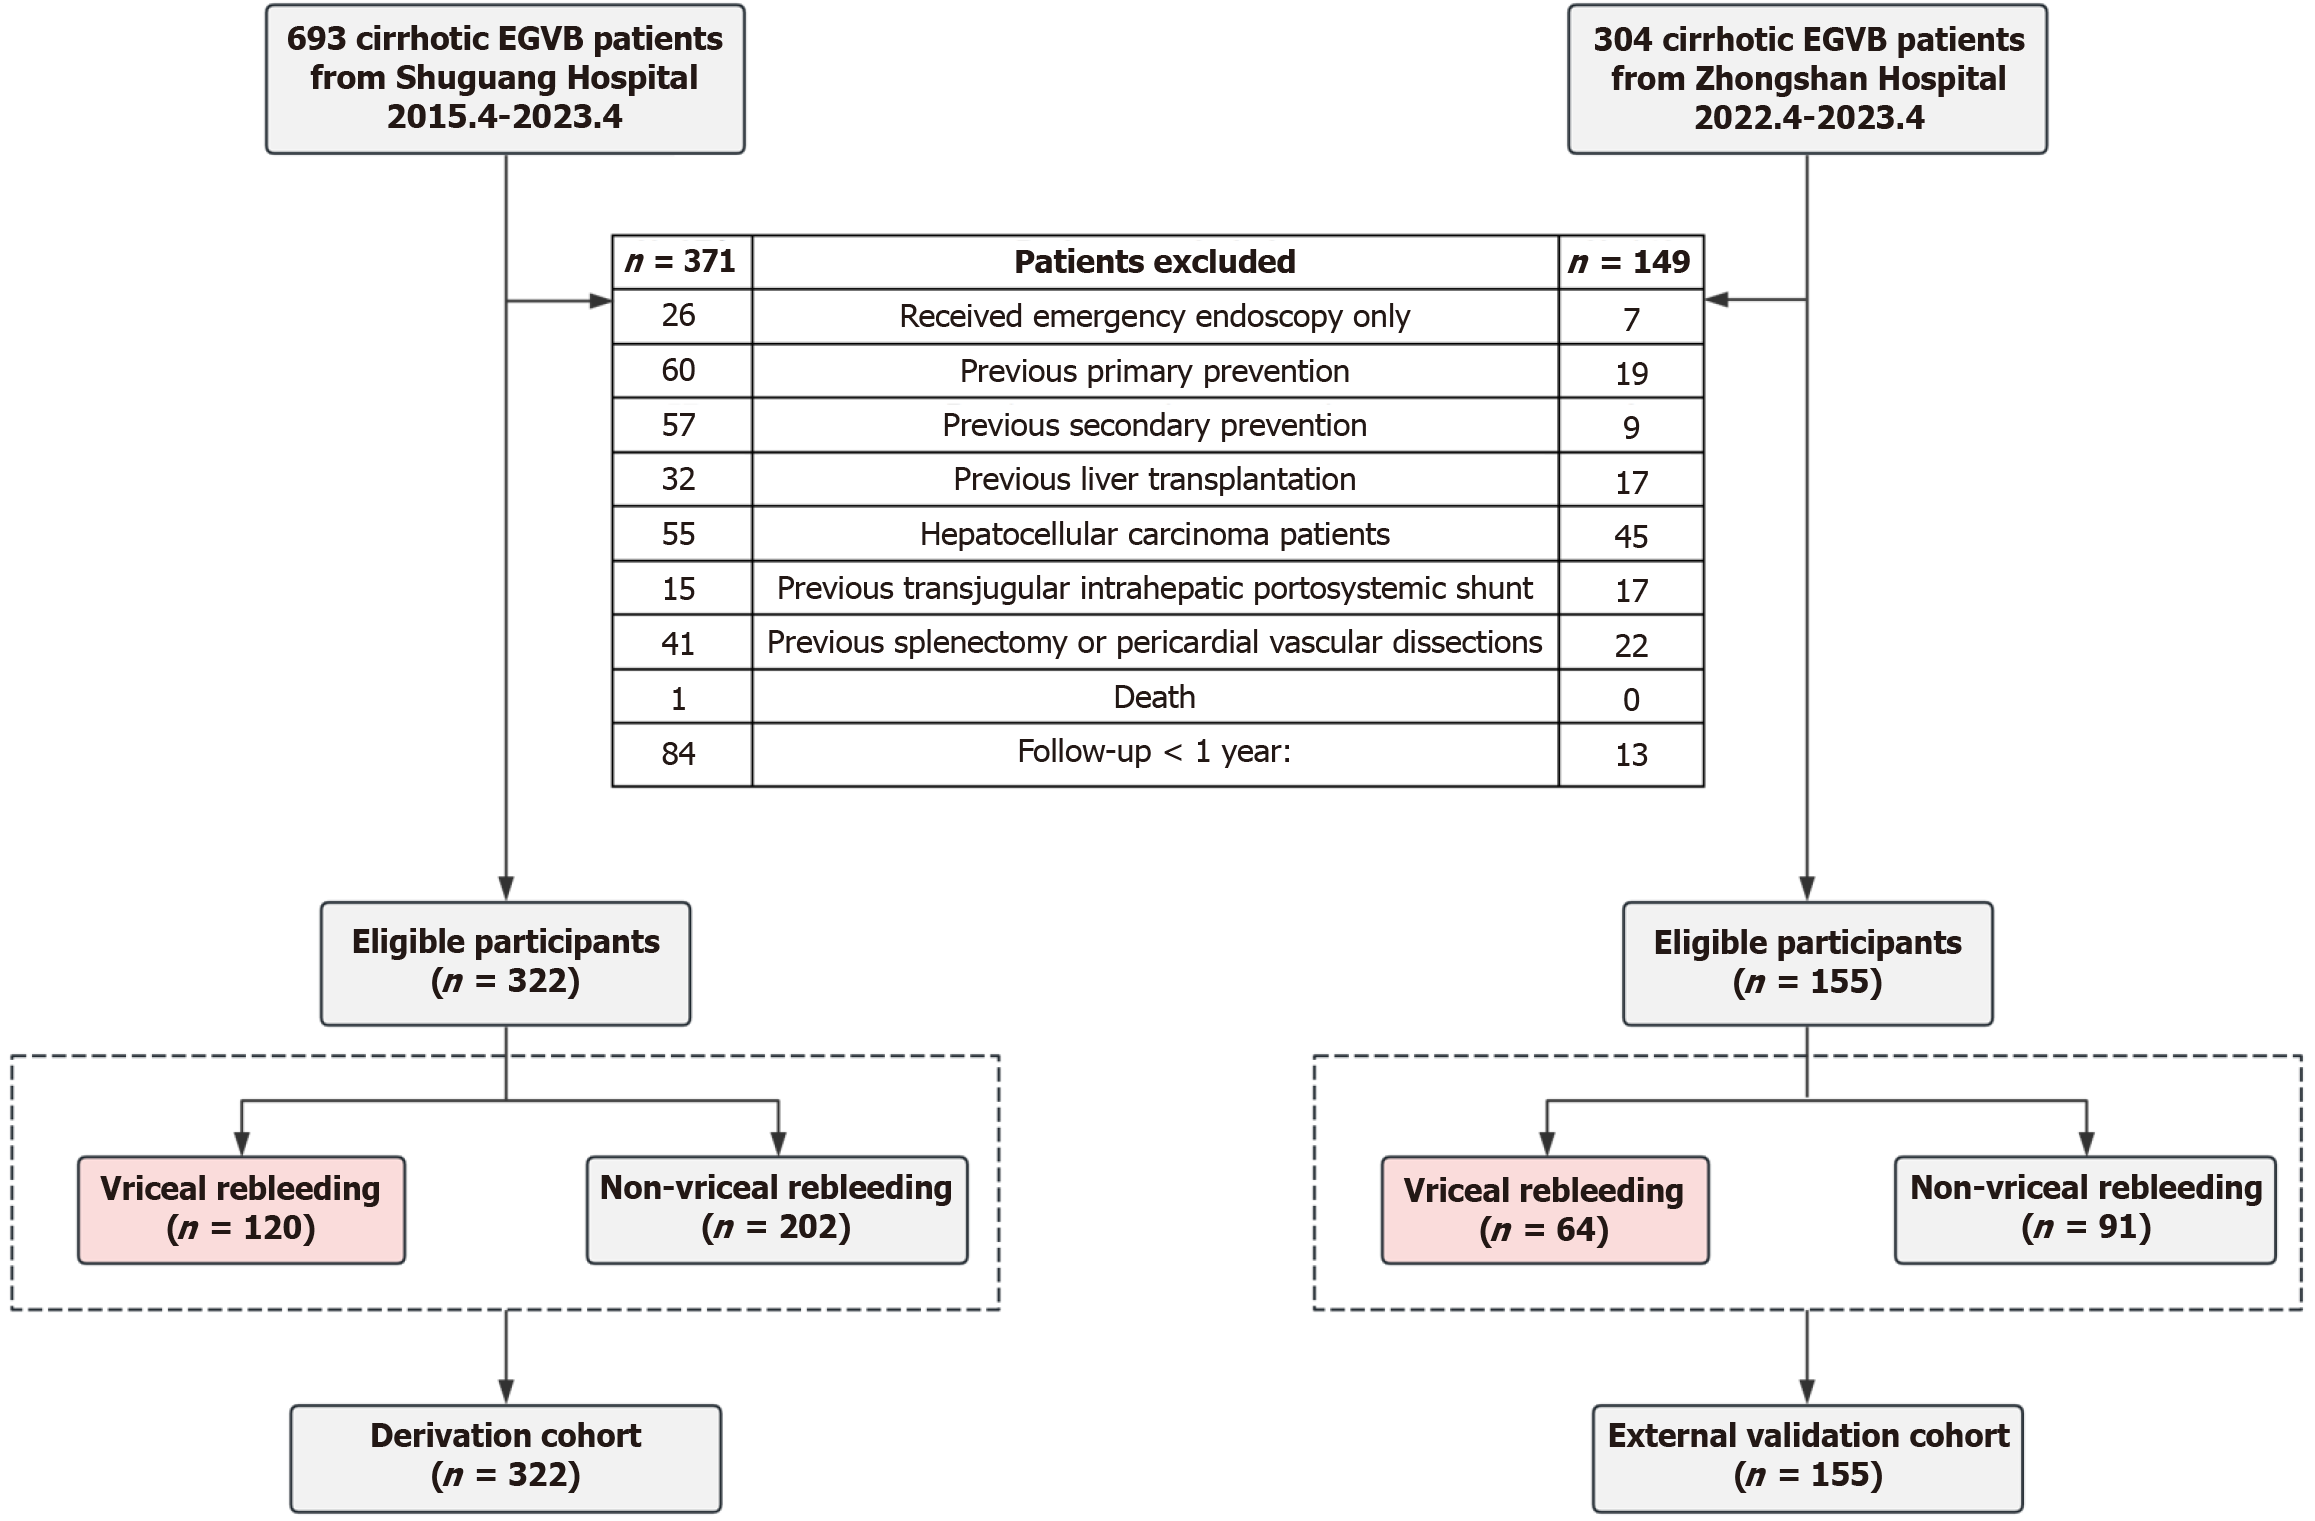
Figure 1 Study flow chart.
EGVB: Esophagogastric variceal bleeding.
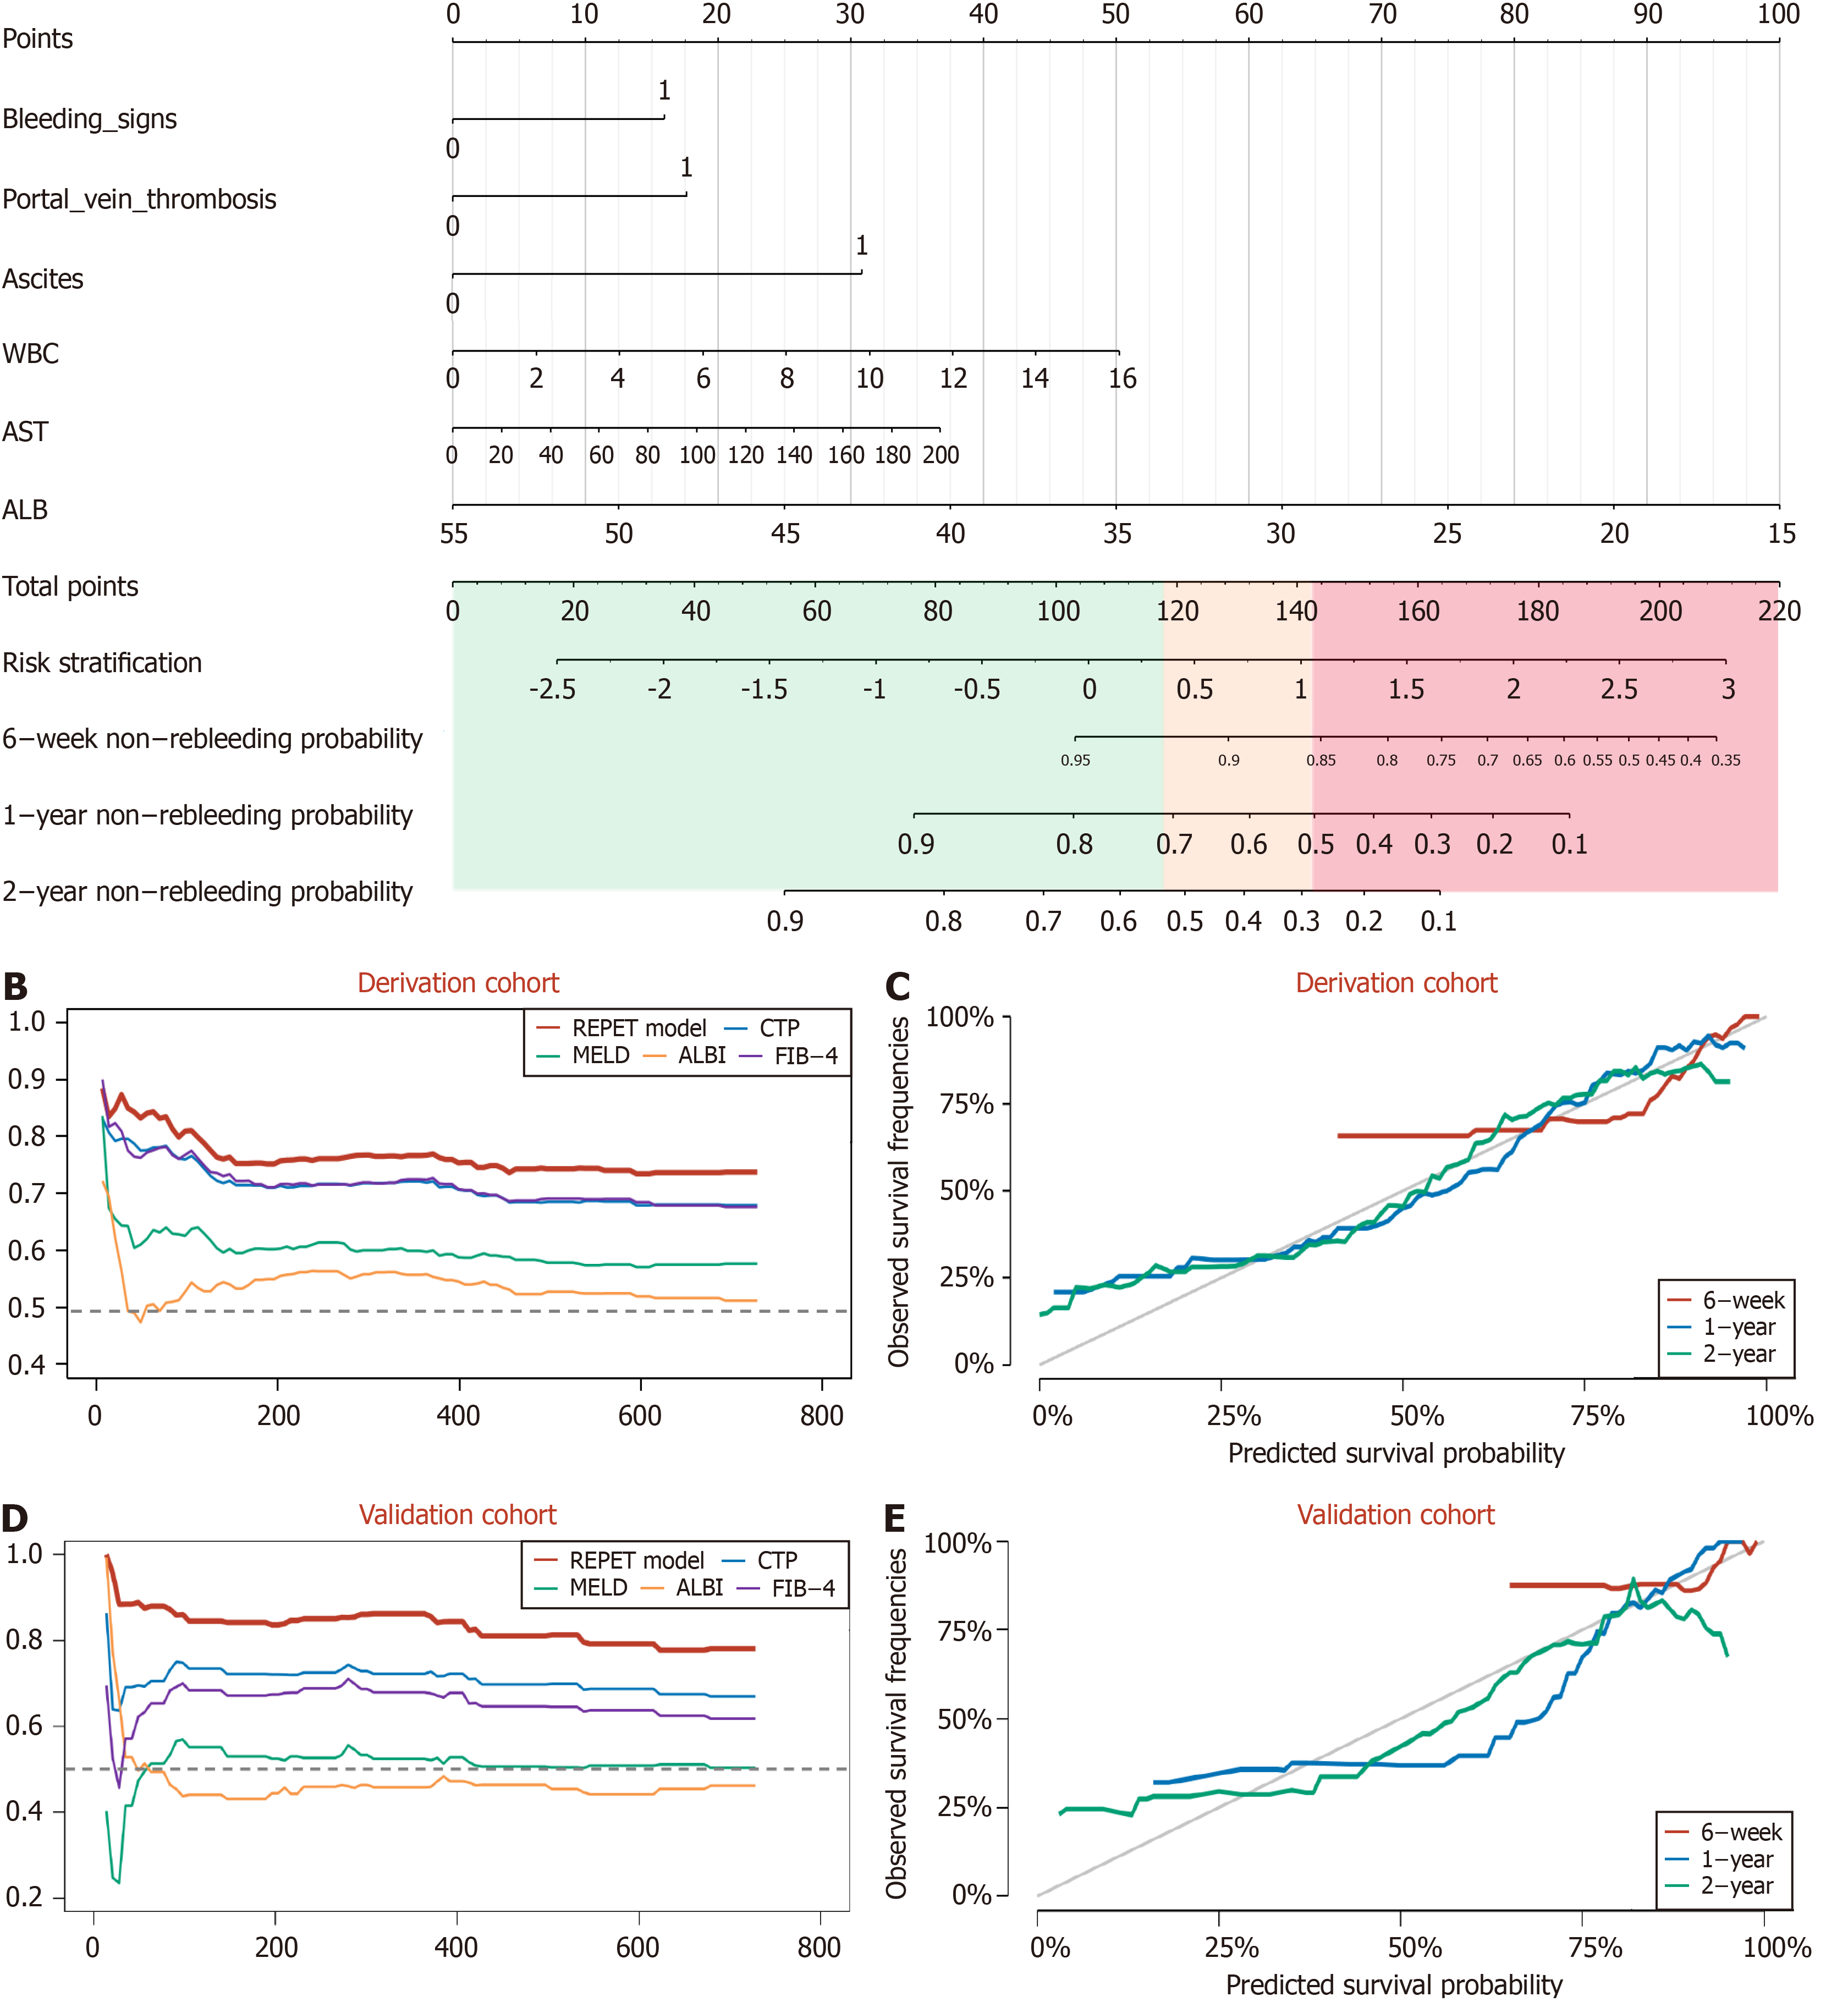
Figure 2 The nomogram, time-dependent concordance index and calibration curve.
A: The nomogram for predicting variceal rebleeding; B-E: Risk stratification was based on the total points: Low-risk group (score < 117.3, green background), medium-risk (score 1173-142.7, yellow background) and high-risk (score > 142.7, red background). The time-dependent concordance index (C-index) of the rebleeding event prediction following endoscopic treatment model compared with other existing scores/criteria for the predicting variceal rebleeding in the derivation cohort (B) and in the external validation cohort (D). Calibration curves for 6 weeks, 1 year, and 2 years variceal rebleeding prediction in the derivation cohort (C) and in the external validation cohort (E). WBC: White blood cell; AST: Aspartate aminotransferase; ALB: Albumin; REPET: Rebleeding event prediction following endoscopic treatment.
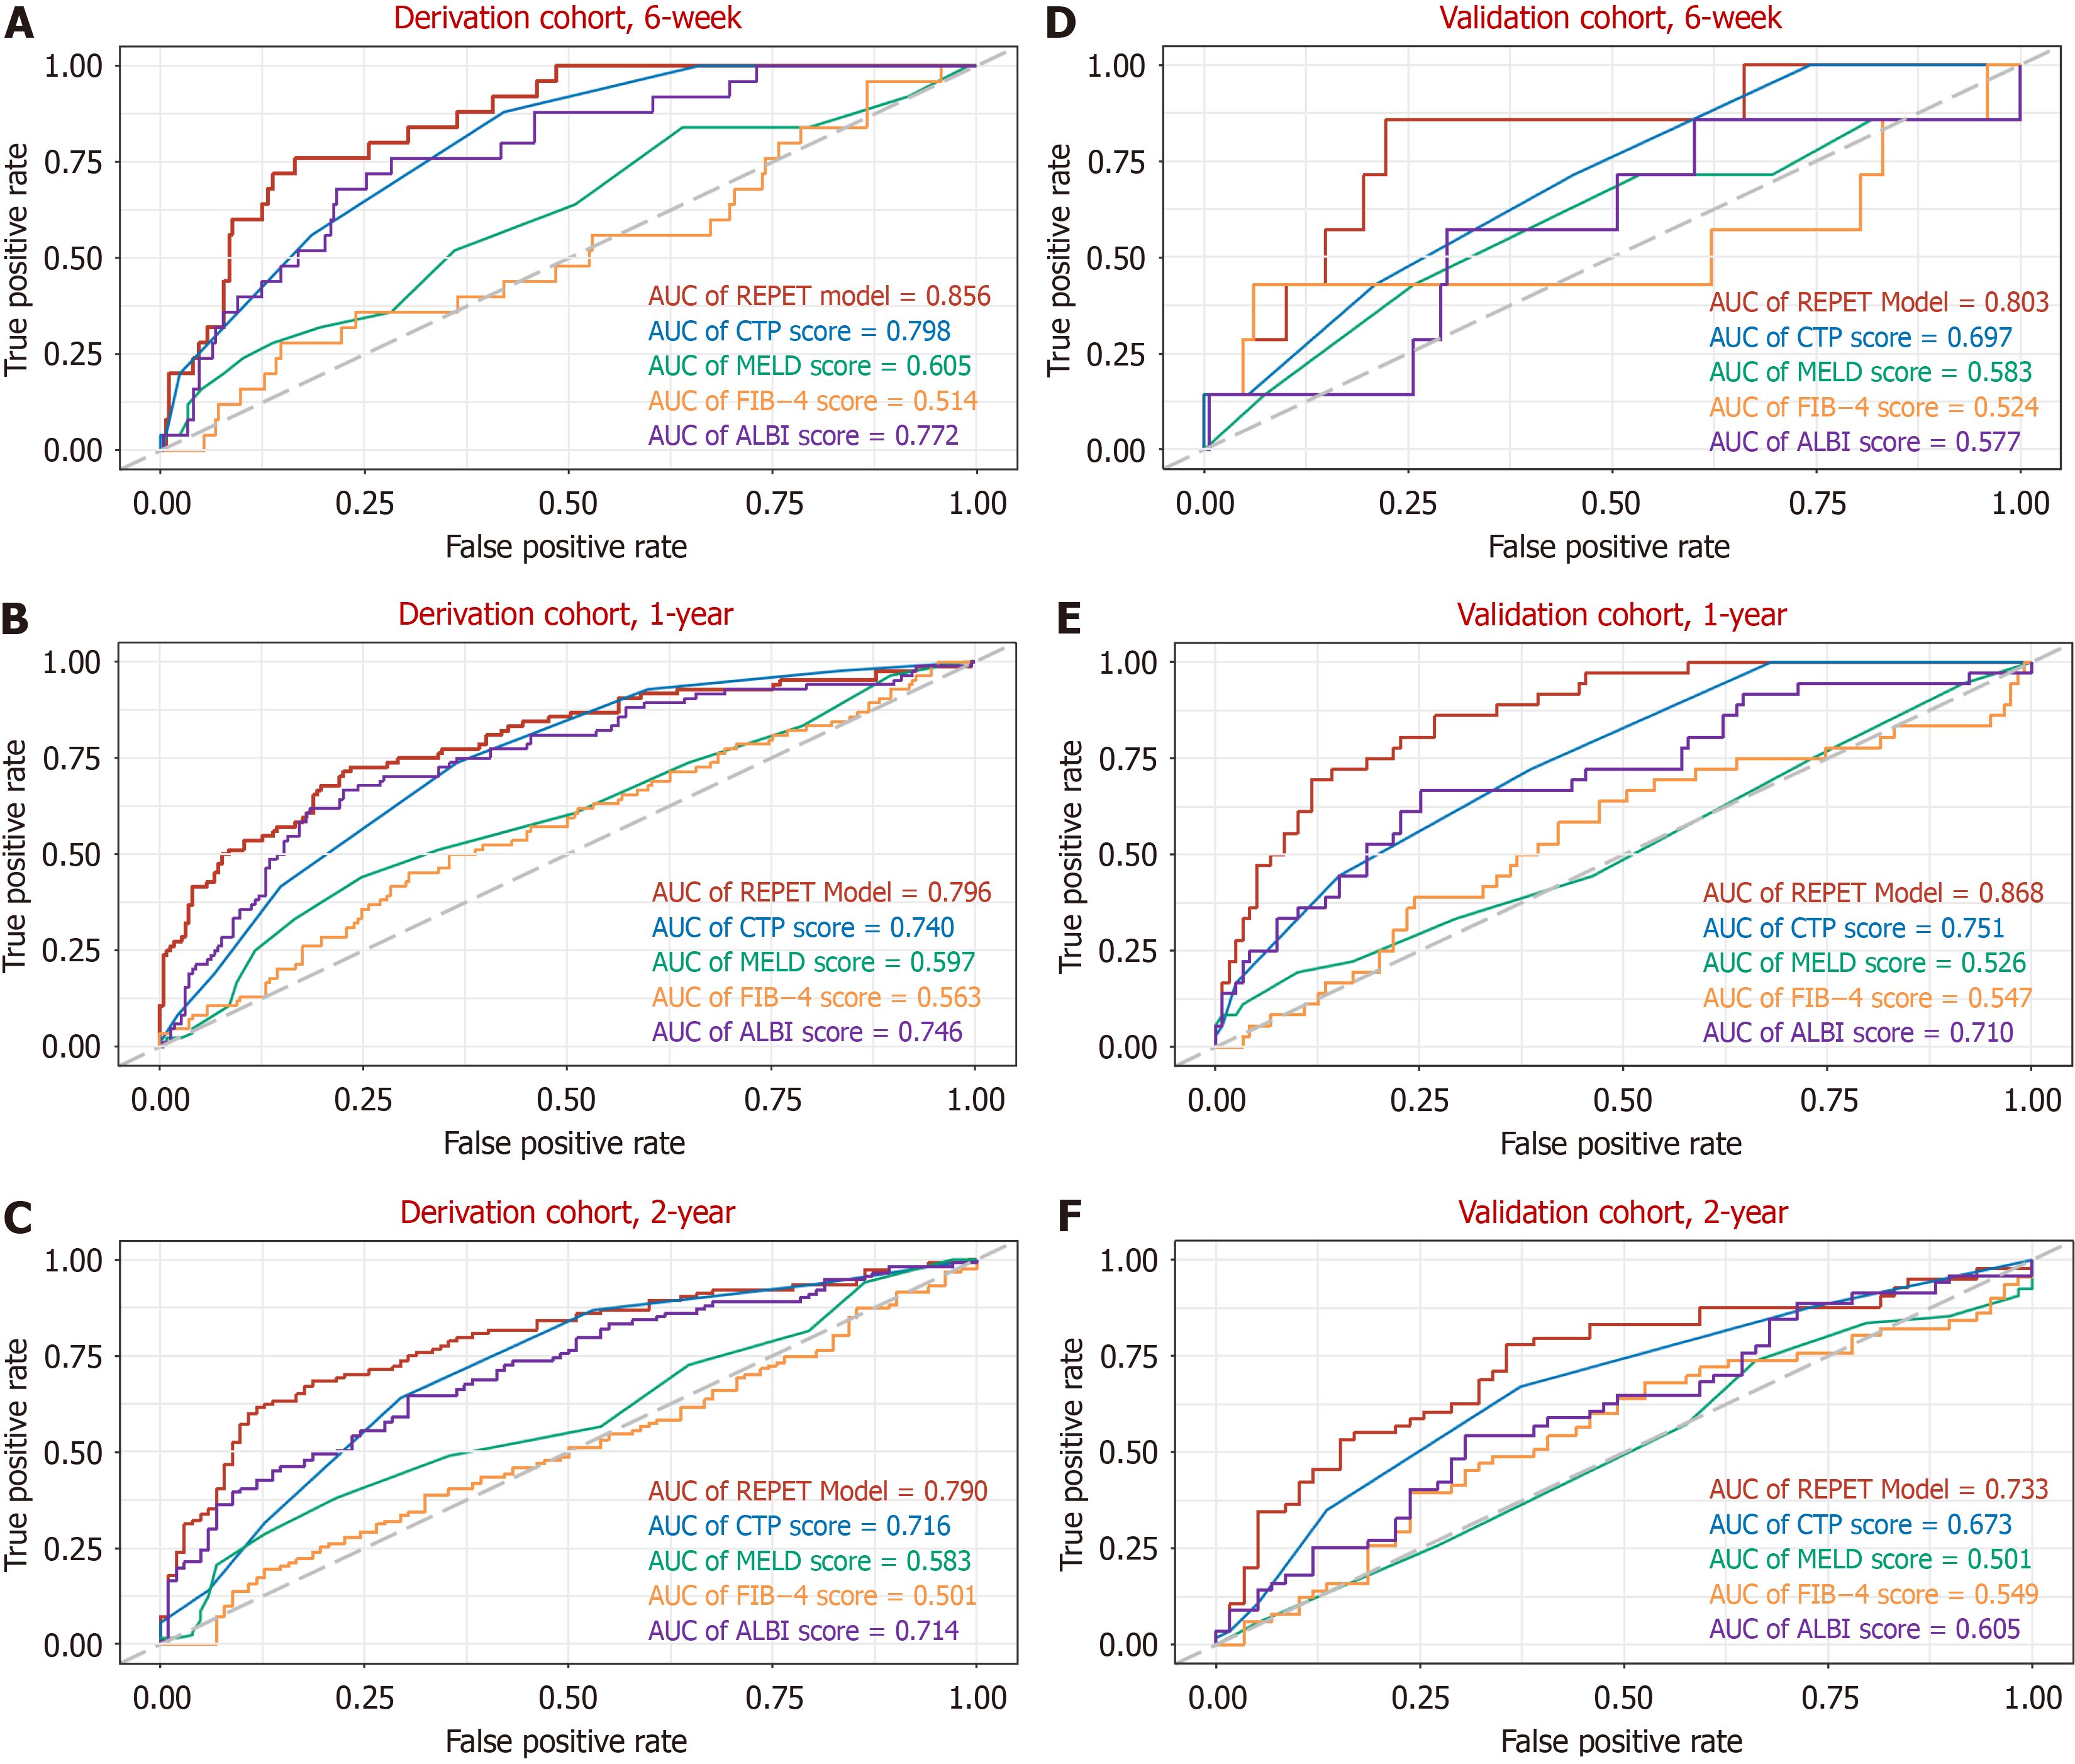
Figure 3 Area under receiver operating curve for variceal rebleeding in the derivation cohort and external cohort with 6 weeks, 1 year, and 2 years.
A: Area under receiver operating curve for variceal rebleeding in the derivation cohort with 6 weeks; B: Area under receiver operating curve for variceal rebleeding in the derivation cohort with 1 year; C: Area under receiver operating curve for variceal rebleeding in the derivation cohort with 2 years; D: Area under receiver operating curve for variceal rebleeding in external cohort with 6 weeks; E: Area under receiver operating curve for variceal rebleeding in external cohort with 1 year; F: Area under receiver operating curve for variceal rebleeding in external cohort with 2 years. AUC: Area under the receiver operating curve; REPET: Rebleeding event prediction following endoscopic treatment; CTP: Child-Turcotte-Pugh; MELD: Model for end-stage liver disease; FIB-4: Fibrosis 4; ALBI: Albumin-bilirubin.
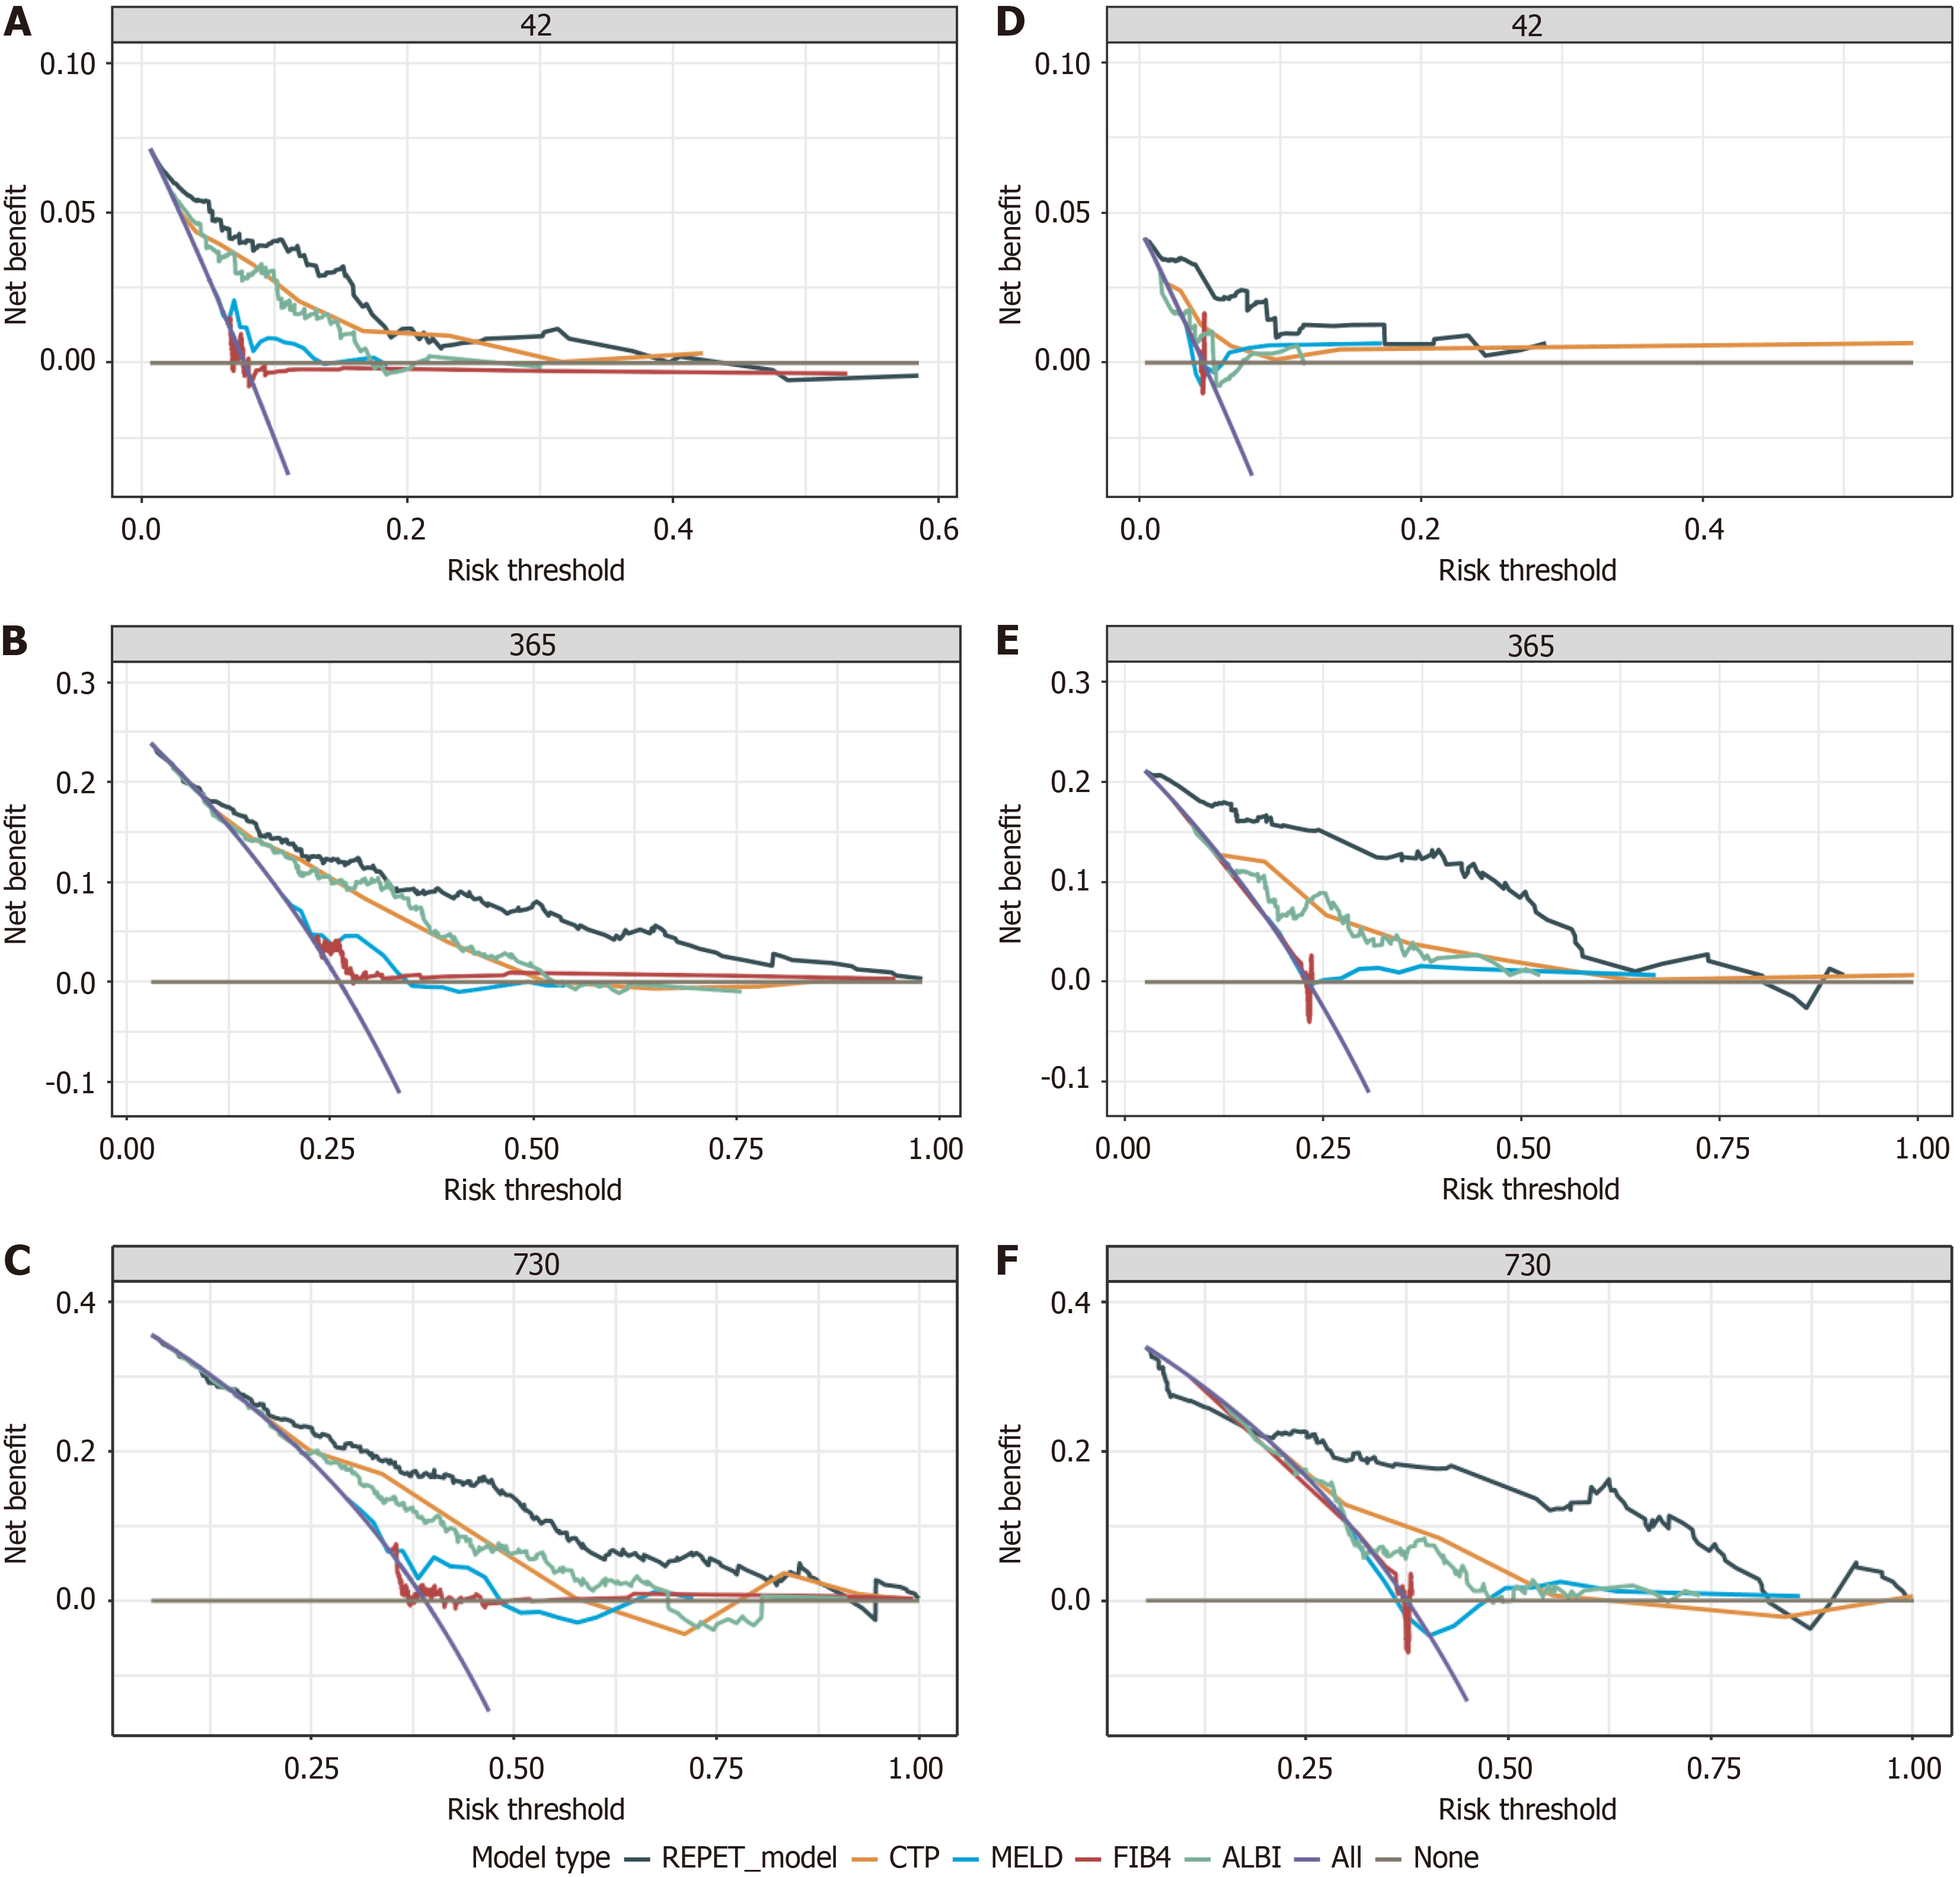
Figure 4 Decision curve analysis for variceal rebleeding in the derivation cohort and external cohort with 6 weeks, 1 year, and 2 years.
A: Decision curve analysis for variceal rebleeding in the derivation cohort with 6 weeks; B: Decision curve analysis for variceal rebleeding in the derivation cohort with 1 year; C: Decision curve analysis for variceal rebleeding in the derivation cohort with 2 year; D: Decision curve analysis for variceal rebleeding in external cohort with 6 weeks; E: Decision curve analysis for variceal rebleeding in external cohort with 1 year; F: Decision curve analysis for variceal rebleeding in external cohort with 2 years. REPET: Rebleeding event prediction following endoscopic treatment; CTP: Child-Turcotte-Pugh; MELD: Model for end-stage liver disease; FIB-4: Fibrosis 4; ALBI: Albumin-bilirubin.
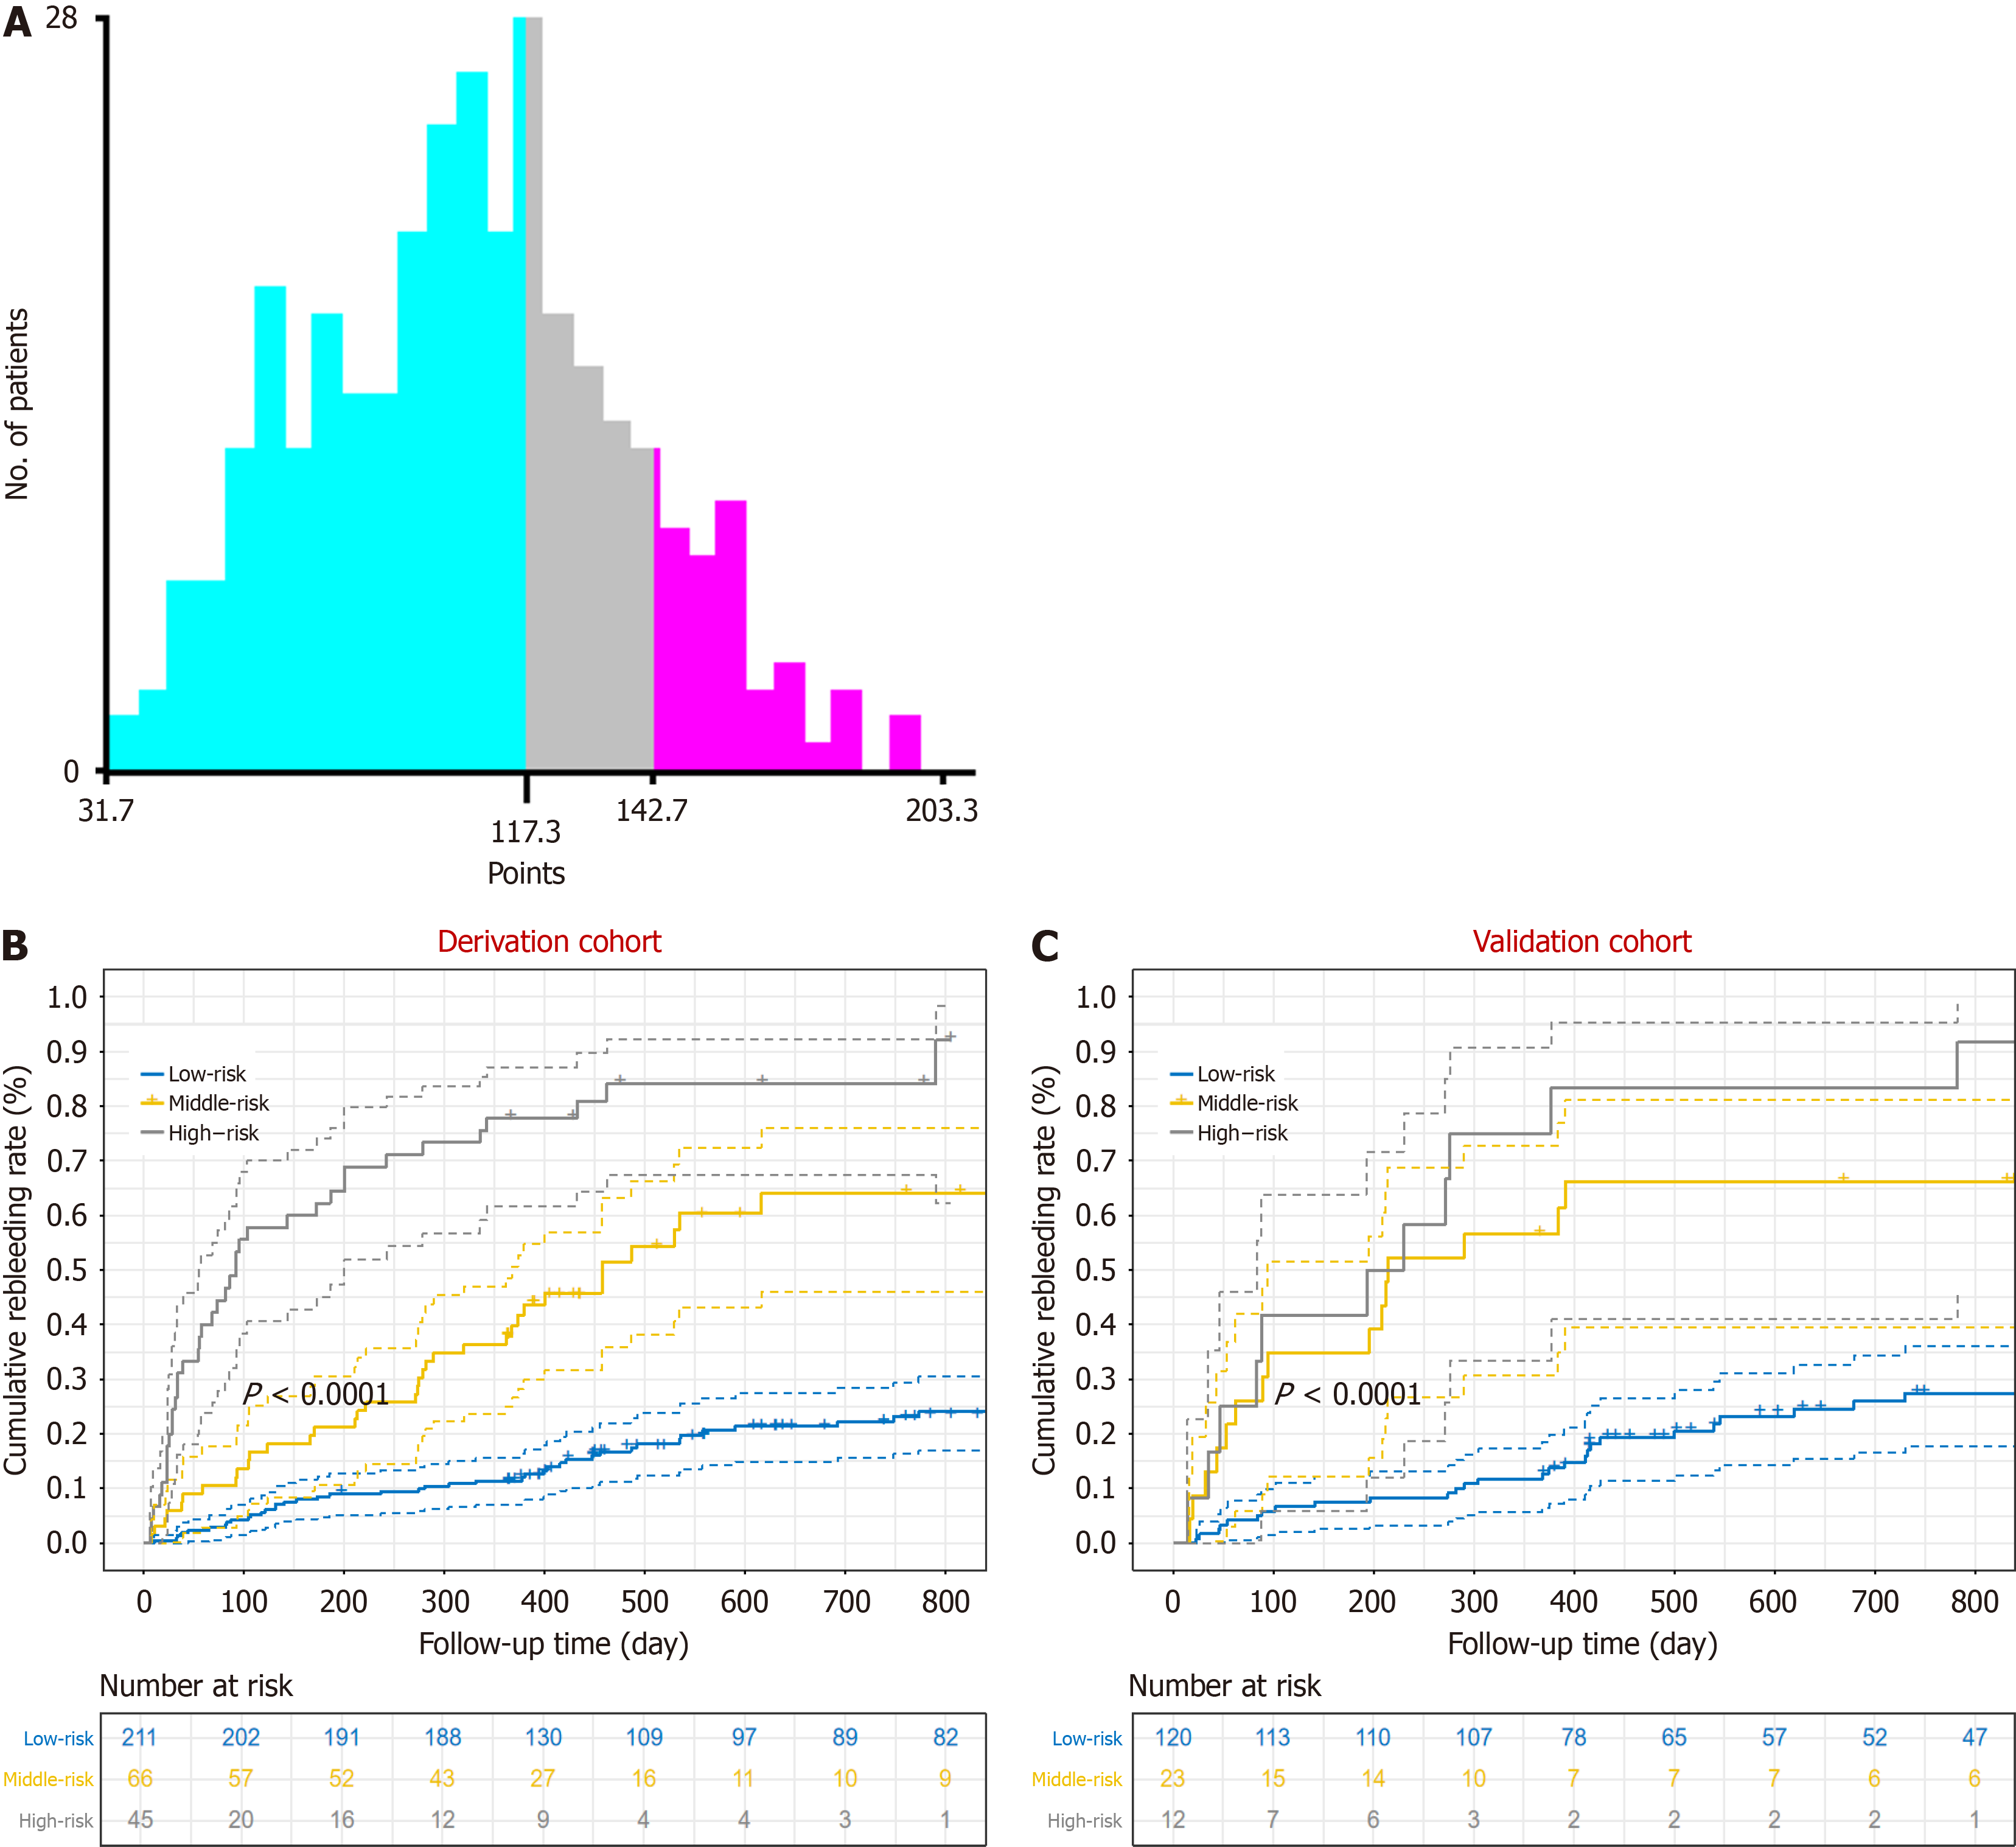
Figure 5 Risk stratification for variceal rebleeding.
A: Optimal thresholds for prognostic scores (using X-tile software); B and C: The Kaplan-Meier curves for the different risk groups in the derivation (B) and validation cohorts (C).
- Citation: Zhan JY, Chen J, Yu JZ, Xu FP, Xing FF, Wang DX, Yang MY, Xing F, Wang J, Mu YP. Prognostic model for esophagogastric variceal rebleeding after endoscopic treatment in liver cirrhosis: A Chinese multicenter study. World J Gastroenterol 2025; 31(2): 100234
- URL: https://www.wjgnet.com/1007-9327/full/v31/i2/100234.htm
- DOI: https://dx.doi.org/10.3748/wjg.v31.i2.100234


