Copyright
©The Author(s) 2025.
World J Gastroenterol. May 21, 2025; 31(19): 105283
Published online May 21, 2025. doi: 10.3748/wjg.v31.i19.105283
Published online May 21, 2025. doi: 10.3748/wjg.v31.i19.105283
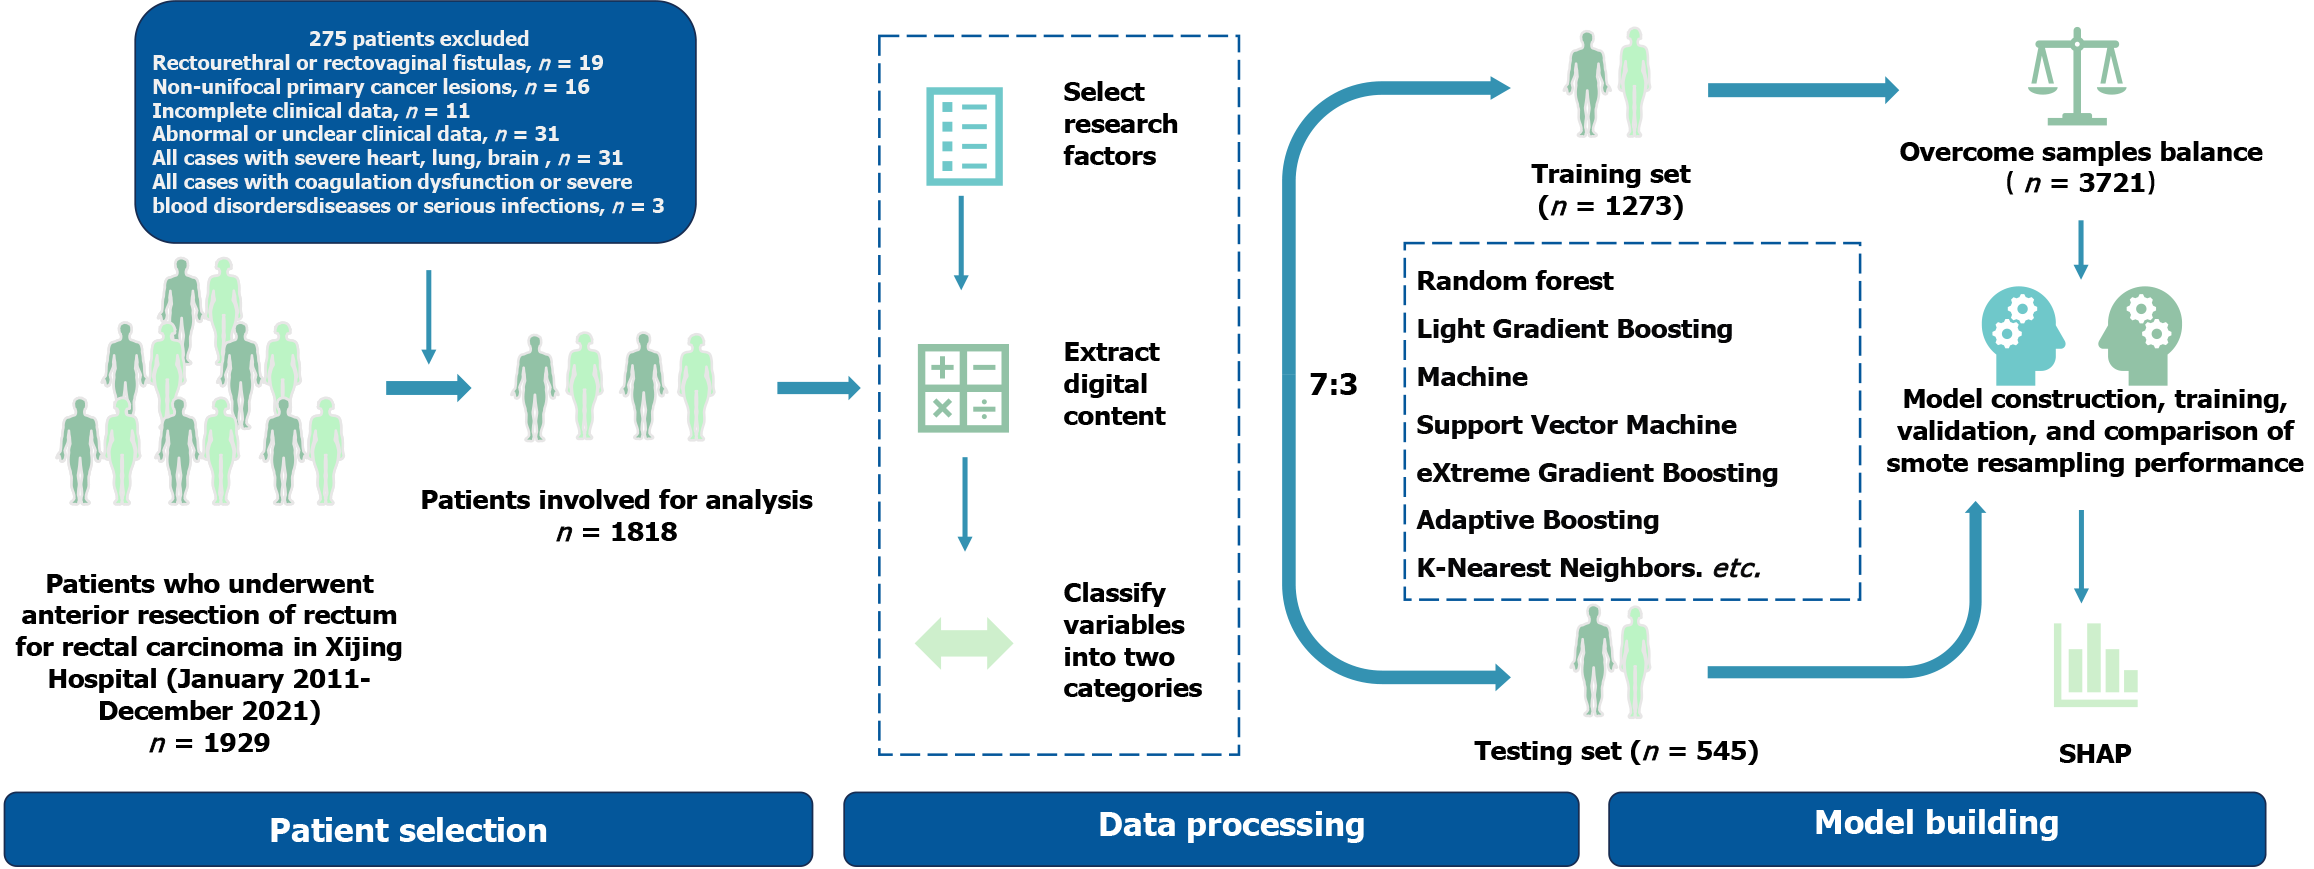
Figure 1 Flowchart of study procedure.
SHAP: SHapley Additive exPlanations.
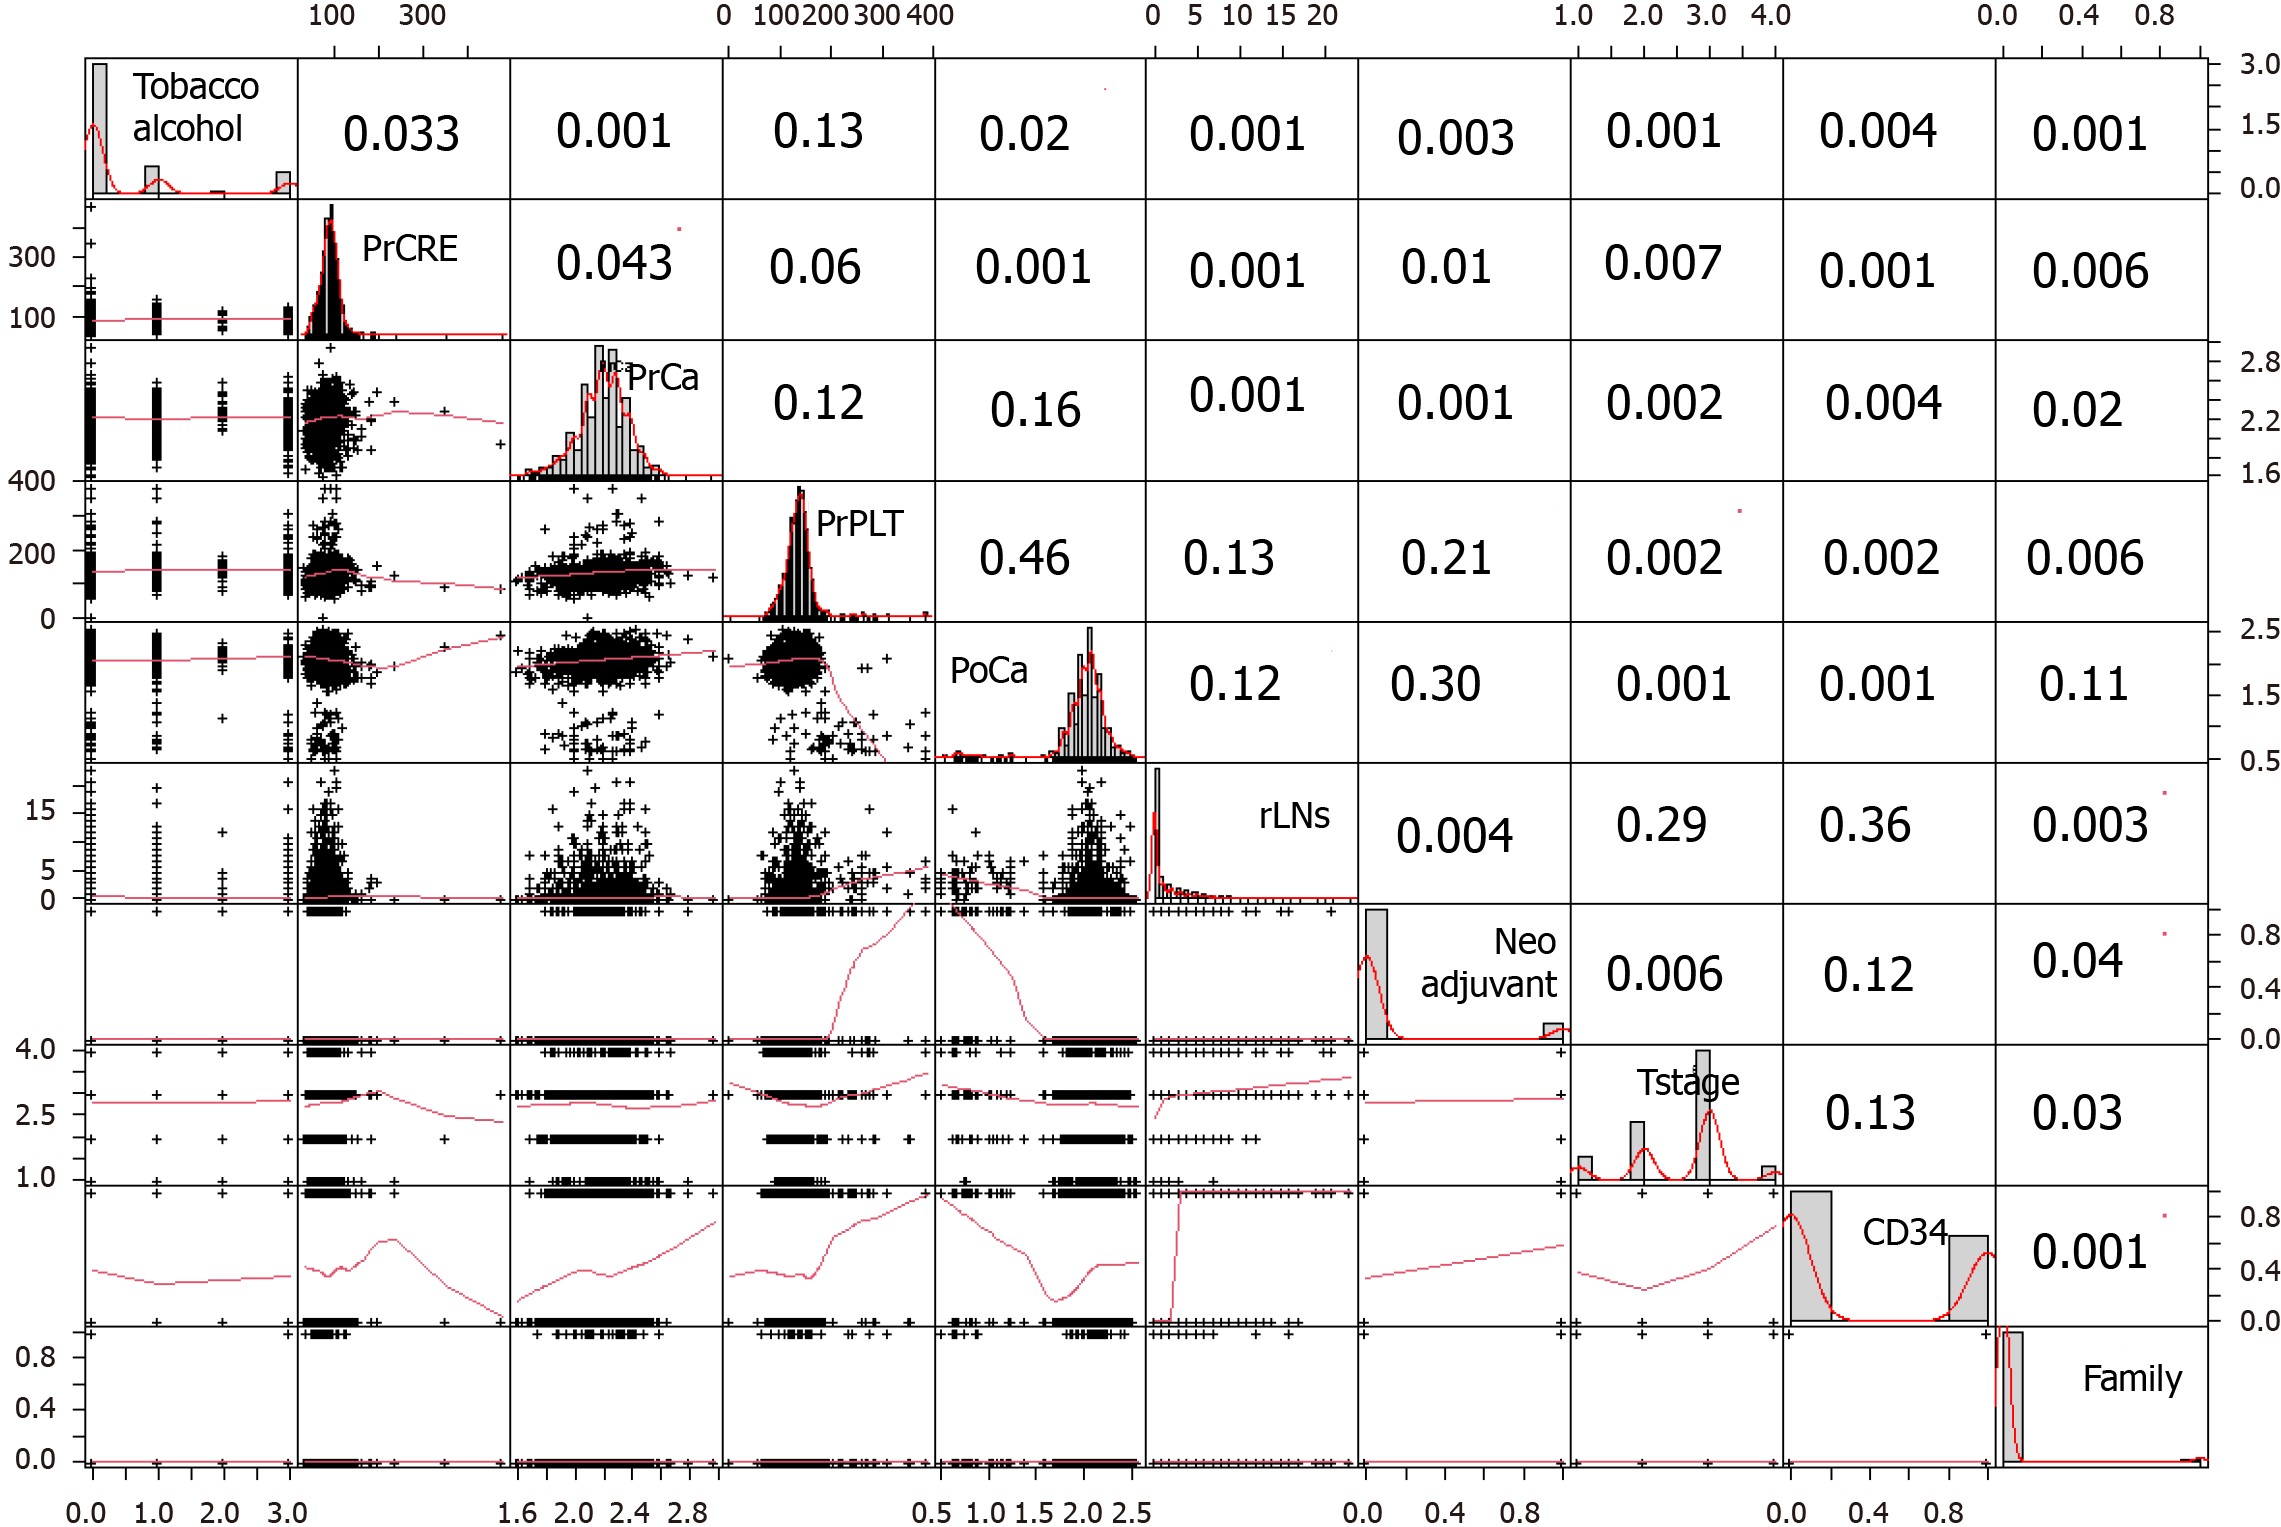
Figure 2 Interaction between variables in a correlation matrix.
PrCa: Prstoperative calcium ion concentration; PrCRE: Preoperative serum creatinine concentration; PoCa: Postoperative calcium ion concentration; rLNs: Positive lymph node count; PrPLT: Preoperative platelet concentration.
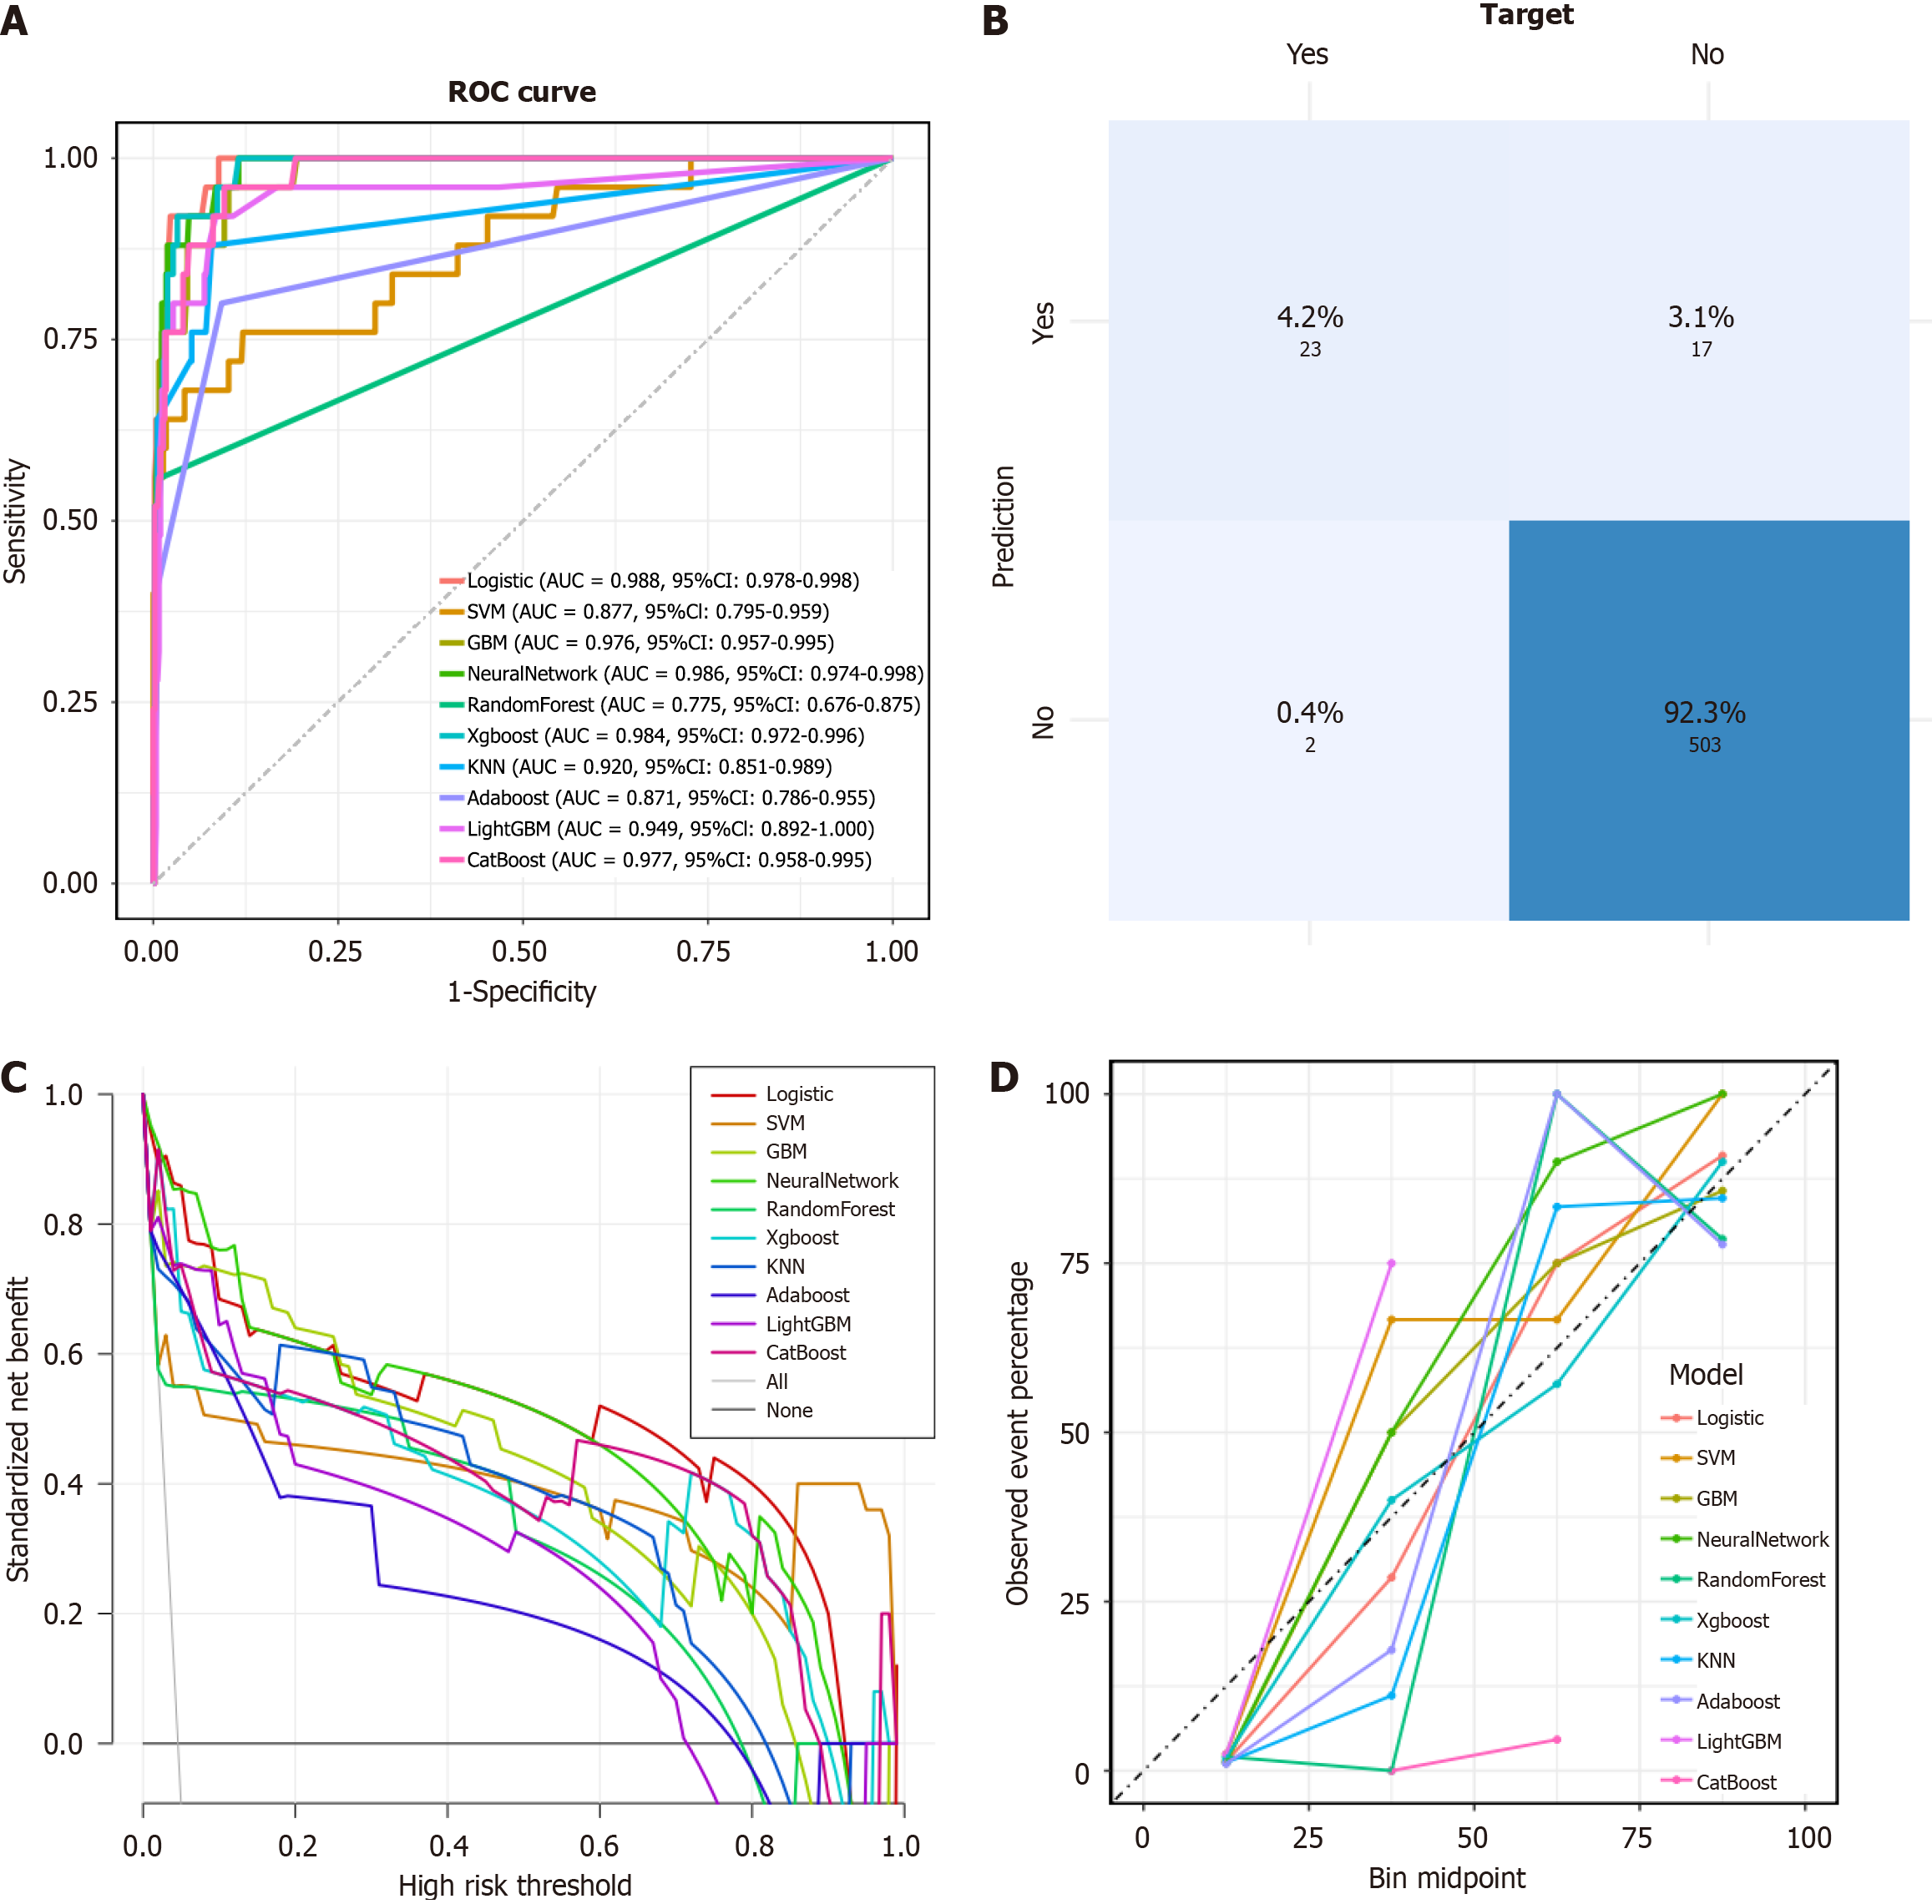
Figure 3 Testing and evaluation of eXtreme Gradient Boosting model based on raw data.
A: Area under the receiver operating characteristic curve comparison between models; B: The confusion matrix of eXtreme Gradient Boosting model; C: Comparison of decision curve analysis curves between models; D: Comparison of calibration curves between models. AUC: Area under the receiver operating characteristic curve; ROC: Receiver operating characteristic; SVM: Support vector machine; GBM: Gradient boosting machines; KNN: K-nearest neighbors; LightGBM: Light gradient boosting machine.
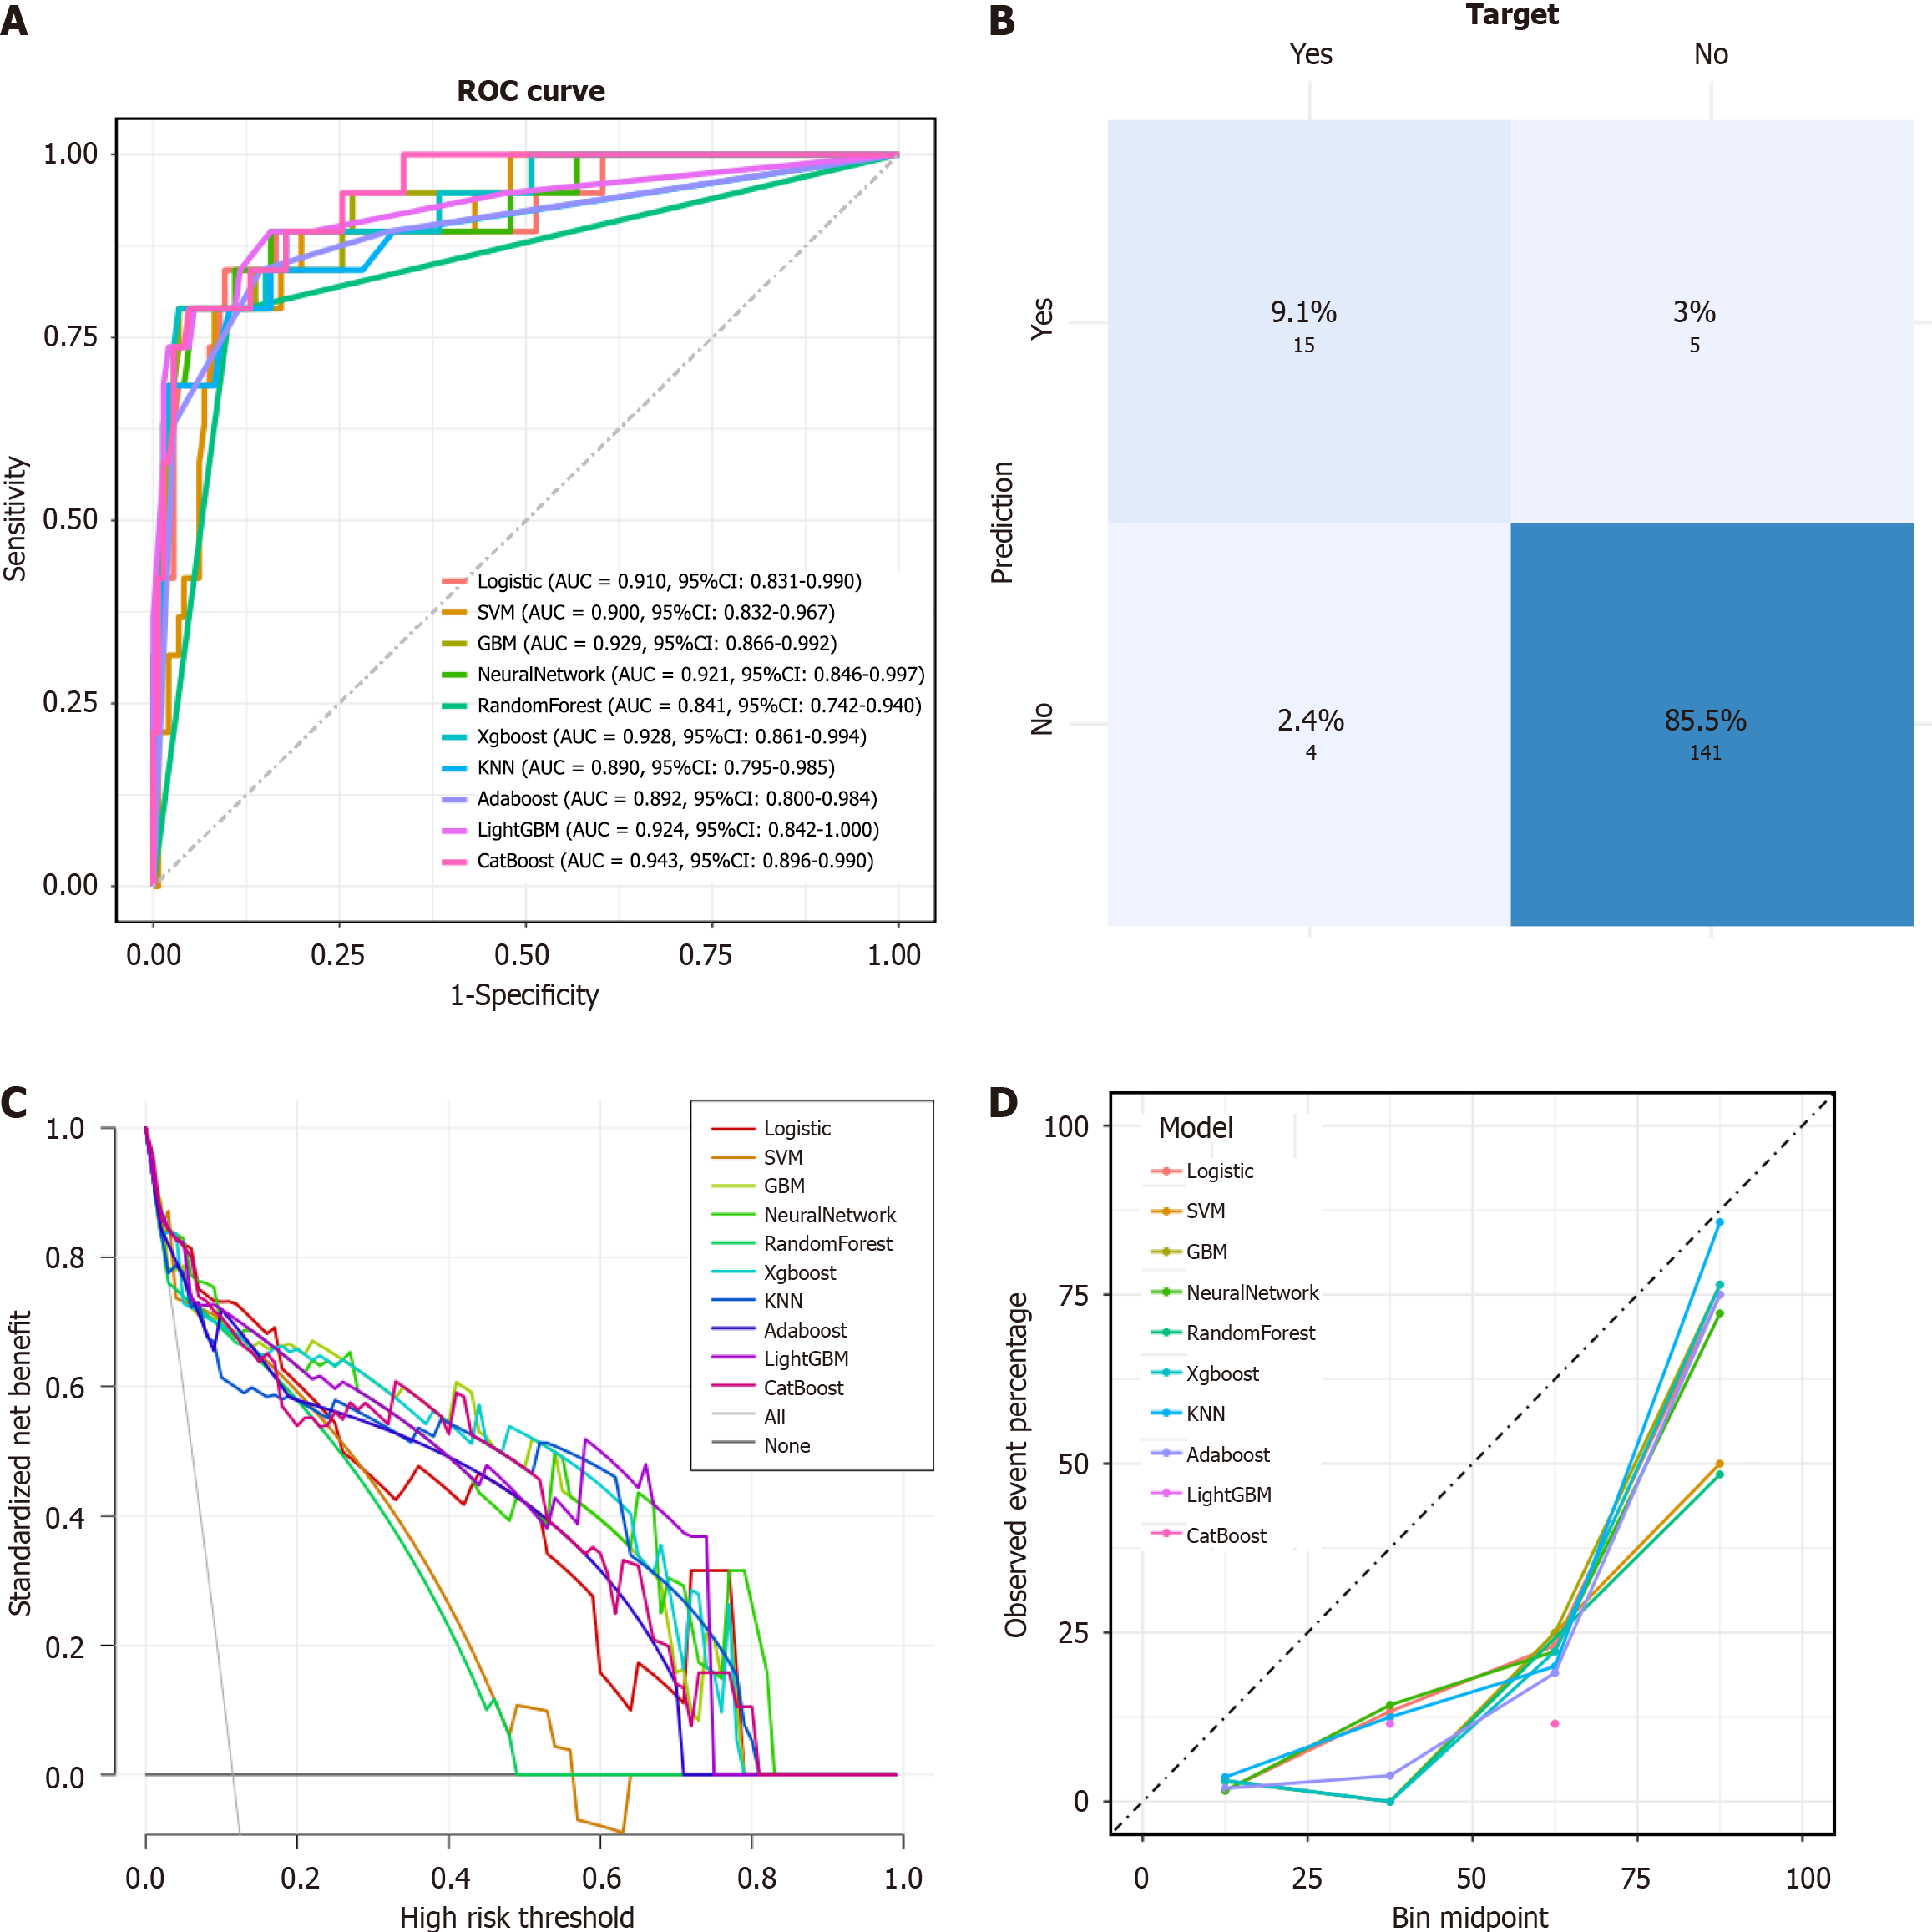
Figure 4 Testing and evaluation of eXtreme Gradient Boosting model based on SMOTE-resampled data.
A: Area under the receiver operating characteristic curve comparison between models; B: The confusion matrix of eXtreme Gradient Boosting model; C: Comparison of decision curve analysis curves between models; D: Comparison of calibration curves between models. AUC: Area under the receiver operating characteristic curve; ROC: Receiver operating characteristic; SVM: Support vector machine; GBM: Gradient boosting machines; KNN: K-nearest neighbors; LightGBM: Light gradient boosting machine.
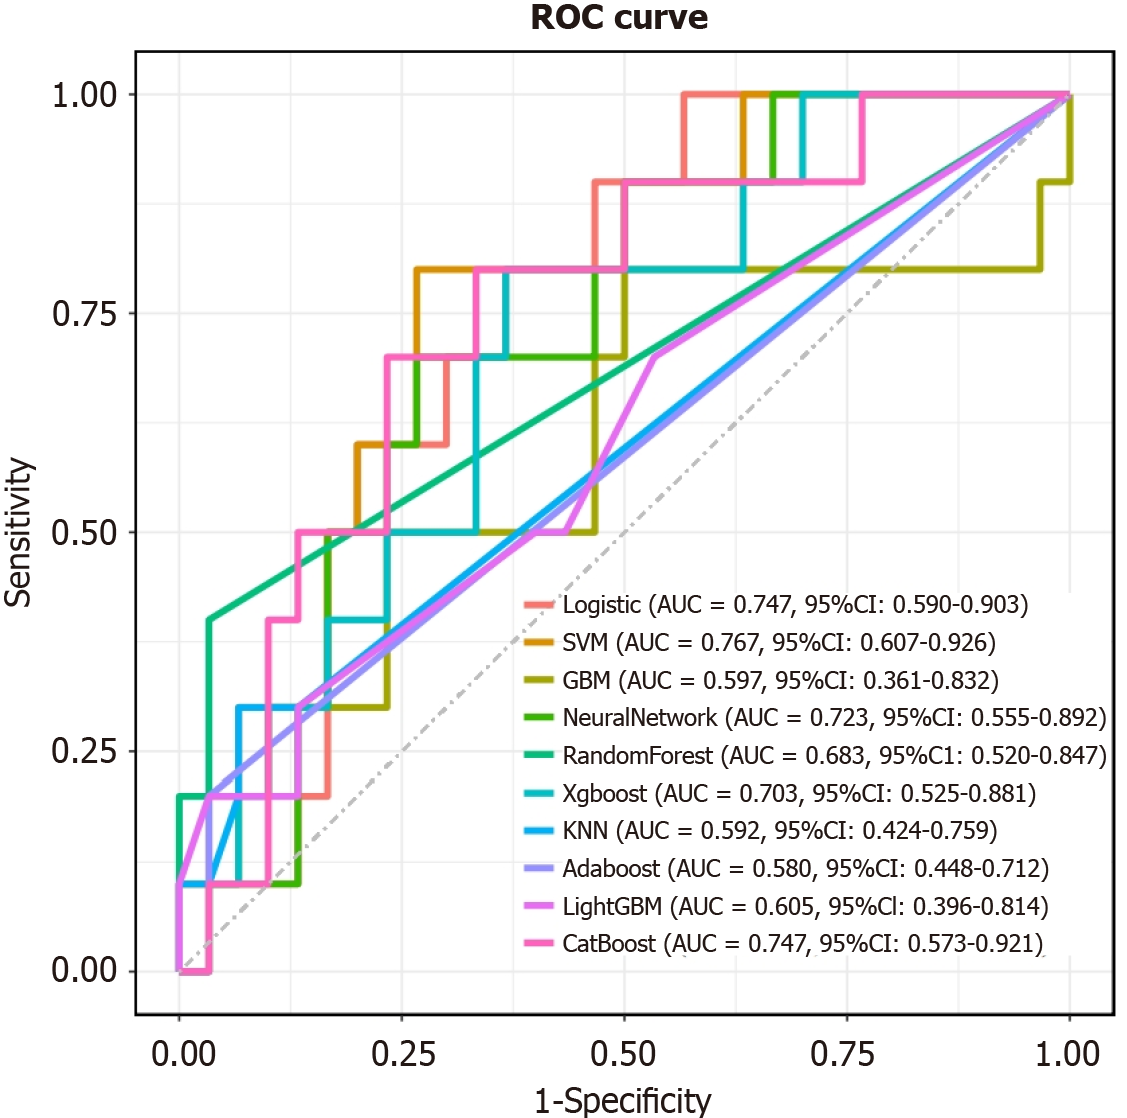
Figure 5 Receiver operating characteristic curve analysis of the eXtreme Gradient Boosting model based on the external validation dataset.
AUC: Area under the receiver operating characteristic curve; ROC: Receiver operating characteristic; SVM: Support vector machine; GBM: Gradient boosting machines; KNN: K-nearest neighbors; LightGBM: Light gradient boosting machine.
Figure 6 Interpretation of the eXtreme Gradient Boosting model using SHapley Additive exPlanations.
A: Mean importance ranking of features displayed by SHapley Additive exPlanations (SHAP); B: Bee colony diagram of characterization attributes in SHAP. SHAP: SHapley Additive exPlanations.
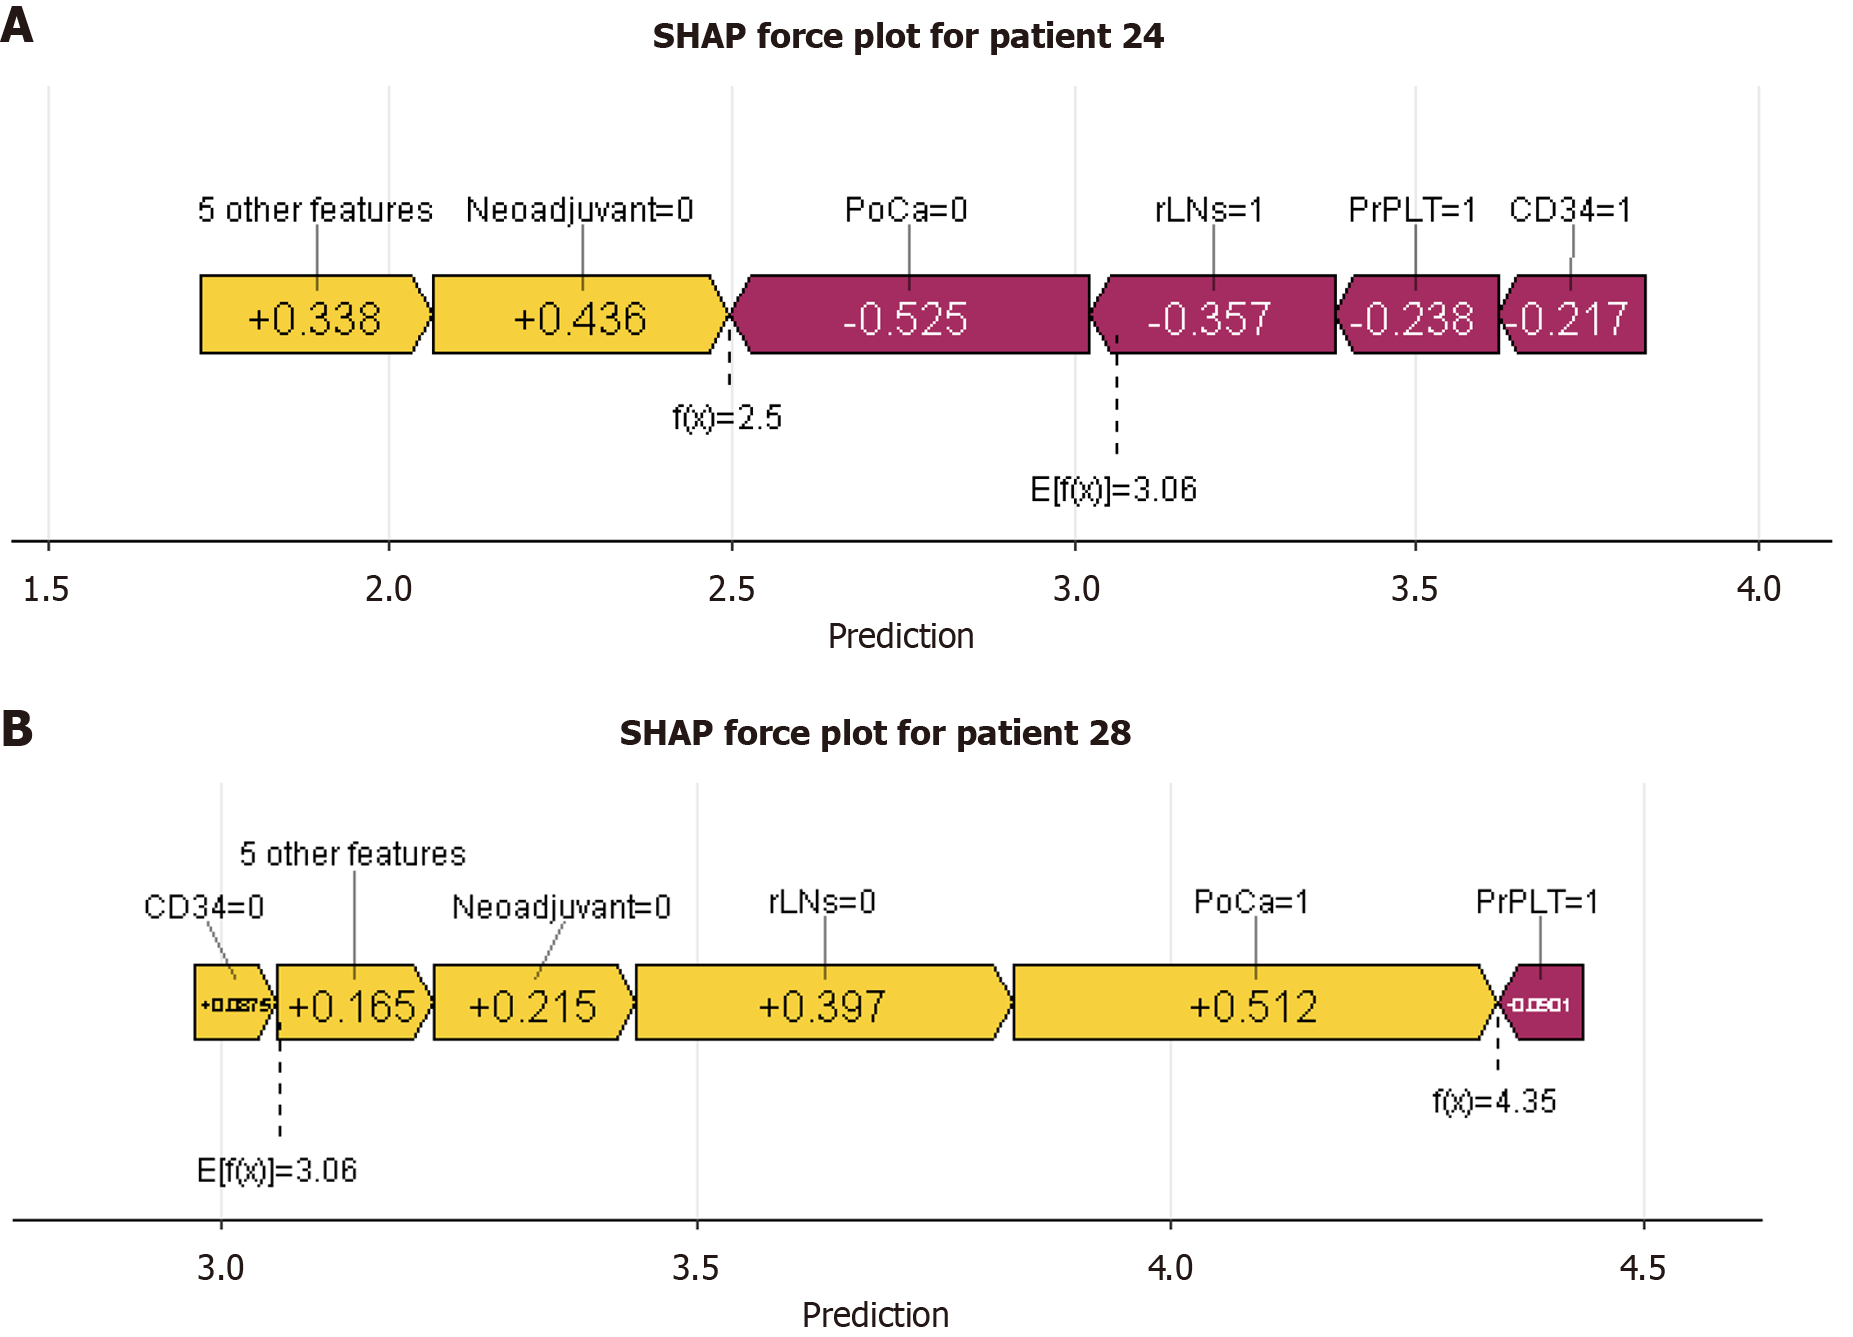
Figure 7 Interpretation of the light gradient boosting machine model using SHapley Additive exPlanations.
A: A patient who did not develop anastomotic leakage; B: A patient who developed anastomotic leakage. SHAP: SHapley Additive exPlanations; PoCa: Postoperative calcium ion concentration; rLNs: Positive lymph node count; PrPLT: Preoperative platelet concentration.
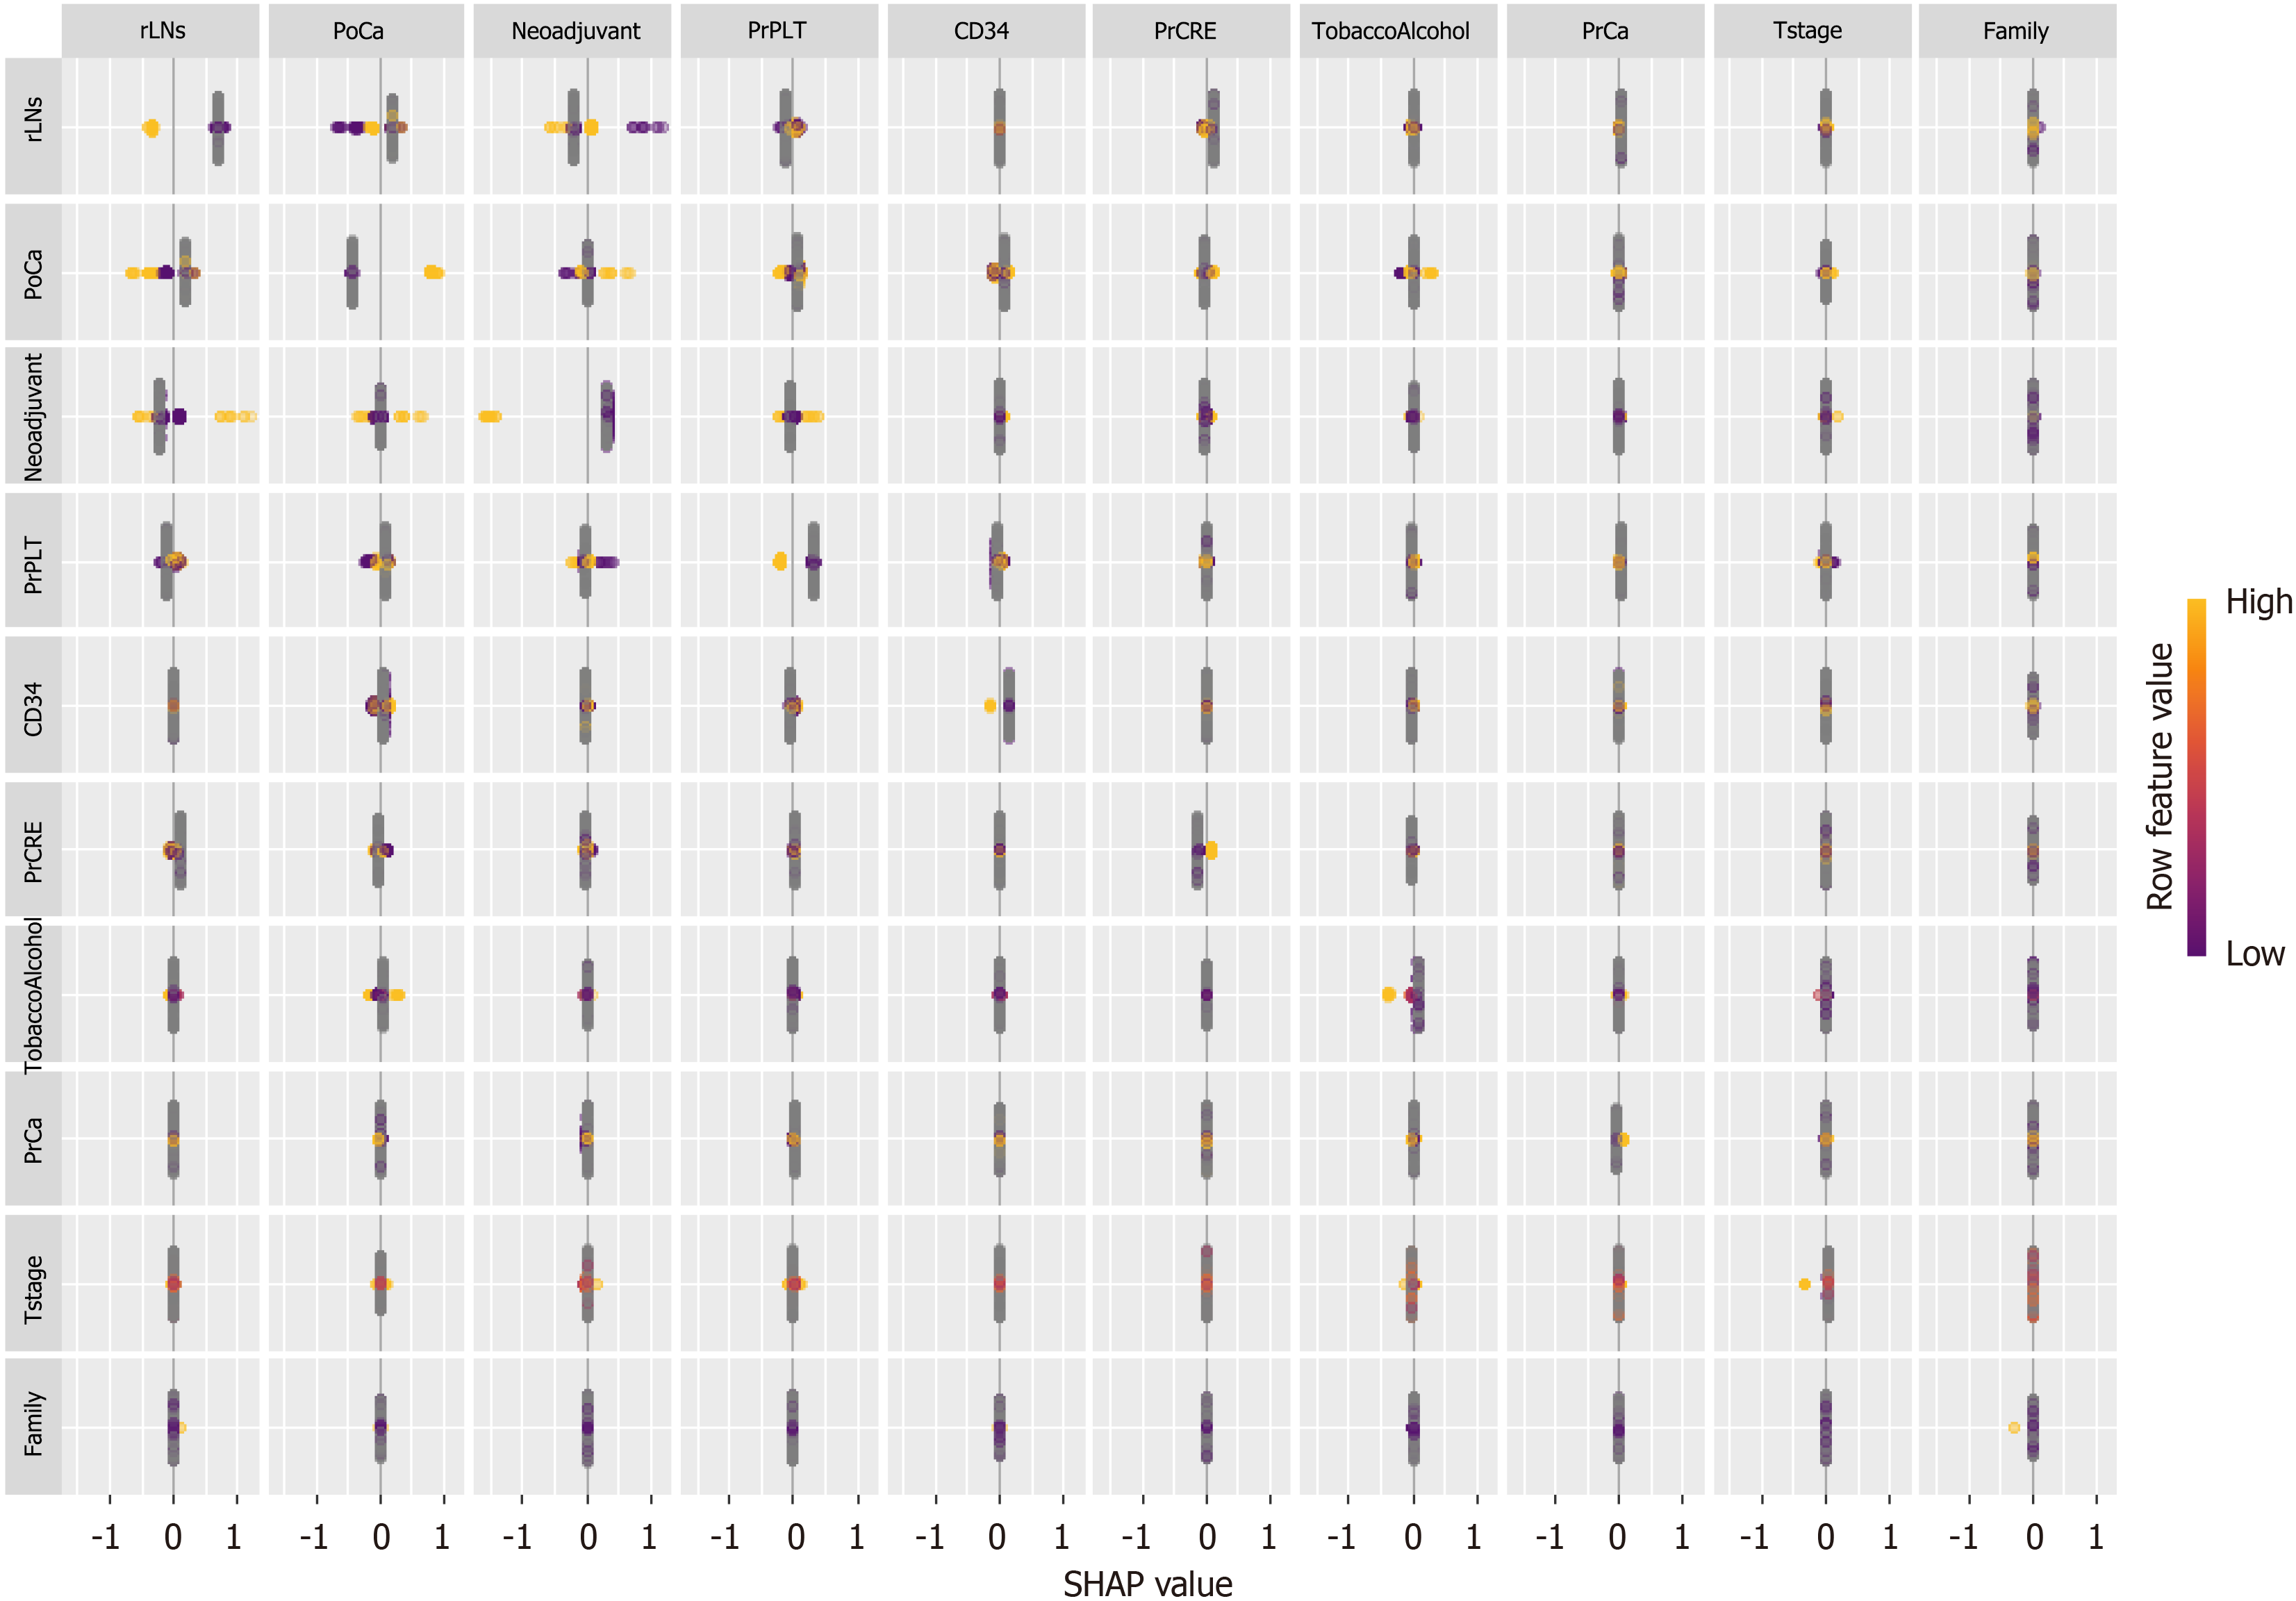
Figure 8 Interaction of significant factors based on SHapley Additive exPlanations.
SHAP: SHapley Additive exPlanations; PrCa: Preoperative calcium ion concentration; PrCRE: Preoperative serum creatinine concentration; PoCA: Postoperative calcium ion concentration; rLNs: Positive lymph node count; PrPLT: Preoperative platelet concentration.
- Citation: Kang BY, Qiao YH, Zhu J, Hu BL, Zhang ZC, Li JP, Pei YJ. Serum calcium-based interpretable machine learning model for predicting anastomotic leakage after rectal cancer resection: A multi-center study. World J Gastroenterol 2025; 31(19): 105283
- URL: https://www.wjgnet.com/1007-9327/full/v31/i19/105283.htm
- DOI: https://dx.doi.org/10.3748/wjg.v31.i19.105283


