Copyright
©The Author(s) 2025.
World J Gastroenterol. May 21, 2025; 31(19): 104563
Published online May 21, 2025. doi: 10.3748/wjg.v31.i19.104563
Published online May 21, 2025. doi: 10.3748/wjg.v31.i19.104563
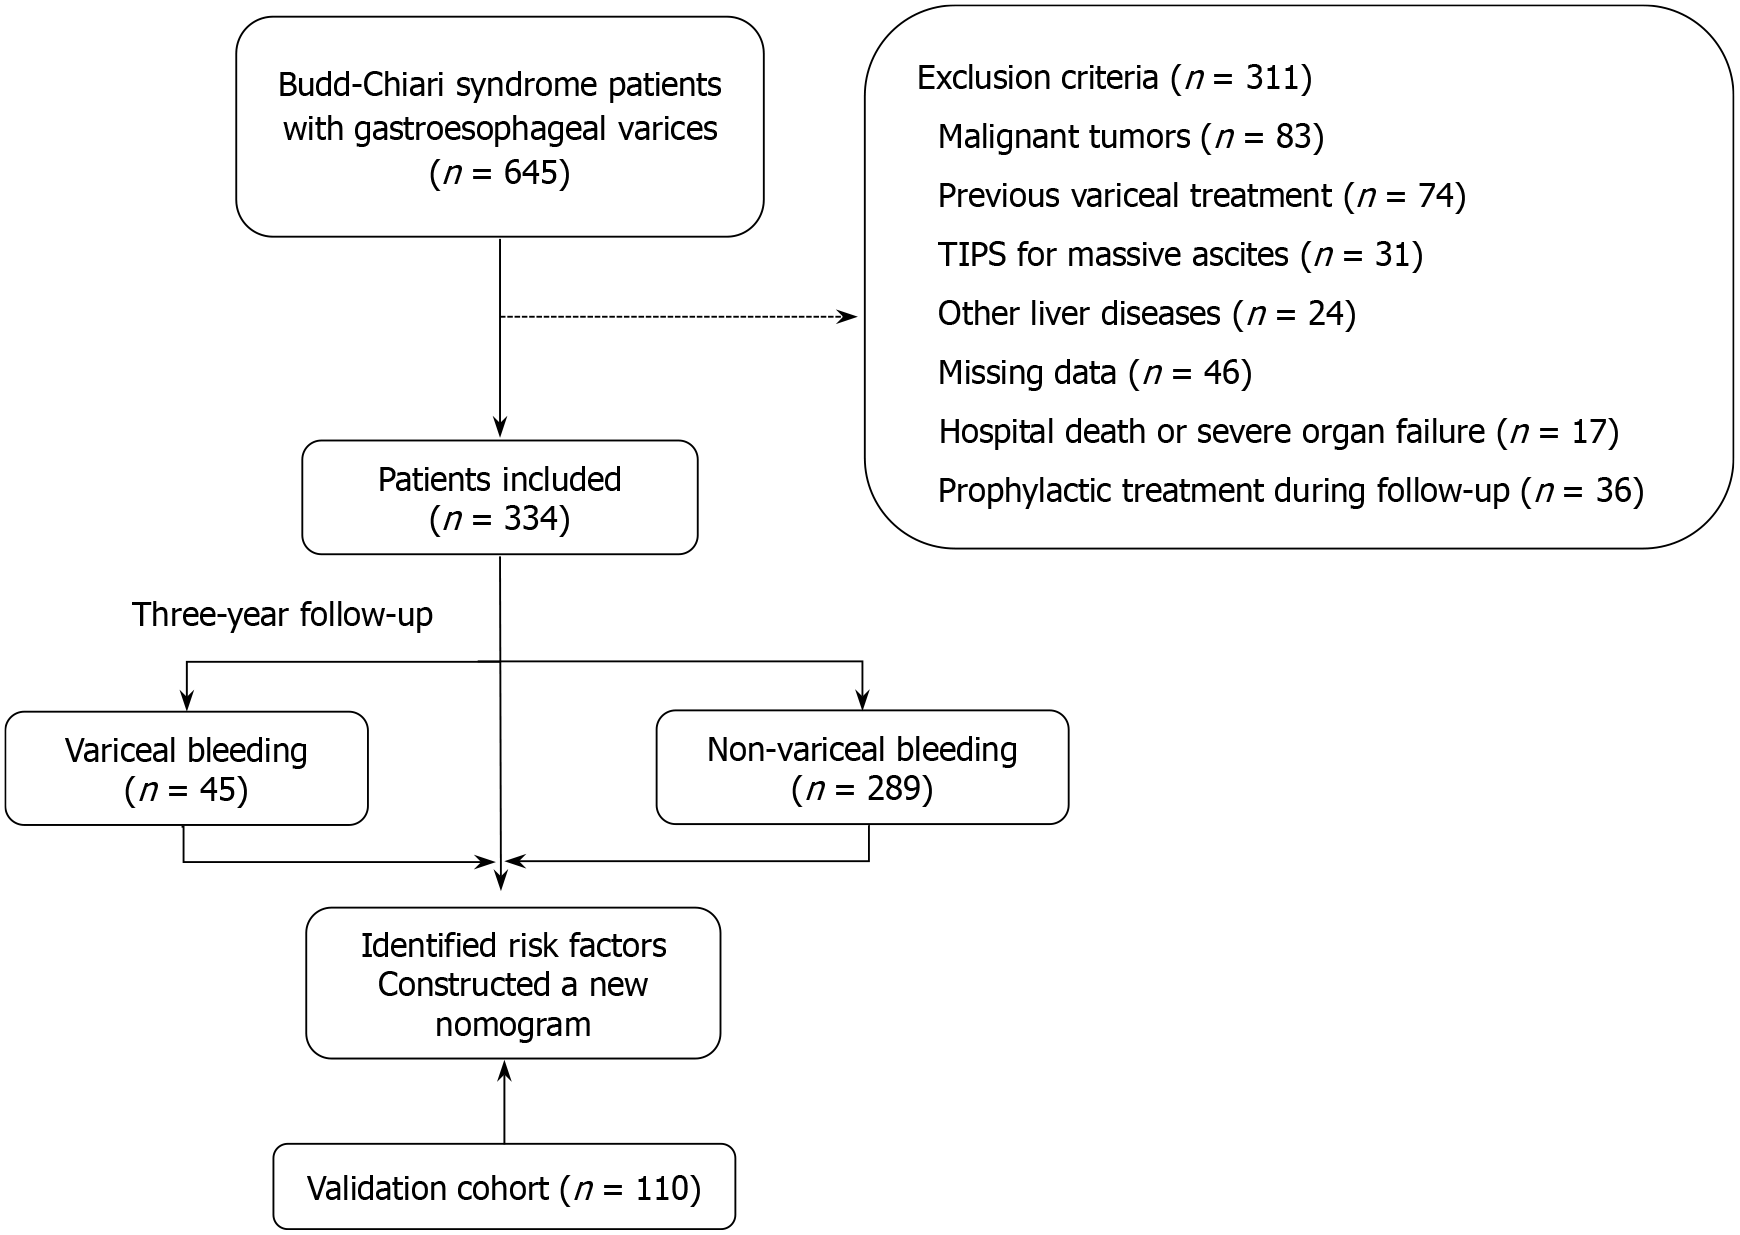
Figure 1 Study flow chart.
TIPS: Transjugular intrahepatic portosystemic shunt.
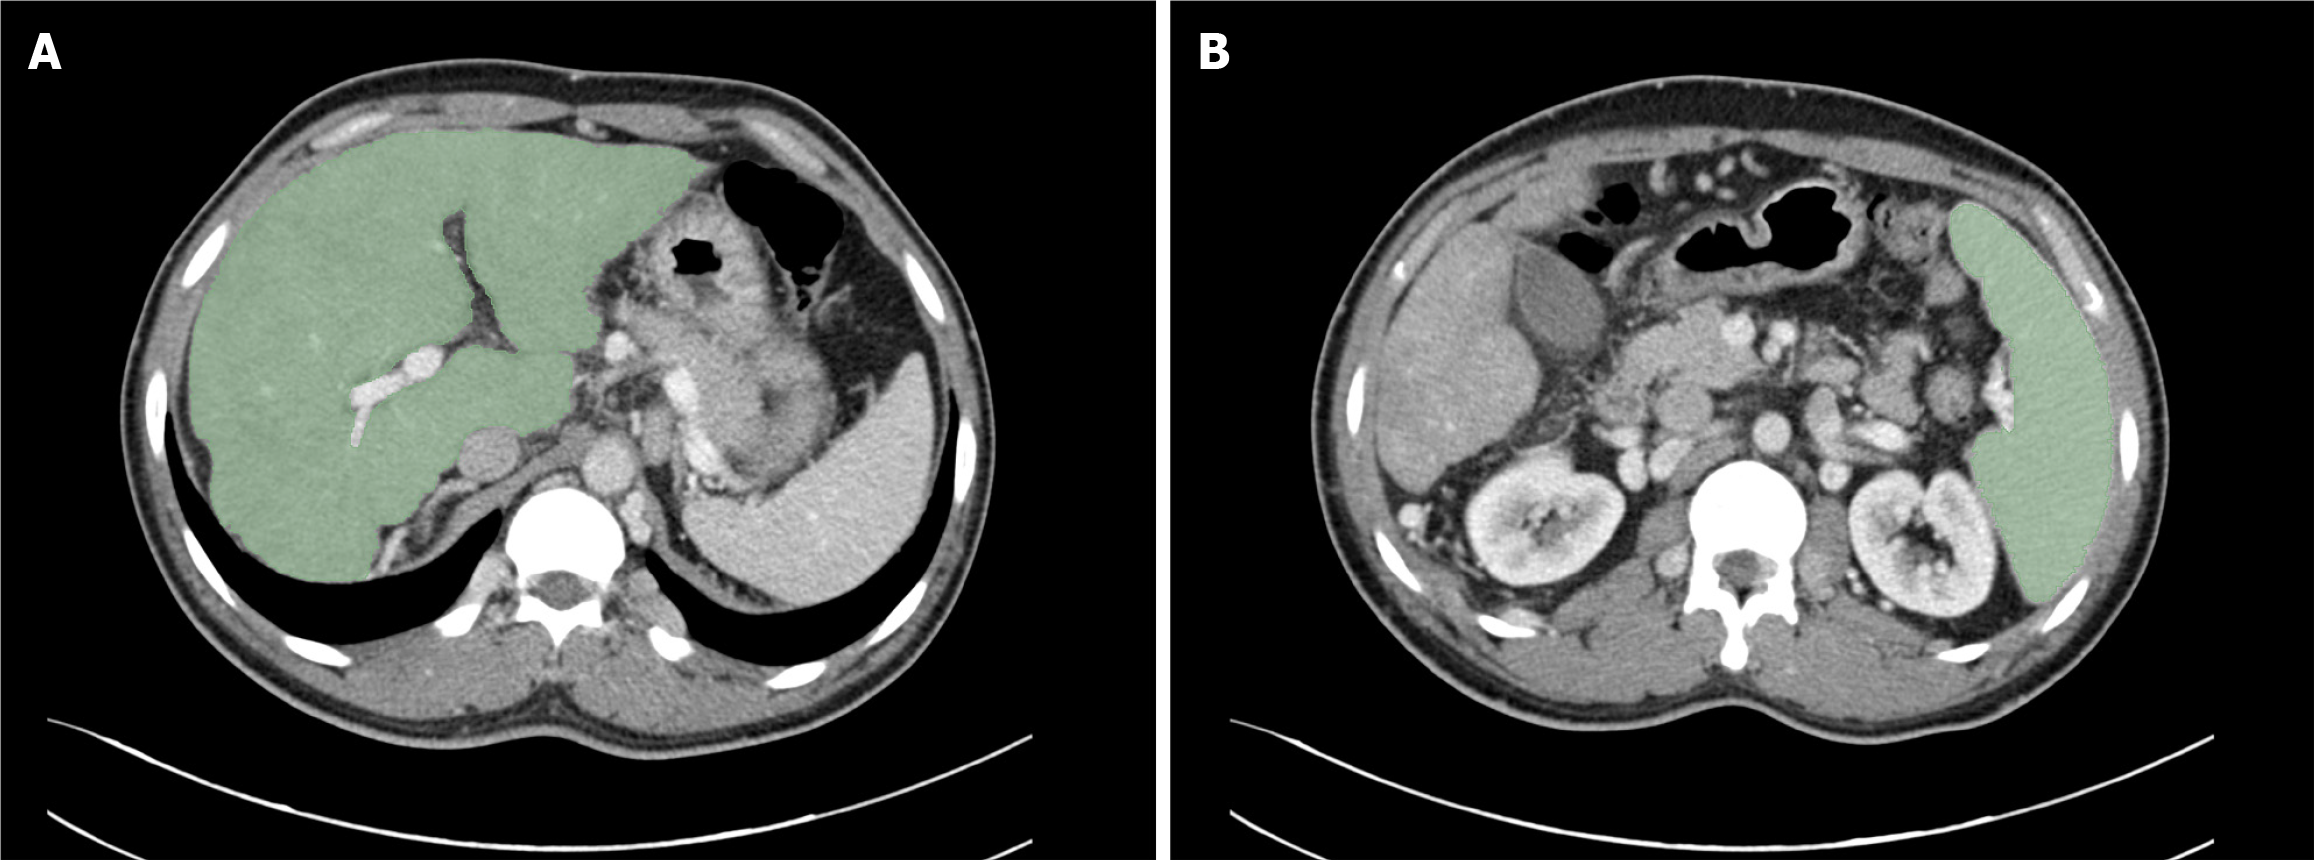
Figure 2 Regions of interest for the liver and spleen.
A: Region of interest (ROI) for the liver delineated at the hepatic hilum; B: ROI for the spleen delineated at the splenic hilum.
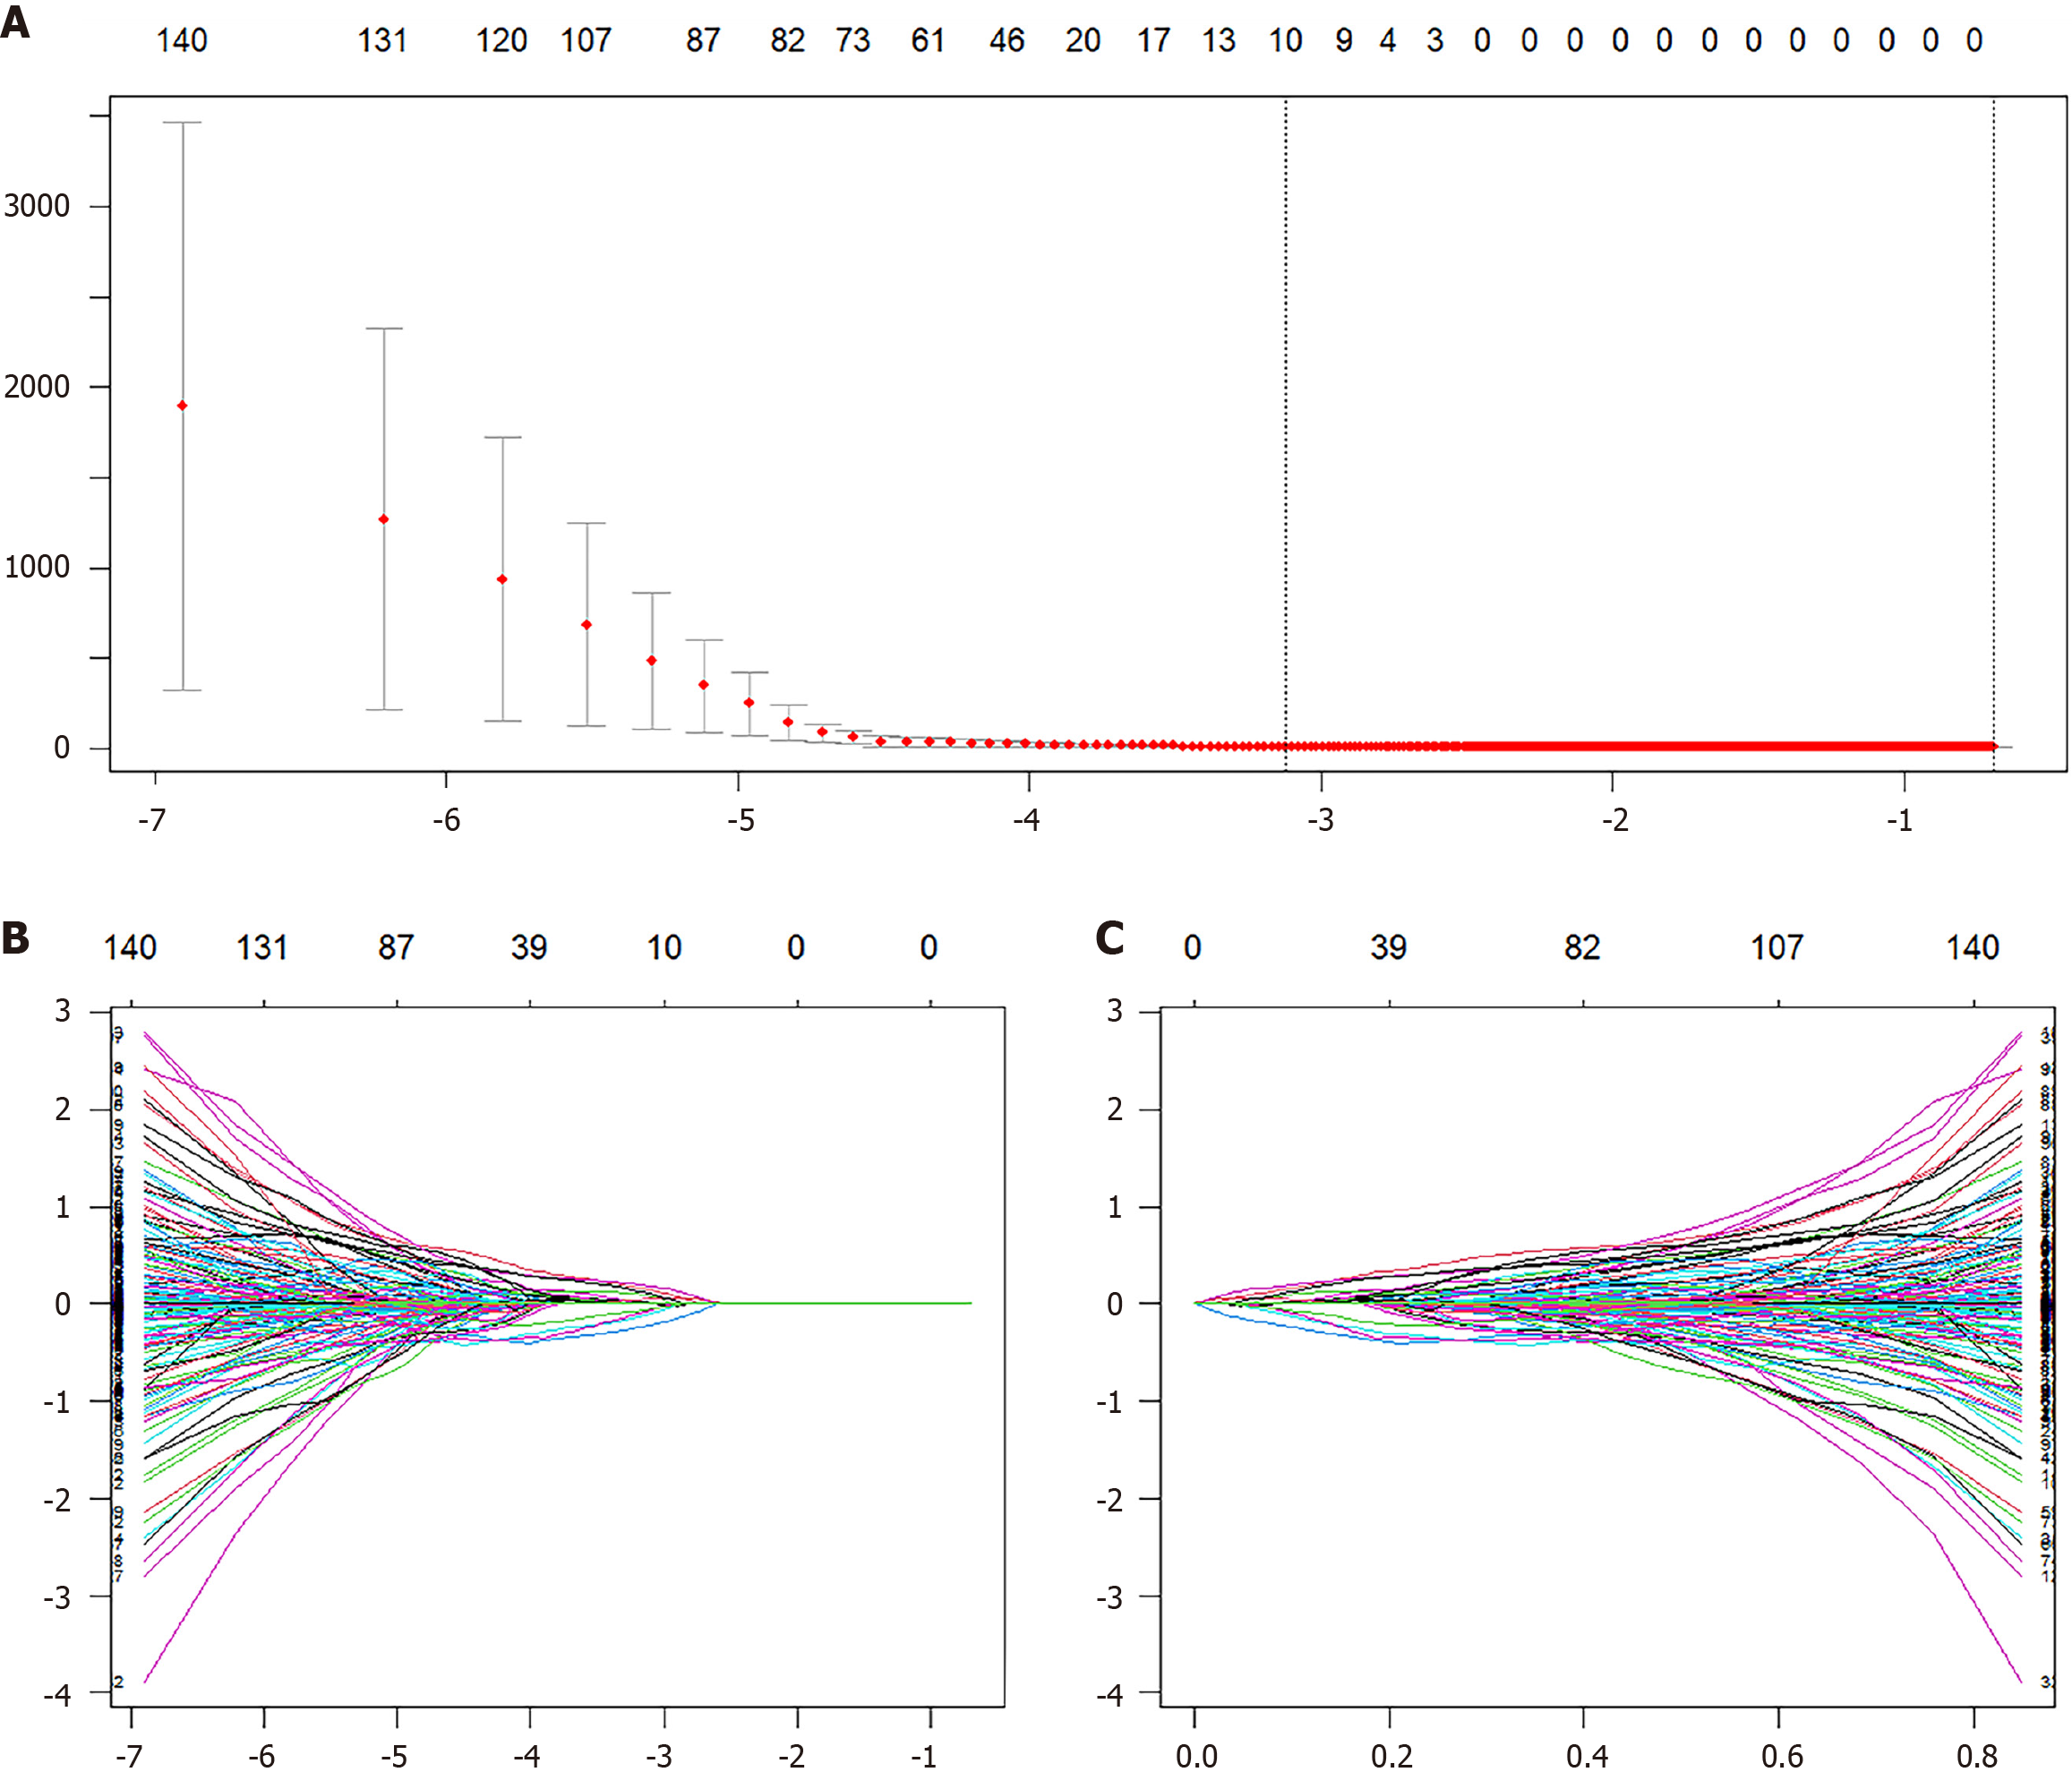
Figure 3 The LASSO-regularized Cox regression for radiomics feature selection is illustrated.
Ten-fold cross-validation was used to determine the optimal model parameter (λ). A: Relationship between the partial likelihood deviance and log(λ), which aided in selecting the optimal λ value; B: Coefficient profiles of all candidate features as a function of log(λ), with each colored line representing a different feature; C: Trajectories of the feature coefficients relative to the fraction of deviance explained.
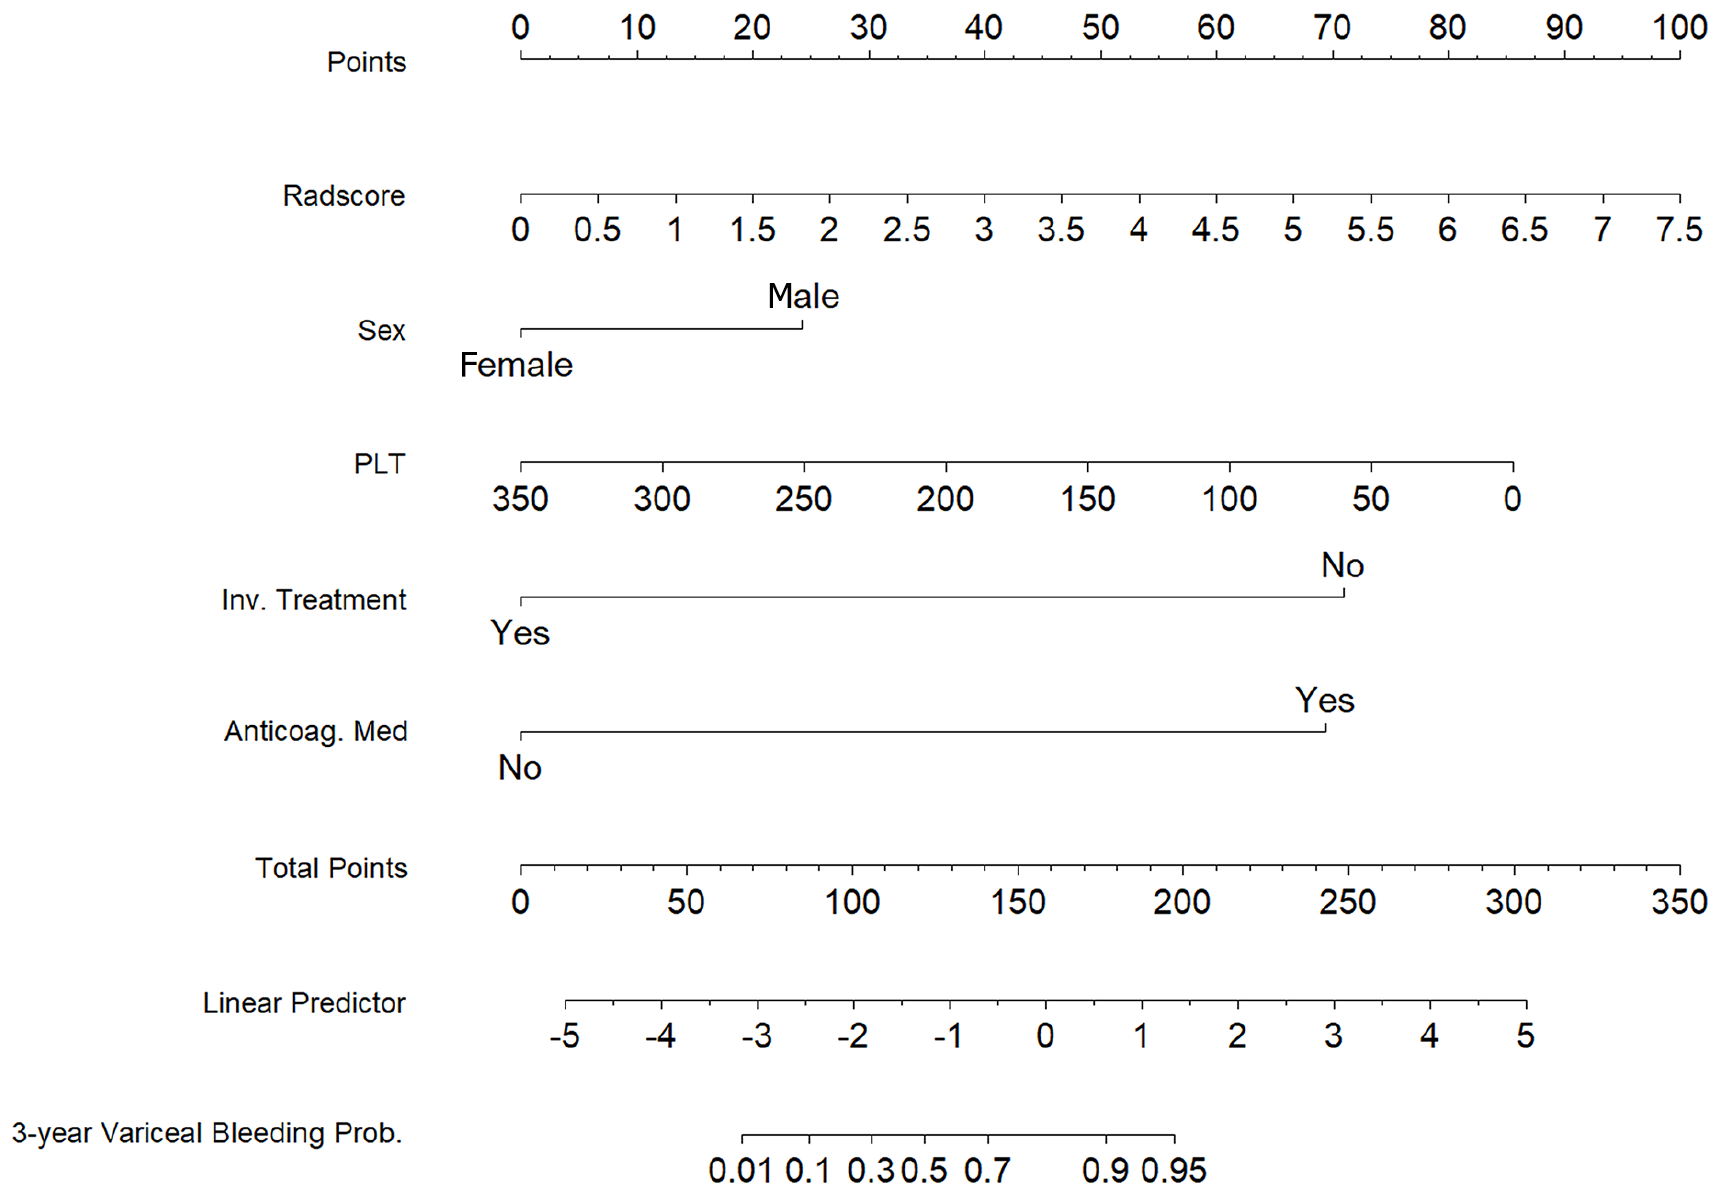
Figure 4 Nomogram for predicting the probability of variceal hemorrhage in patients with gastroesophageal varices associated with Budd-Chiari syndrome.
PLT: Platelet count; Inv.Treatment: Invasive treatment to relieve hepatic venous outflow obstruction; Anticoag.med: Use of anticoagulant medication.
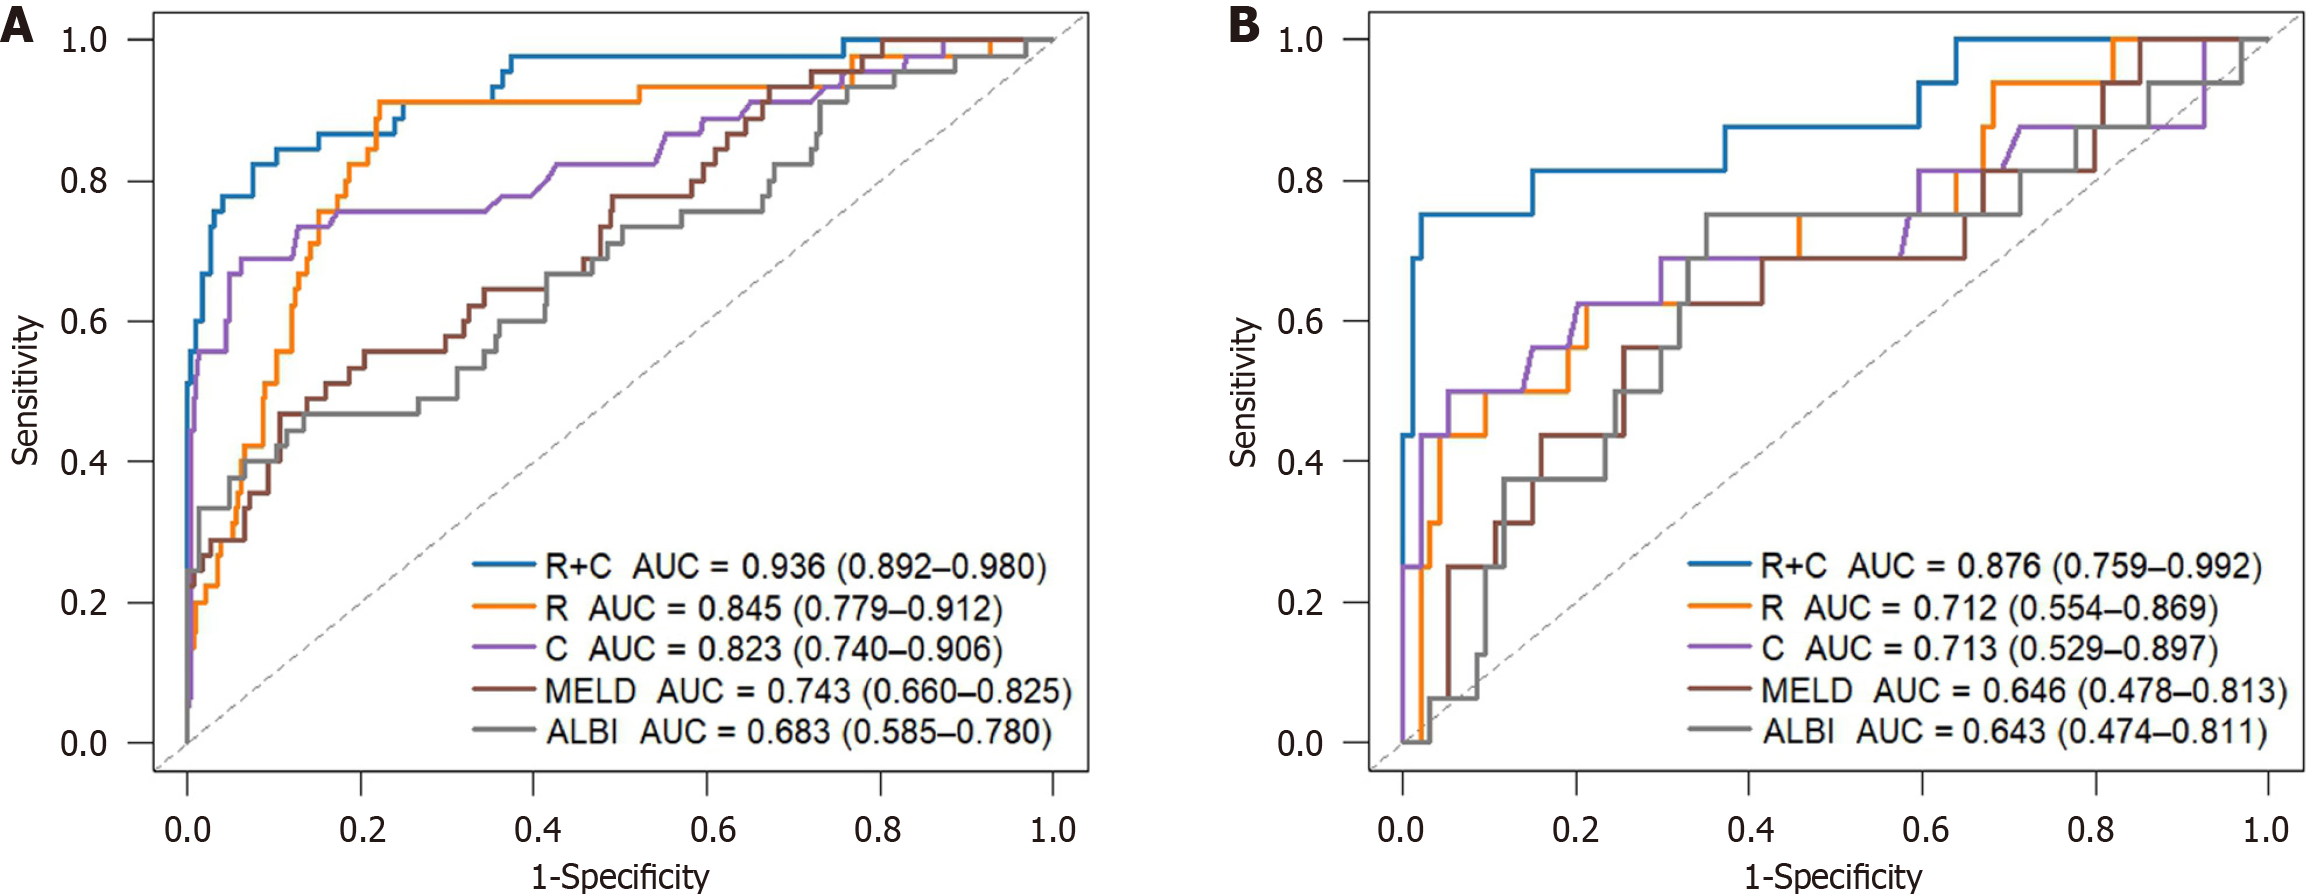
Figure 5 Receiver operating characteristic curves of the nomogram.
A: Receiver operating characteristic (ROC) curve in the training cohort; B: ROC curve in the validation cohort. R + C: Radiomic + clinical model; R: Radiomic model; C: Clinical model; MELD: Model for end-stage liver disease; ALBI: Albumin-bilirubin; AUC: The area under the receiver operating characteristic curves.
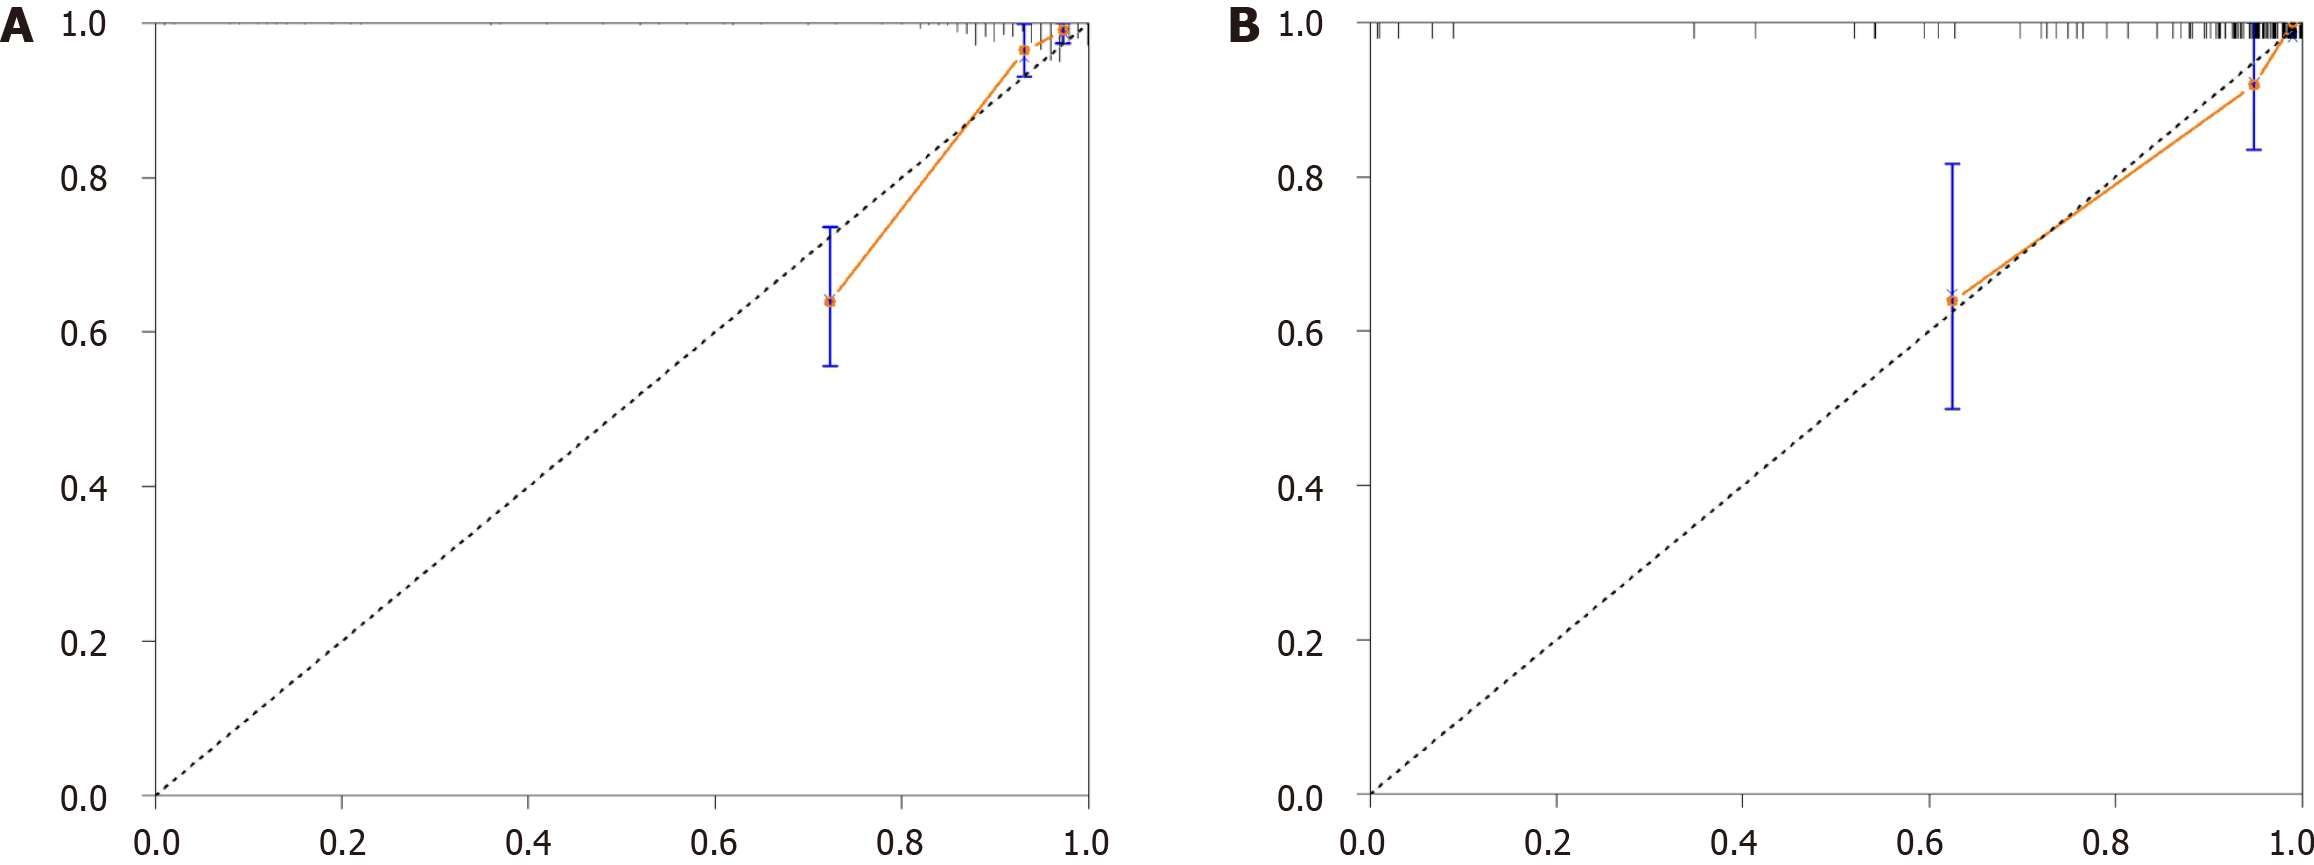
Figure 6 Calibration curves of the radiomic and clinical model.
A: Calibration curve in the training cohort; B: Calibration curve in the validation cohort.
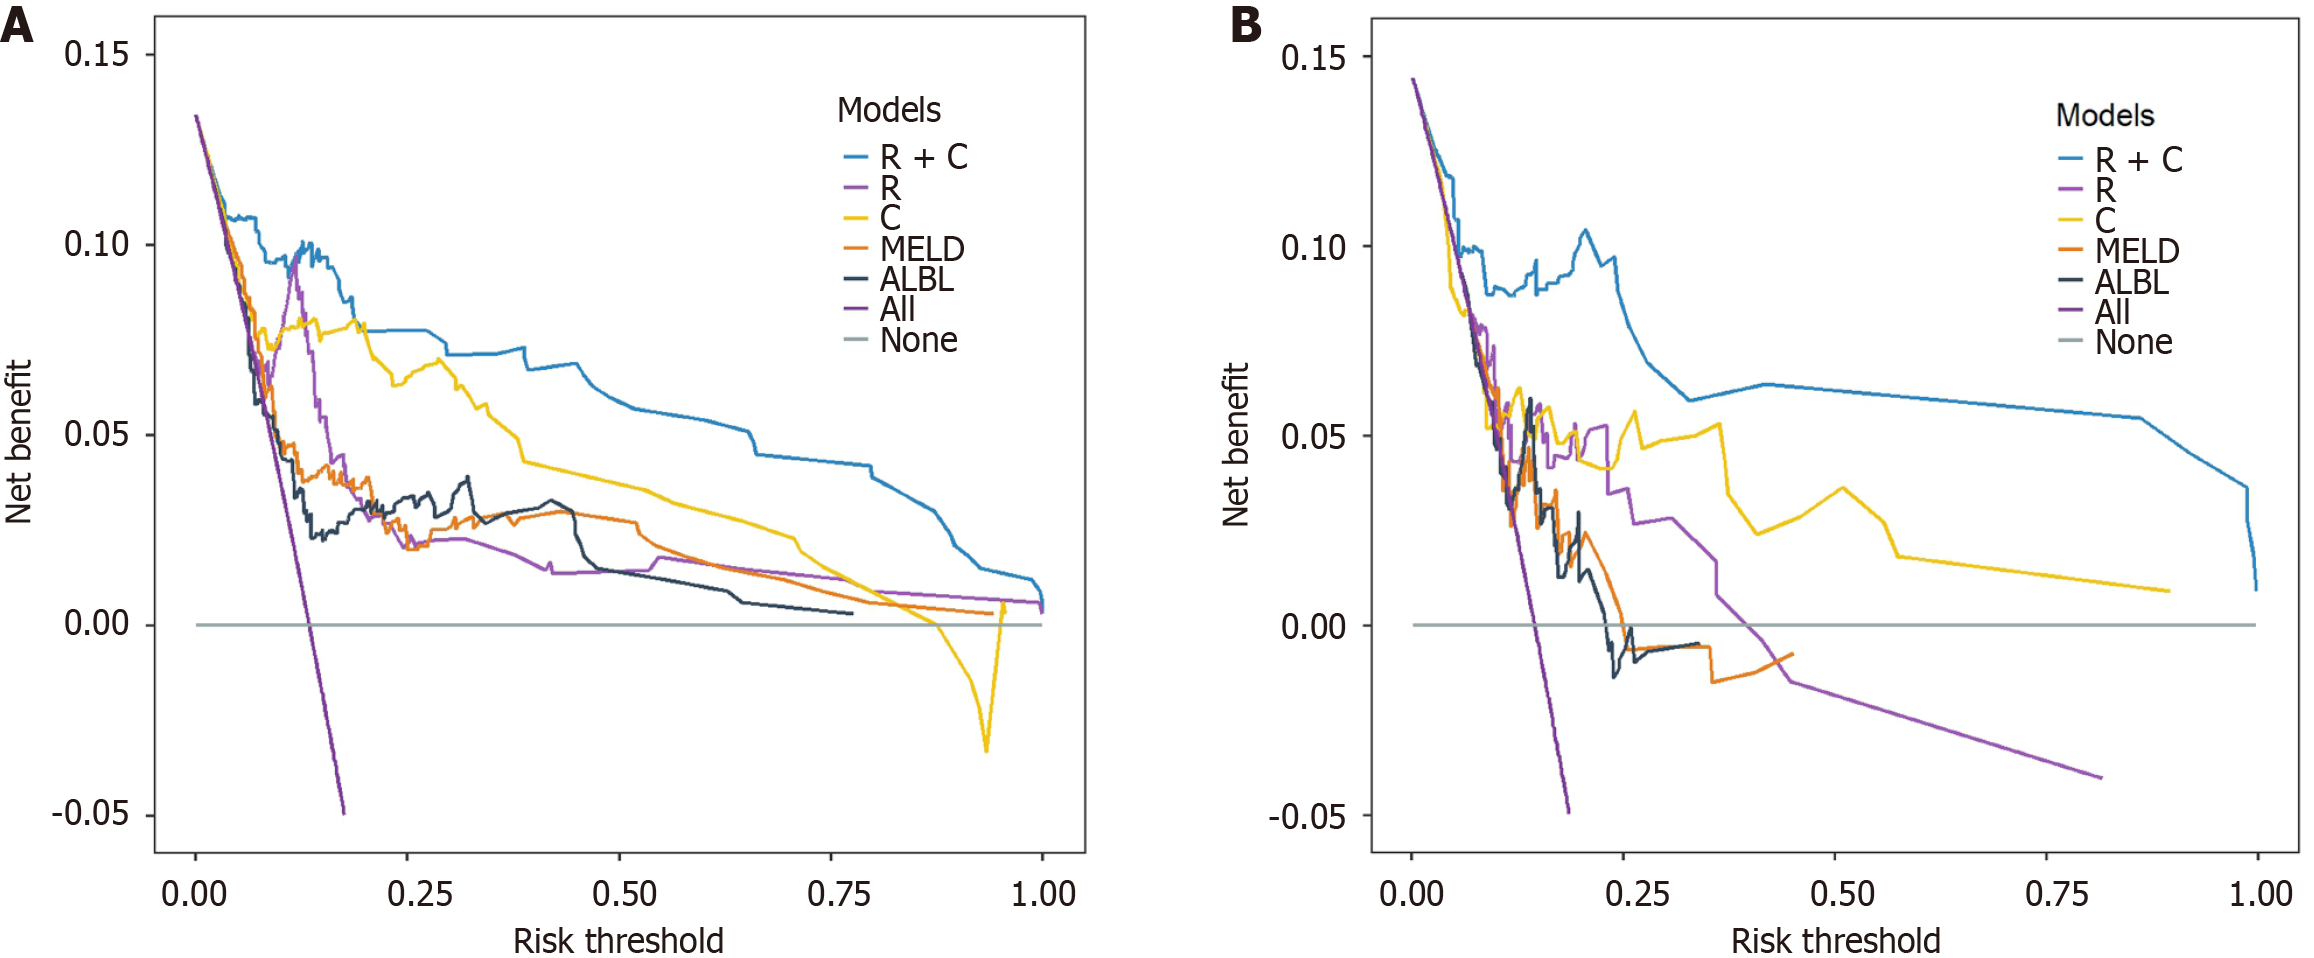
Figure 7 Decision curve analysis of the nomogram.
A: Decision curve analysis (DCA) in the training cohort; B: DCA in the validation cohort. R + C: Radiomic + clinical model; R: Radiomic model; C: Clinical model; MELD: Model for end-stage liver disease; ALBI: Albumin-bilirubin.
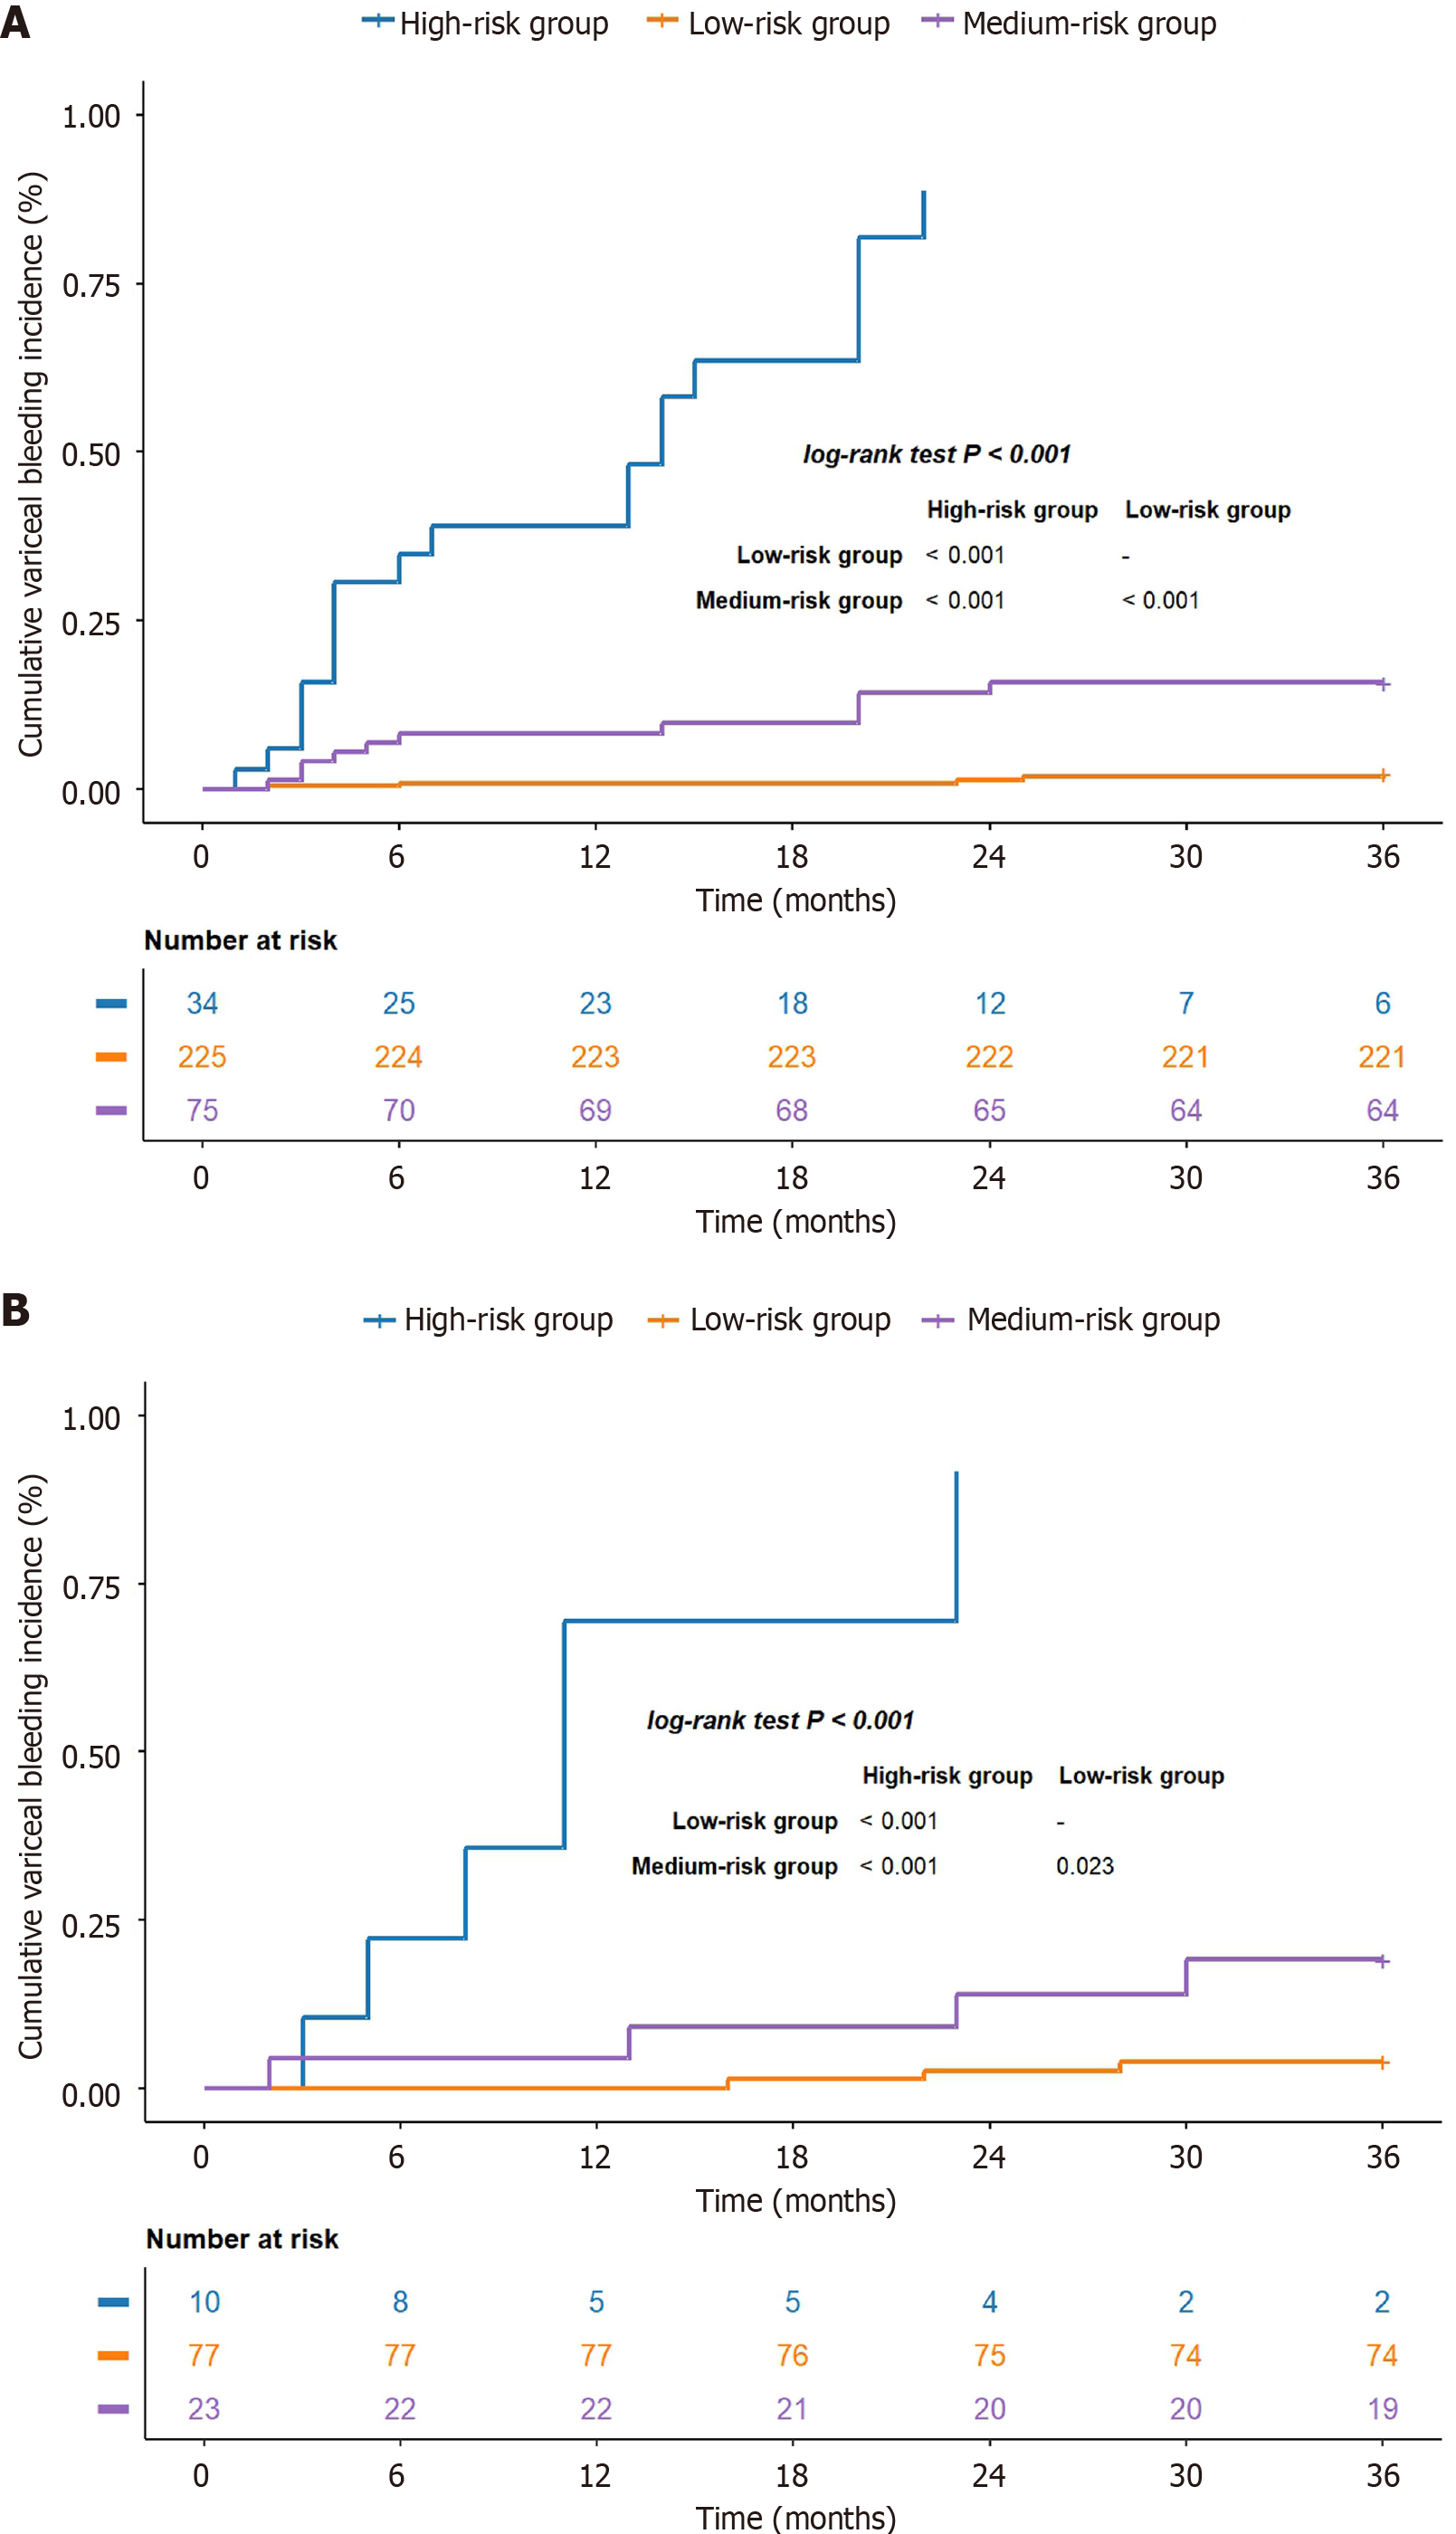
Figure 8 Cumulative risk curves stratified by the risk score.
A: Cumulative risk curve in the training cohort; B: Cumulative risk curve in the validation cohort.
- Citation: Wang ZD, Nan HJ, Li SX, Li LH, Liu ZC, Guo HH, Li L, Liu SY, Li H, Bai YL, Dang XW. Development and validation of a radiomics-based prediction model for variceal bleeding in patients with Budd-Chiari syndrome-related gastroesophageal varices. World J Gastroenterol 2025; 31(19): 104563
- URL: https://www.wjgnet.com/1007-9327/full/v31/i19/104563.htm
- DOI: https://dx.doi.org/10.3748/wjg.v31.i19.104563


