Copyright
©The Author(s) 2025.
World J Gastroenterol. May 14, 2025; 31(18): 105836
Published online May 14, 2025. doi: 10.3748/wjg.v31.i18.105836
Published online May 14, 2025. doi: 10.3748/wjg.v31.i18.105836
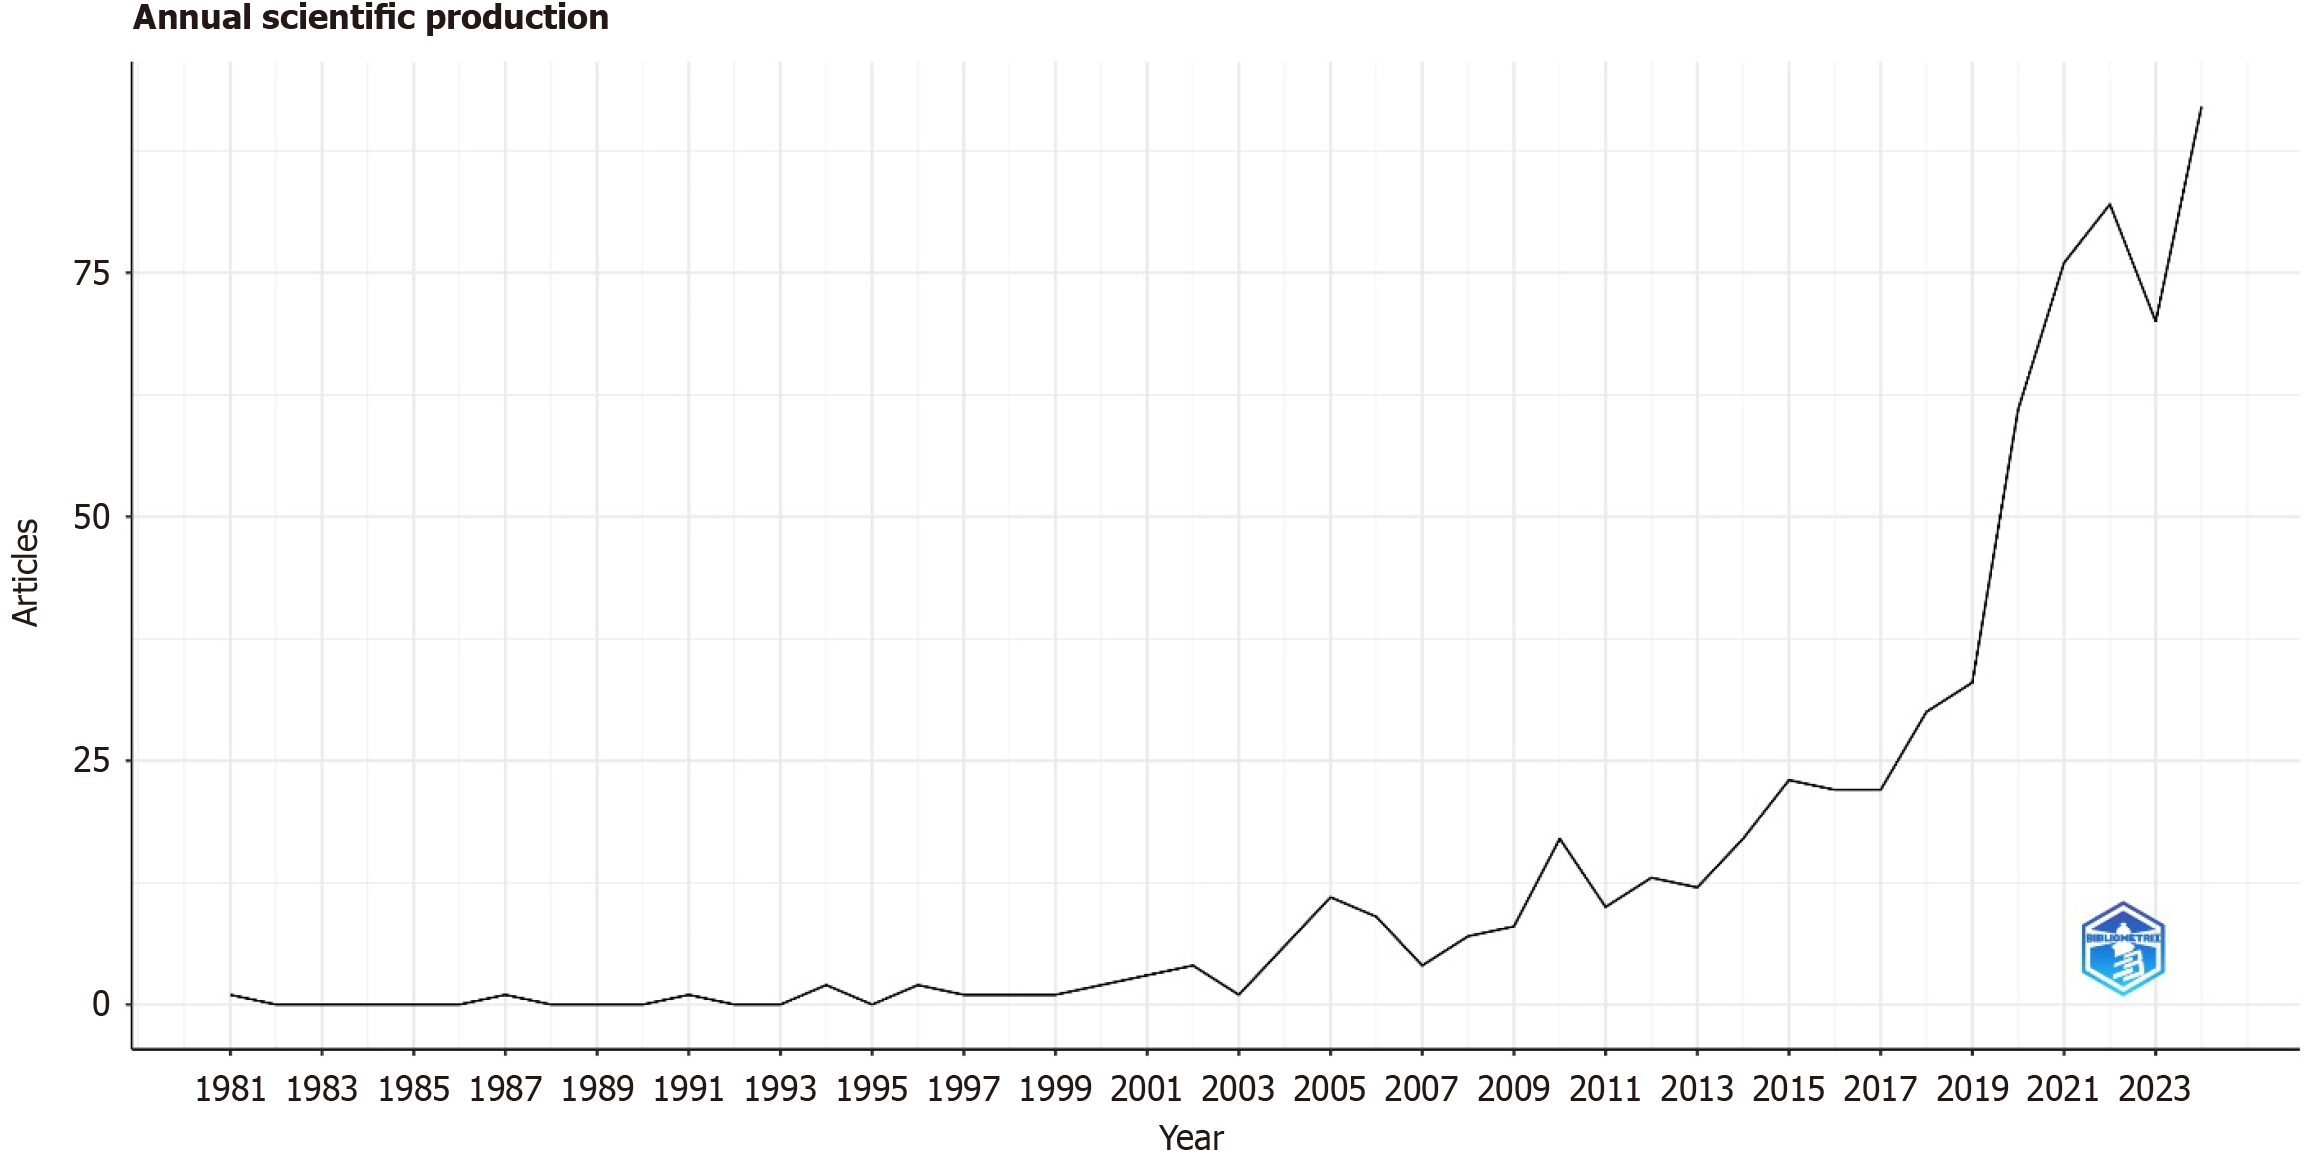
Figure 1 Annual scientific production (1981-2024).
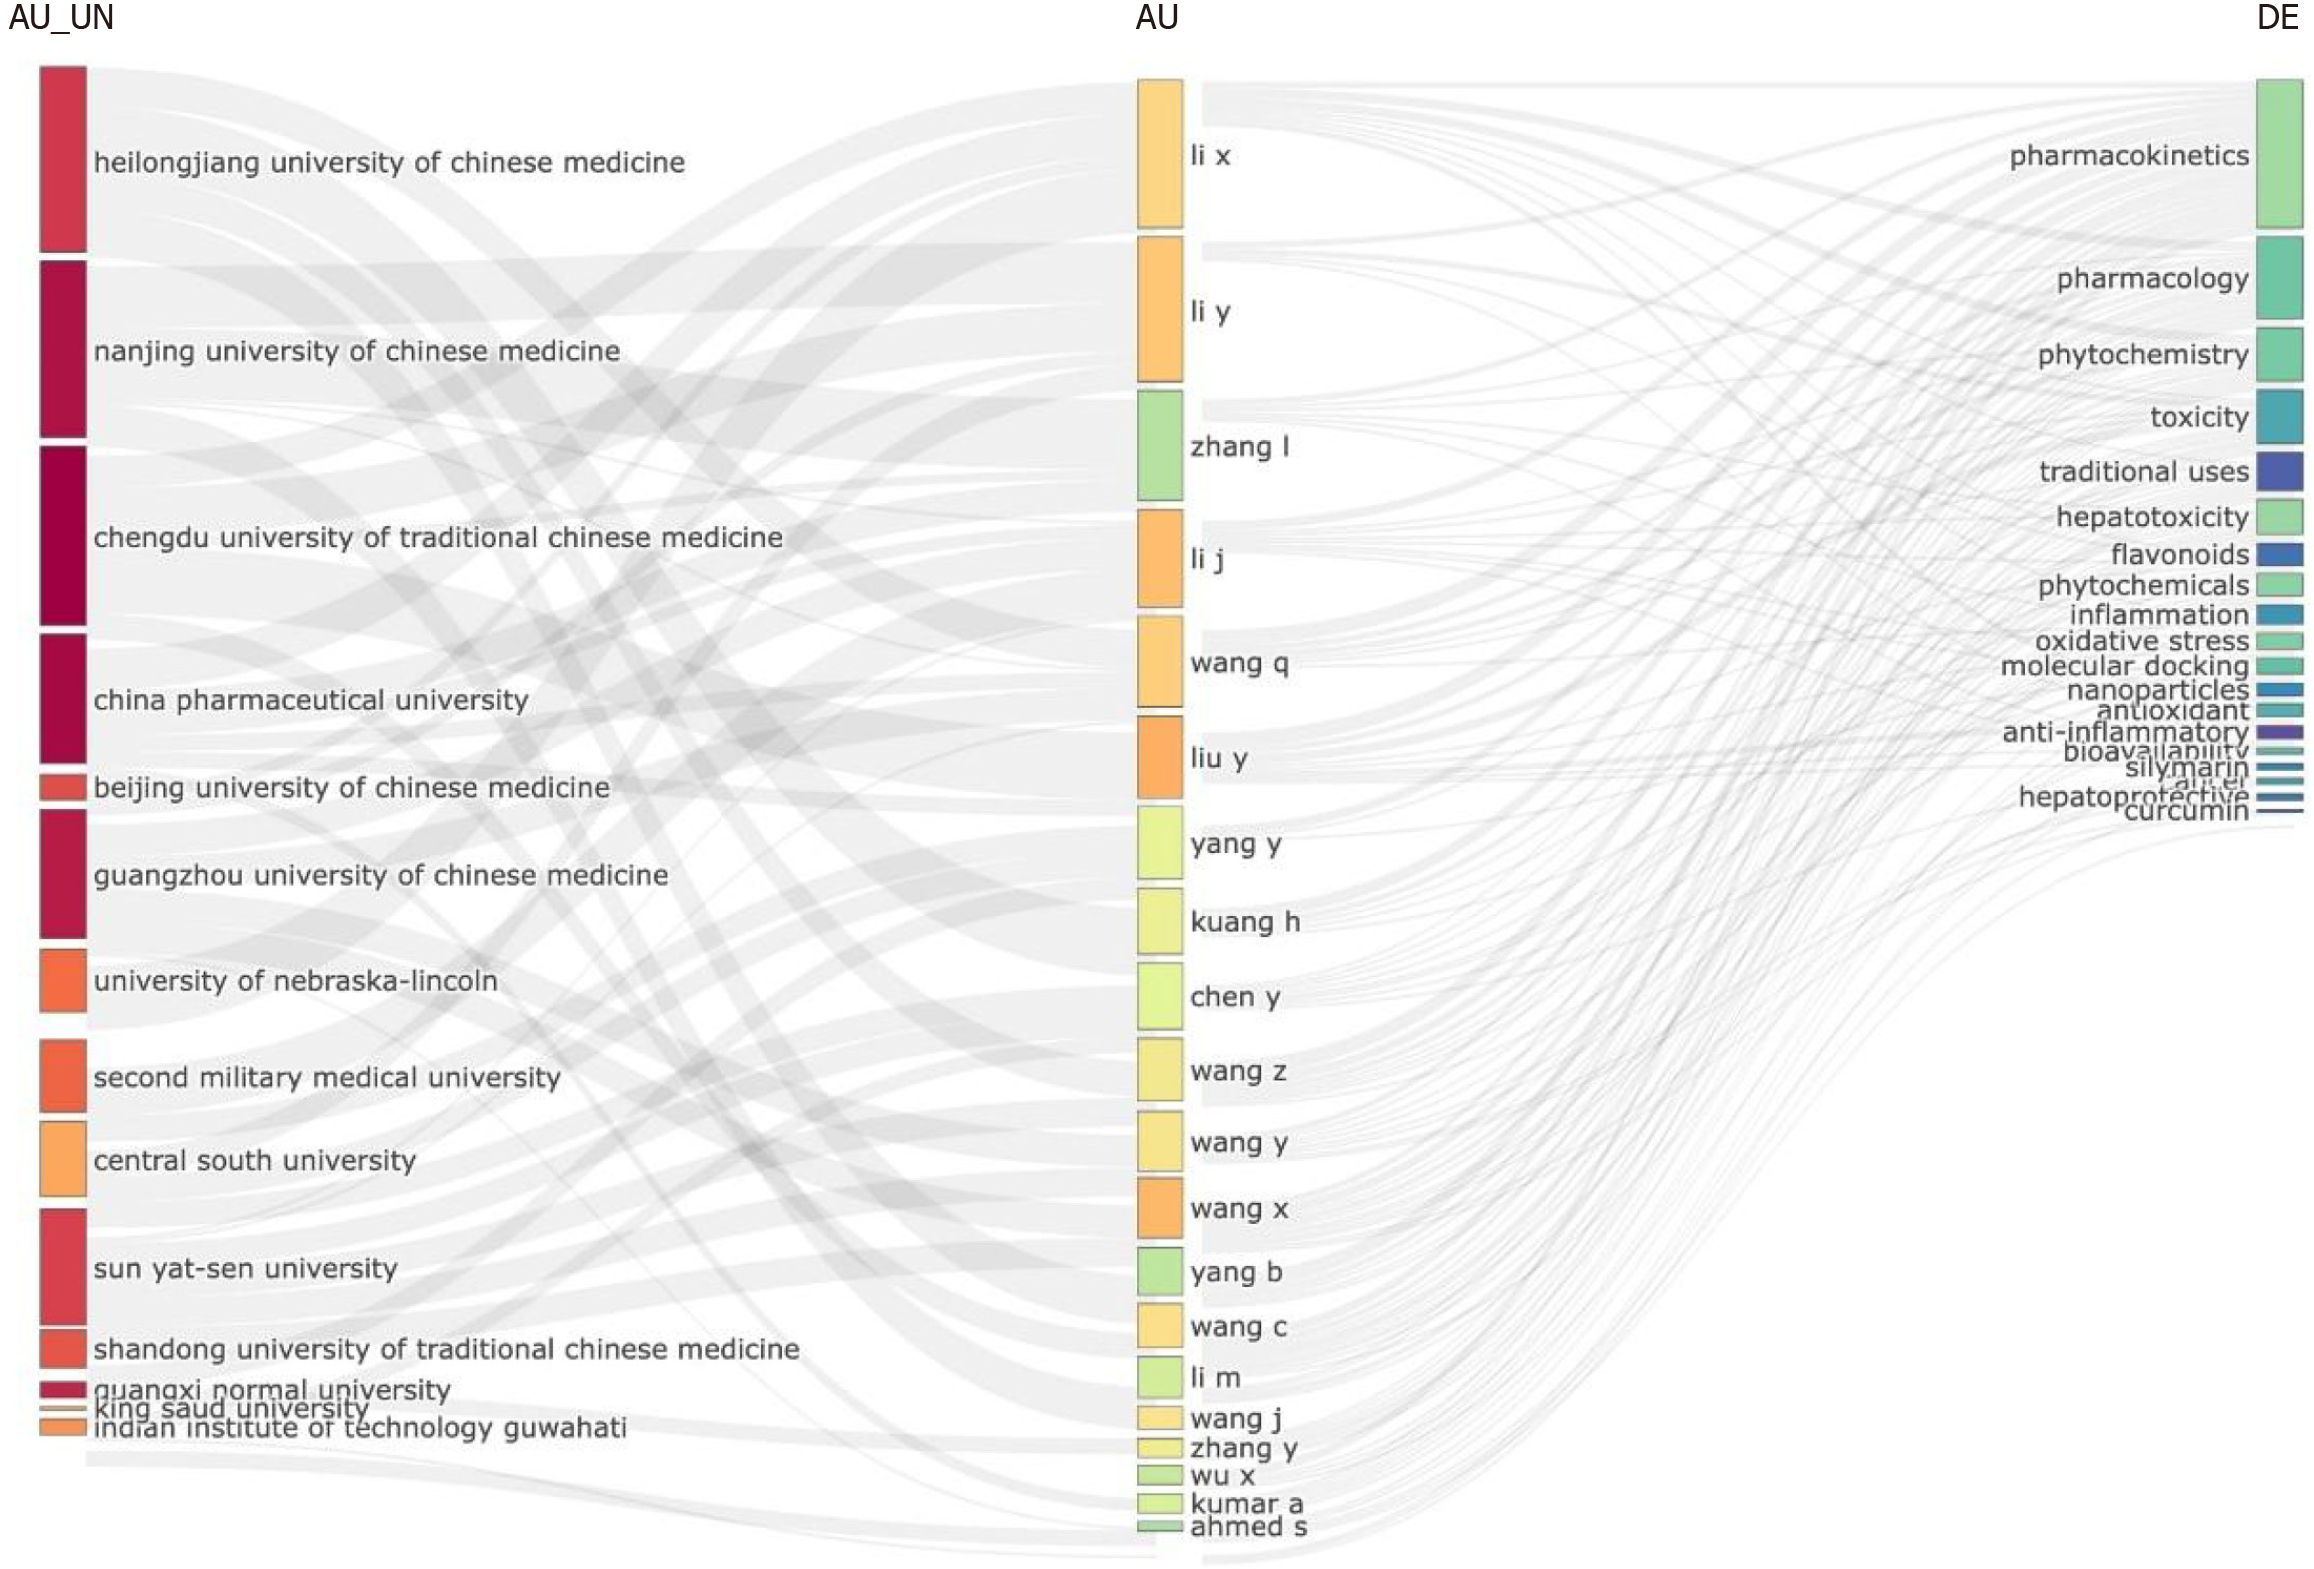
Figure 2 Three-field plot showing university affiliations, authors, and research keywords.
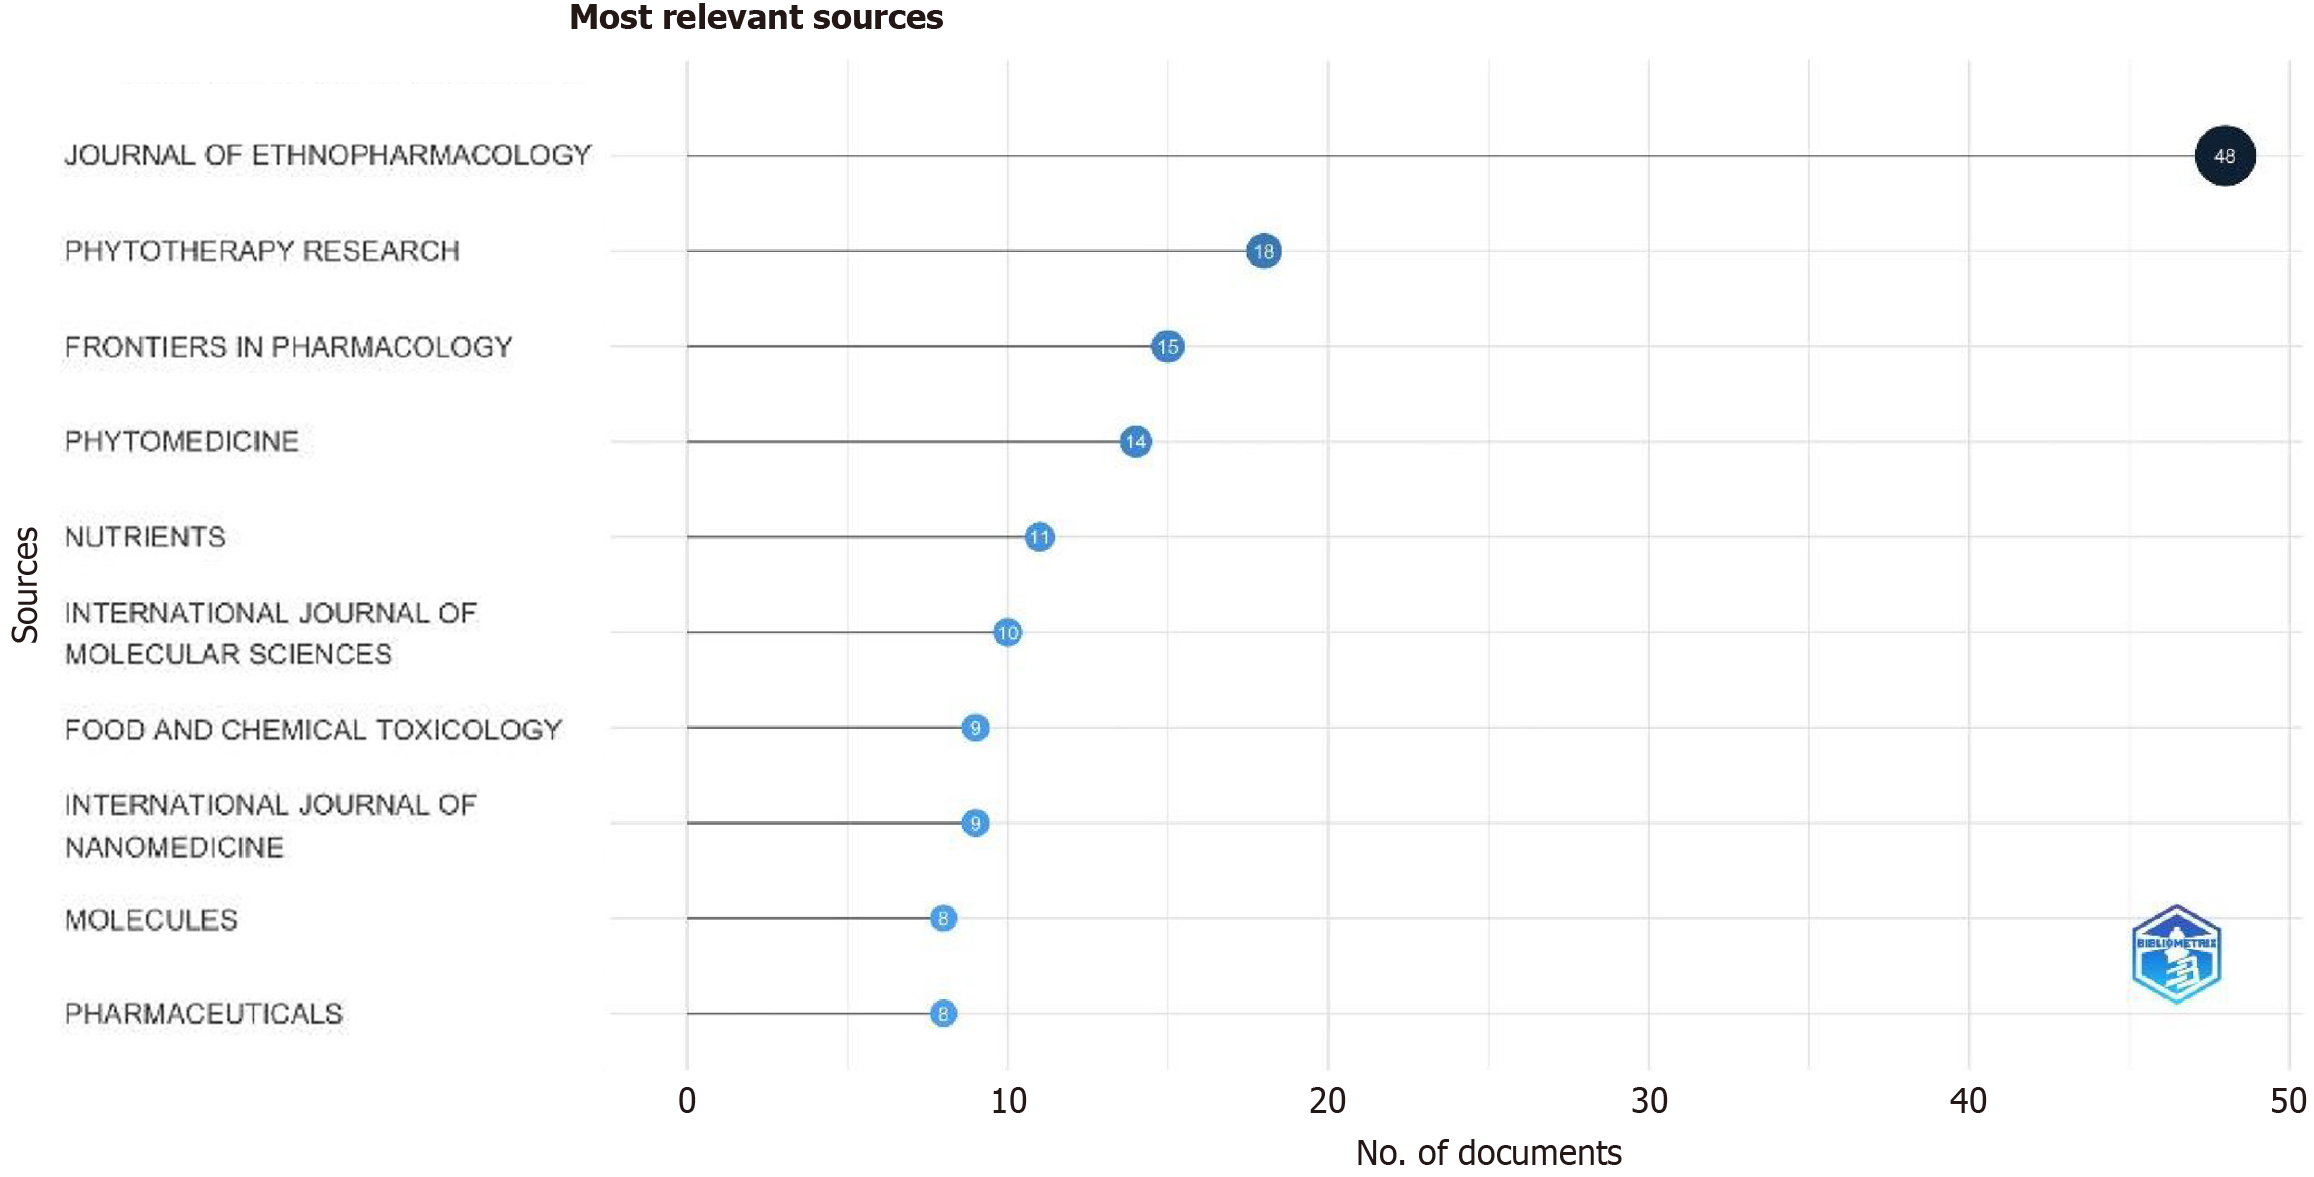
Figure 3 Most relevant sources of research.
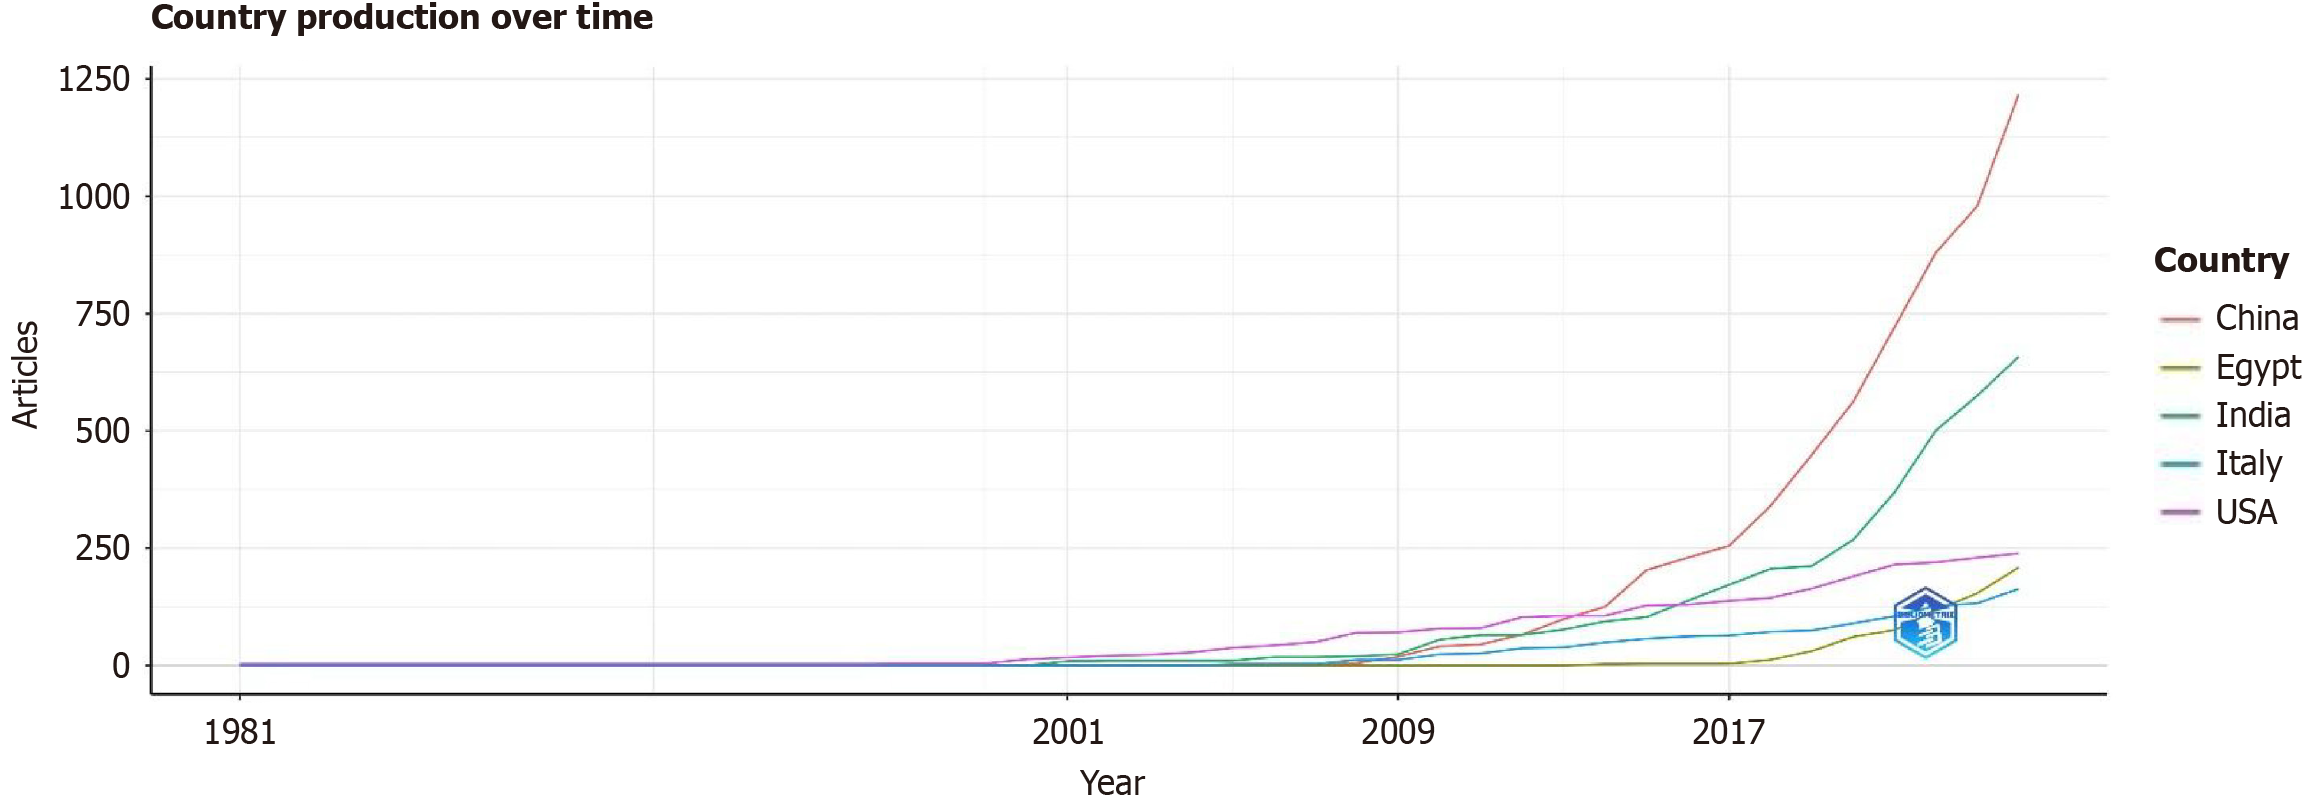
Figure 4 Country production over time.
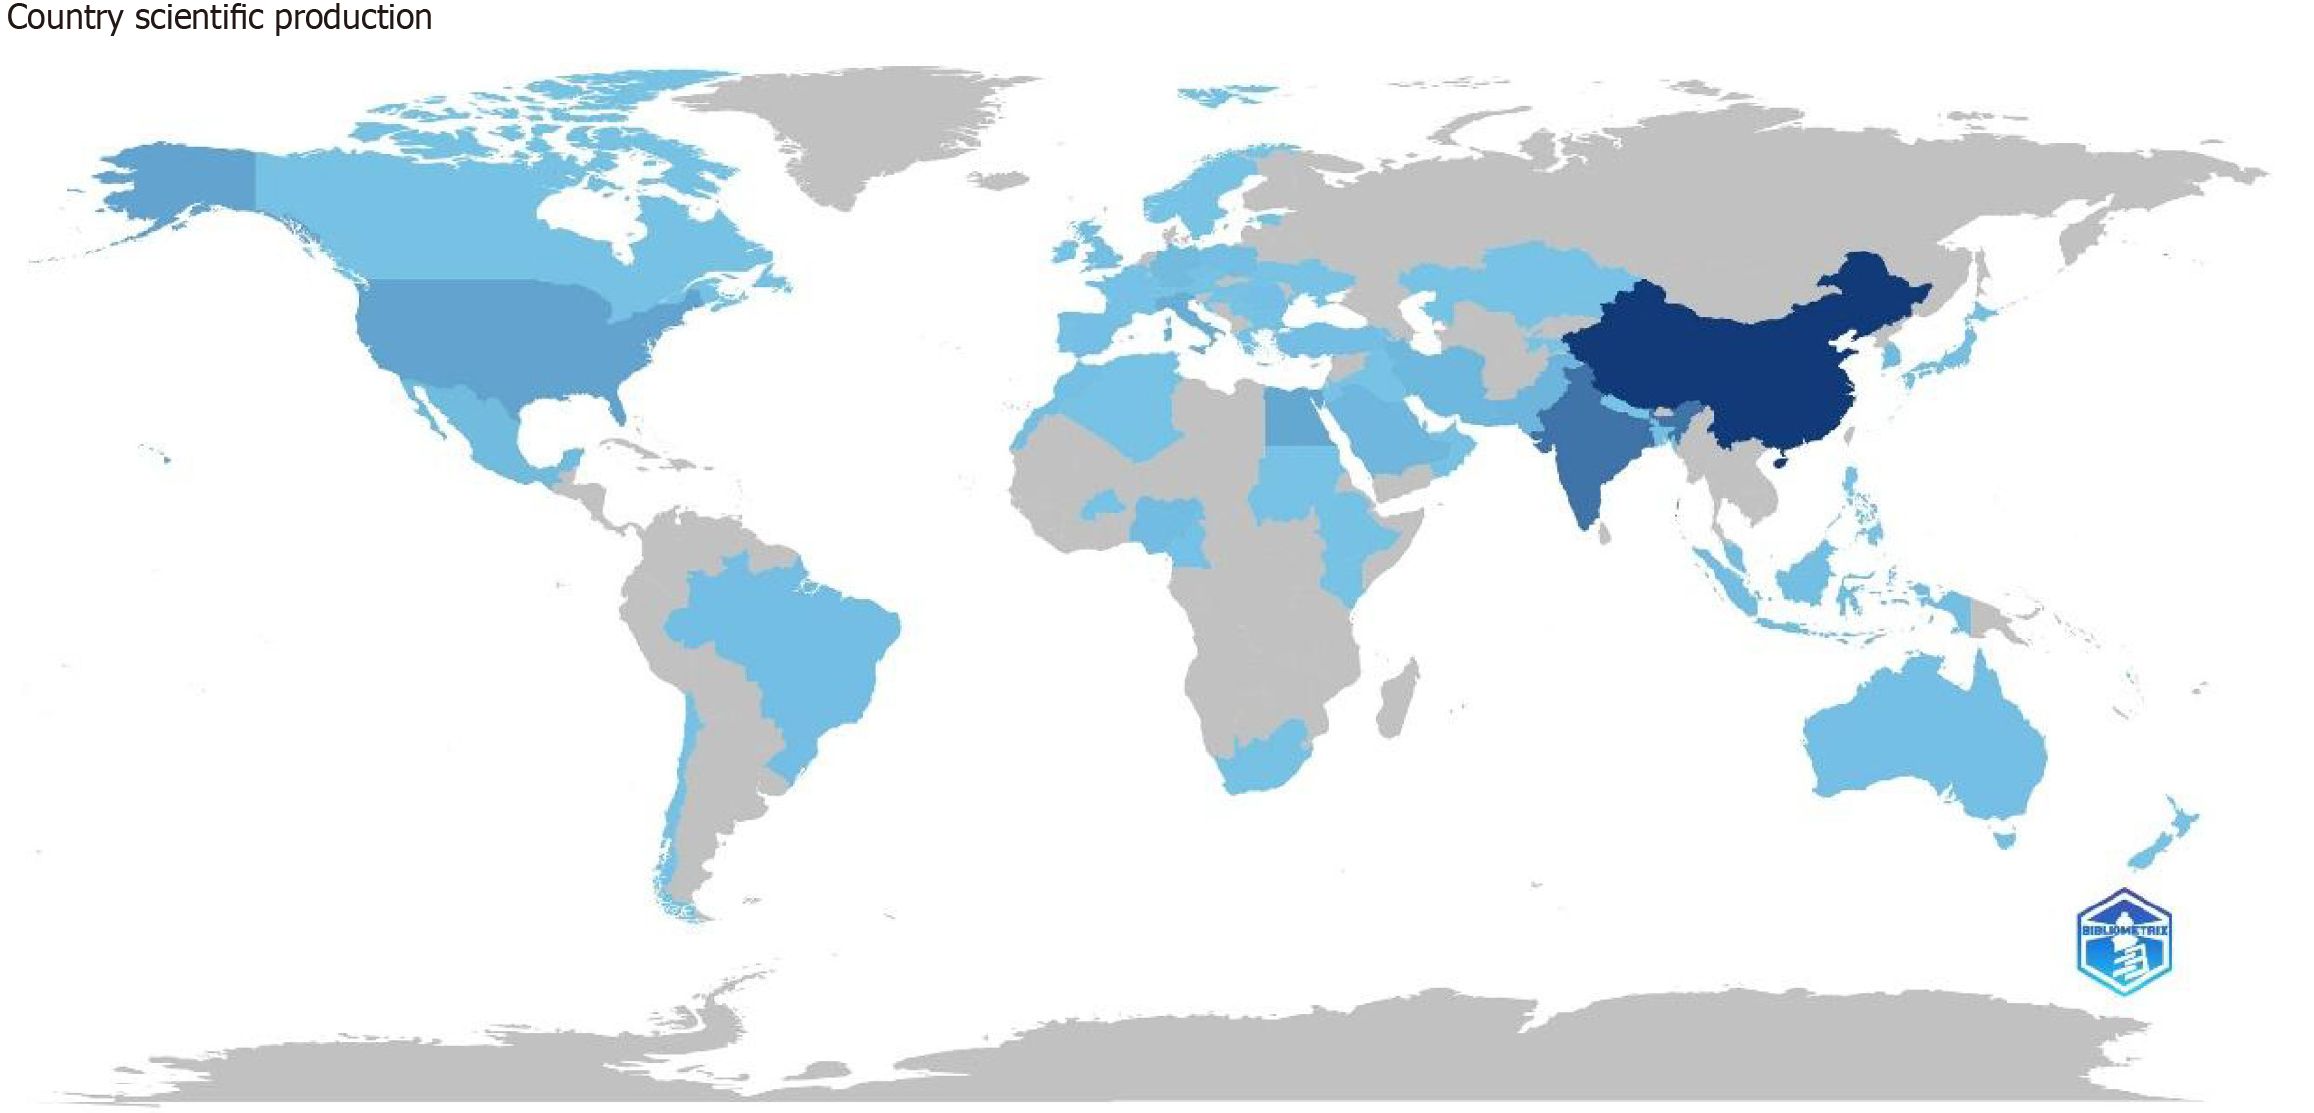
Figure 5 World map of country scientific production in liver health, plant extracts, and drug delivery.
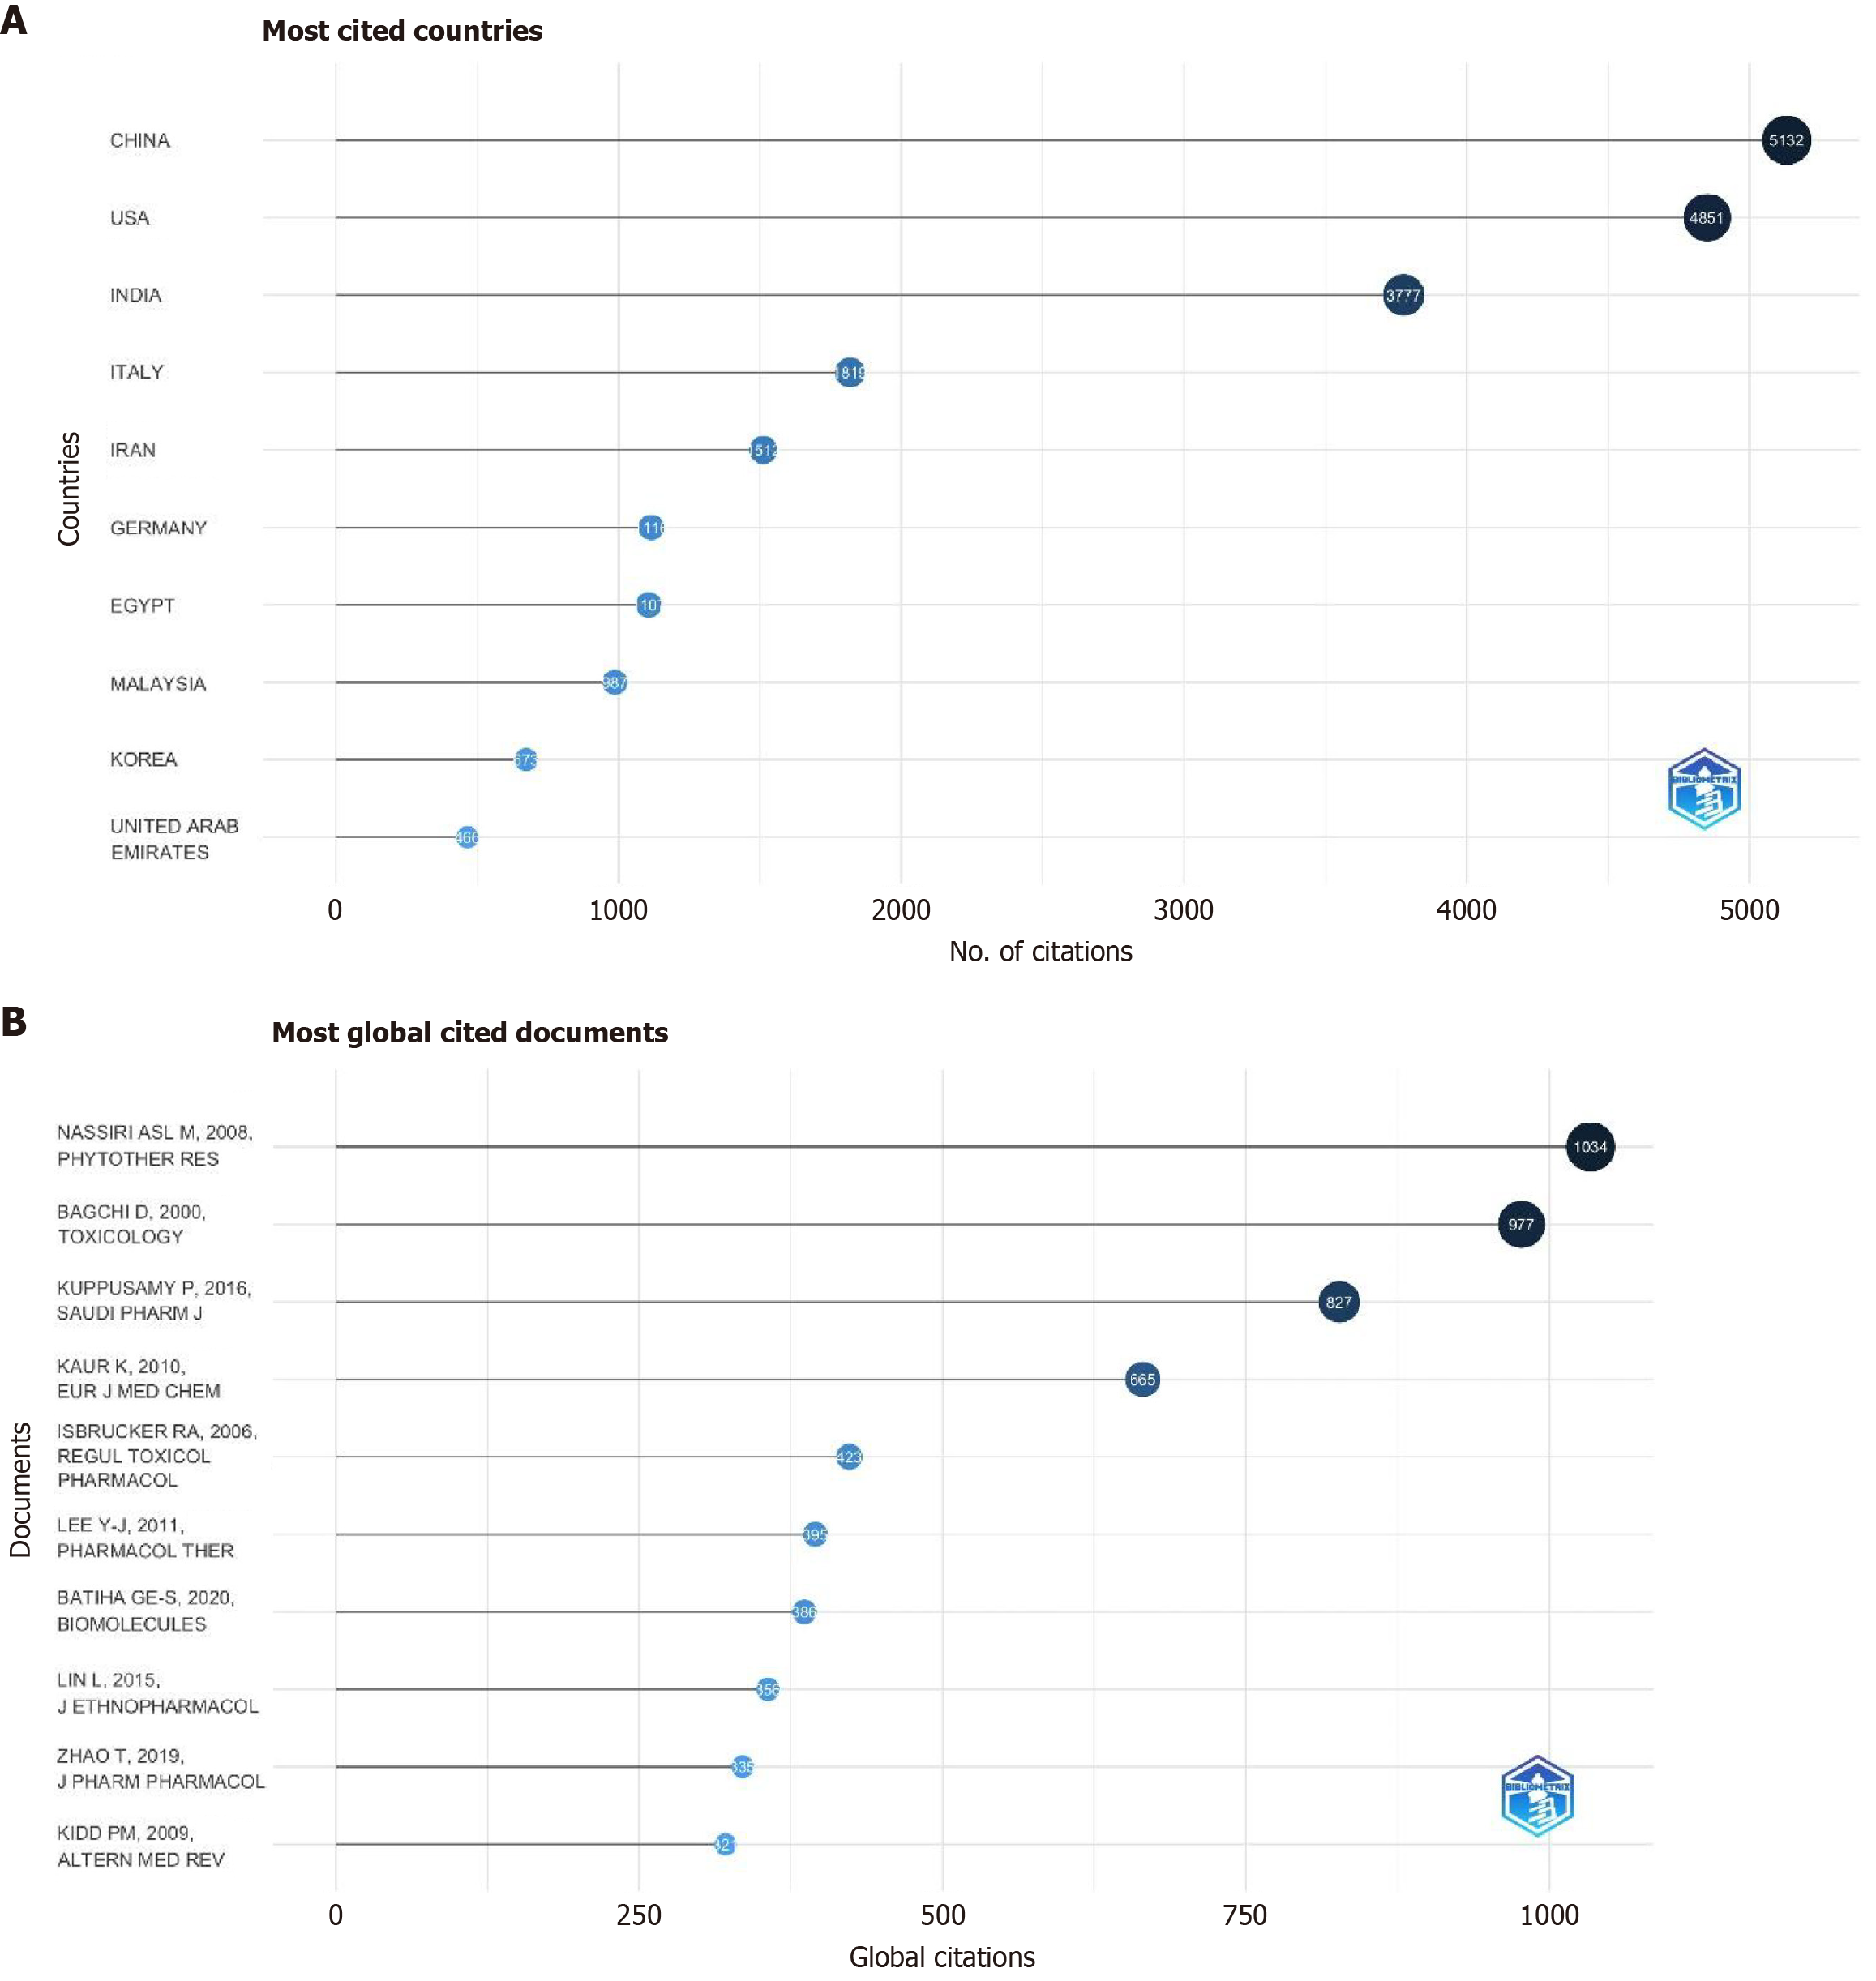
Figure 6 Citation statistics of documents.
A: Most cited countries; B: Most globally cited documents.
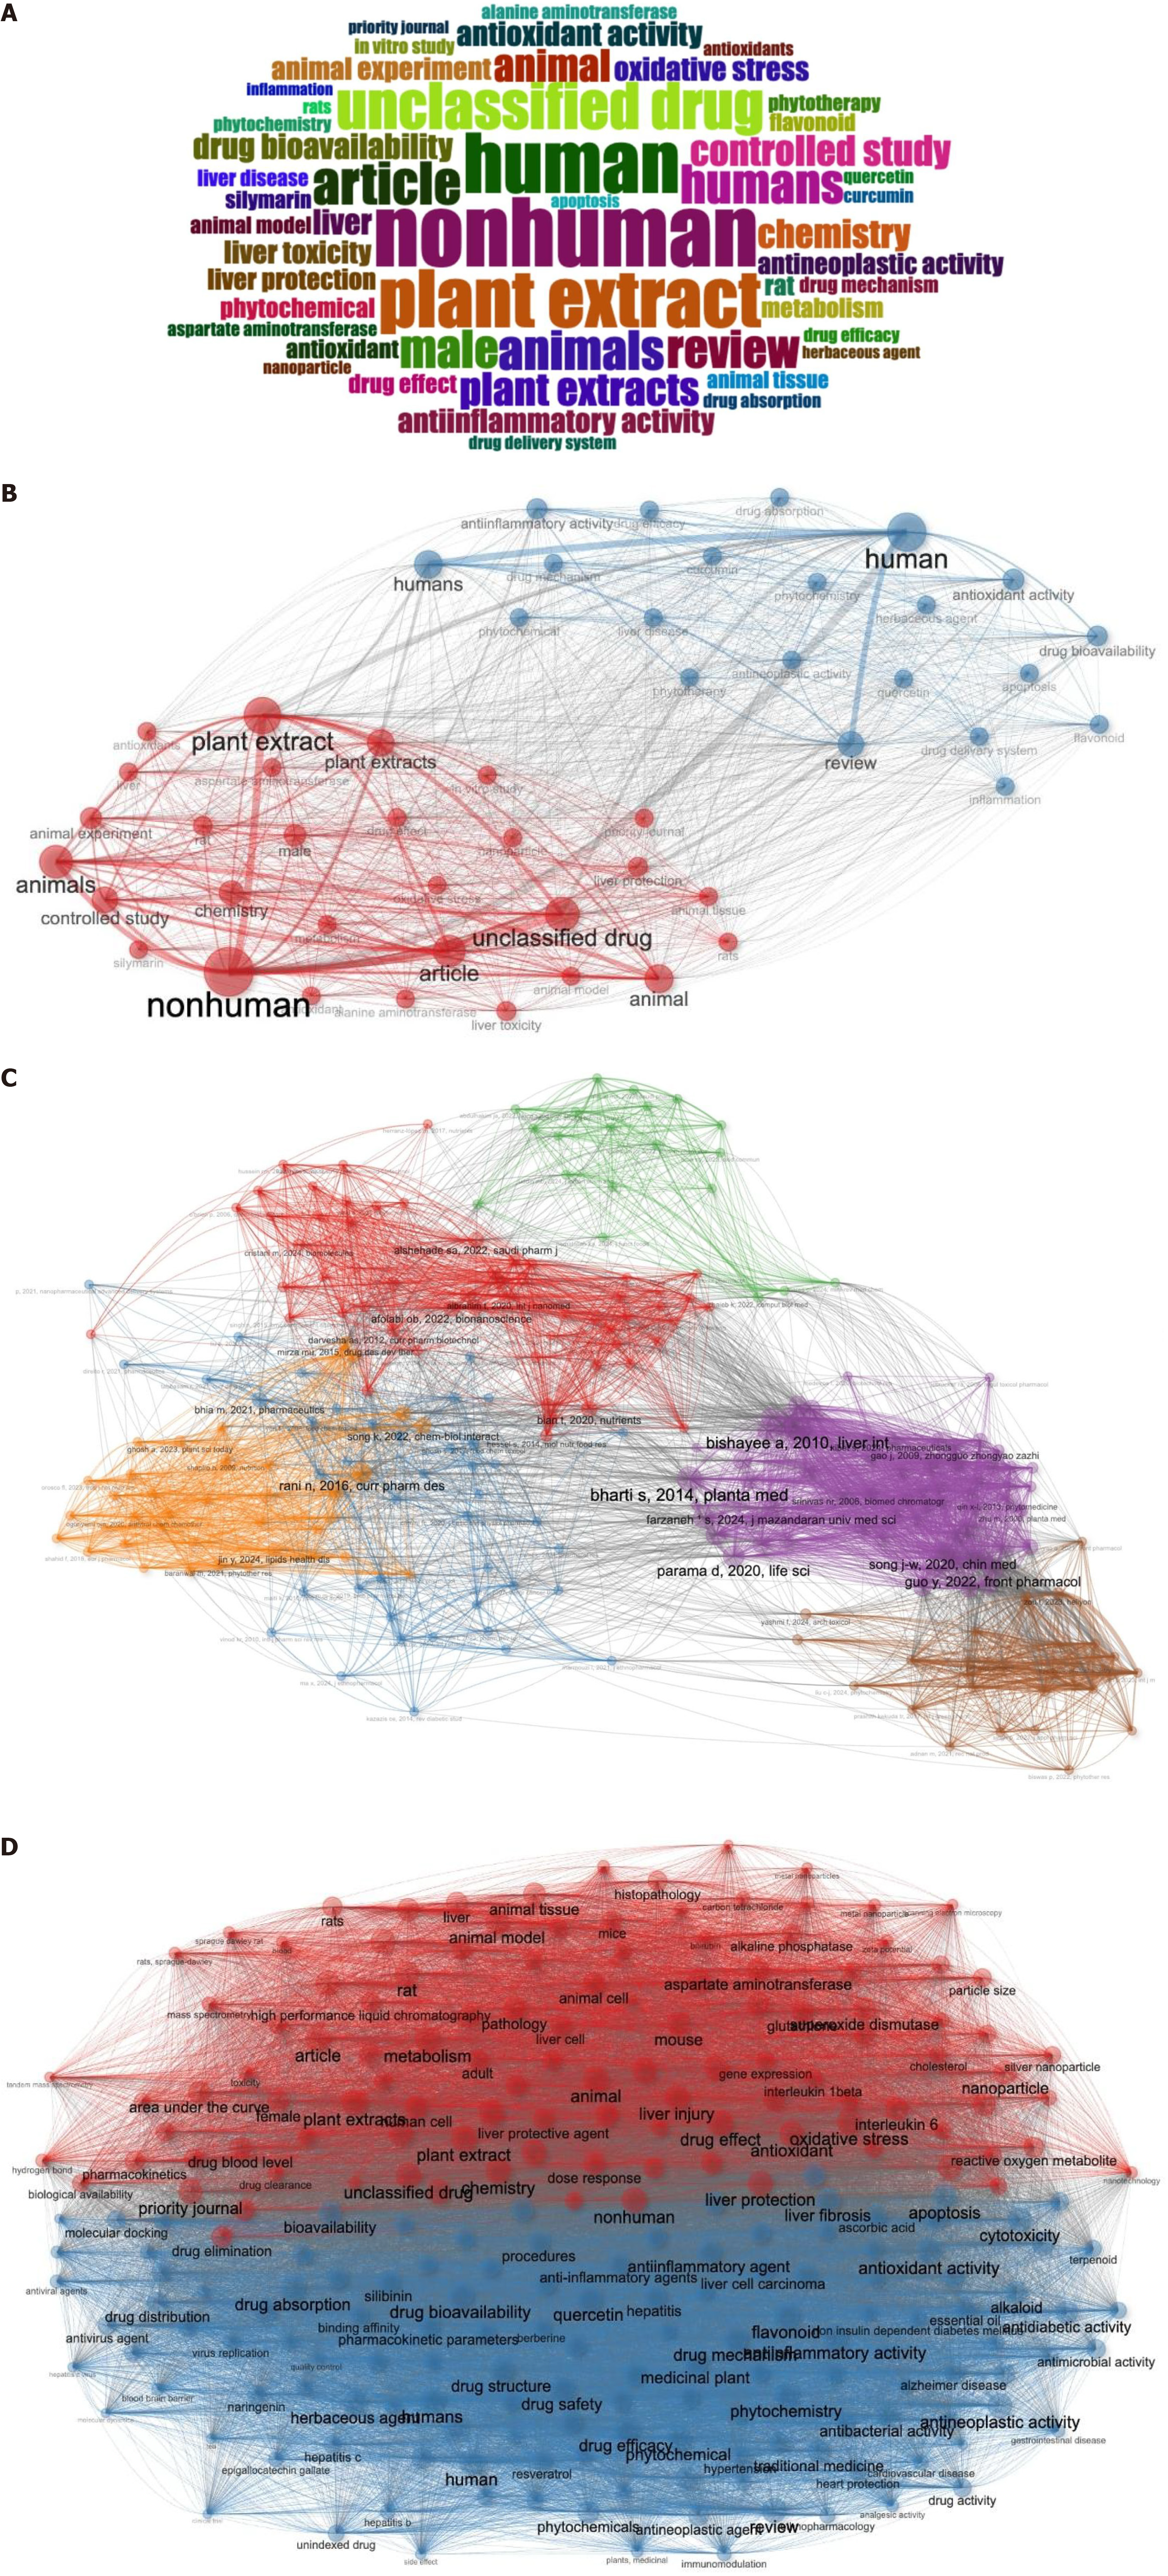
Figure 7 Word clusters and network analysis.
A: Word cloud; B: Network analysis of most frequent themes of studies; C: Network analysis of author collaborations; D: Network analysis of frequently used keywords.
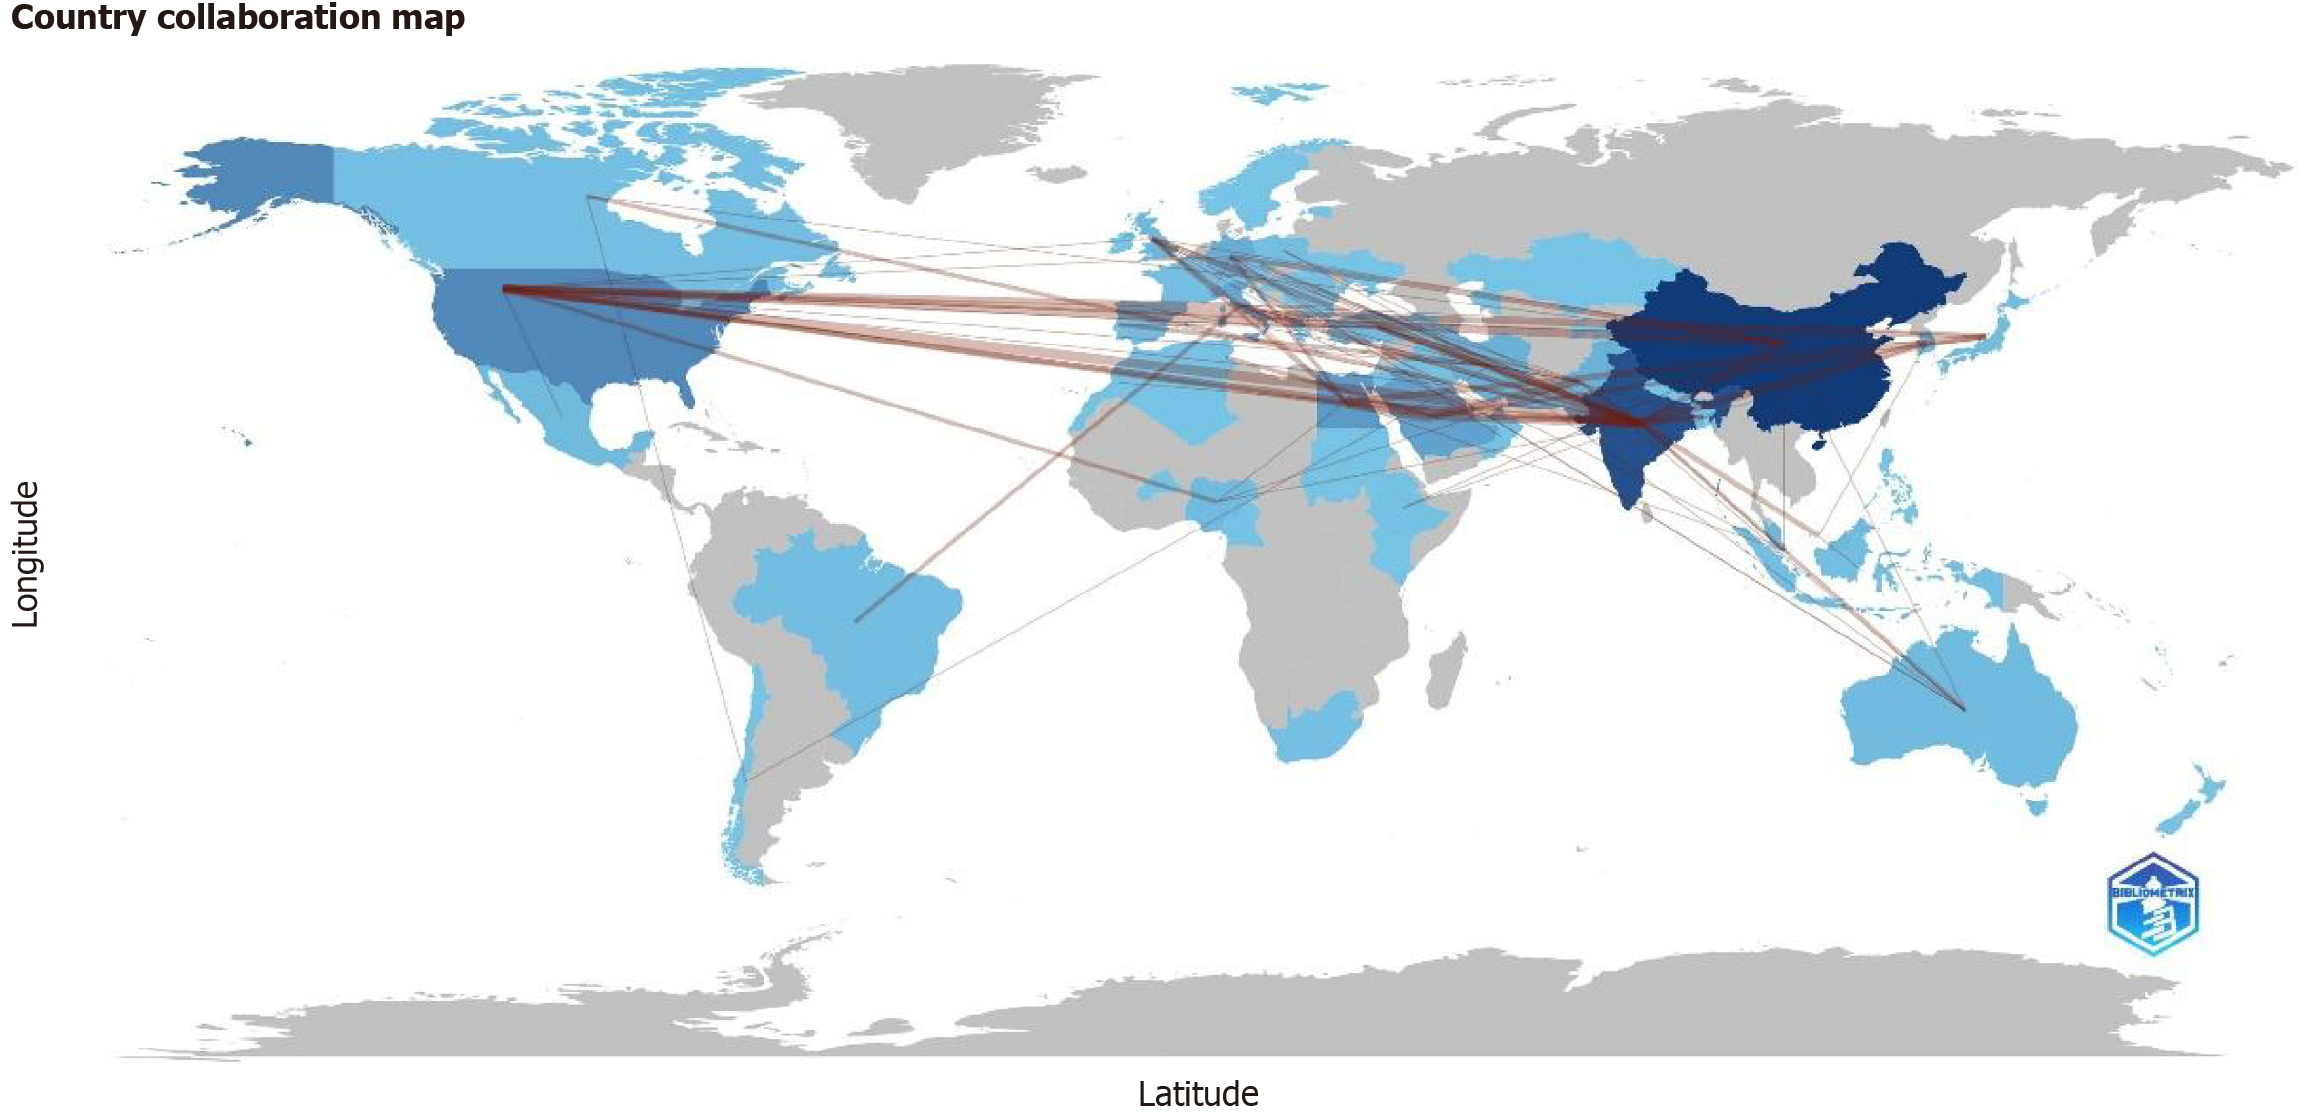
Figure 8 Country collaboration map in liver health, plant extracts, and drug delivery research.
- Citation: Mittal G, A P, Dhali A, Prasad R, S Y, Nurani KM, Găman MA. Plant extracts with antioxidant and hepatoprotective benefits for liver health: A bibliometric analysis of drug delivery systems. World J Gastroenterol 2025; 31(18): 105836
- URL: https://www.wjgnet.com/1007-9327/full/v31/i18/105836.htm
- DOI: https://dx.doi.org/10.3748/wjg.v31.i18.105836


