Copyright
©The Author(s) 2025.
World J Gastroenterol. May 14, 2025; 31(18): 105495
Published online May 14, 2025. doi: 10.3748/wjg.v31.i18.105495
Published online May 14, 2025. doi: 10.3748/wjg.v31.i18.105495
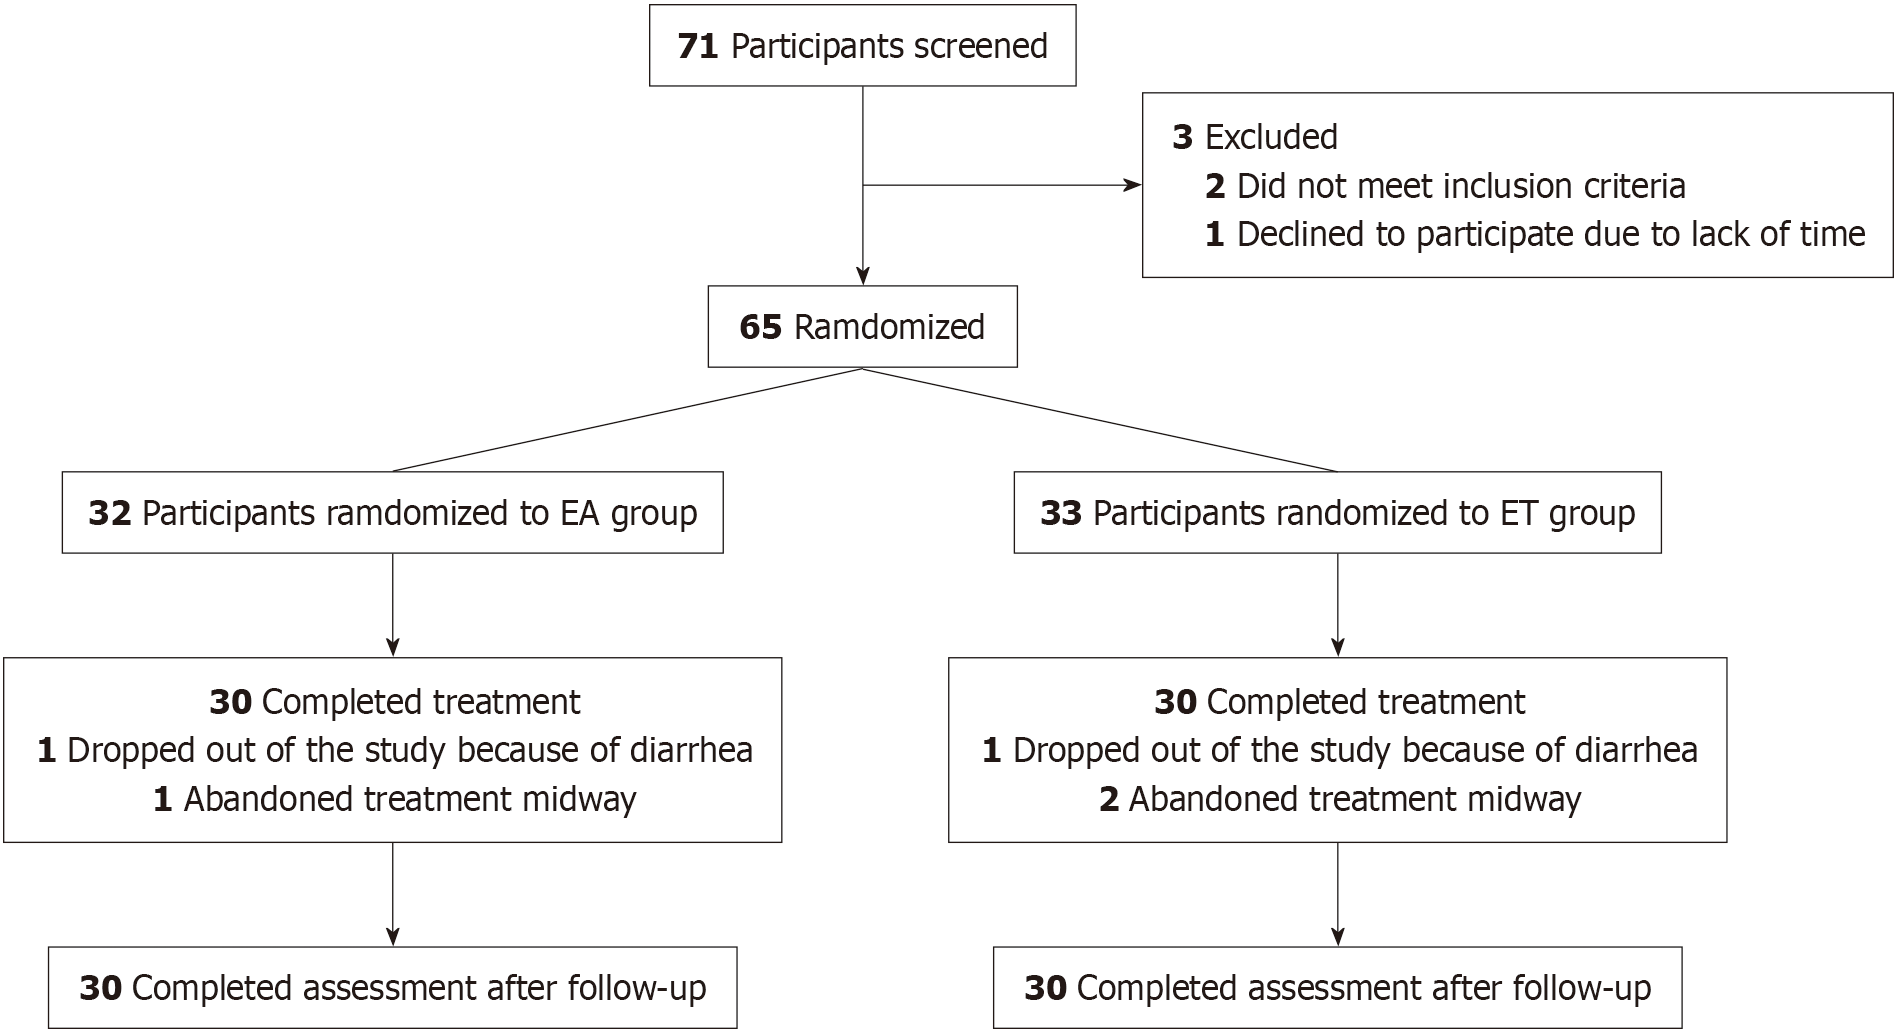
Figure 1 Flowchart of the study.
EA: Electroacupuncture; ET: Electroacupuncture combined with Tuina.
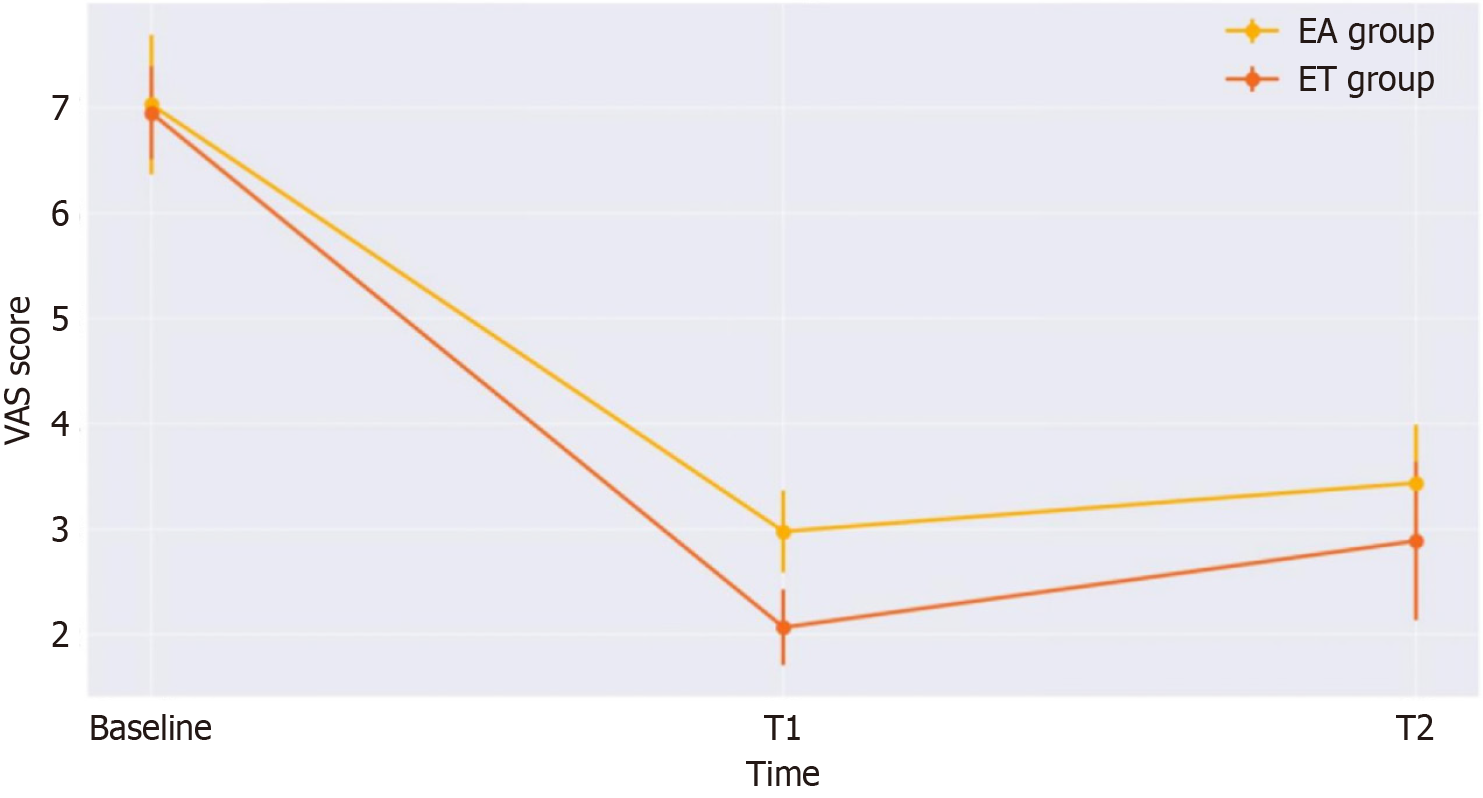
Figure 2 Trend chart of changes in visual analog scale scores.
EA: Electroacupuncture; ET: Electroacupuncture combined with Tuina; VAS: Visual analog scale.
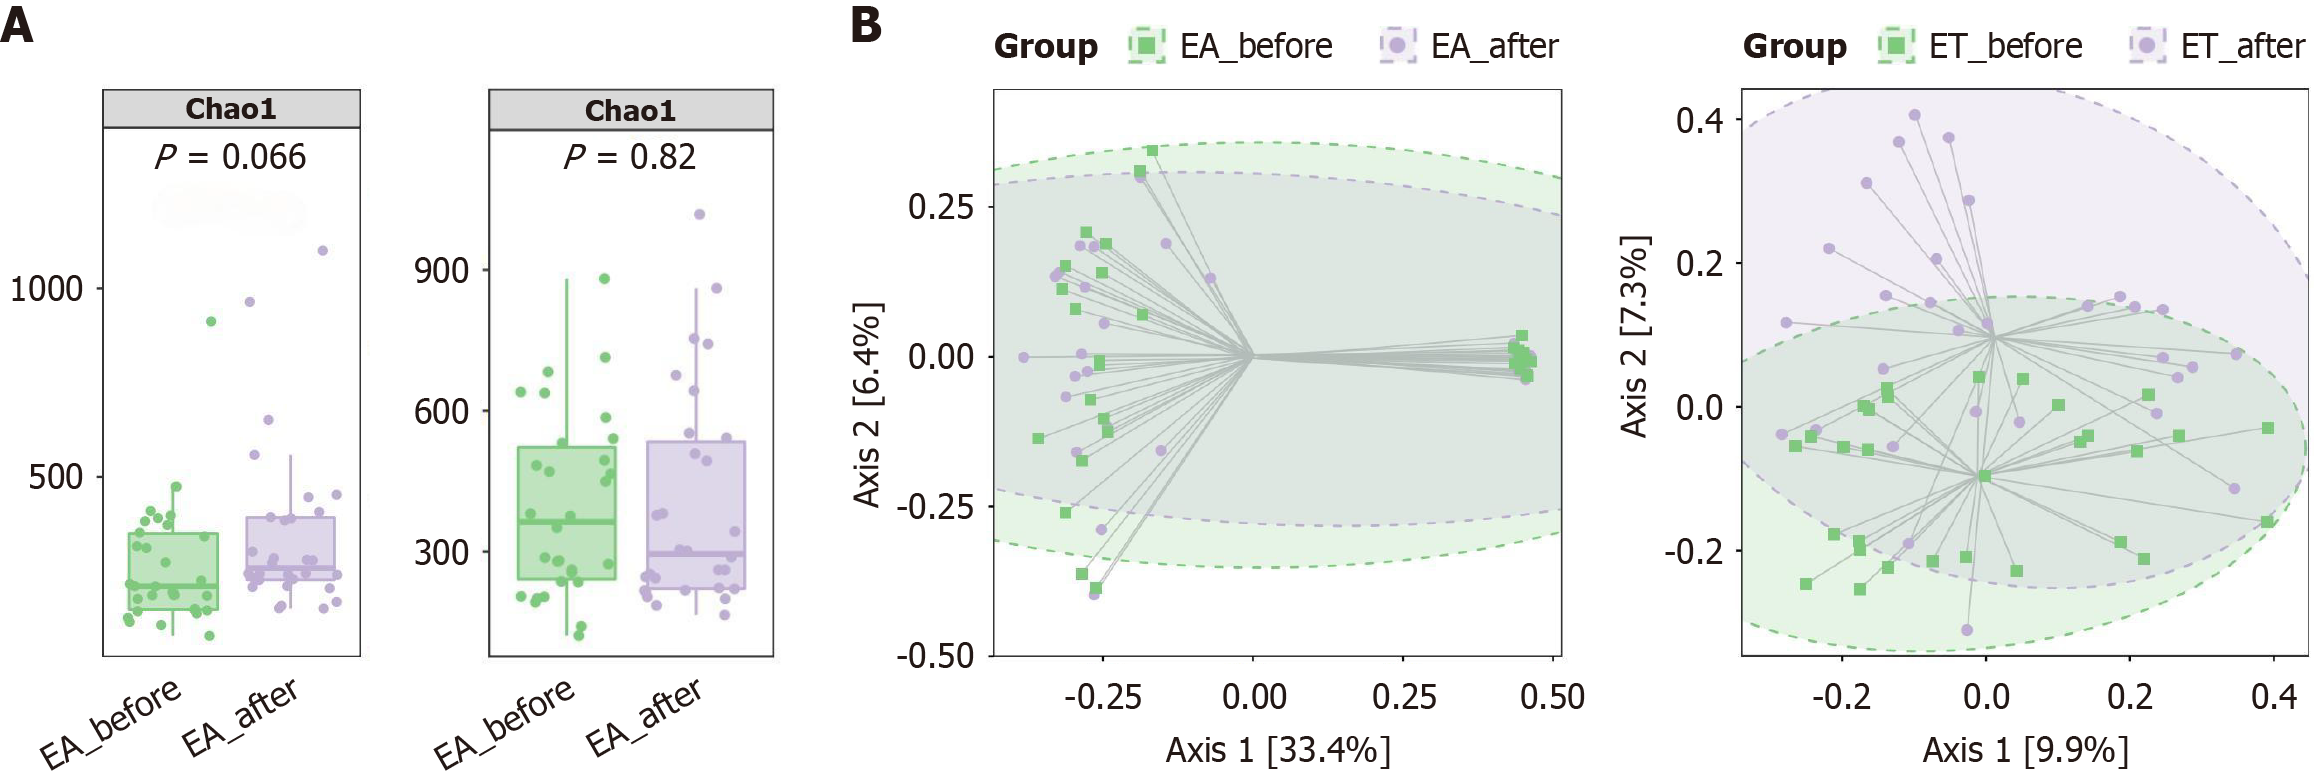
Figure 3 Analysis of gut microbial diversity.
A: Alpha diversity metrics were quantified using Chao 1 index calculations; B: Beta diversity patterns were visualized through principal coordinates analysis. EA: Electroacupuncture; ET: Electroacupuncture combined with Tuina.
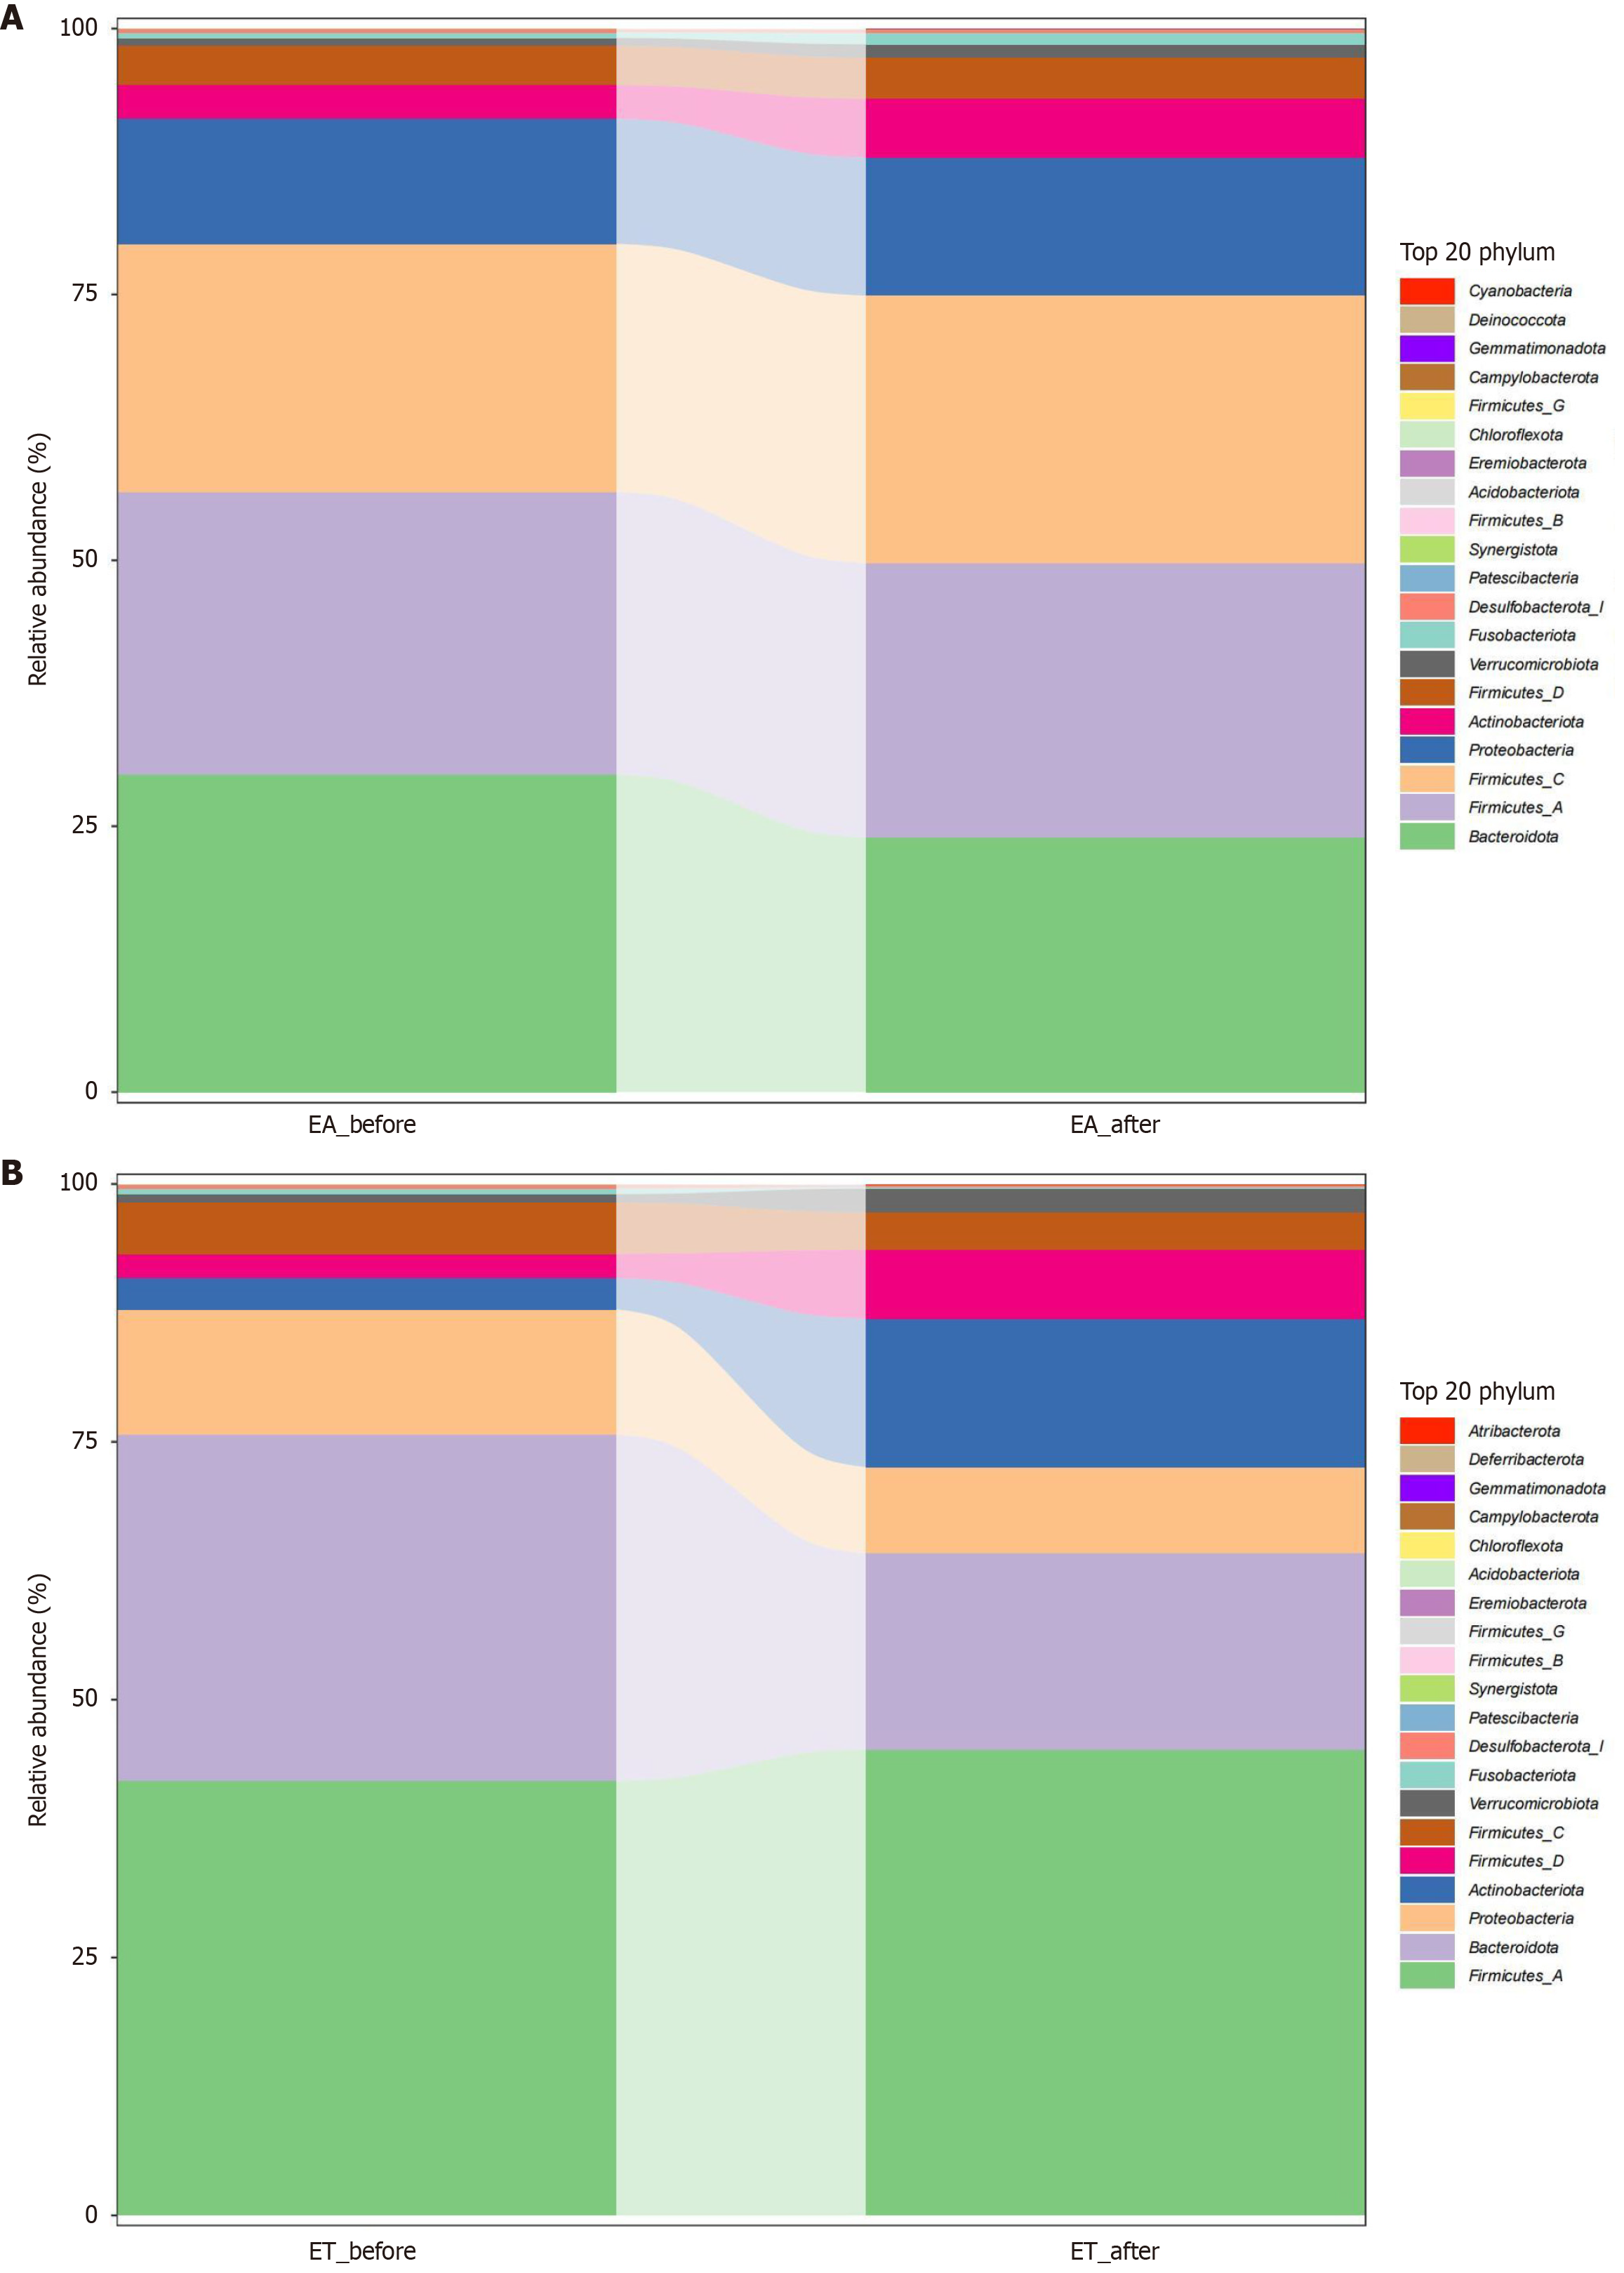
Figure 4 Differential analysis of phylum levels.
A: Phylum-level compositional shifts in the electroacupuncture (EA) group's dominant gut microbiota (top 20 taxa) between before and after treatment; B: Phylum-level compositional shifts in the EA combined with Tuina group's dominant gut microbiota (top 20 taxa) between before and after treatment. EA: Electroacupuncture; ET: Electroacupuncture combined with Tuina.
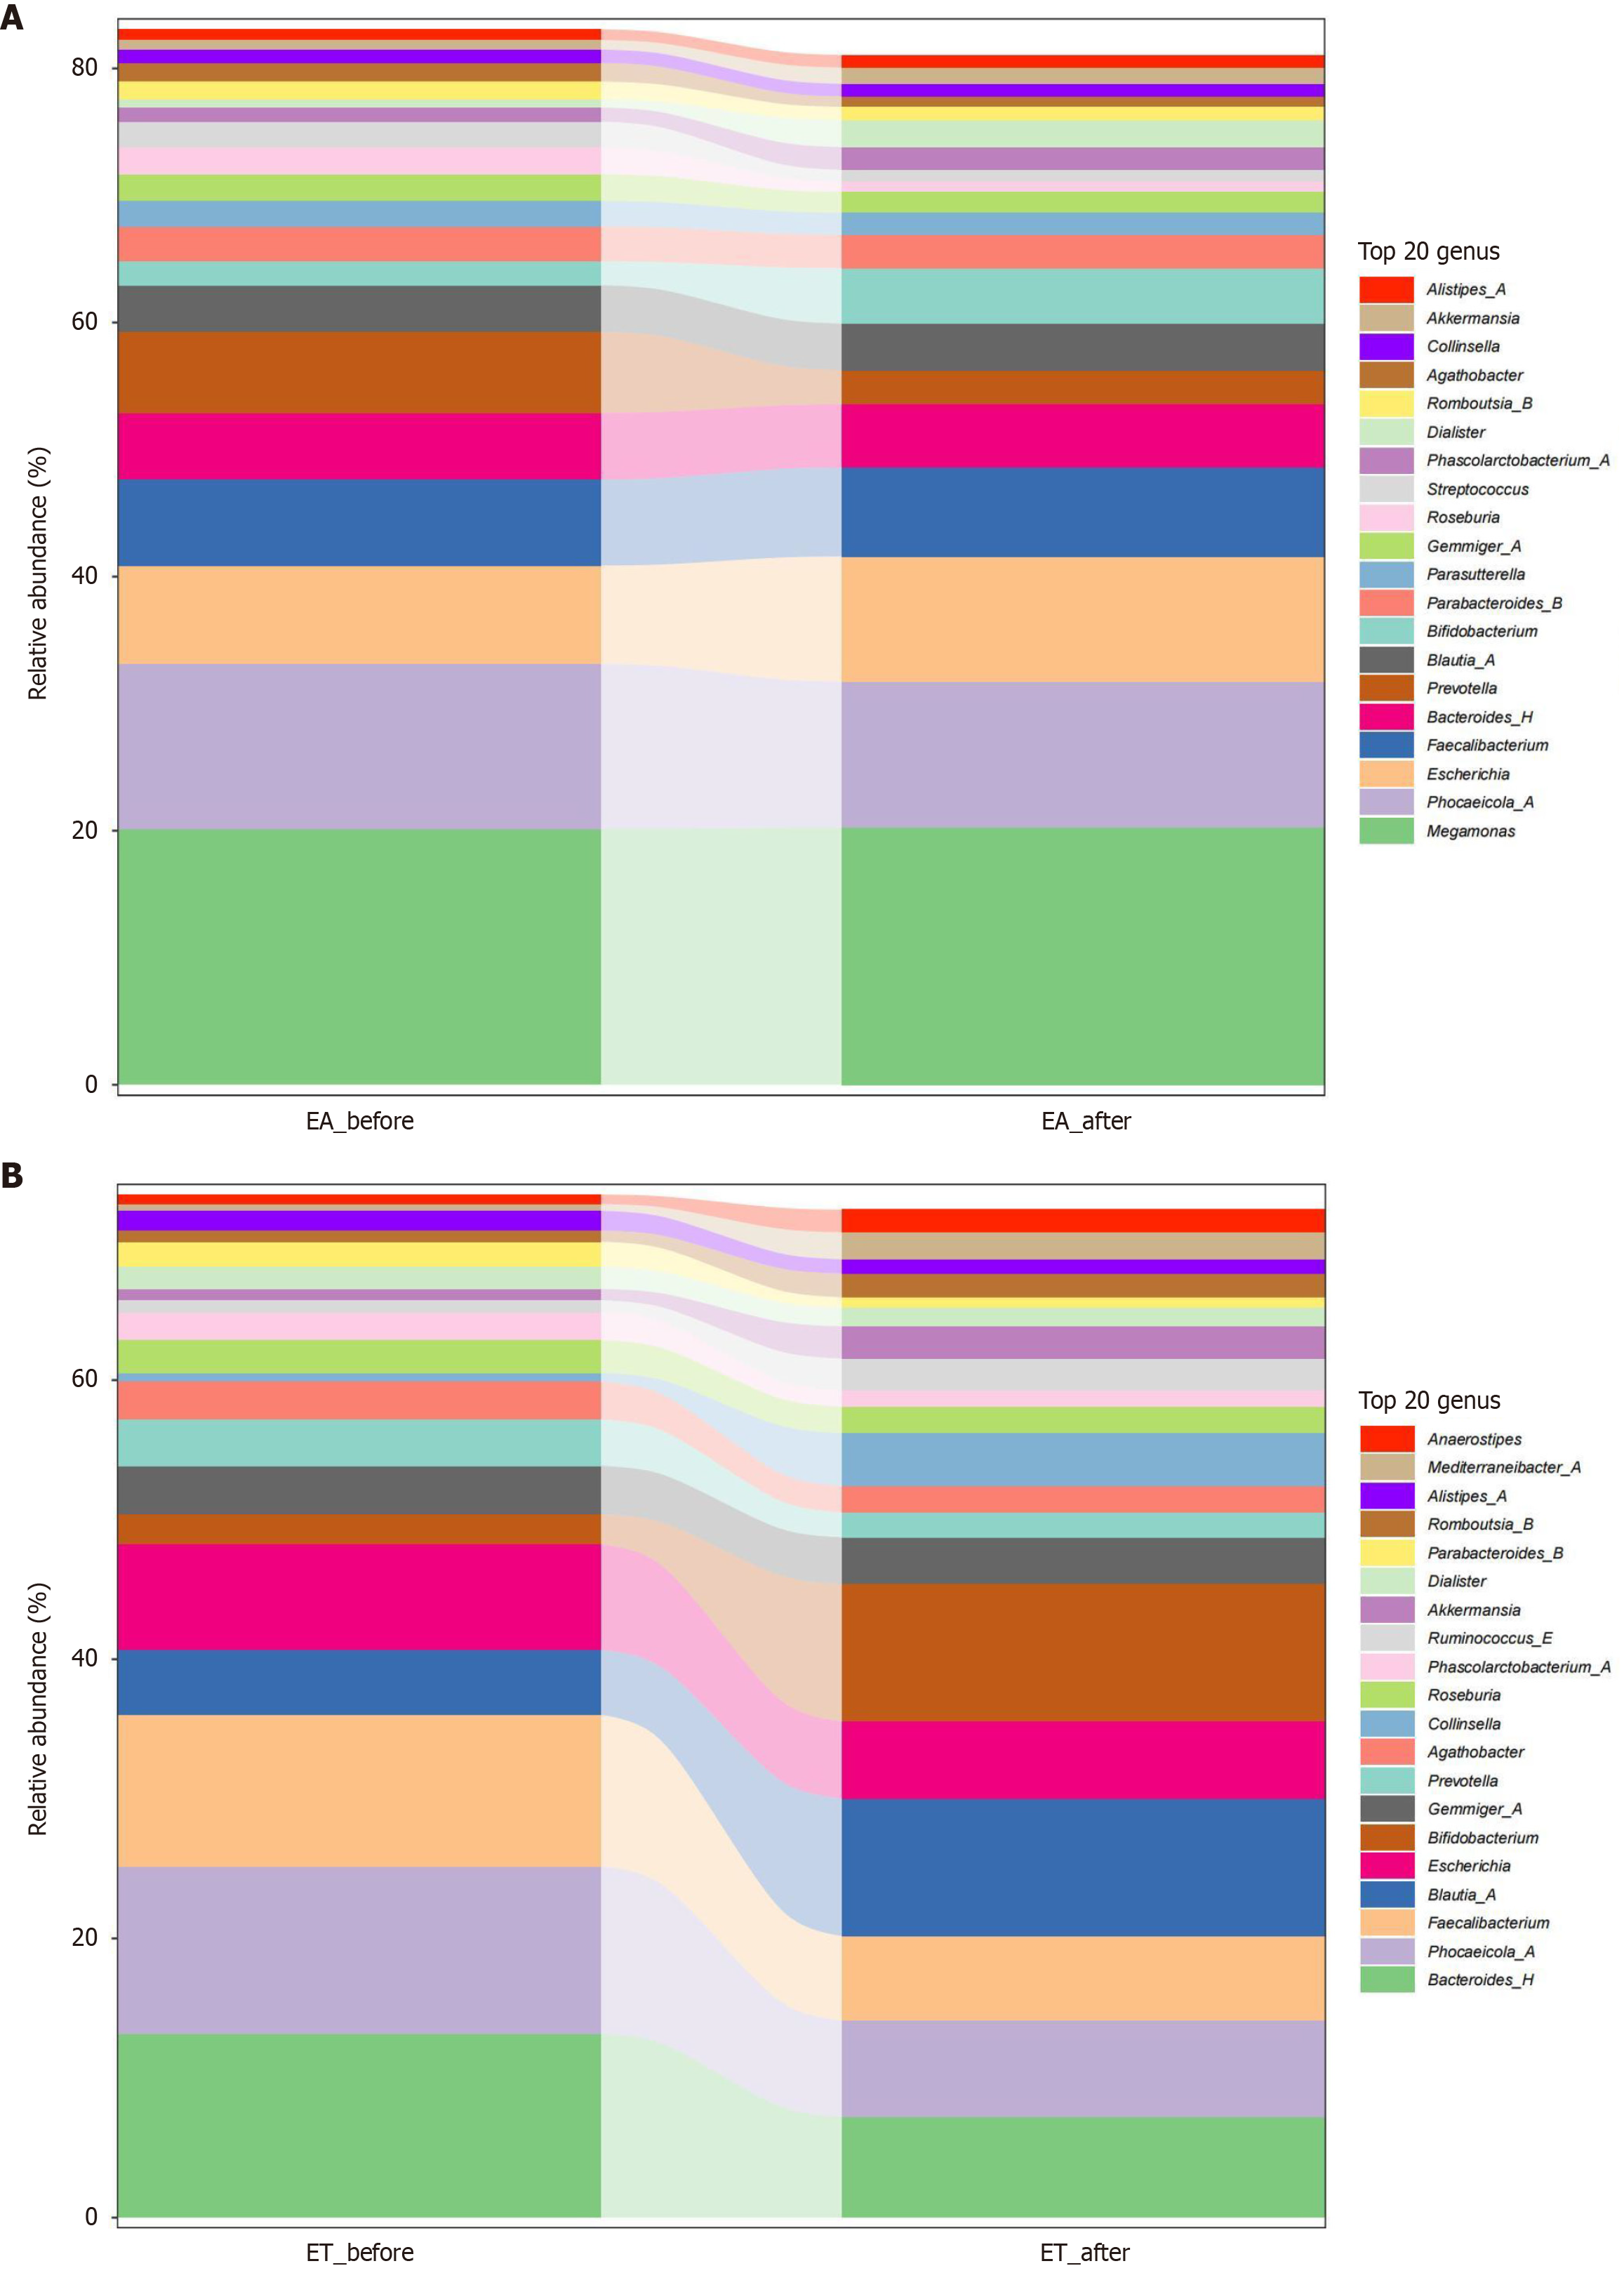
Figure 5 Differential analysis of genus levels.
A: Genus-level compositional shifts in the electroacupuncture (EA) group's dominant gut microbiota (top 20 taxa) between before and after treatment; B: Genus-level compositional shifts in the EA combined with Tuina group's dominant gut microbiota (top 20 taxa) between before and after treatment. EA: Electroacupuncture; ET: Electroacupuncture combined with Tuina.
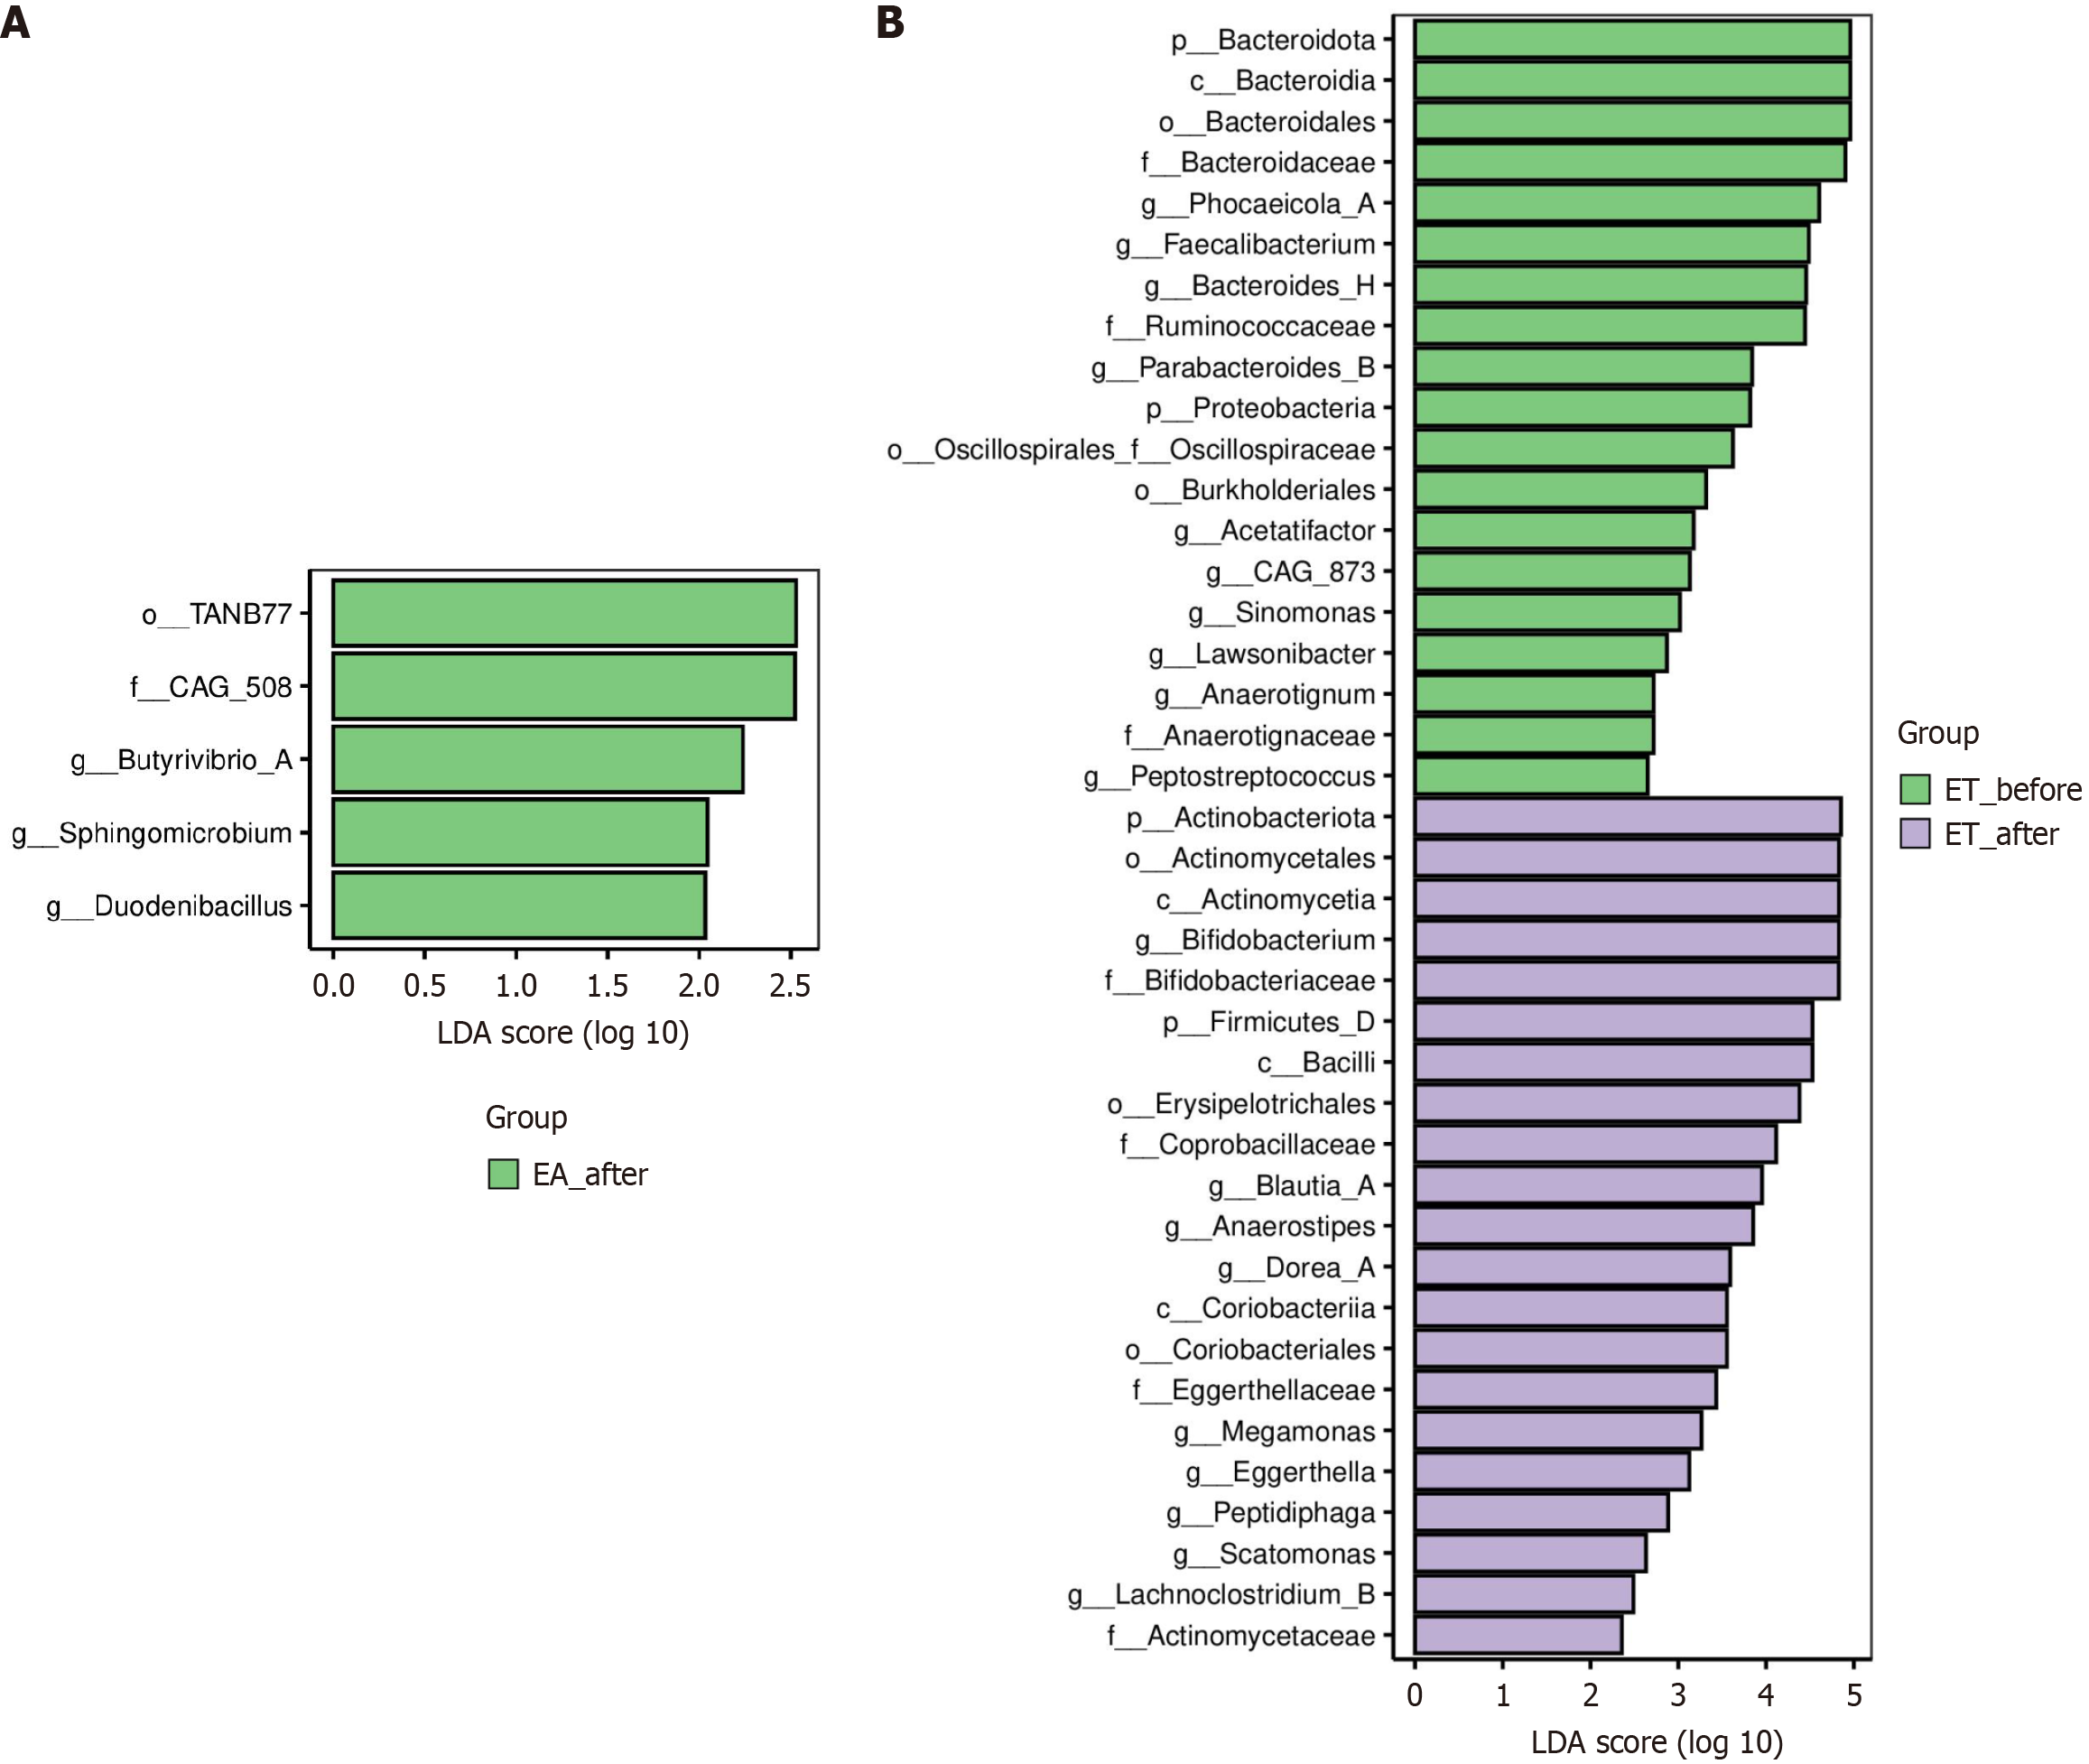
Figure 6 Species difference analysis of gut microbiota before and after treatment.
A: LEfSe-derived taxonomic discriminators (LDA score) illustrating microbial abundance divergence in the electroacupuncture (EA) group between before and after treatment; B: LEfSe-derived taxonomic discriminators (LDA score) illustrating microbial abundance divergence in the EA combined with Tuina group between before and after treatment. EA: Electroacupuncture; ET: Electroacupuncture combined with Tuina.
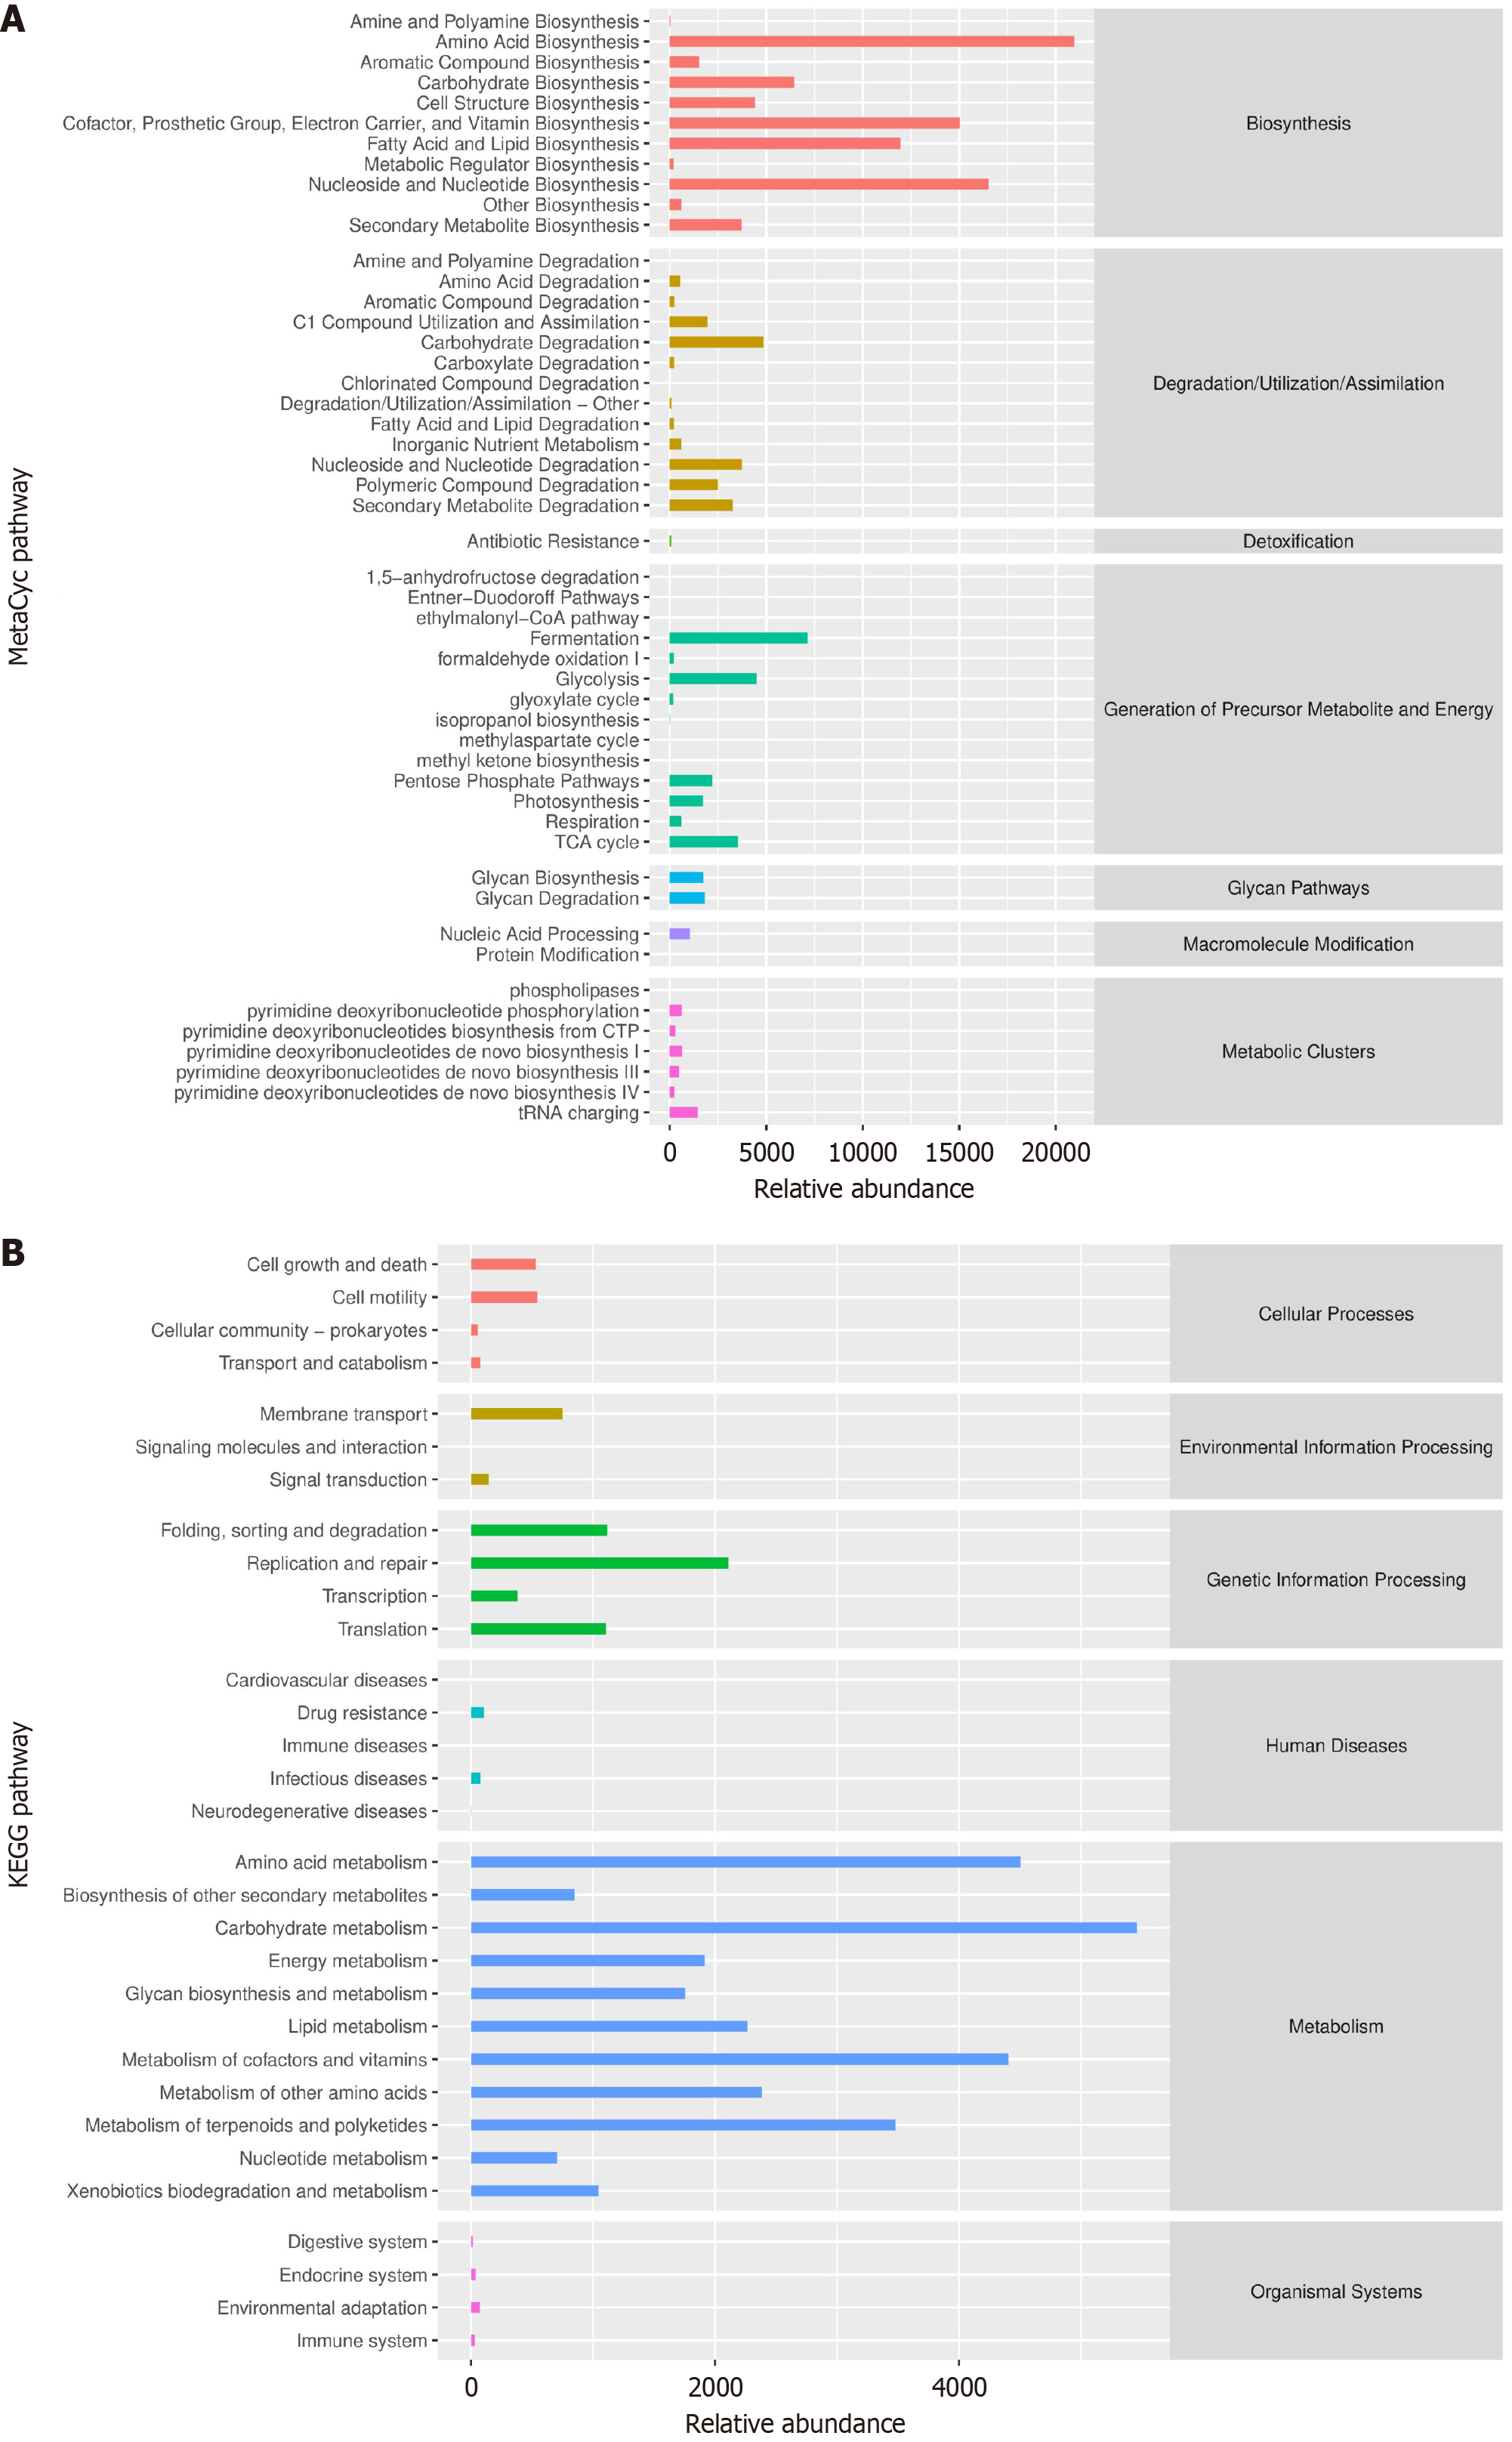
Figure 7 Enrichment analysis of gut microbiota species pathways in patients with knee osteoarthritis.
A: Predicted abundance chart of MetaCy level 2 functional pathways; B: Predicted abundance chart of Kyoto Encyclopedia of Genes and Genomes level 2 functional pathways. KEGG: Kyoto Encyclopedia of Genes and Genomes; KOA: Knee osteoarthritis.
- Citation: Guo X, Guo L, Lu QZ, Xie H, Chen J, Su WL, Tian Y, Li XH, Miao HL, Zhang Y, Yang Y, Liao C, Deng JY, Yang YH, Tang CL, Liu HJ. Effect of electroacupuncture combined with Tuina therapy on gut microbiota in patients with knee osteoarthritis. World J Gastroenterol 2025; 31(18): 105495
- URL: https://www.wjgnet.com/1007-9327/full/v31/i18/105495.htm
- DOI: https://dx.doi.org/10.3748/wjg.v31.i18.105495


