Copyright
©The Author(s) 2025.
World J Gastroenterol. May 7, 2025; 31(17): 105438
Published online May 7, 2025. doi: 10.3748/wjg.v31.i17.105438
Published online May 7, 2025. doi: 10.3748/wjg.v31.i17.105438
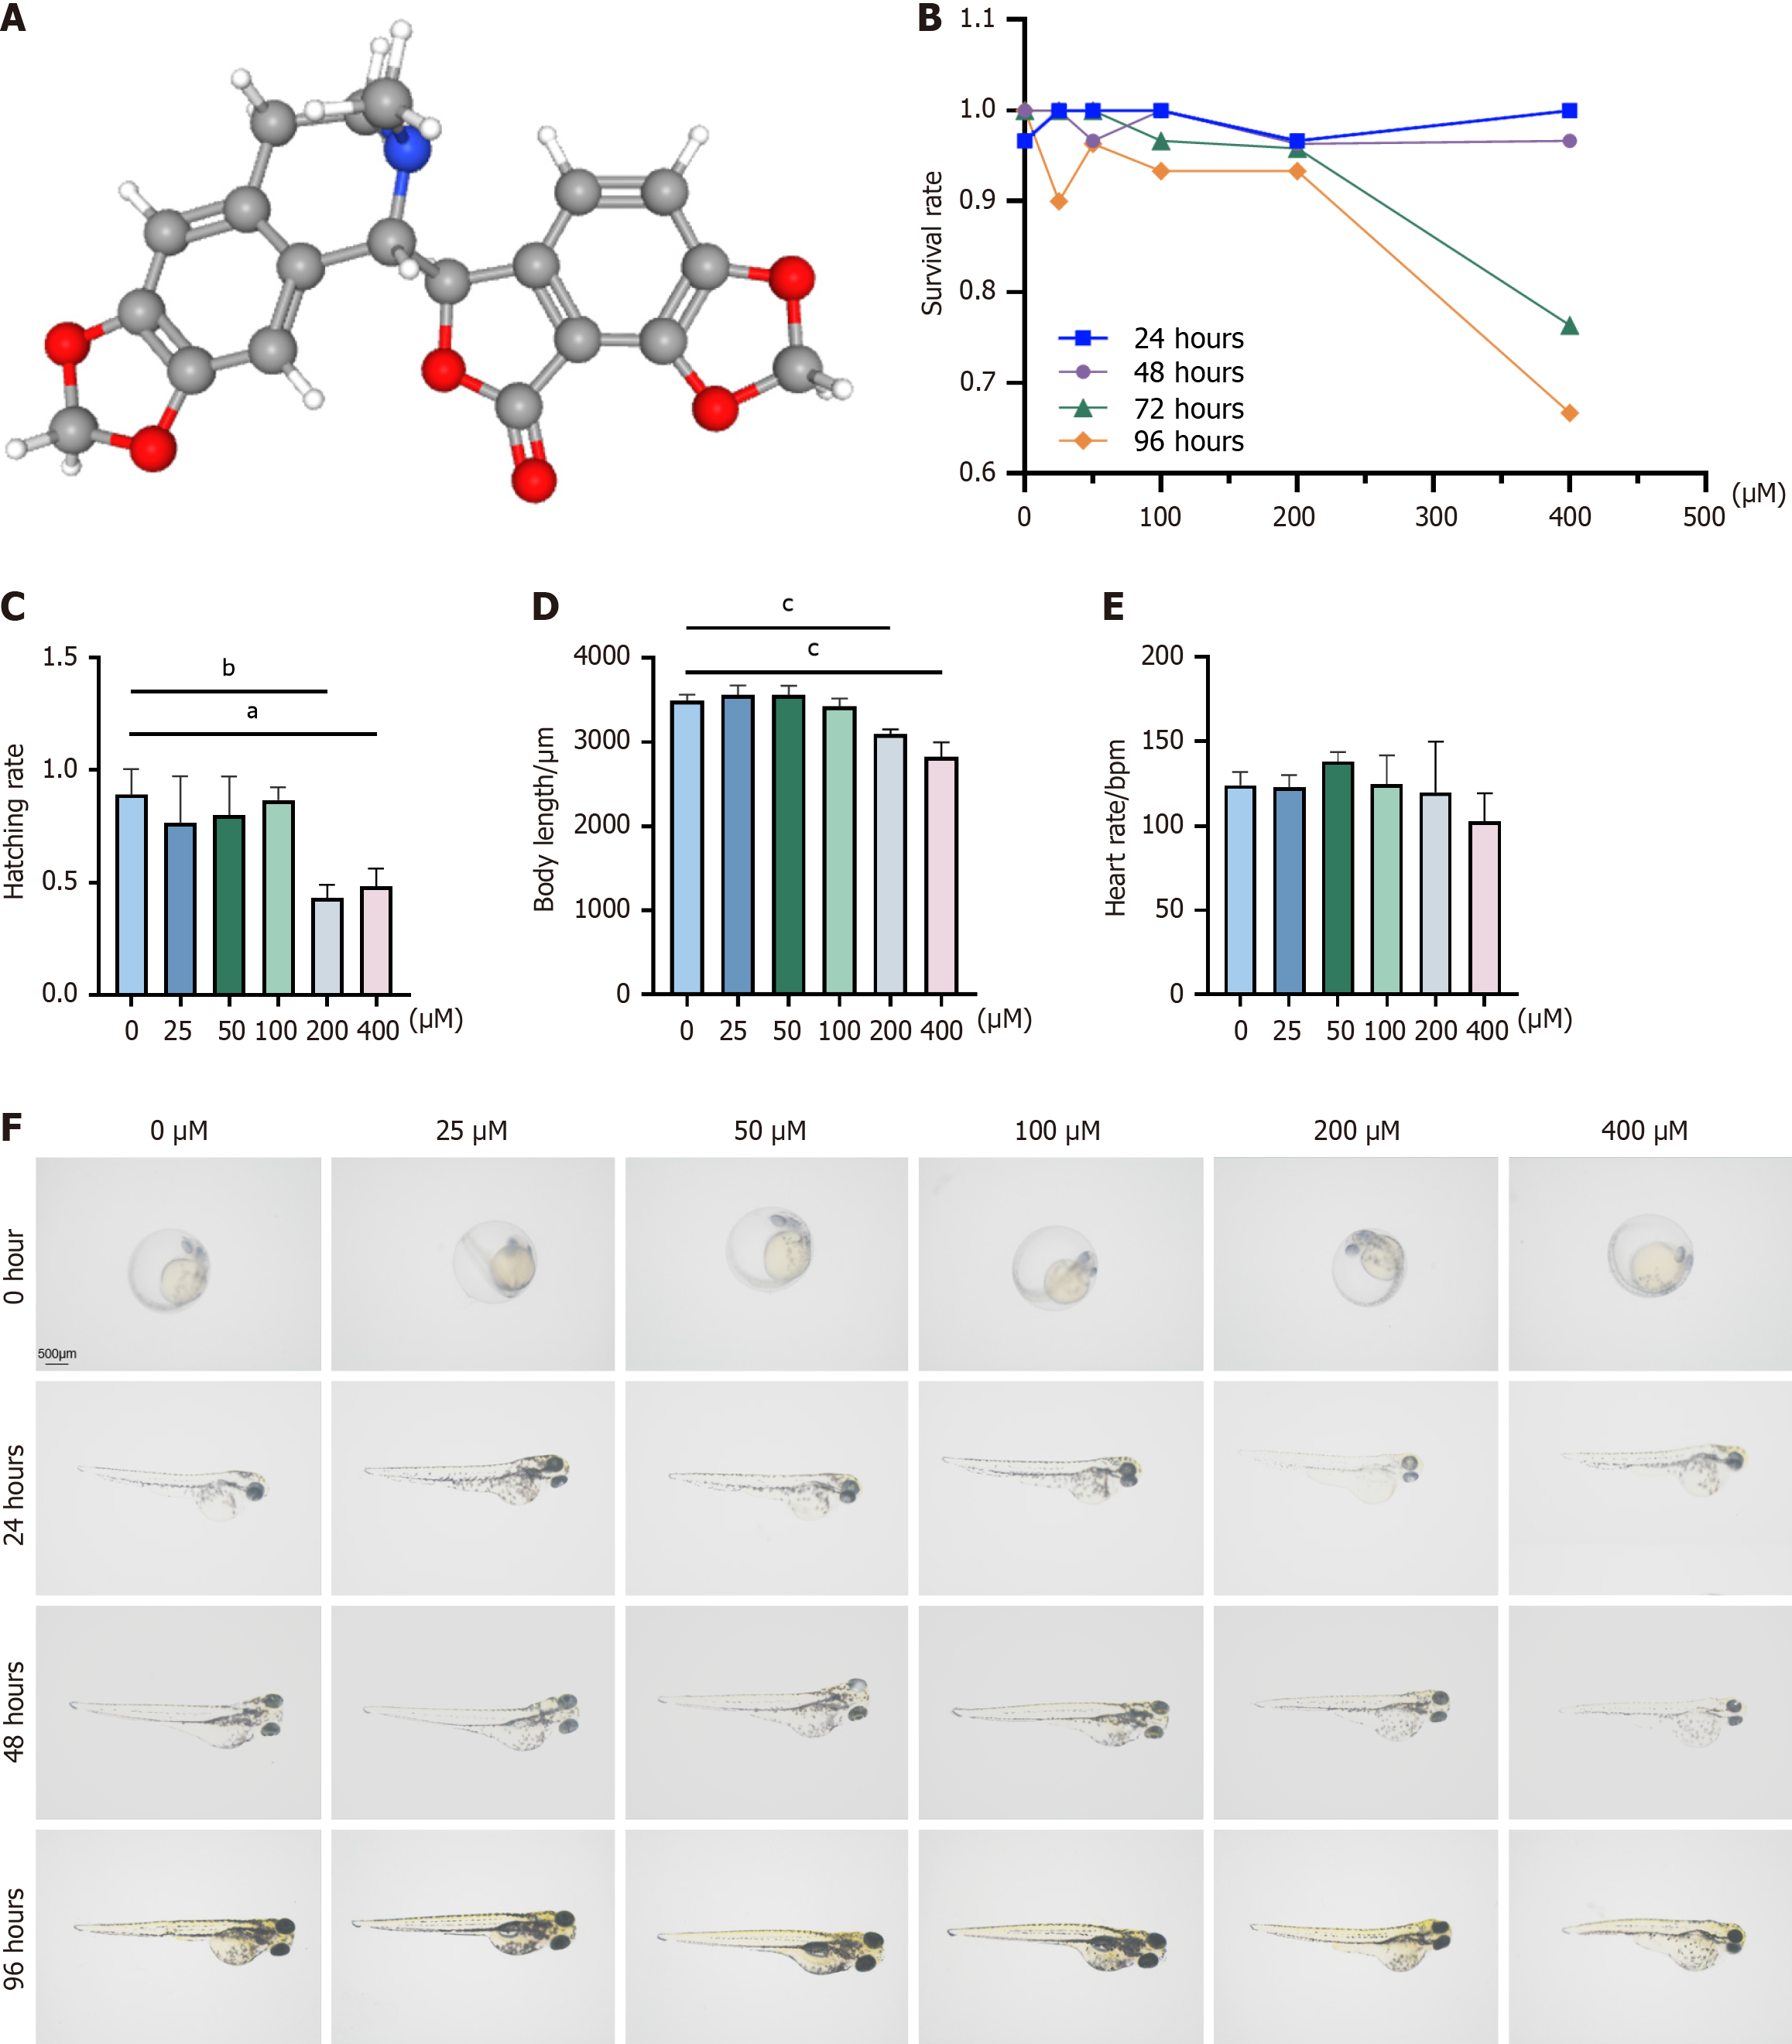
Figure 1 Developmental toxicity of bicuculline in zebrafish embryos.
A: Chemical structure of bicuculline (BIC) derived from PubChem; B: Survival rate of zebrafish embryos exposed to 0-400 μM BIC for timepoints ranging from 24 to 96 hours; C: Hatching rate of zebrafish embryos exposed to from 0 to 400 μM BIC for 96 hours; D: Body length of zebrafish embryos exposed to 0-400 μM BIC for 96 hours; E: Heart rate of zebrafish embryos exposed to 0-400 μM BIC for 96 hours; F: Phenotypic changes in zebrafish embryos exposed to 0-400 μM BIC for 24, 48, 72, and 96 hours. aP < 0.05; bP < 0.01; cP < 0.001.
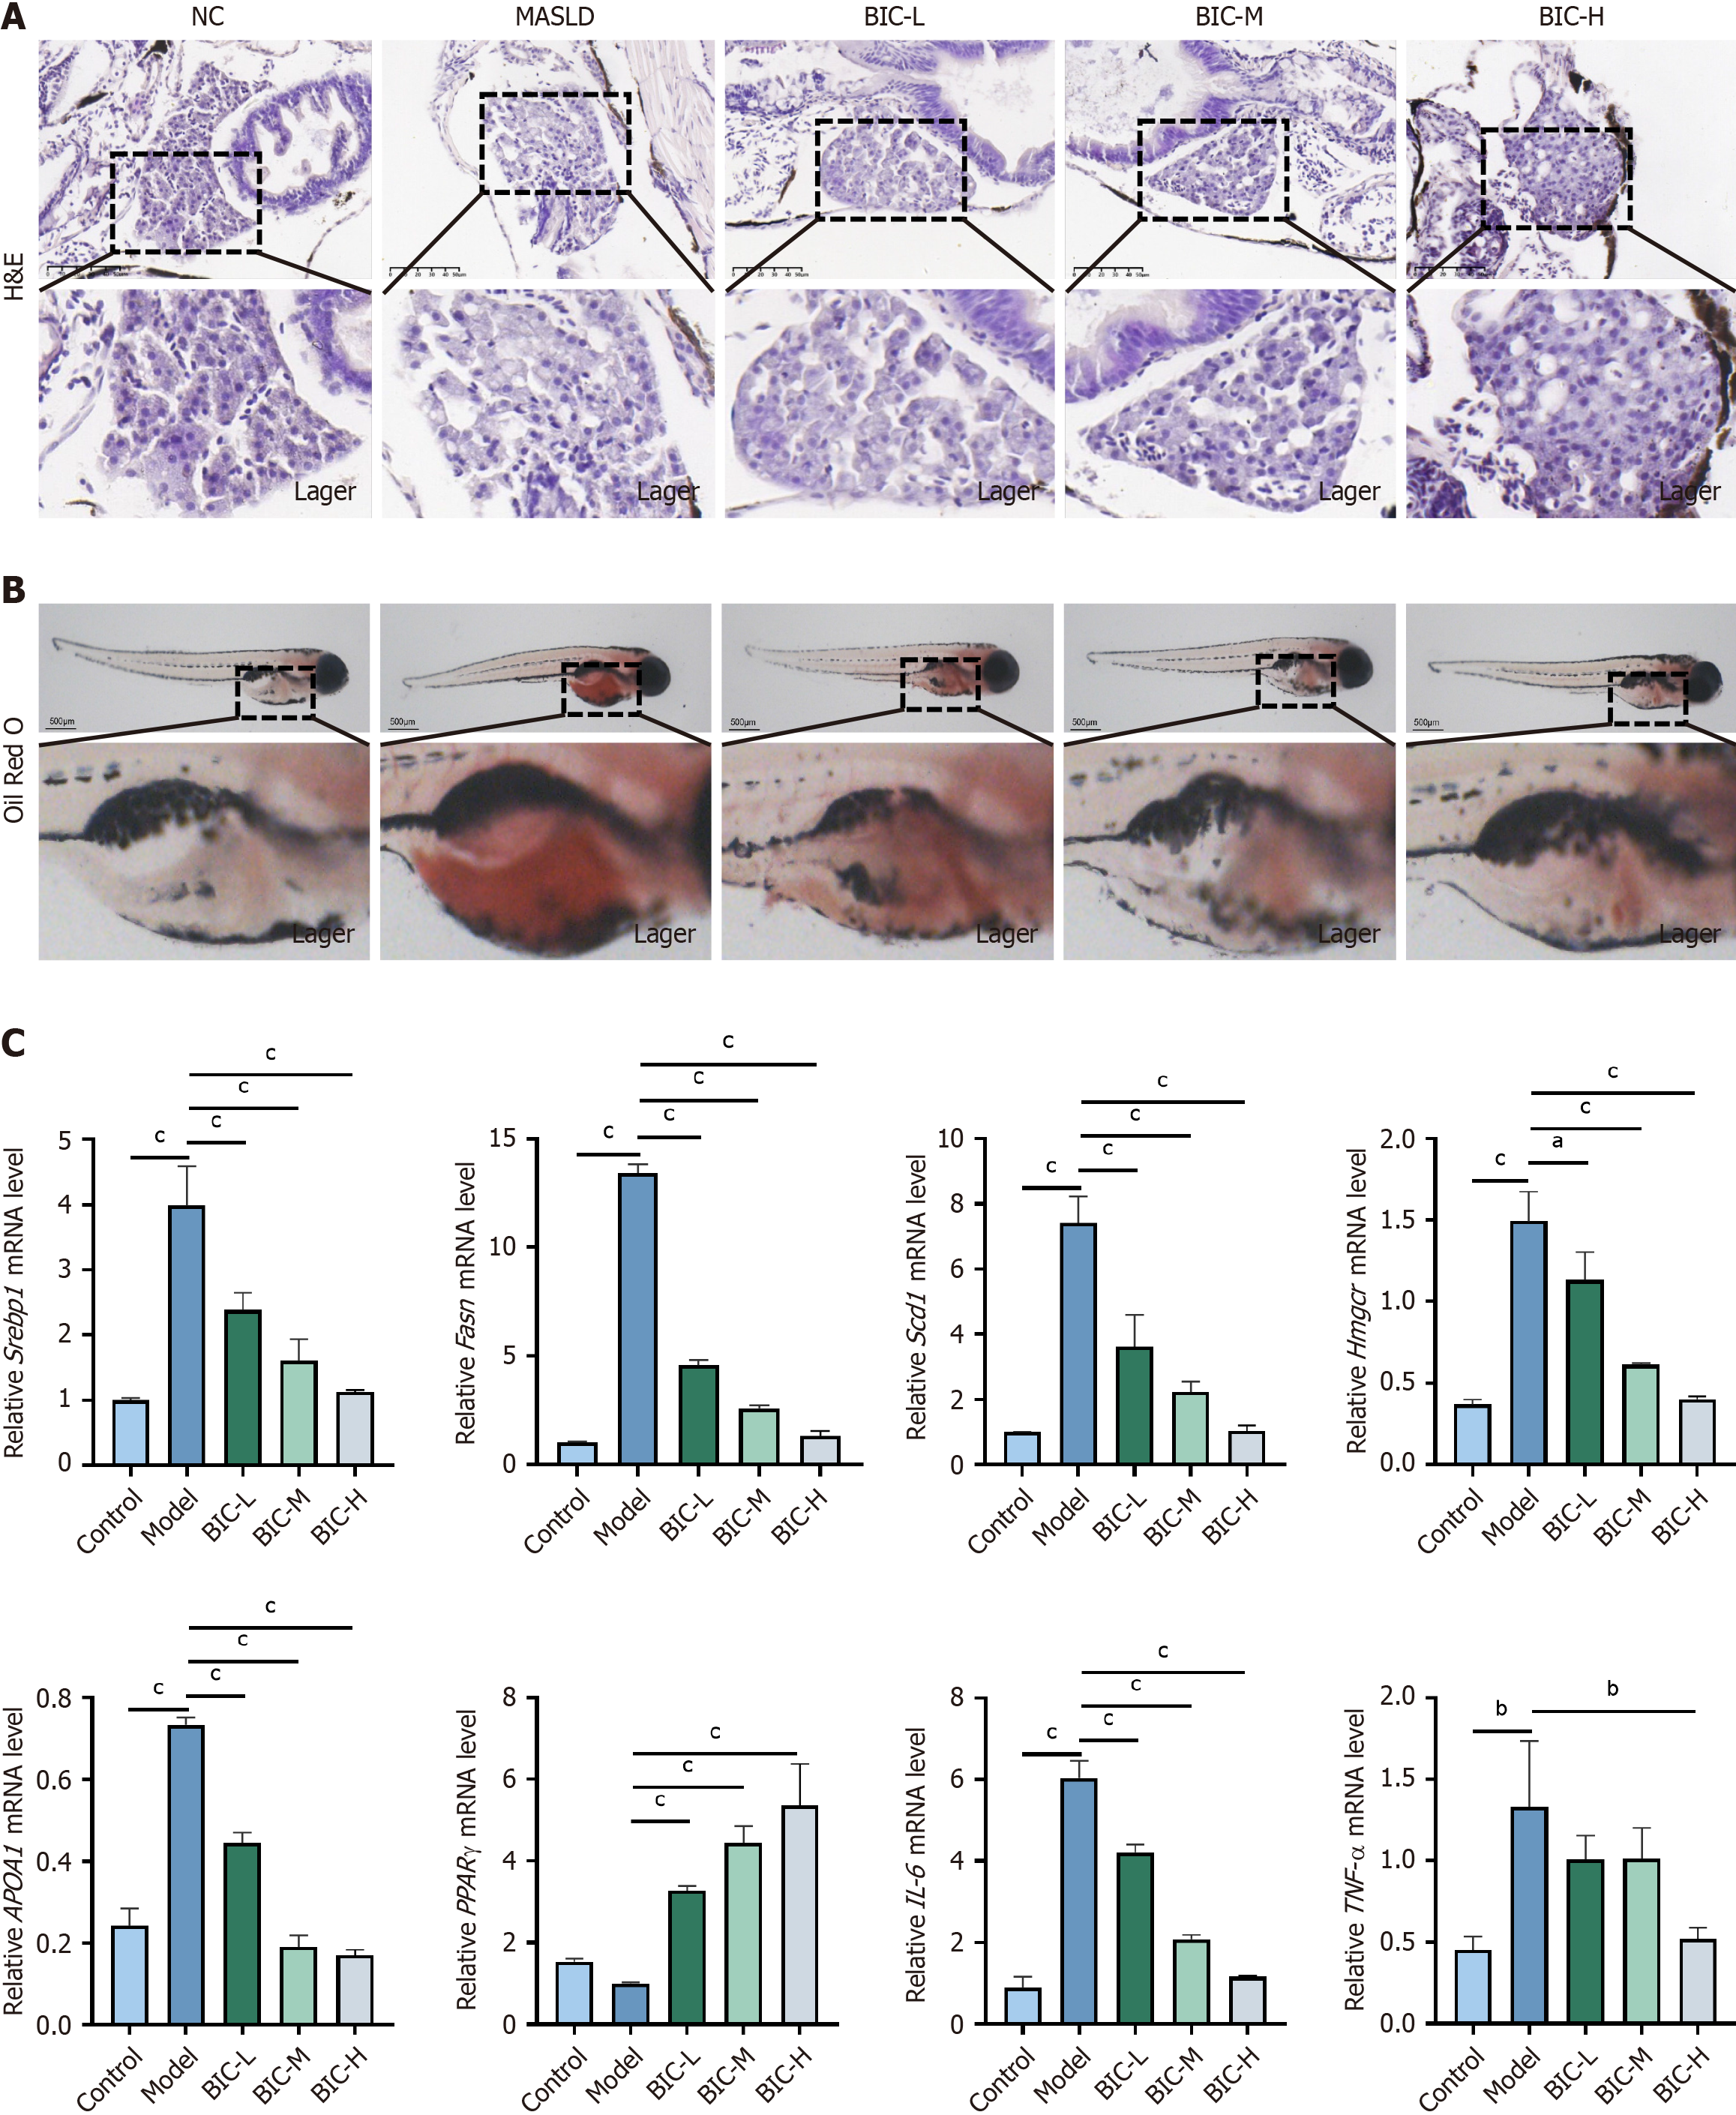
Figure 2 Evaluation of the therapeutic effect of bicuculline on metabolic dysfunction-associated steatotic liver disease in zebrafish larvae.
A: Hematoxylin & eosin staining of the livers of zebrafish larvae in each group; B: Whole-fish oil red O staining; C: Effects of bicuculline on lipid metabolism-related genes and inflammatory factors. The results are expressed as the means ± SDs (n = 5). One-way ANOVA with Tukey’s post hoc test was used to compare all the groups. Compared with the model group, aP < 0.05; bP < 0.01; cP < 0.001; MASLD: Metabolic dysfunction-associated steatotic liver disease; BIC: Bicuculline; H&E: Hematoxylin & eosin; NC: Negative control.
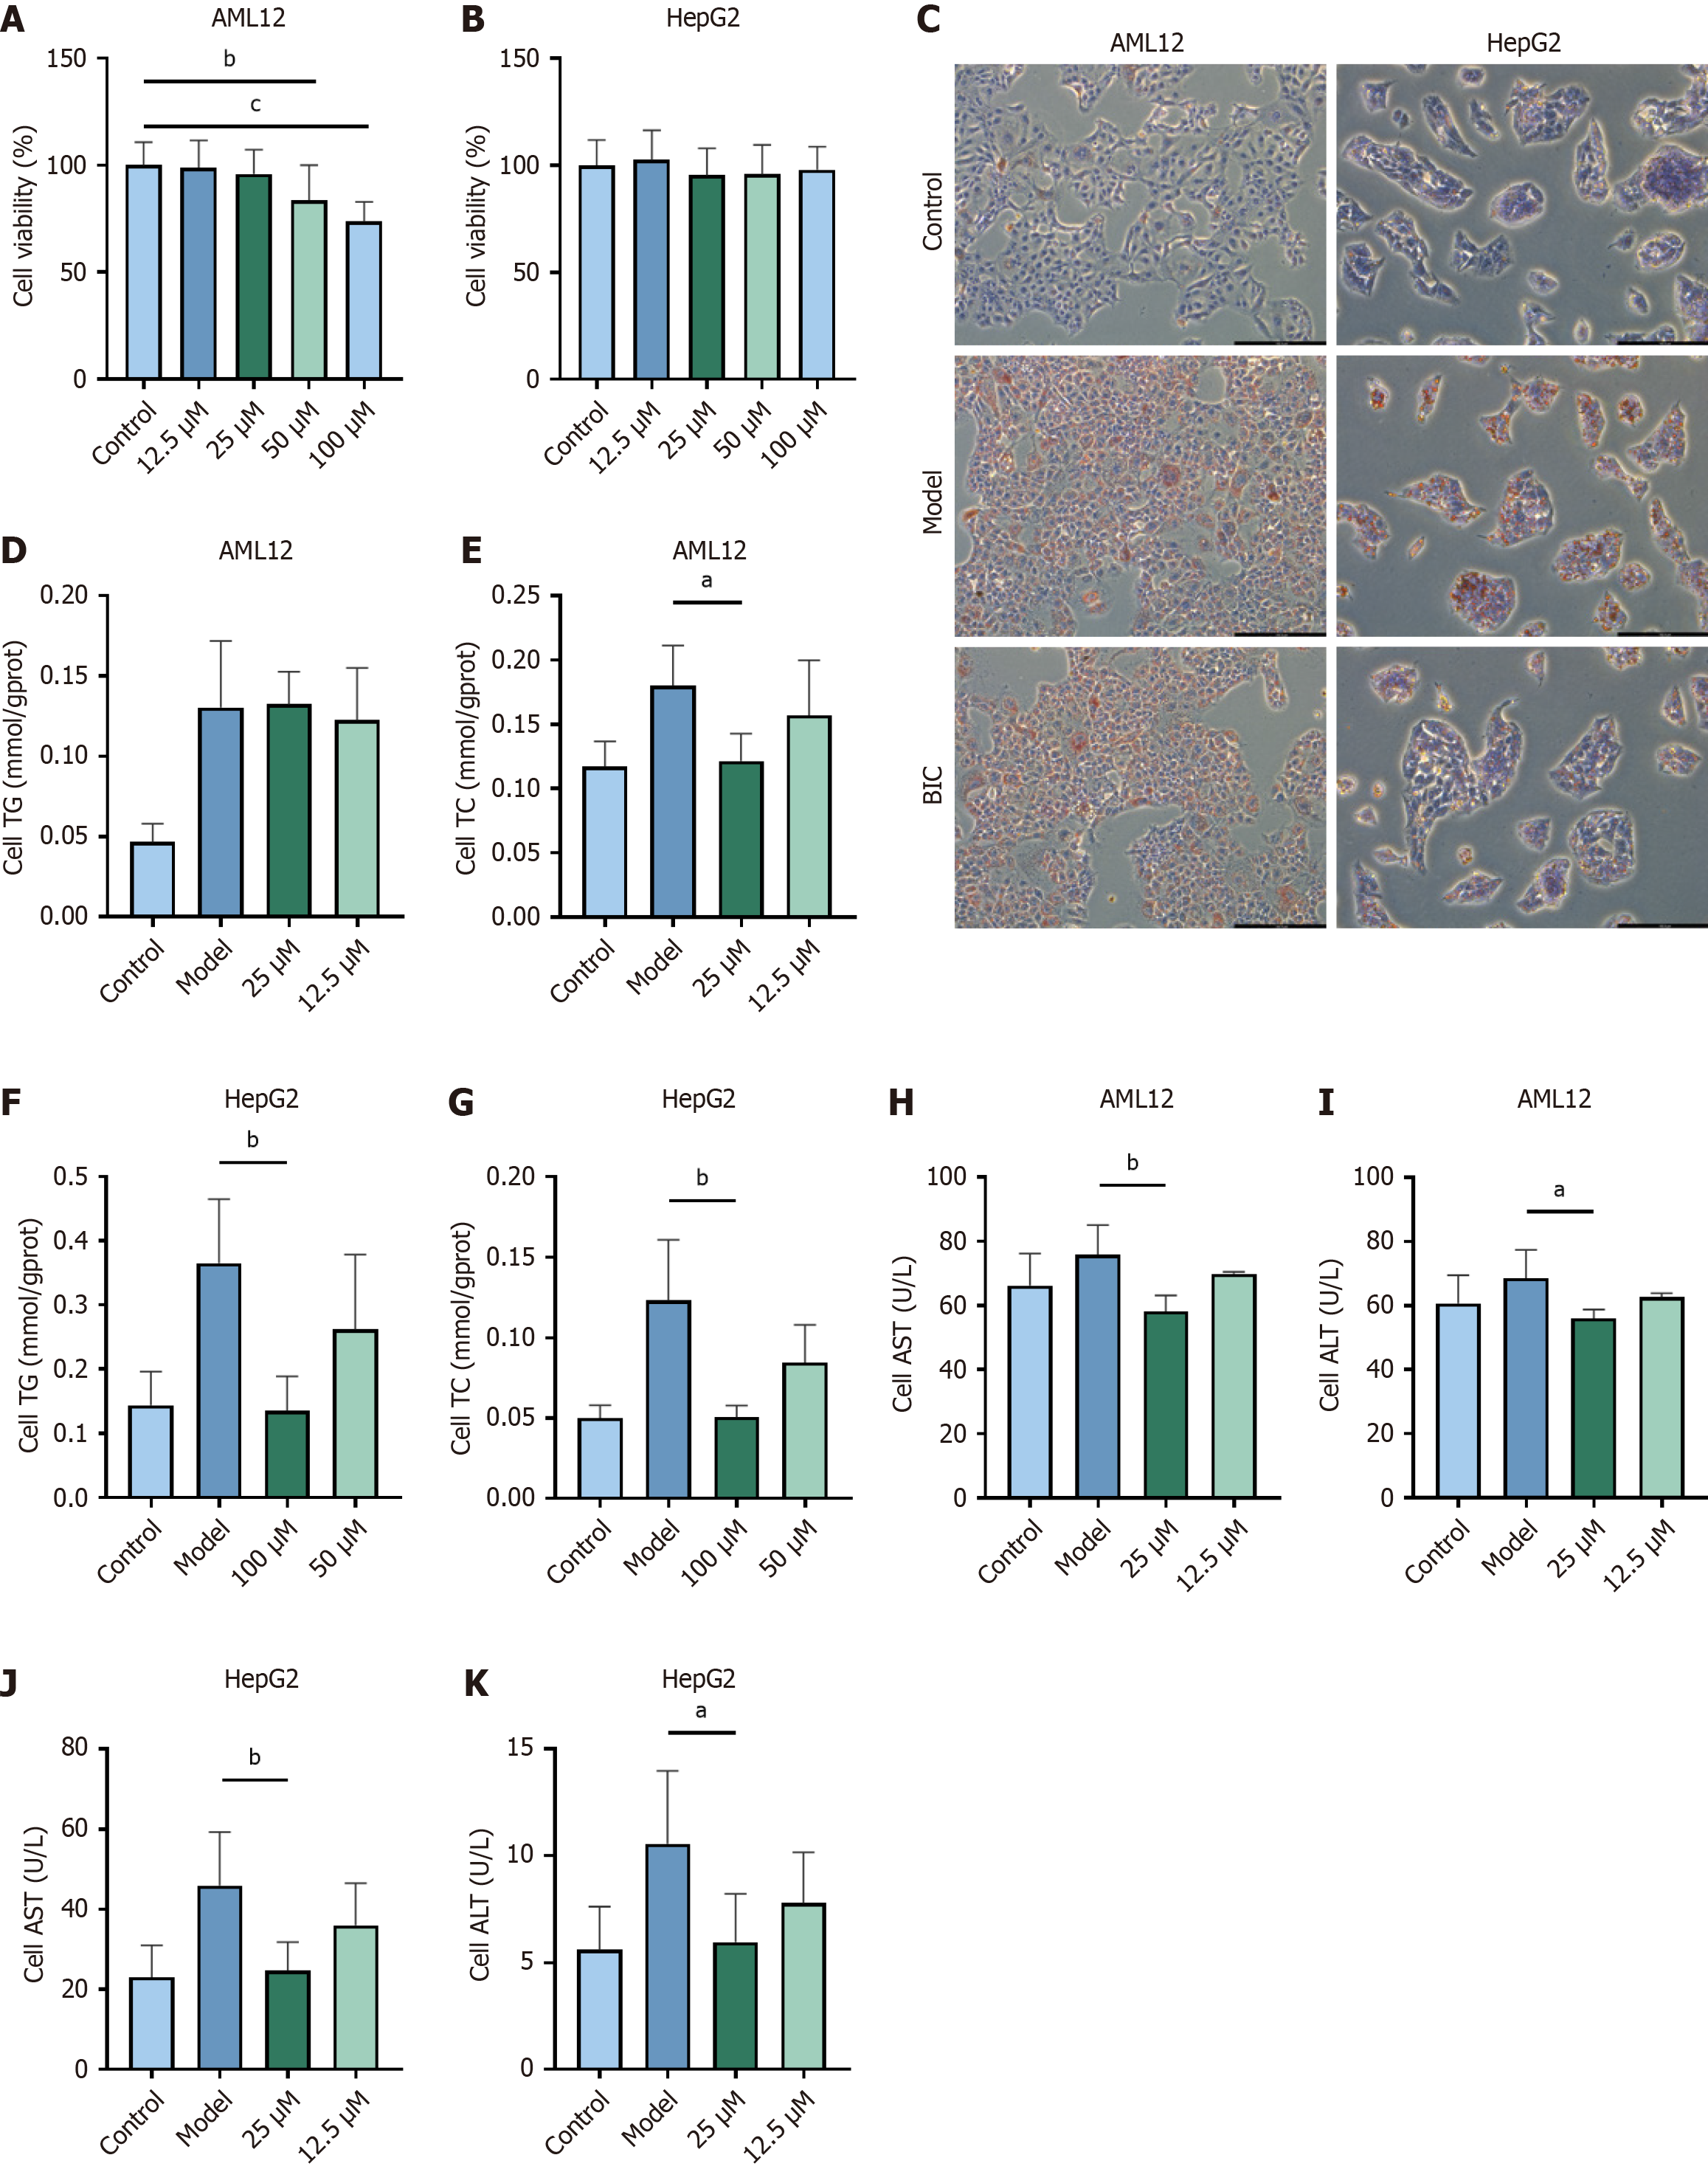
Figure 3 The therapeutic effect of bicuculline in a high-fat model of isolated hepatocytes.
A and B: Cytotoxic effects of different concentrations of bicuculline on AML12 cells and HepG2 cells; C: Oil red O staining results under light microscopy (200 ×); D-G: Relative total triglyceride and cholesterol levels in the two cell types; H-K: Absolute enzyme activity of alanine aminotransferase and aspartate aminotransferase in the two cell types. The results are expressed as the means ± SDs (n = 5). Comparison between the treatment group and model group. aP < 0.05; bP < 0.01; TC: Total cholesterol; ALT: Alanine aminotransferase; AST: Aspartate aminotransferase; TG: Triglyceride.
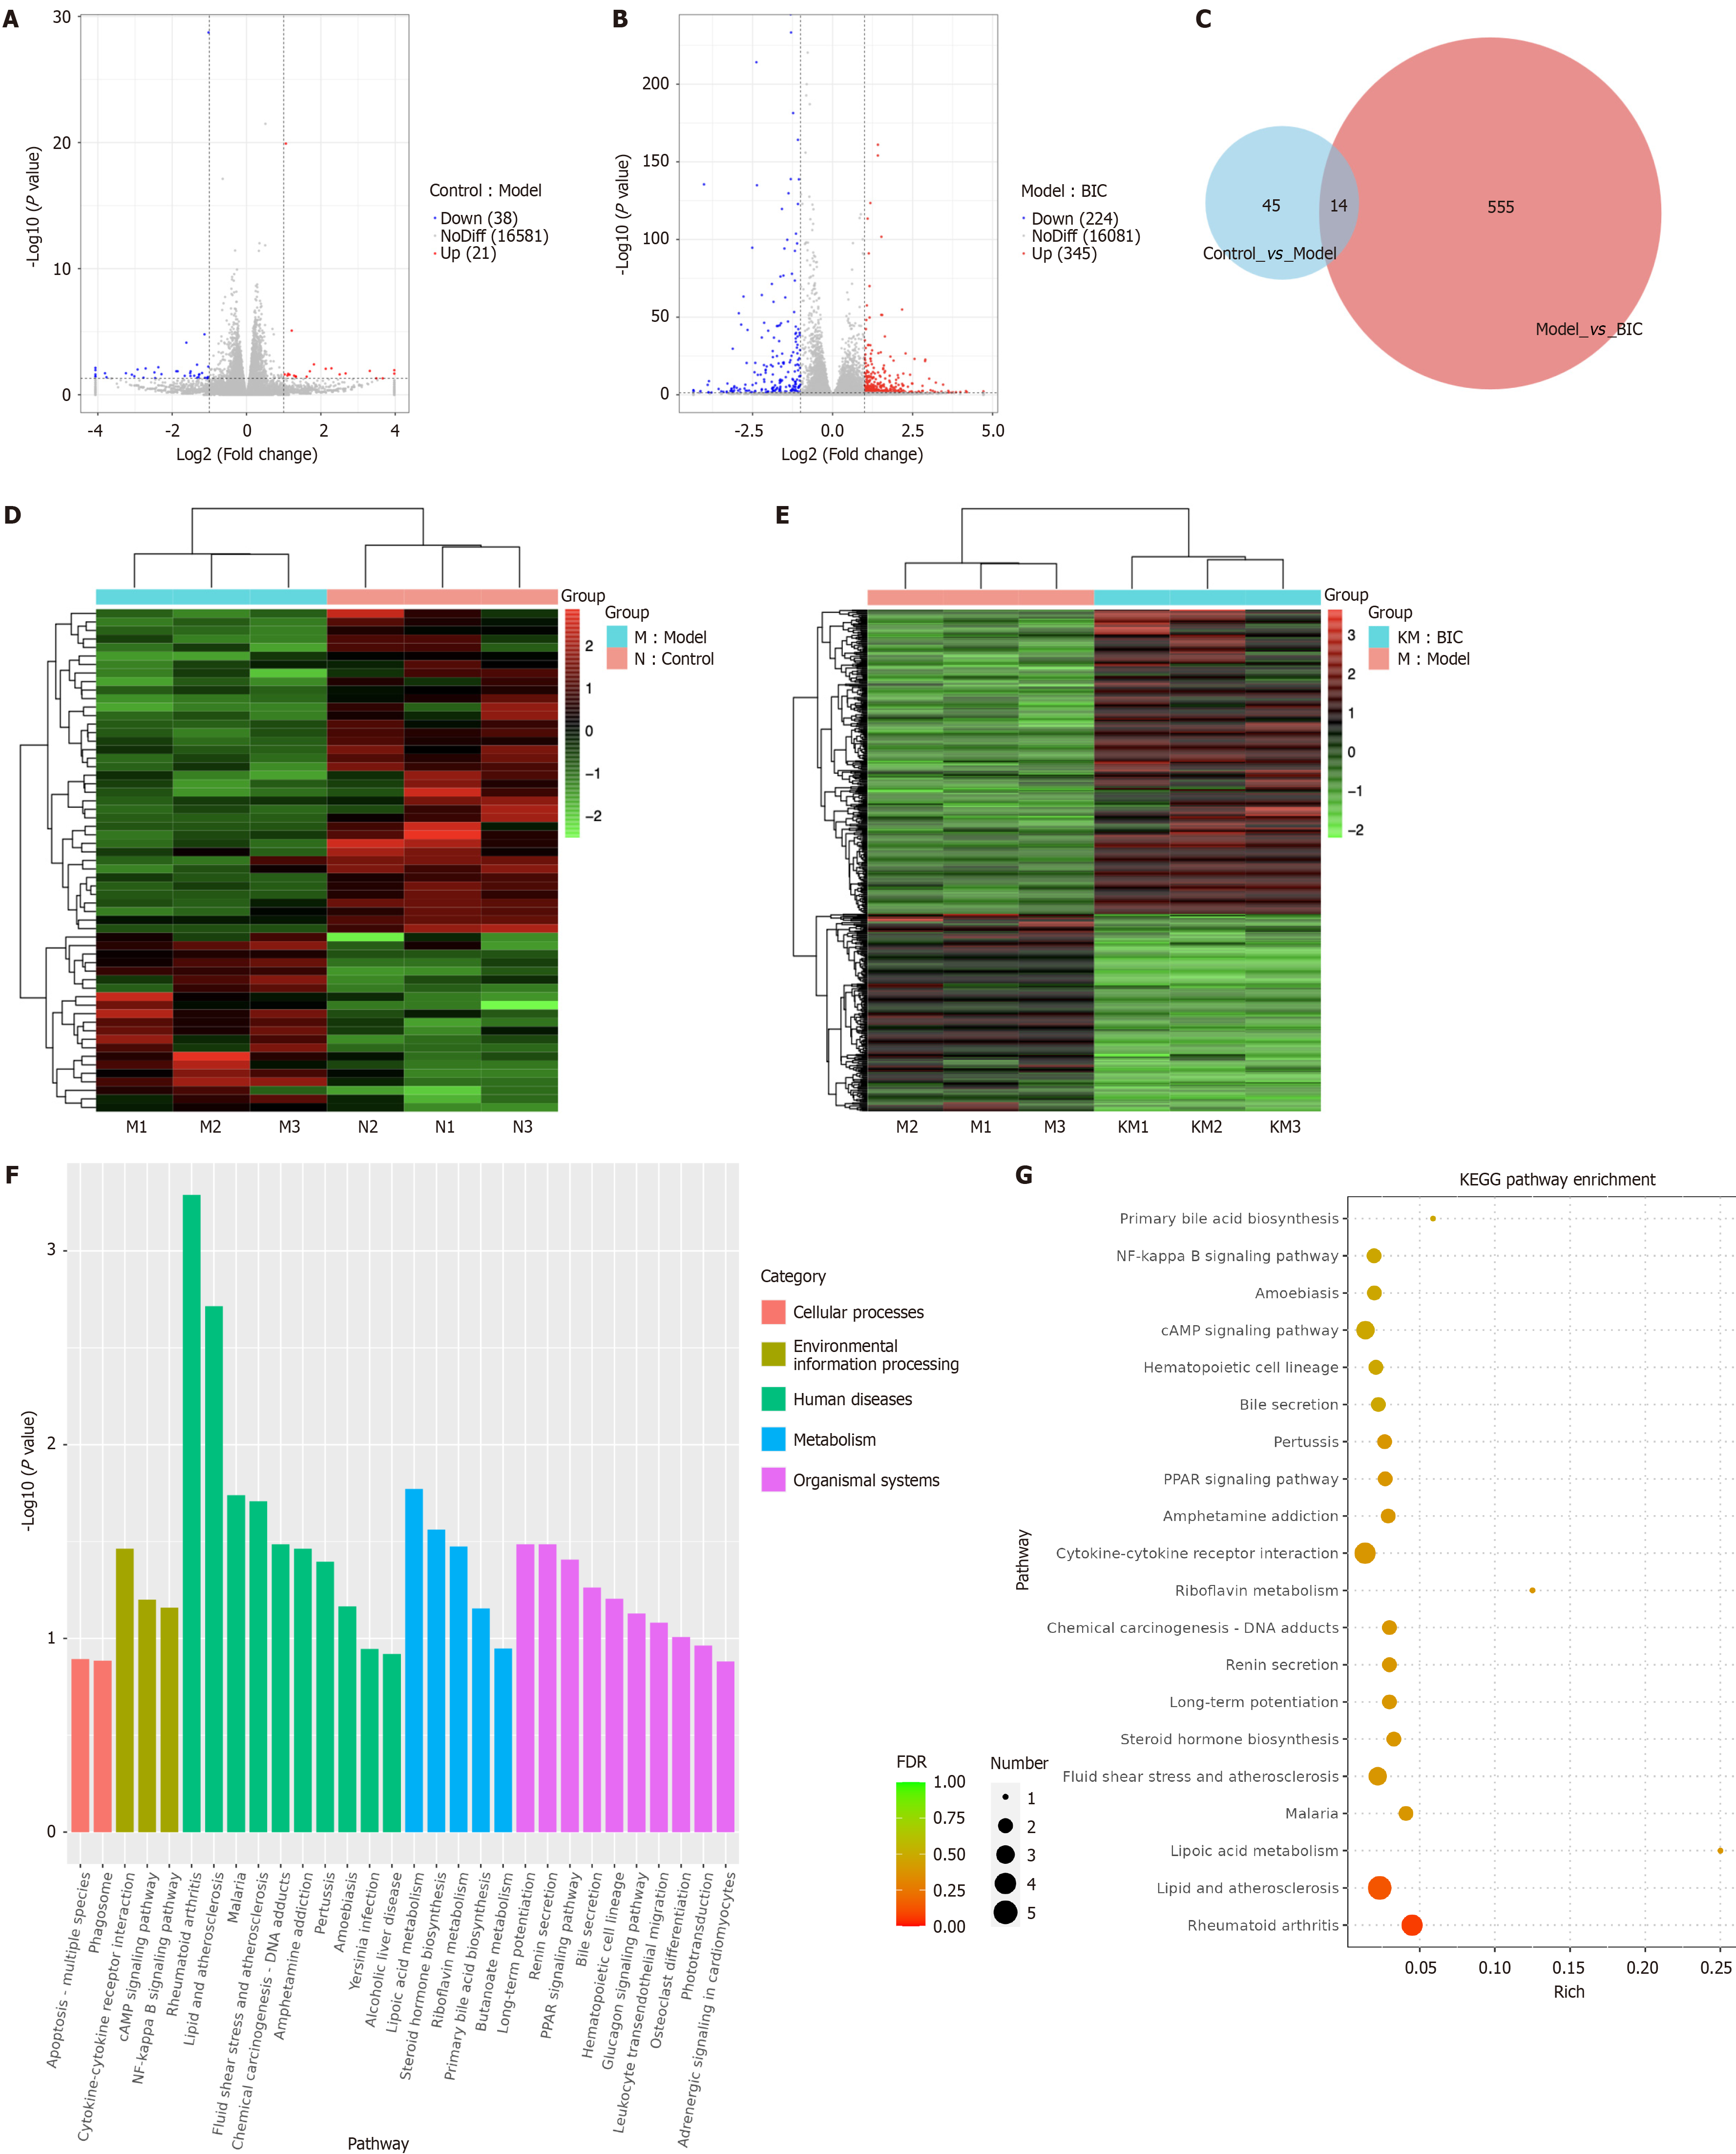
Figure 4 Bicuculline may regulate lipid metabolism disorders in metabolic dysfunction-associated steatotic liver disease through the inflammatory response and metabolic reprogramming.
A and B: Volcano plot of differentially expressed genes in the control vs model and model vs bicuculline (BIC) groups; C: Venn diagram; D and E: Differential gene heatmap of the control vs model and model vs BIC groups; F: Gene Ontology enrichment analysis; G: Kyoto Encyclopedia of Genes and Genomes signaling pathway analysis. KEGG: Kyoto Encyclopedia of Genes and Genomes.
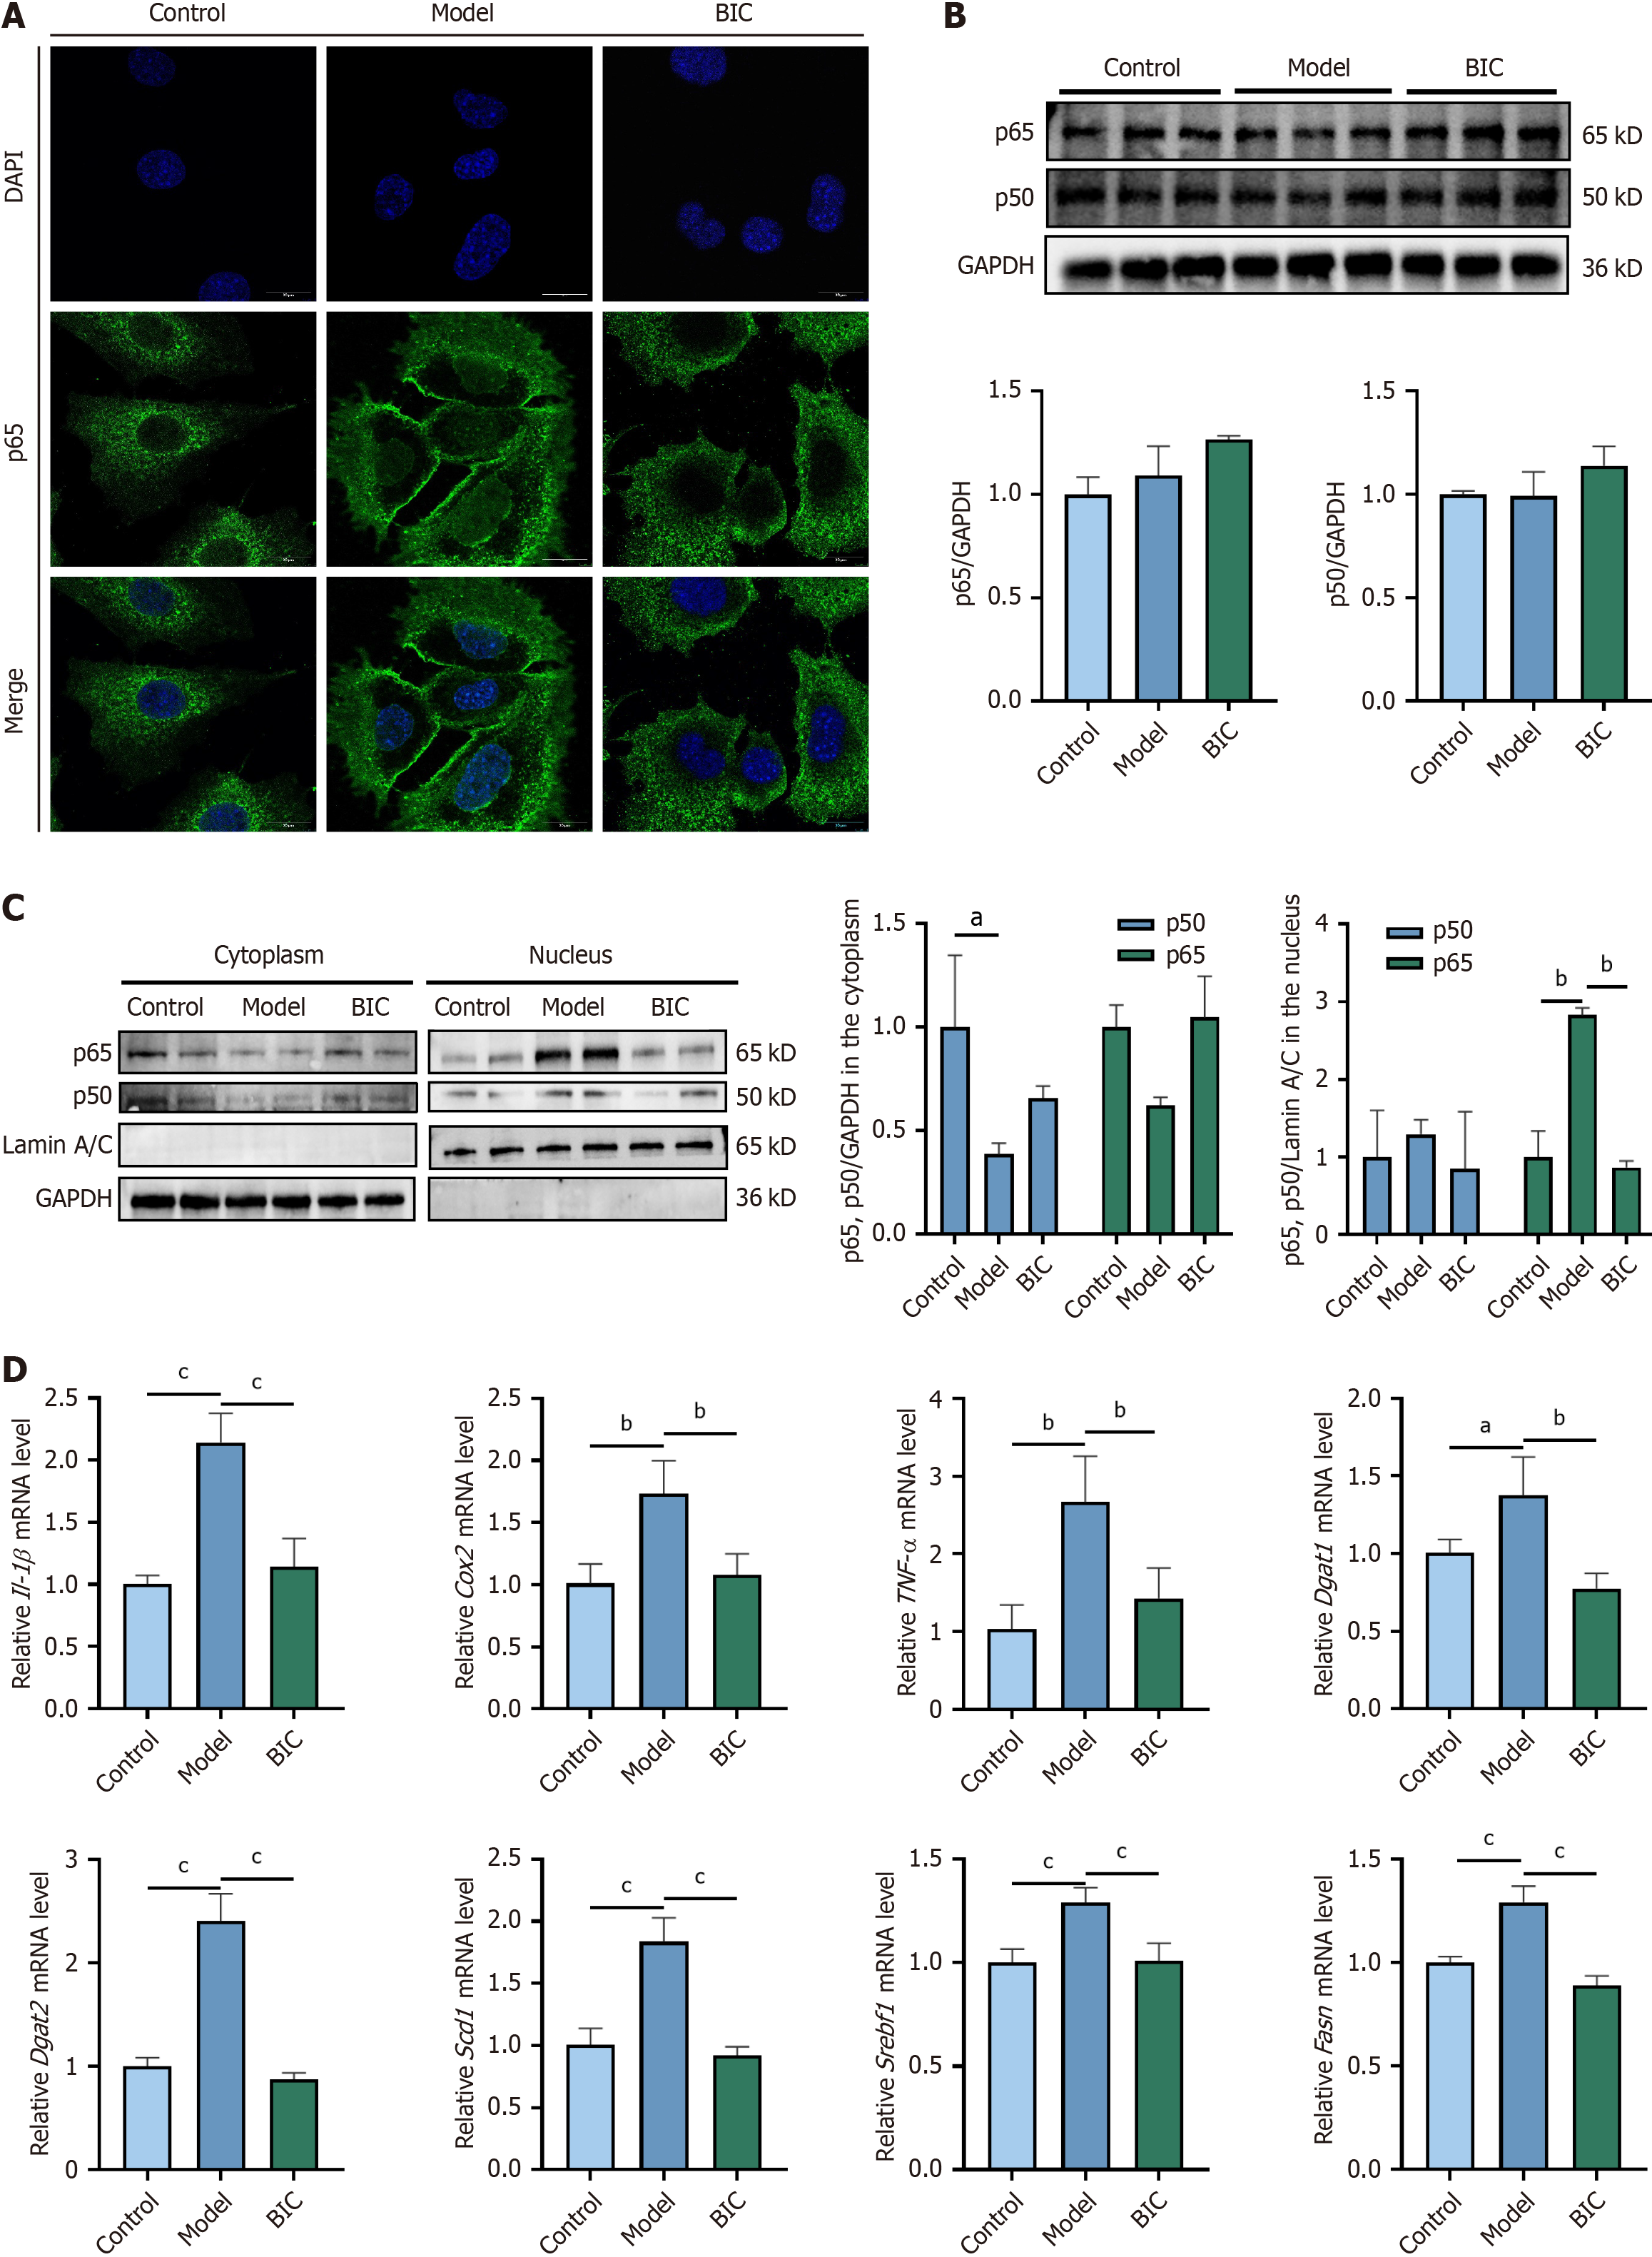
Figure 5 Bicuculline affects lipid accumulation in free fatty acid-treated AML12 cells through the nuclear factor-kappa B pathway.
A: After immunofluorescence staining, the localization of nuclear factor-kappa B p65 (green) was observed using confocal microscopy. The nuclei were stained with DAPI (blue); B and C: Representative western blotting results and density analysis of p65 and p50 expression; the results are expressed as the means ± SD (n = 2); D: QRT-PCR analysis of Dgat1, Dgat2, Scd1, Srebf1, Fasn, IL-1β, COX2, and TNF-α gene expression. The results are expressed as the mean ± SD (n = 4). Compared with the model group. aP < 0.05; bP < 0.01; cP < 0.001; BIC: Bicuculline.
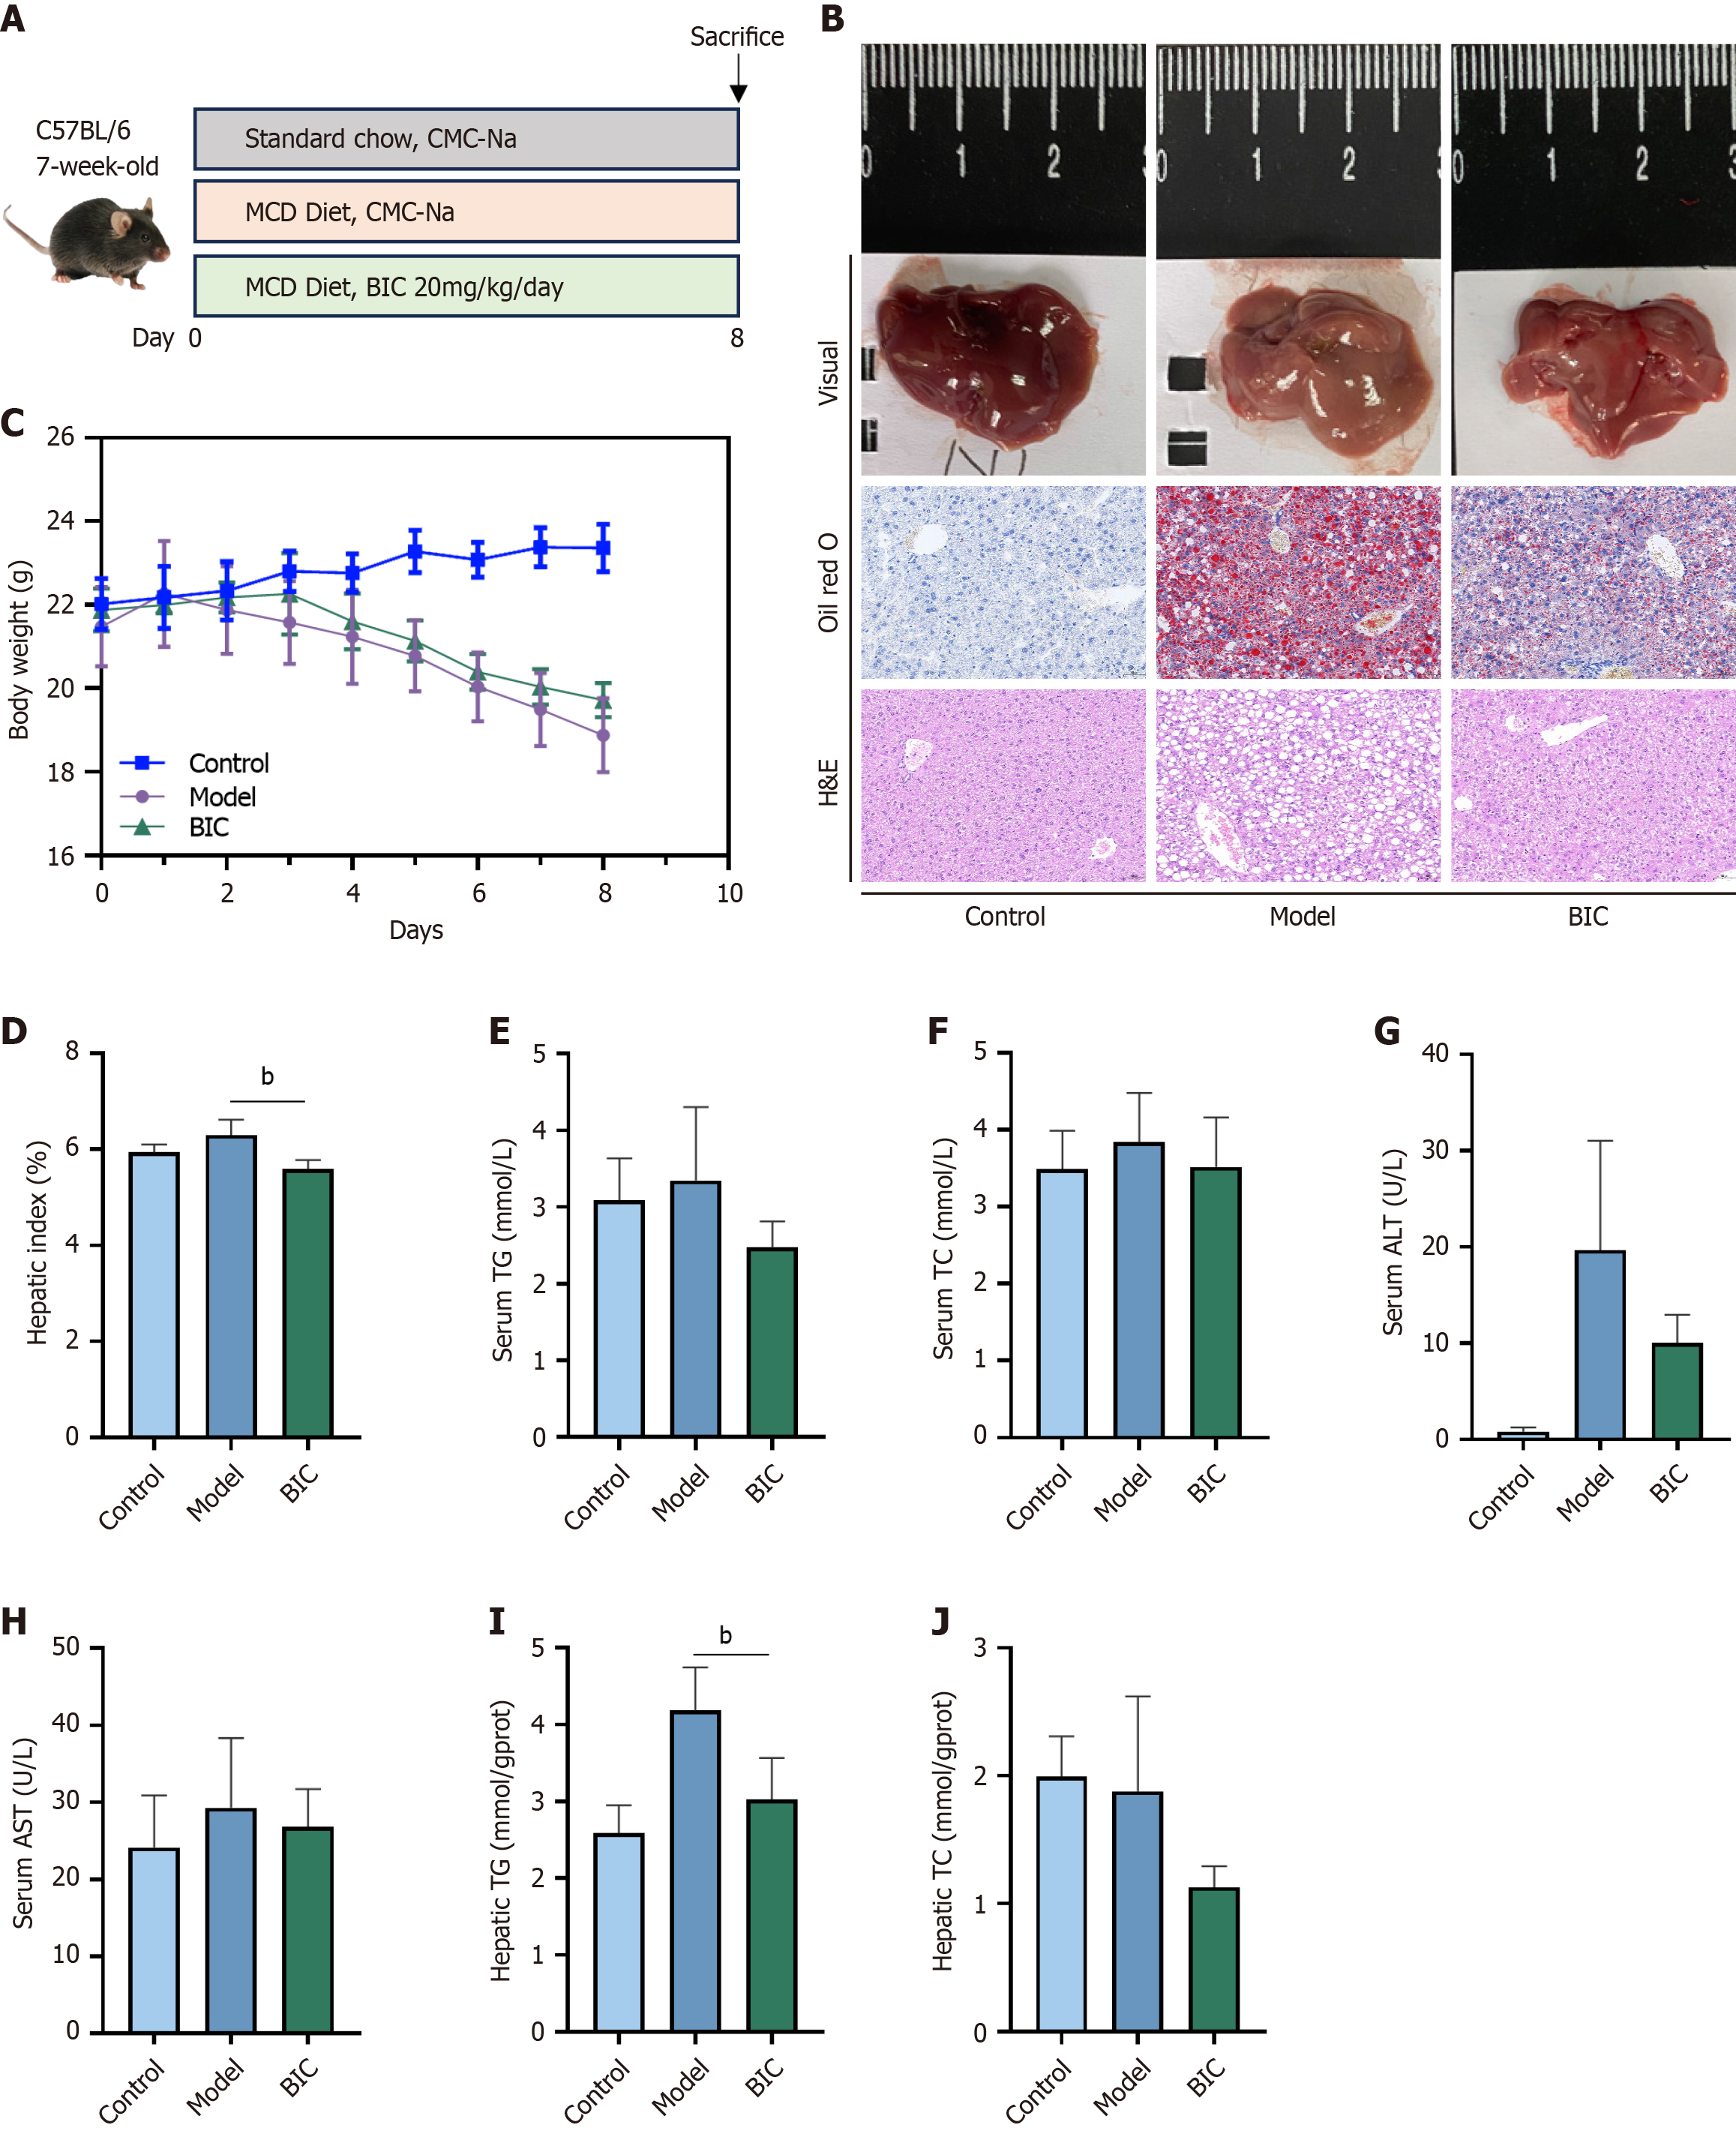
Figure 6 Bicuculline mitigated liver damage and steatosis in WT mice that were fed a methionine/choline-deficient diet.
A: Experimental diagram of feeding metabolic dysfunction-associated steatotic liver disease model mice that were fed a methionine/choline-deficient diet; B: Representative macroscopic image of mouse liver, representative images of oil red O staining, and representative images of hematoxylin & eosin staining (200 ×); C: Changes in mouse body weight; D: Mouse liver indices; E and F: Serum total triglyceride and cholesterol contents; G and H: Absolute values of alanine aminotransferase and aspartate aminotransferase enzyme activities in the serum; I and J: Relative total triglyceride and cholesterol contents in liver tissues. The results are expressed as the means ± SD (n = 5). Compared with the model group. aP < 0.05; bP < 0.01; H&E: Hematoxylin & eosin; BIC: Bicuculline.
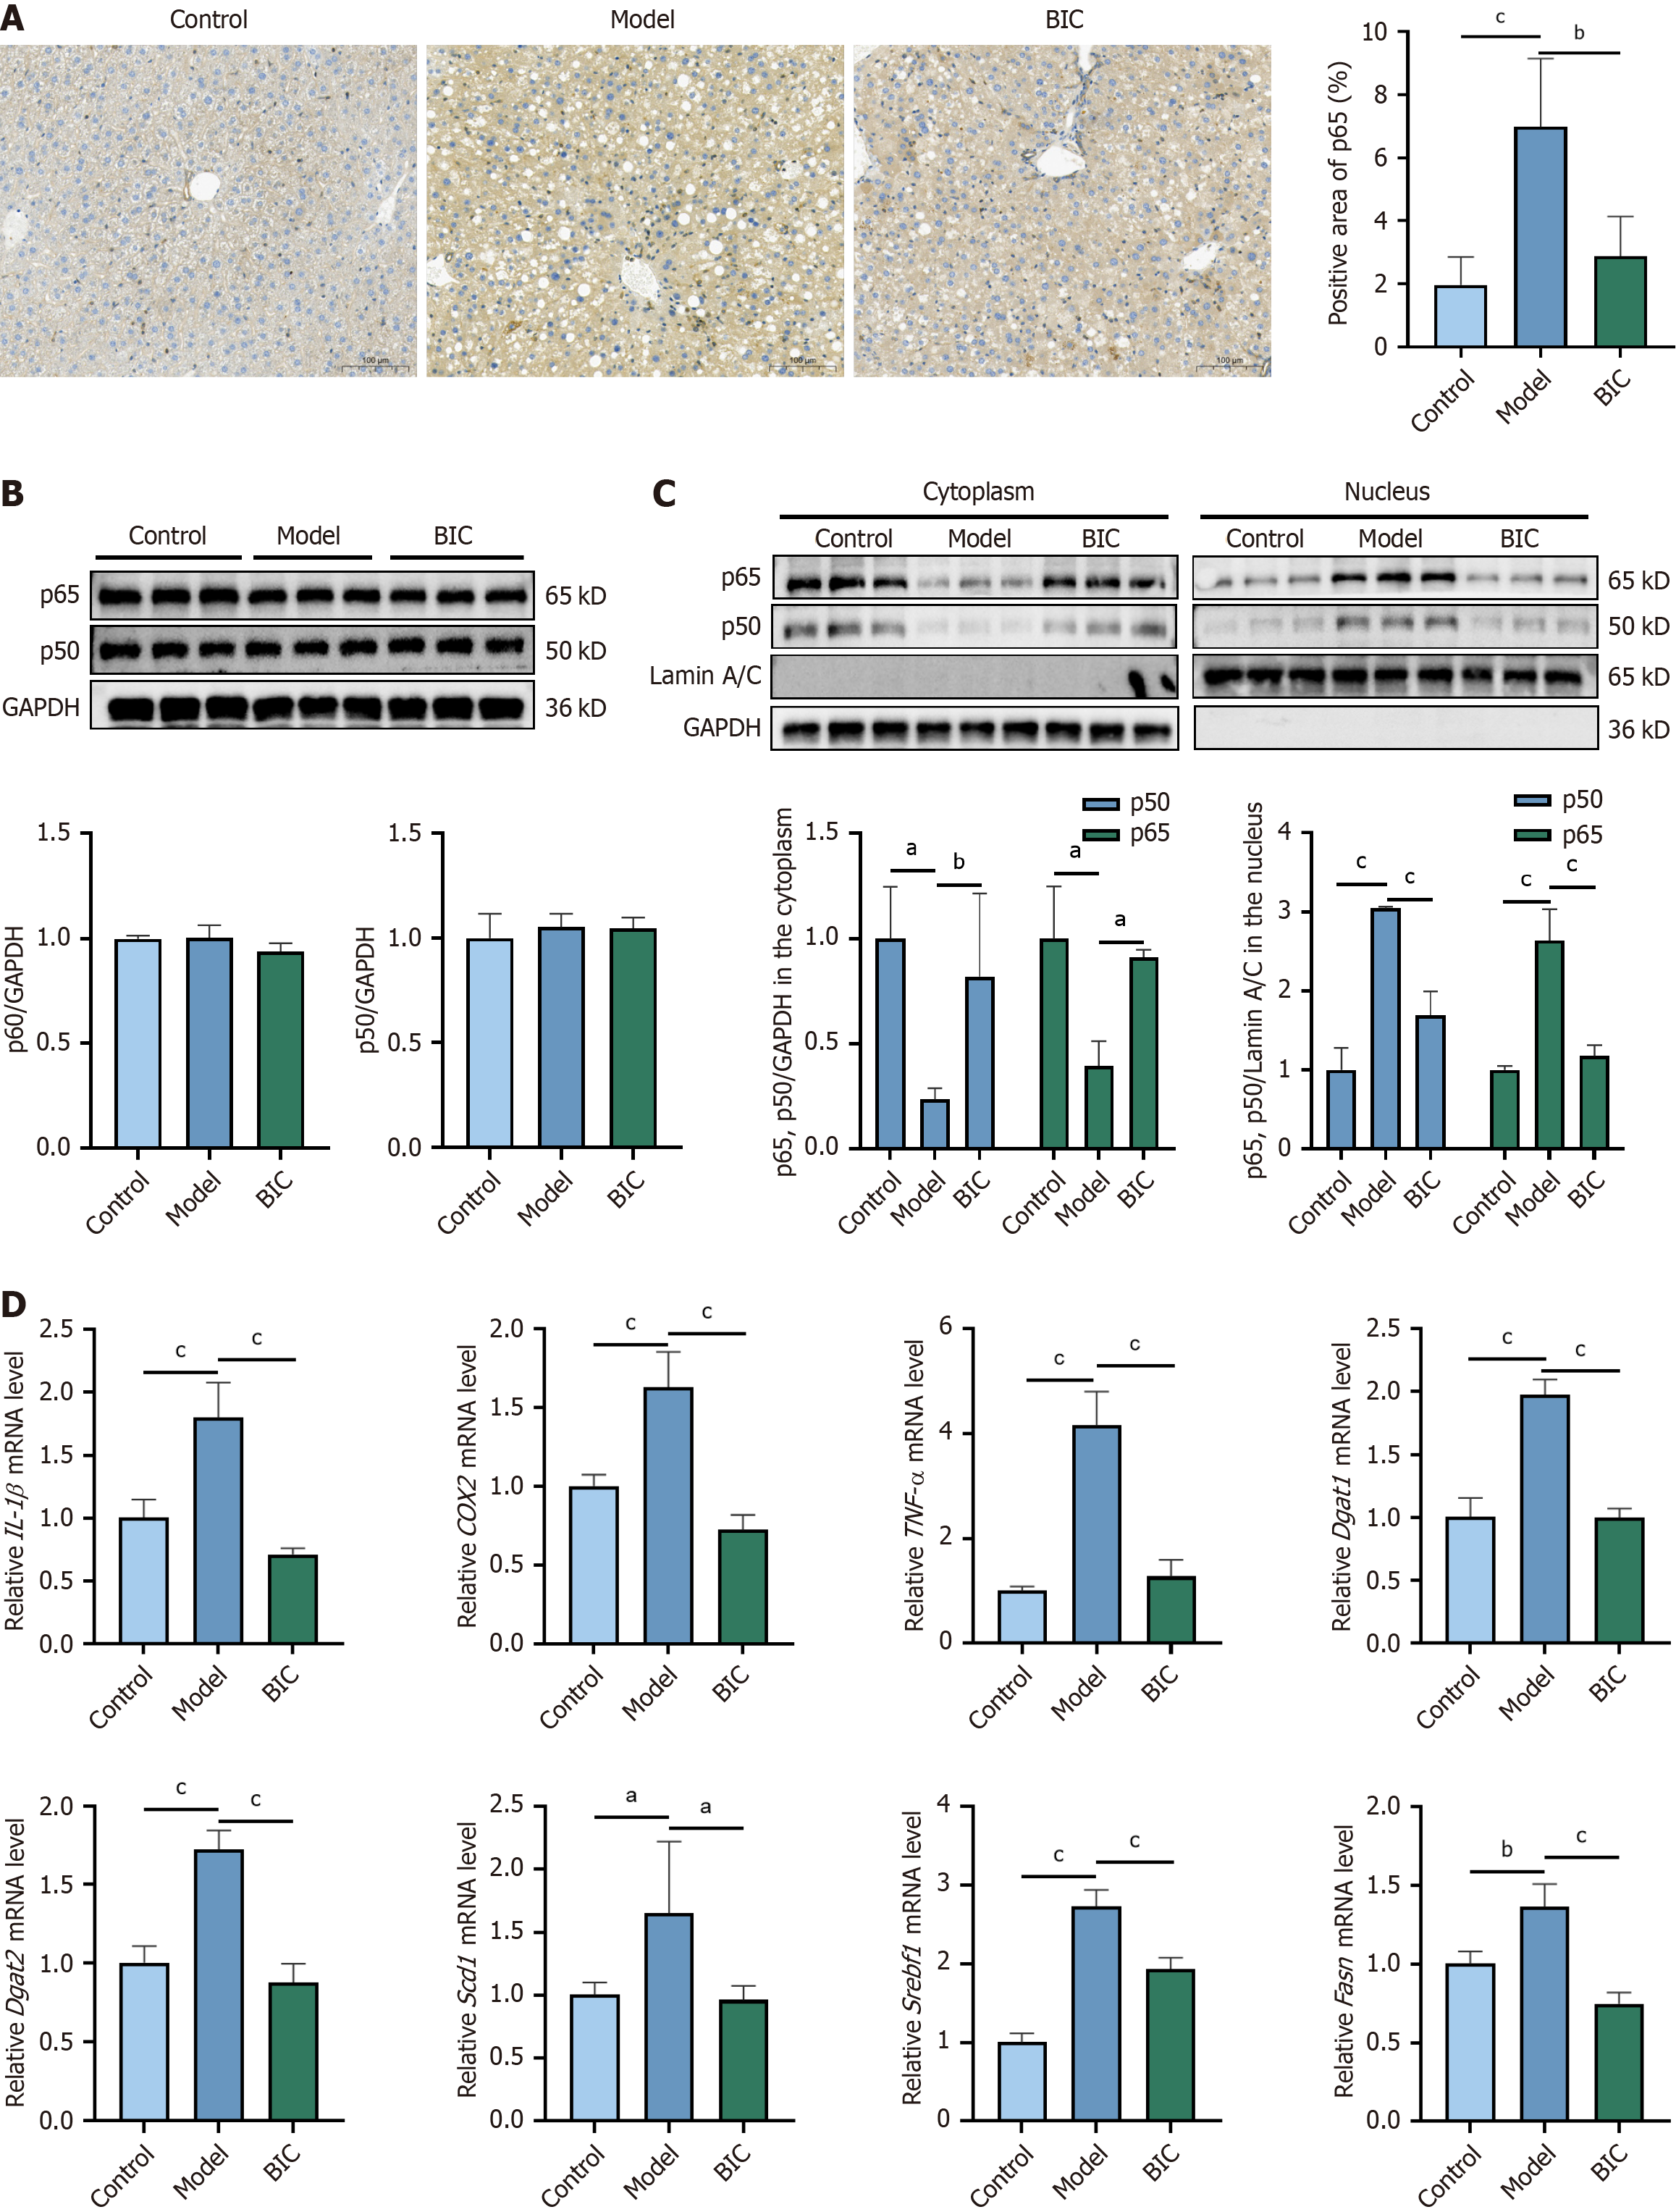
Figure 7 Bicuculline affects lipid accumulation in metabolic dysfunction-associated steatotic liver disease model mice through the nuclear factor-kappa B pathway.
A: Representative images of immunohistochemical staining for p65 (brown); B and C: Representative western blotting results and density analysis of p50 and p65 expression; the results are expressed as the means ± SD (n = 3); D: QRT-PCR analysis of Dgat1, Dgat2, Scd1, Srebf1, Fasn, IL-1β, COX2, and TNF-α gene expression. The results are expressed as the mean ± SD (n = 4). Compared with the model group. aP < 0.05; bP < 0.01; cP < 0.001; BIC: Bicuculline.
- Citation: Wang XM, Dai Z, Lu DJ, Bao CQ, Yang NB, Zhou YP. Bicuculline ameliorates metabolic dysfunction-associated steatotic liver disease by inhibiting the nuclear factor-kappa B pathway and reducing lipid accumulation. World J Gastroenterol 2025; 31(17): 105438
- URL: https://www.wjgnet.com/1007-9327/full/v31/i17/105438.htm
- DOI: https://dx.doi.org/10.3748/wjg.v31.i17.105438


