Copyright
©The Author(s) 2025.
World J Gastroenterol. Apr 28, 2025; 31(16): 105985
Published online Apr 28, 2025. doi: 10.3748/wjg.v31.i16.105985
Published online Apr 28, 2025. doi: 10.3748/wjg.v31.i16.105985
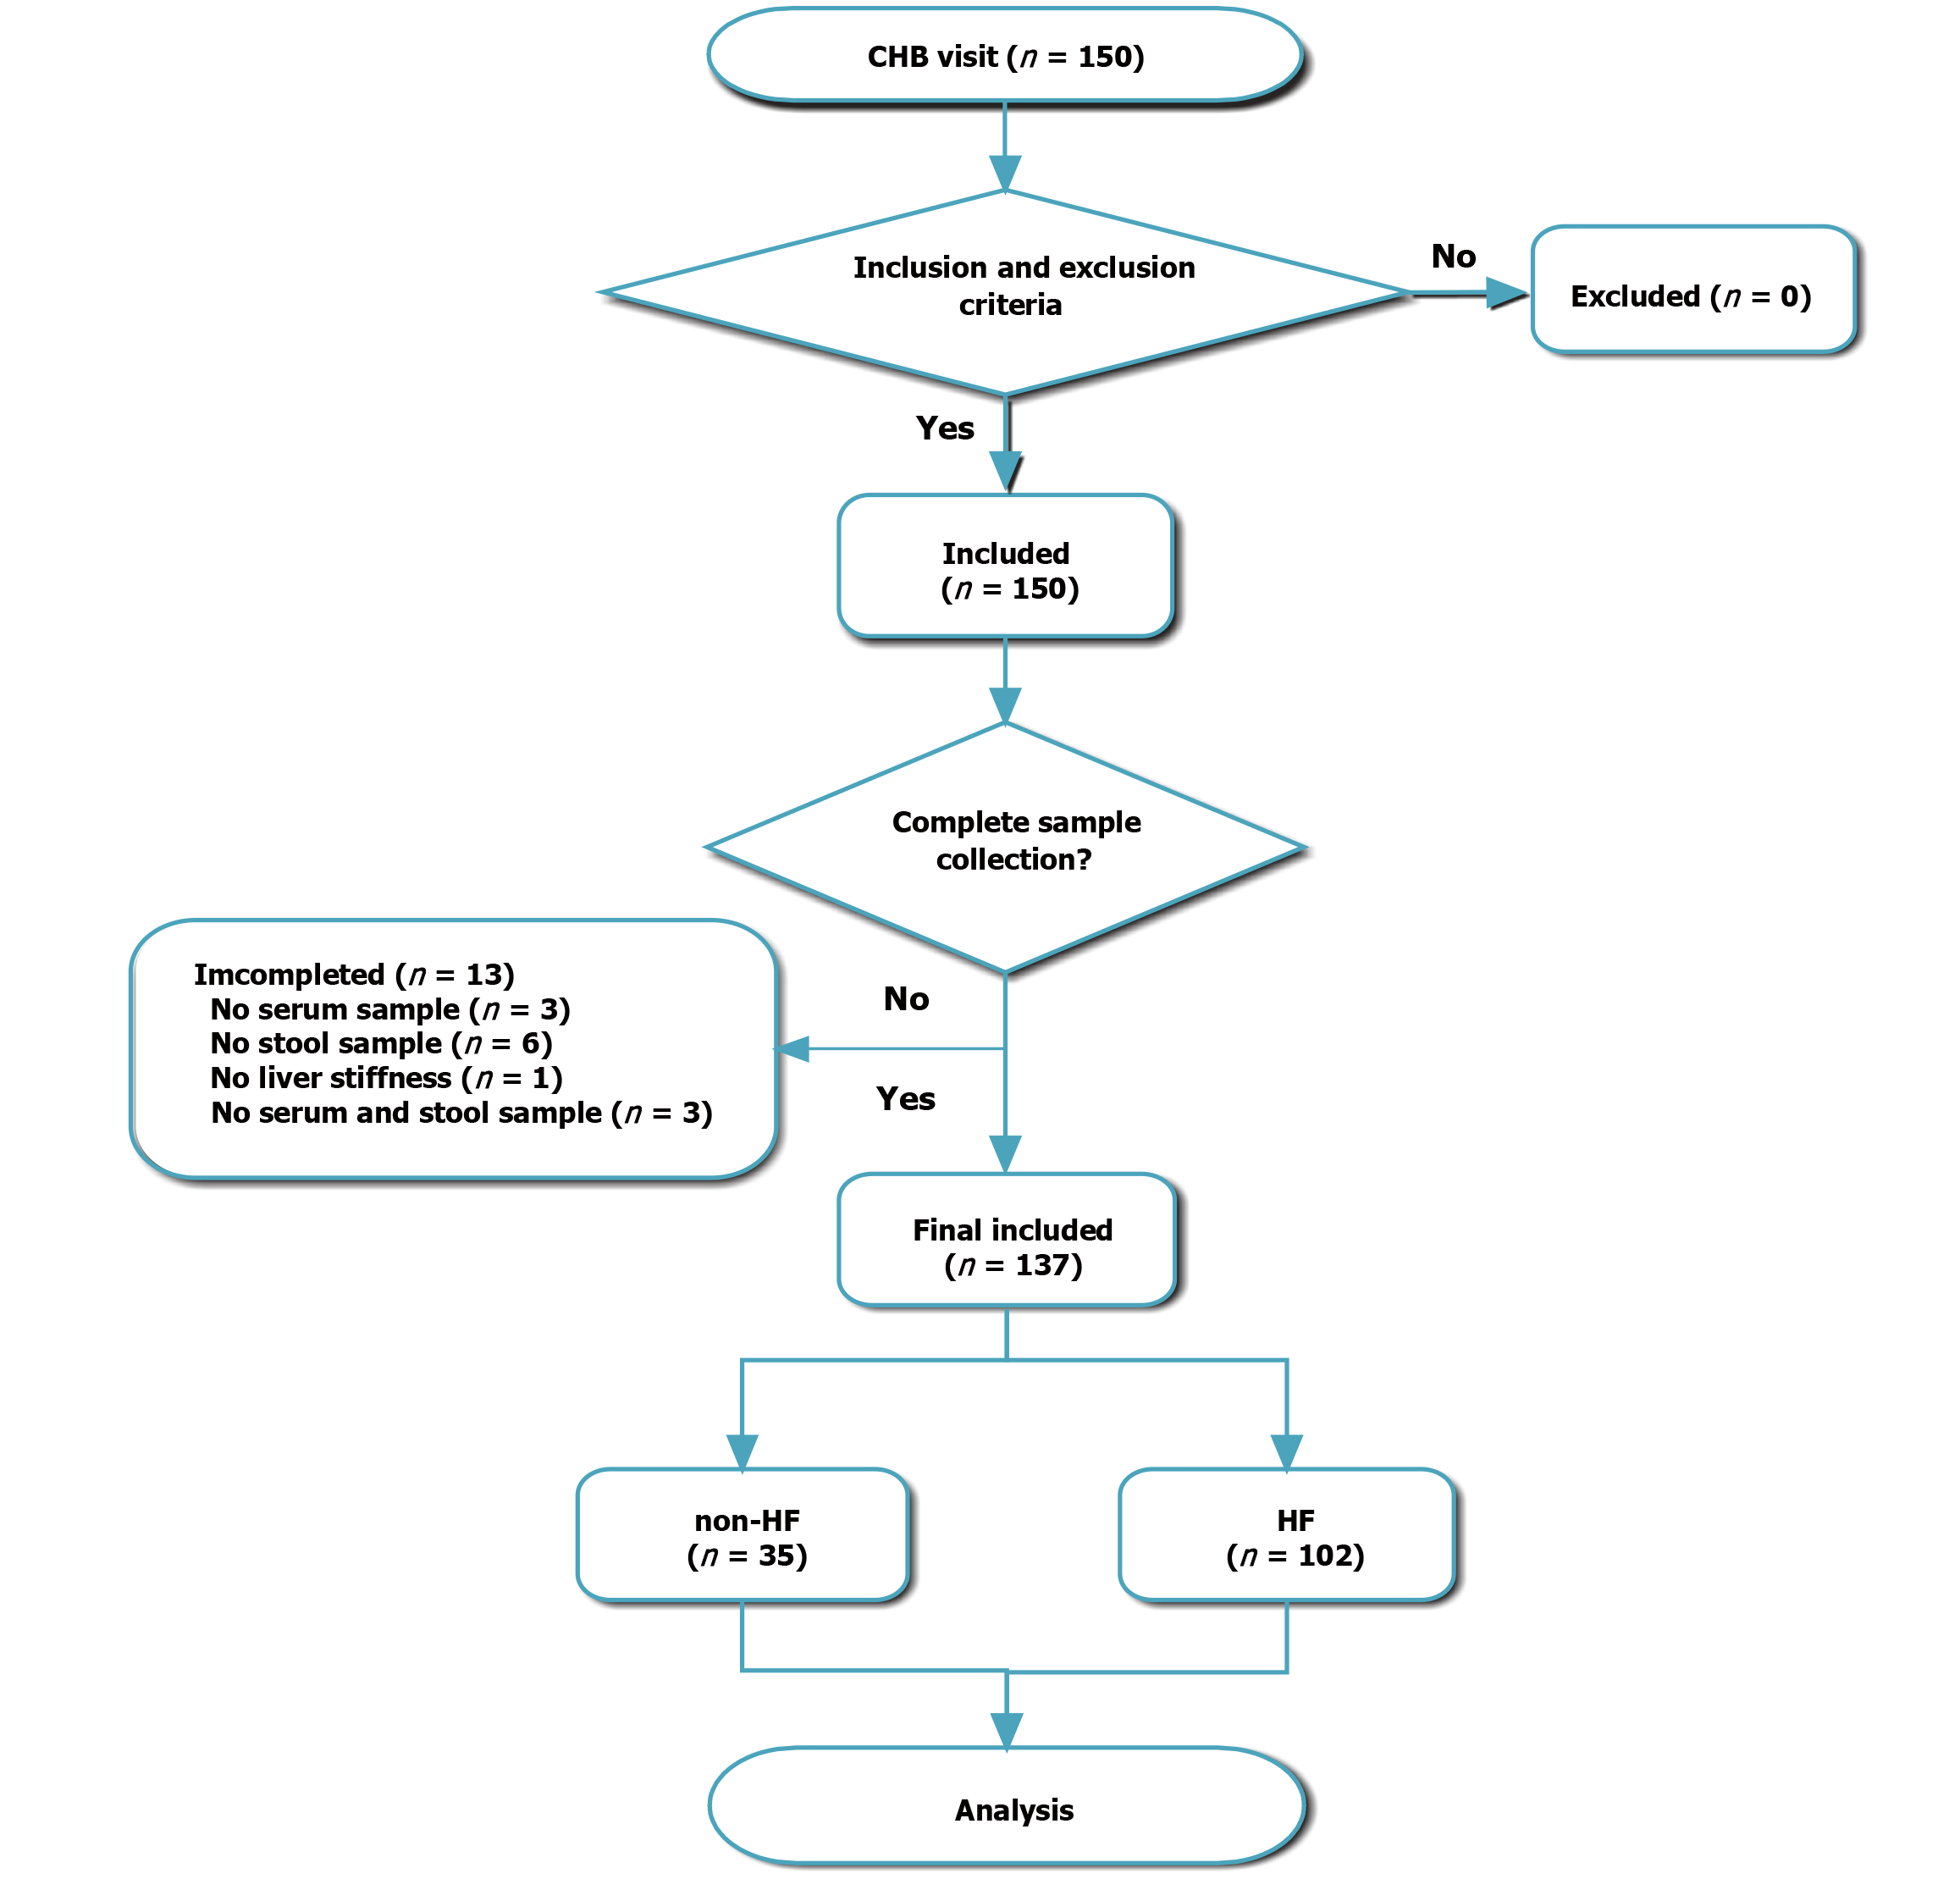
Figure 1 Flow chart of sample inclusion, exclusion and final grouping for chronic hepatitis B patients.
CHB: Chronic hepatitis B; HF: Hepatic fibrosis.
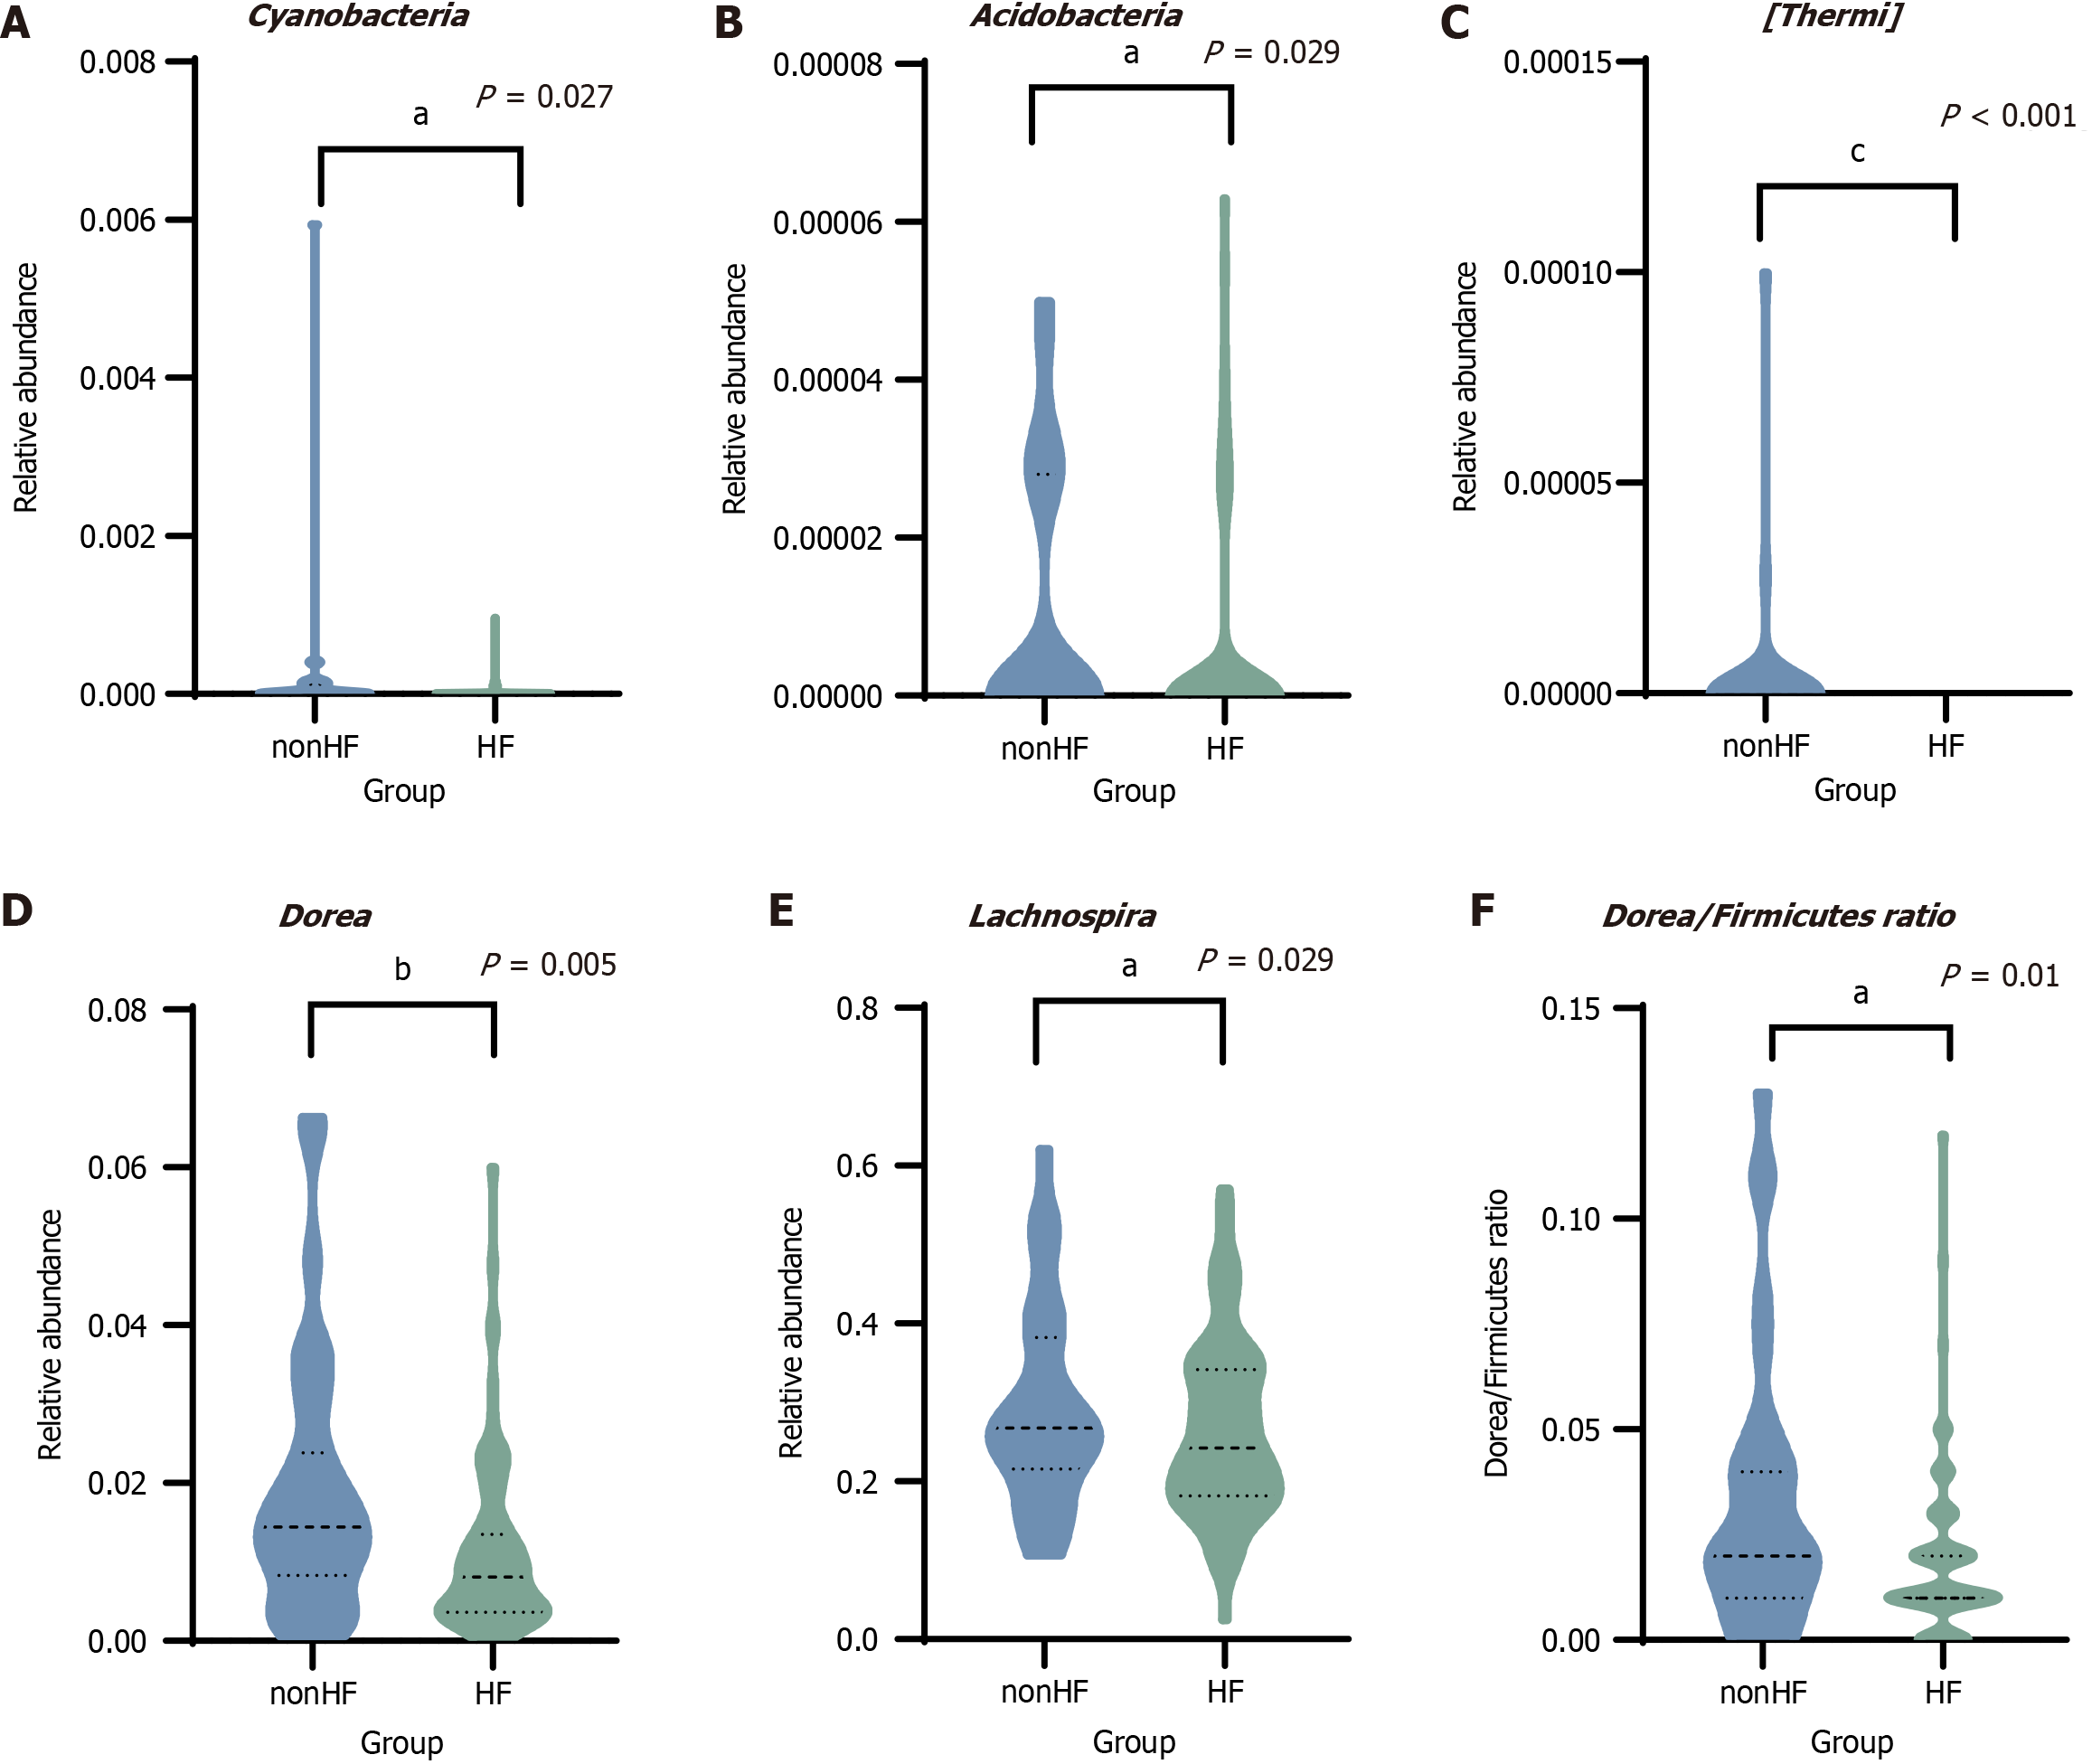
Figure 2 Identification of differential gut microbiota features in non-hepatic fibrosis and hepatic fibrosis groups.
The relative abundance in non-hepatic fibrosis and hepatic fibrosis groups. A: Cyanobacteria; B: Acidobacteria; C: Thermophilic bacteria; D: Dorea; E: Lachnospira; F: The Dorea/Firmicutes ratio. All data were analyzed by the Mann-Whitney U test. aP < 0.05. bP < 0.01. cP < 0.001. HF: Hepatic fibrosis.
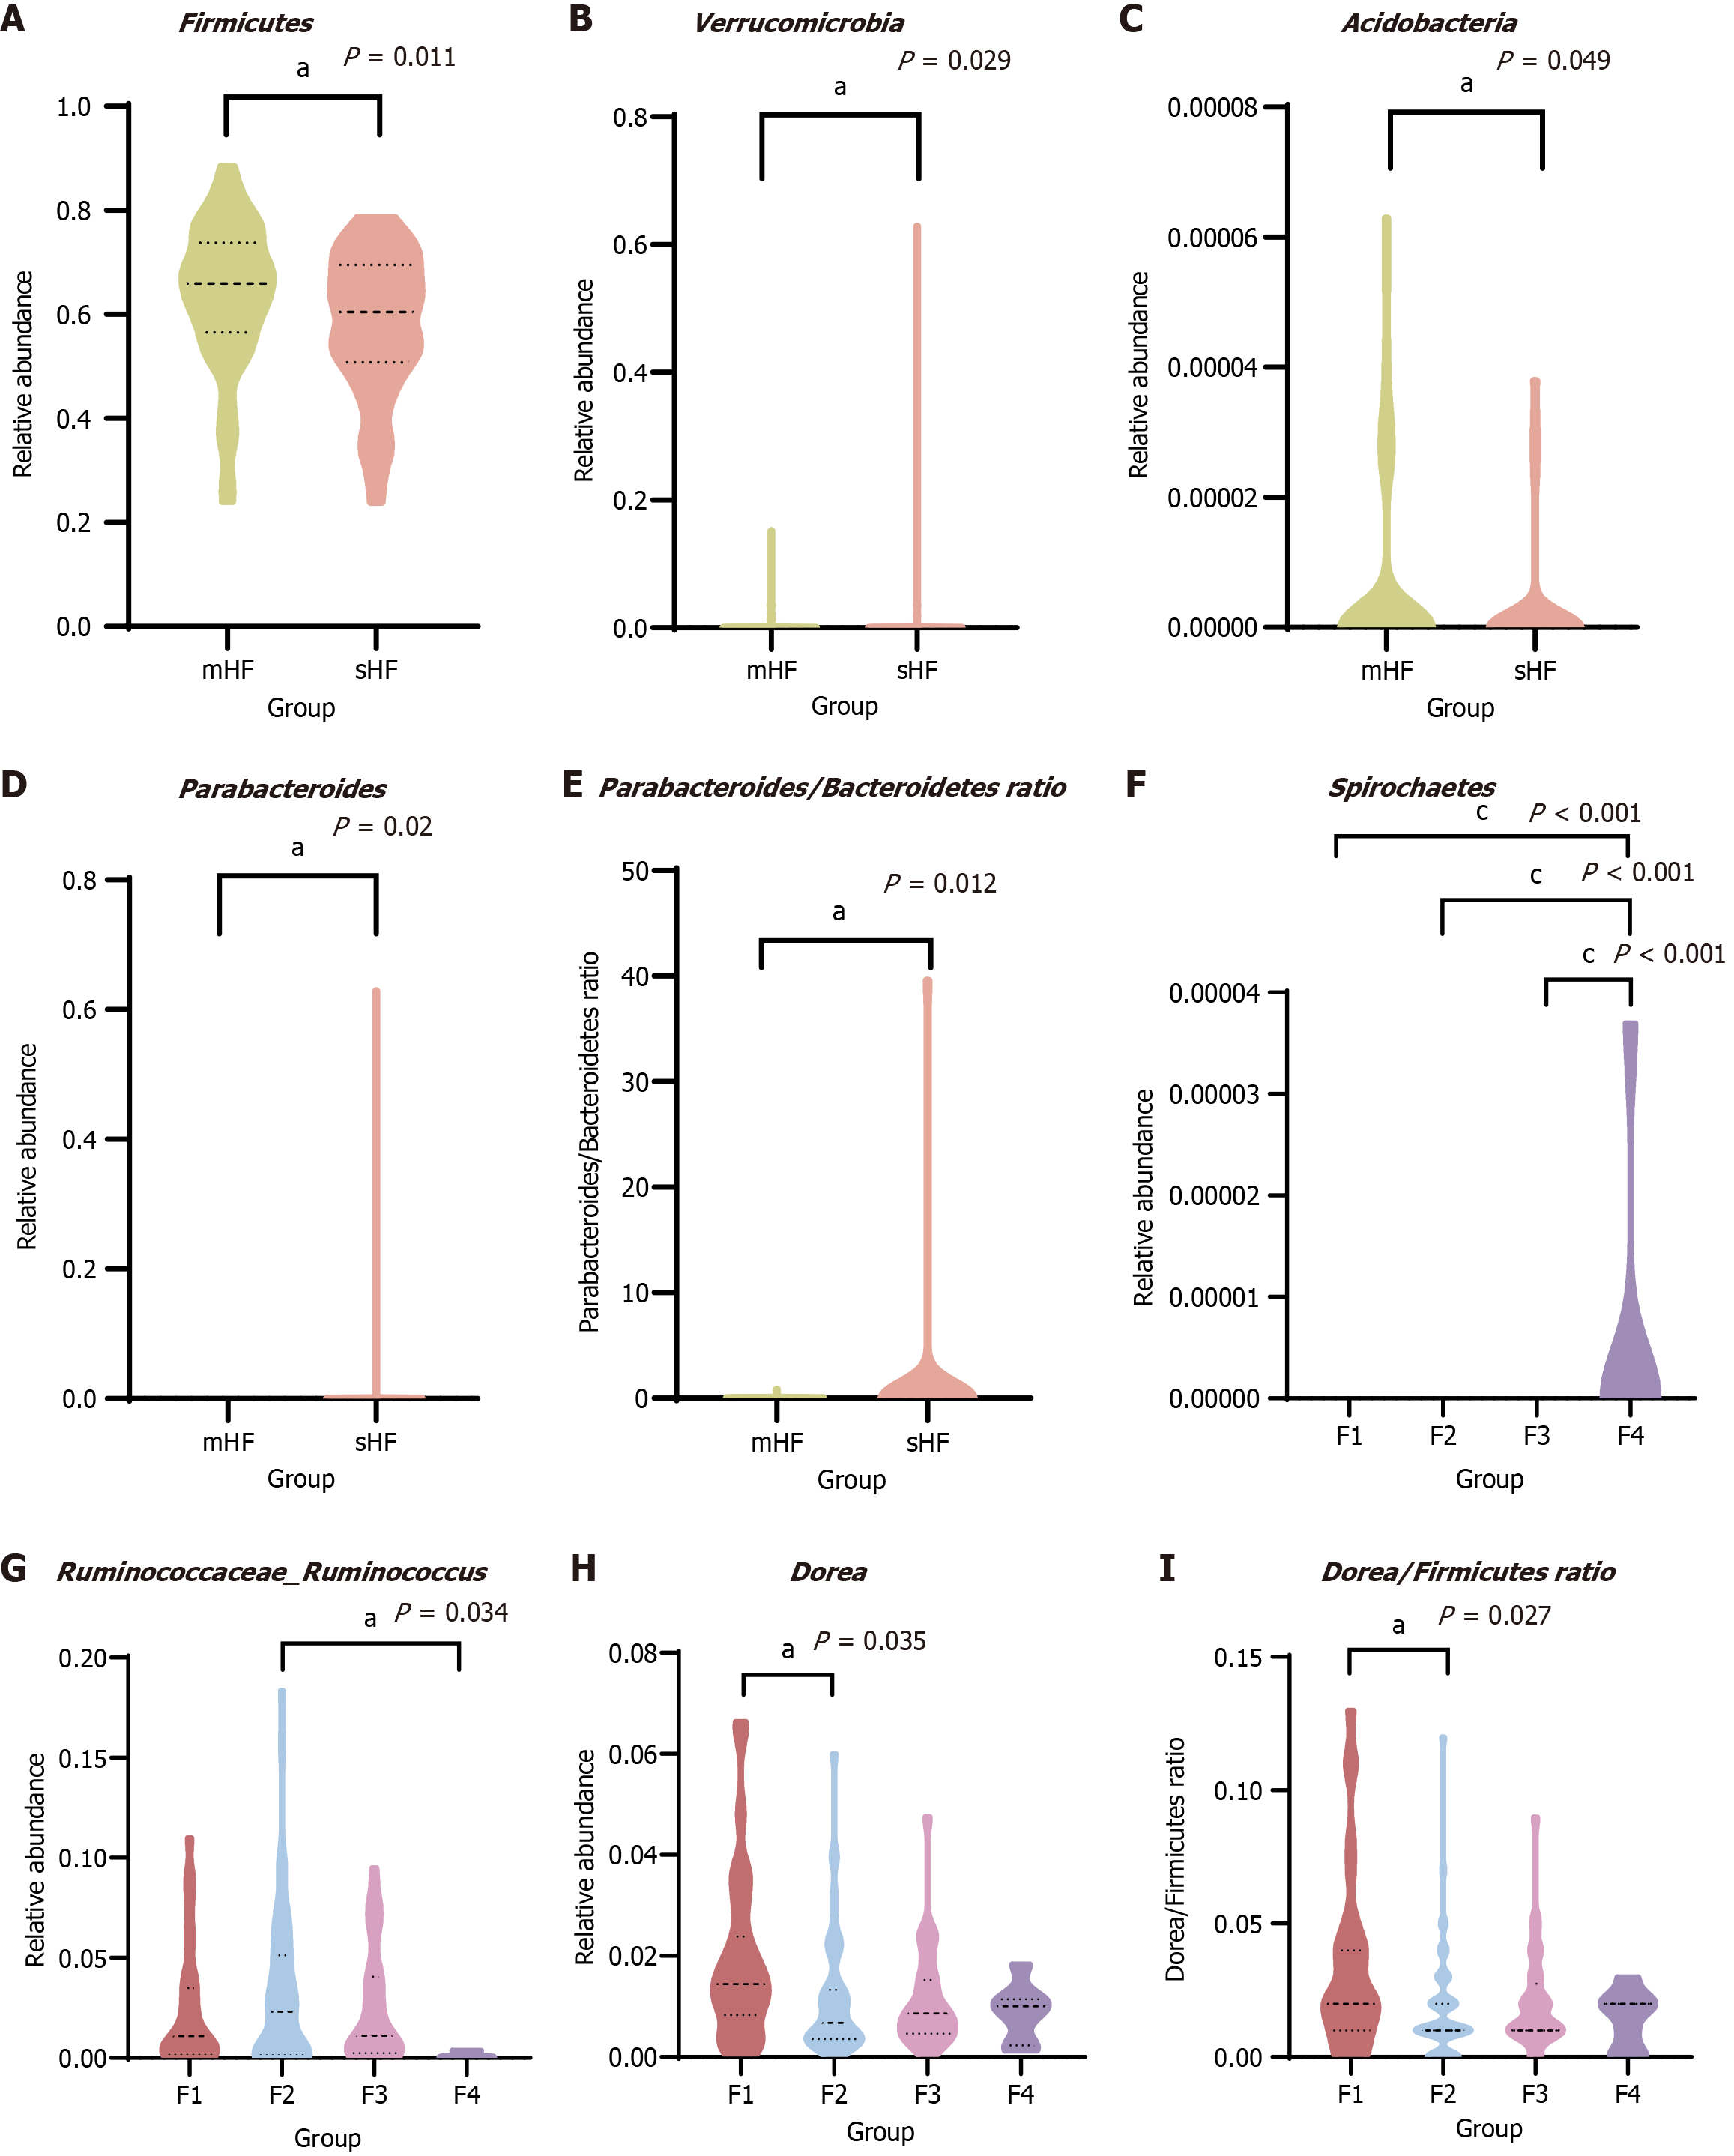
Figure 3 Identification of differential gut microbiota features in patients in mild hepatic fibrosis and significant hepatic fibrosis groups and different stages of hepatic fibrosis.
A-C: The relative abundance at the phylum level: Firmicutes (A); Verrucomicrobia (B); Acidobacteria (C); D: The relative abundance of Parabacteroides at the genus level; E: The Parabacteroides/Bacteroidetes ratio in mild hepatic fibrosis and significant hepatic fibrosis groups; F-H: The relative abundance at the phylum level: Spirochaetes (F); Ruminococcaceae Ruminococcus (G); Dorea (H); I: The Dorea/Firmicutes ratio in different stages of hepatic fibrosis. All data were analyzed by the Mann-Whitney U test. aP < 0.05. bP < 0.01. cP < 0.001. mHF: Mild hepatic fibrosis; sHF: Significant hepatic fibrosis.
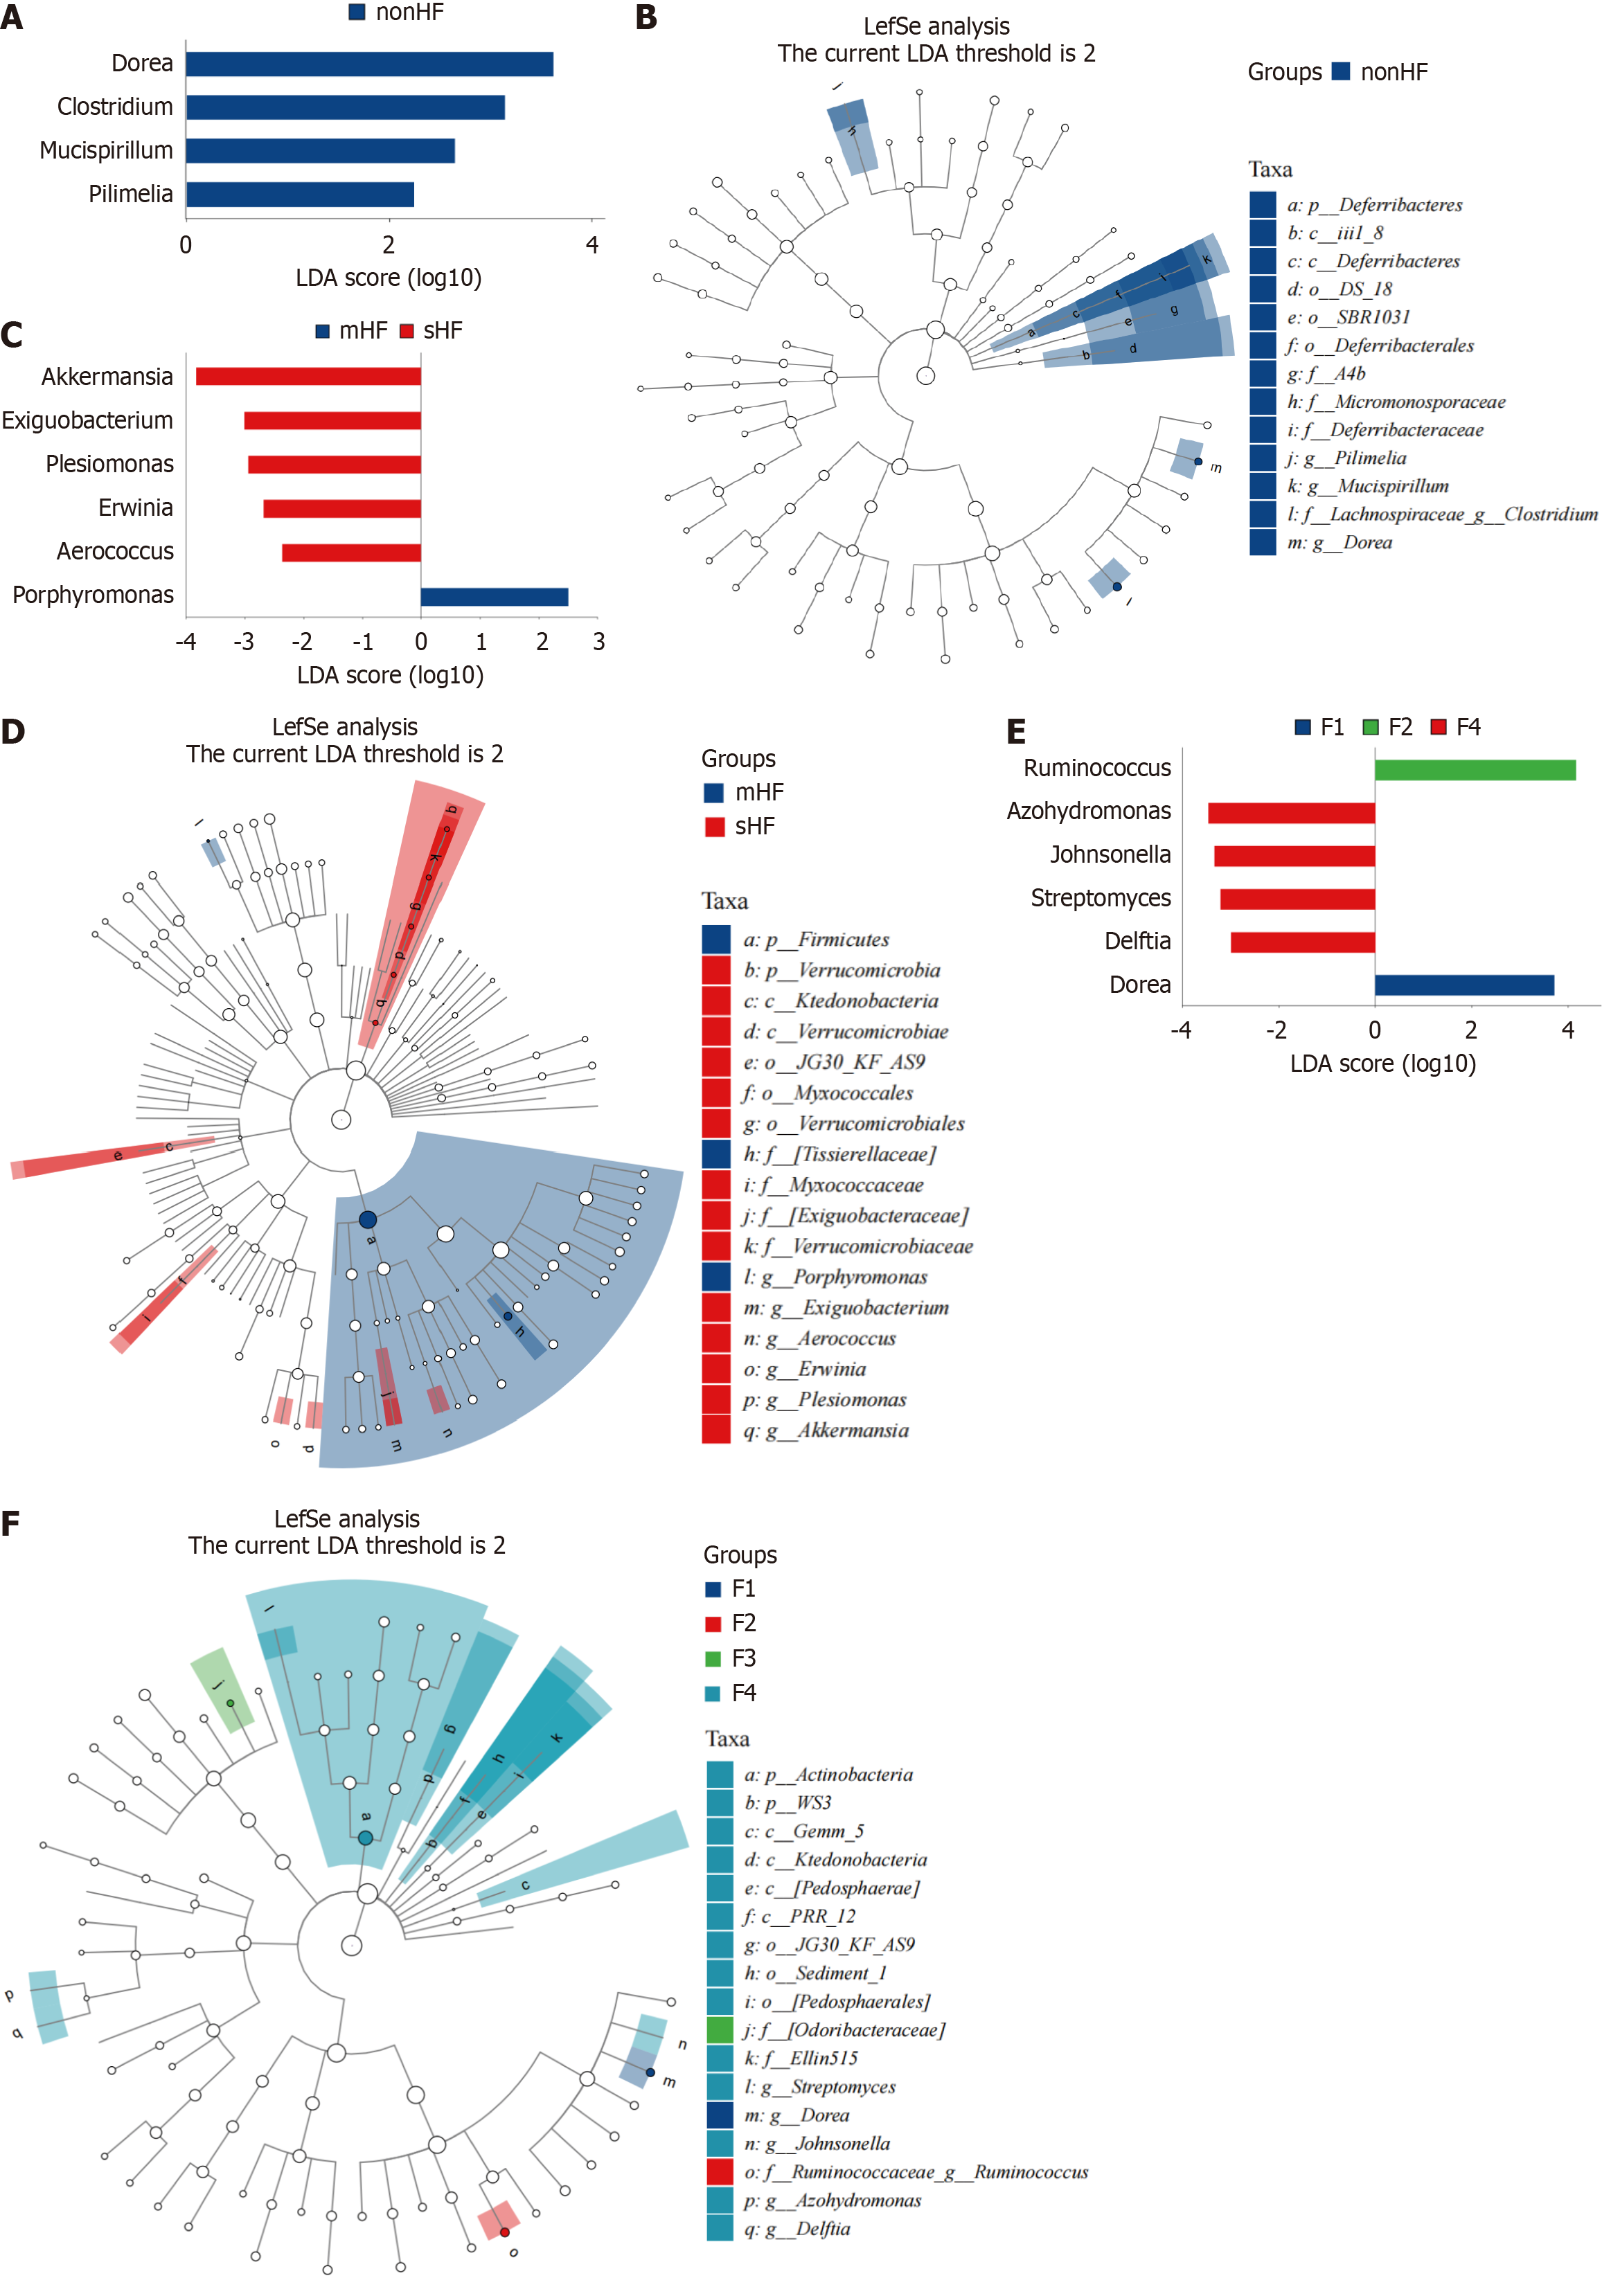
Figure 4 Linear discriminant analysis effect size analysis identified differential microbiota in hepatic fibrosis patients.
A and B: Differential microbiota in hepatic fibrosis (HF) and non-HF groups; C and D: Differential microbiota in mild HF and significant HF groups; E and F: Differential microbiota in different fibrosis stages (F1, F2, F3, and F4). All data were analyzed by linear discriminant analysis effect size analysis (linear discriminant analysis > 2, P < 0.05). LDA: Linear discriminant analysis; HF: Hepatic fibrosis; mHF: Mild hepatic fibrosis; sHF: Significant hepatic fibrosis.
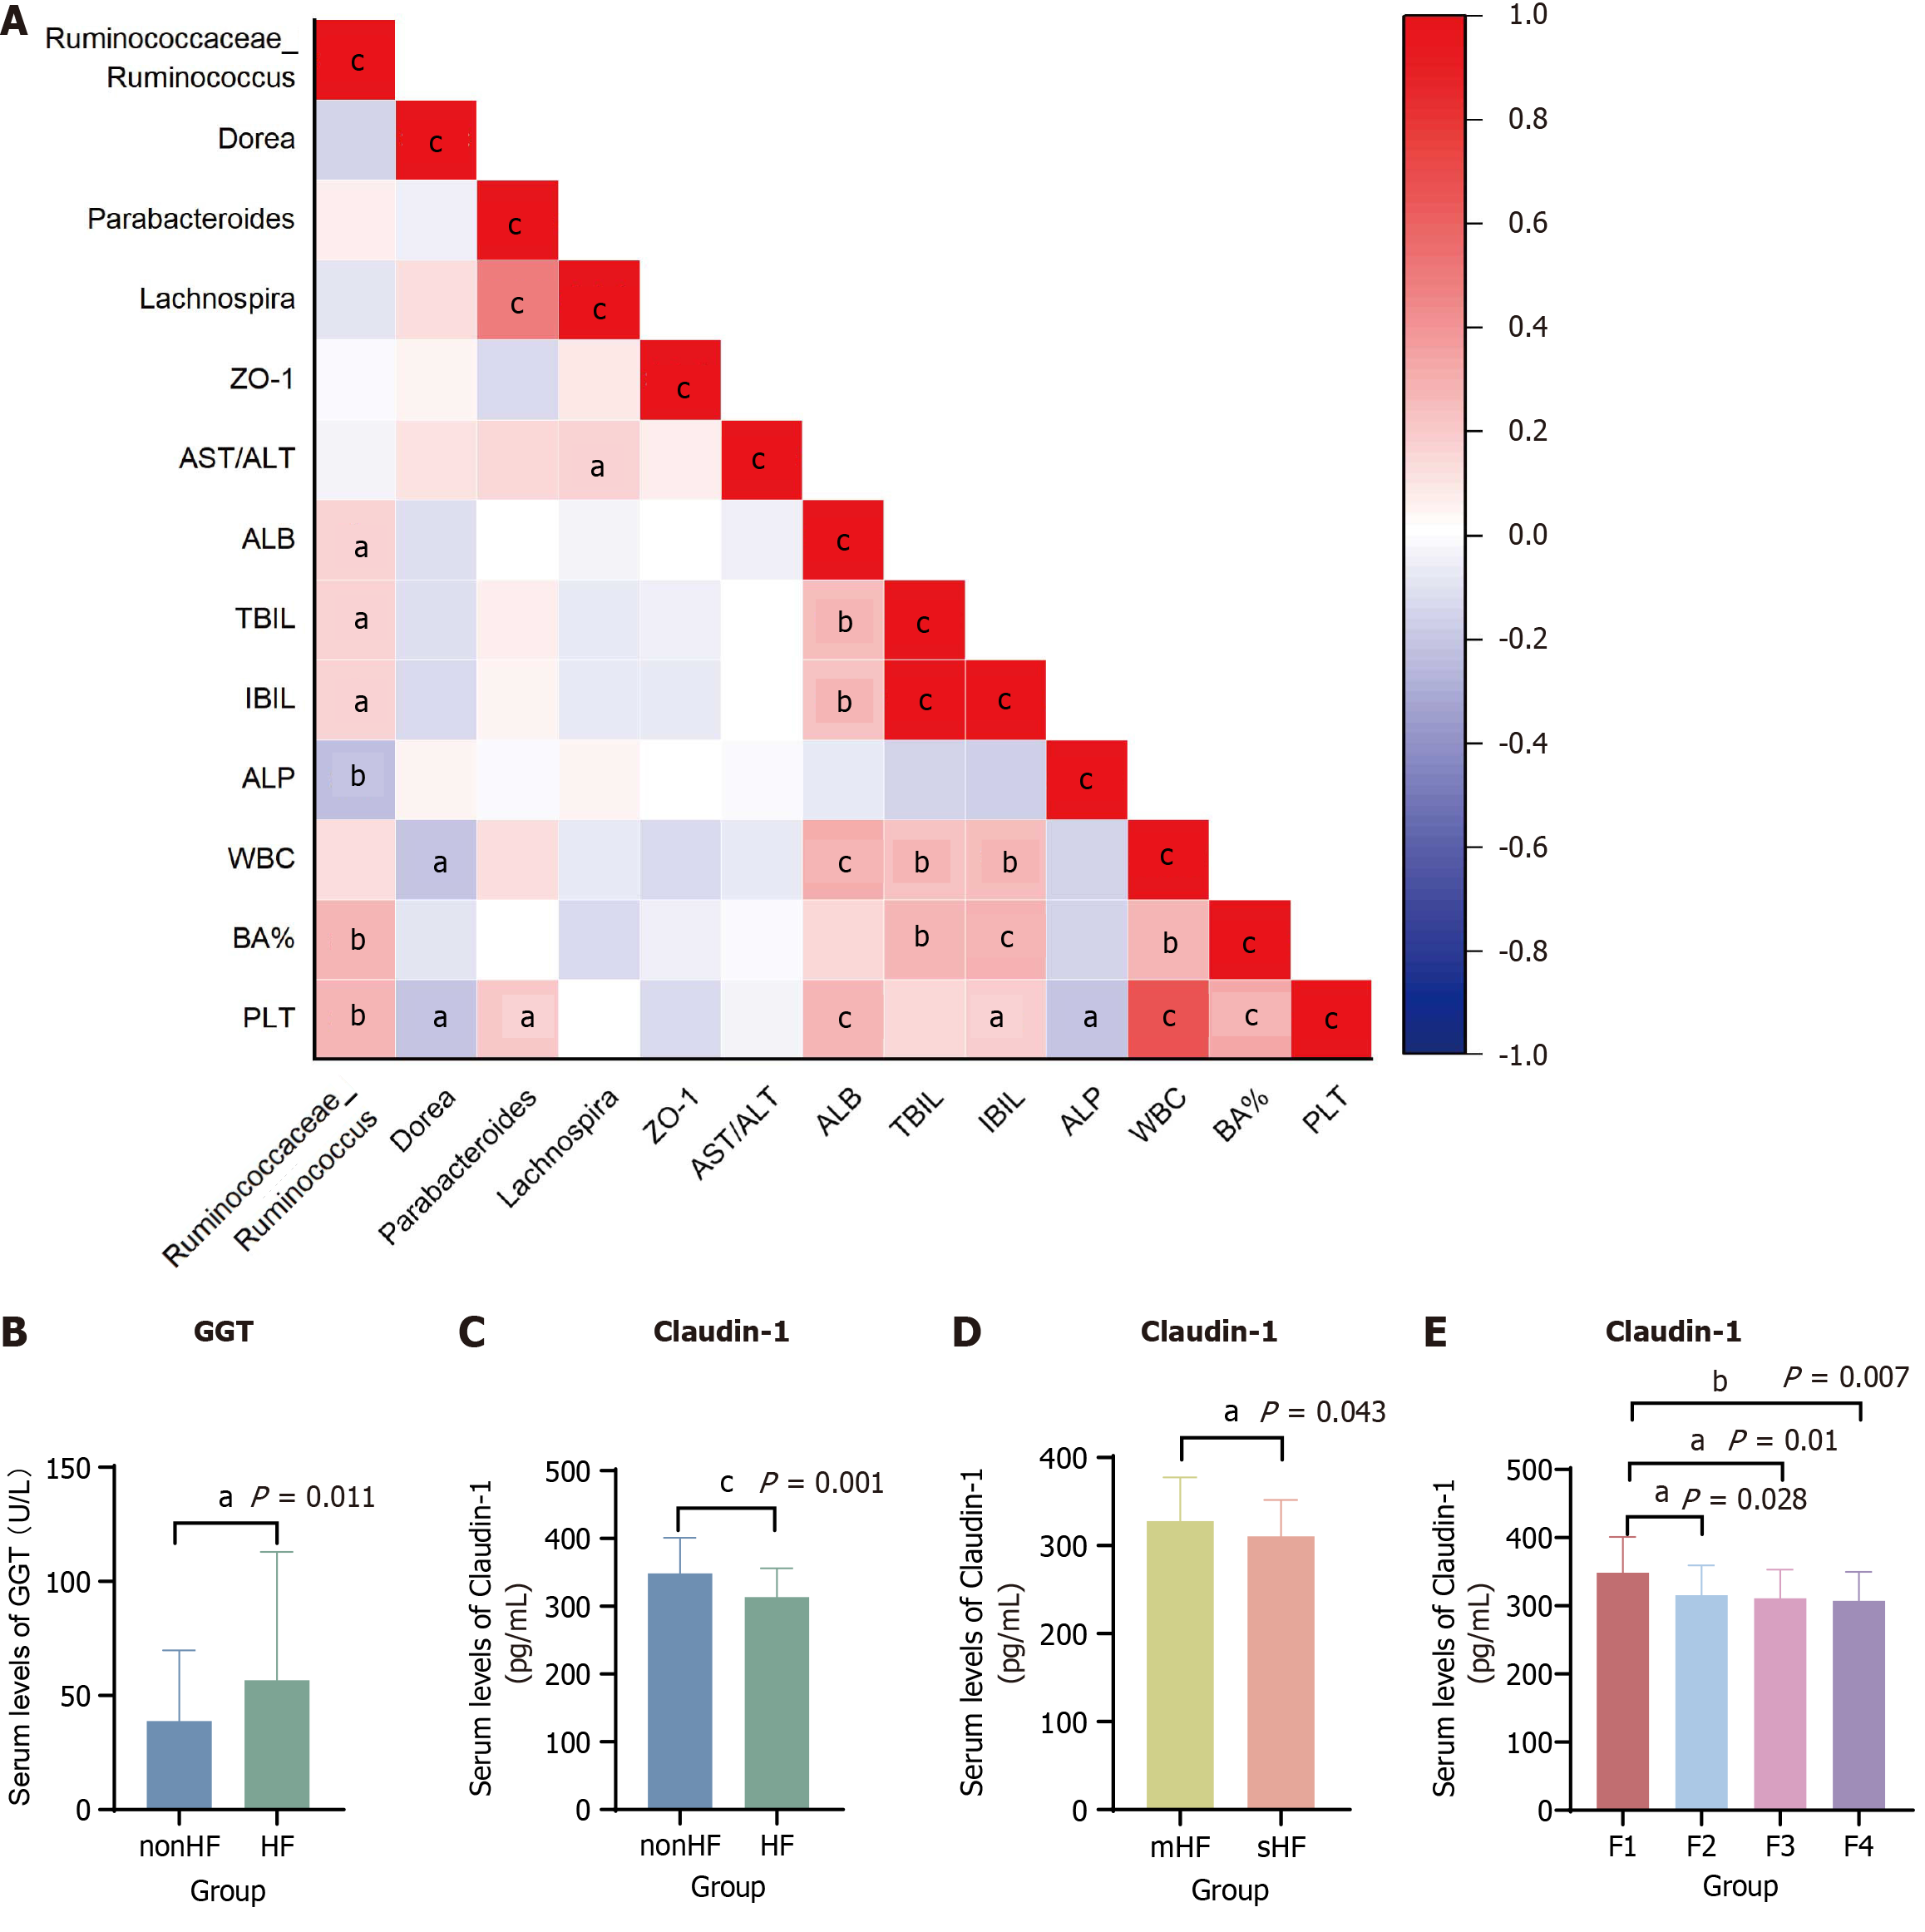
Figure 5 The relationship between gut microbiota, clinical indicators, and intestinal barrier function in different stages of hepatic fibrosis patients.
A: The correlation analyses among gut microbiota, clinical indicators, and intestinal barrier function in hepatic fibrosis (HF) patients; B: The serum levels of γ-glutamyl transferase in different stages of HF patients; C-E: The serum levels of intestinal barrier function in different stages of HF patients. aP < 0.05. bP < 0.01. cP < 0.001. ZO-1: Zonula occludens-1; AST: Aspartate aminotransferase; ALT: Alanine transaminase; ALB: Albumin; TBIL: Total bilirubin; IBIL: Indirect bilirubin; ALP: Alkaline phosphatase; WBC: White blood cell; BA: Basophil; PLT: Platelet; GGT: γ-glutamyl transferase; HF: Hepatic fibrosis; mHF: Mild hepatic fibrosis; sHF: Significant hepatic fibrosis.
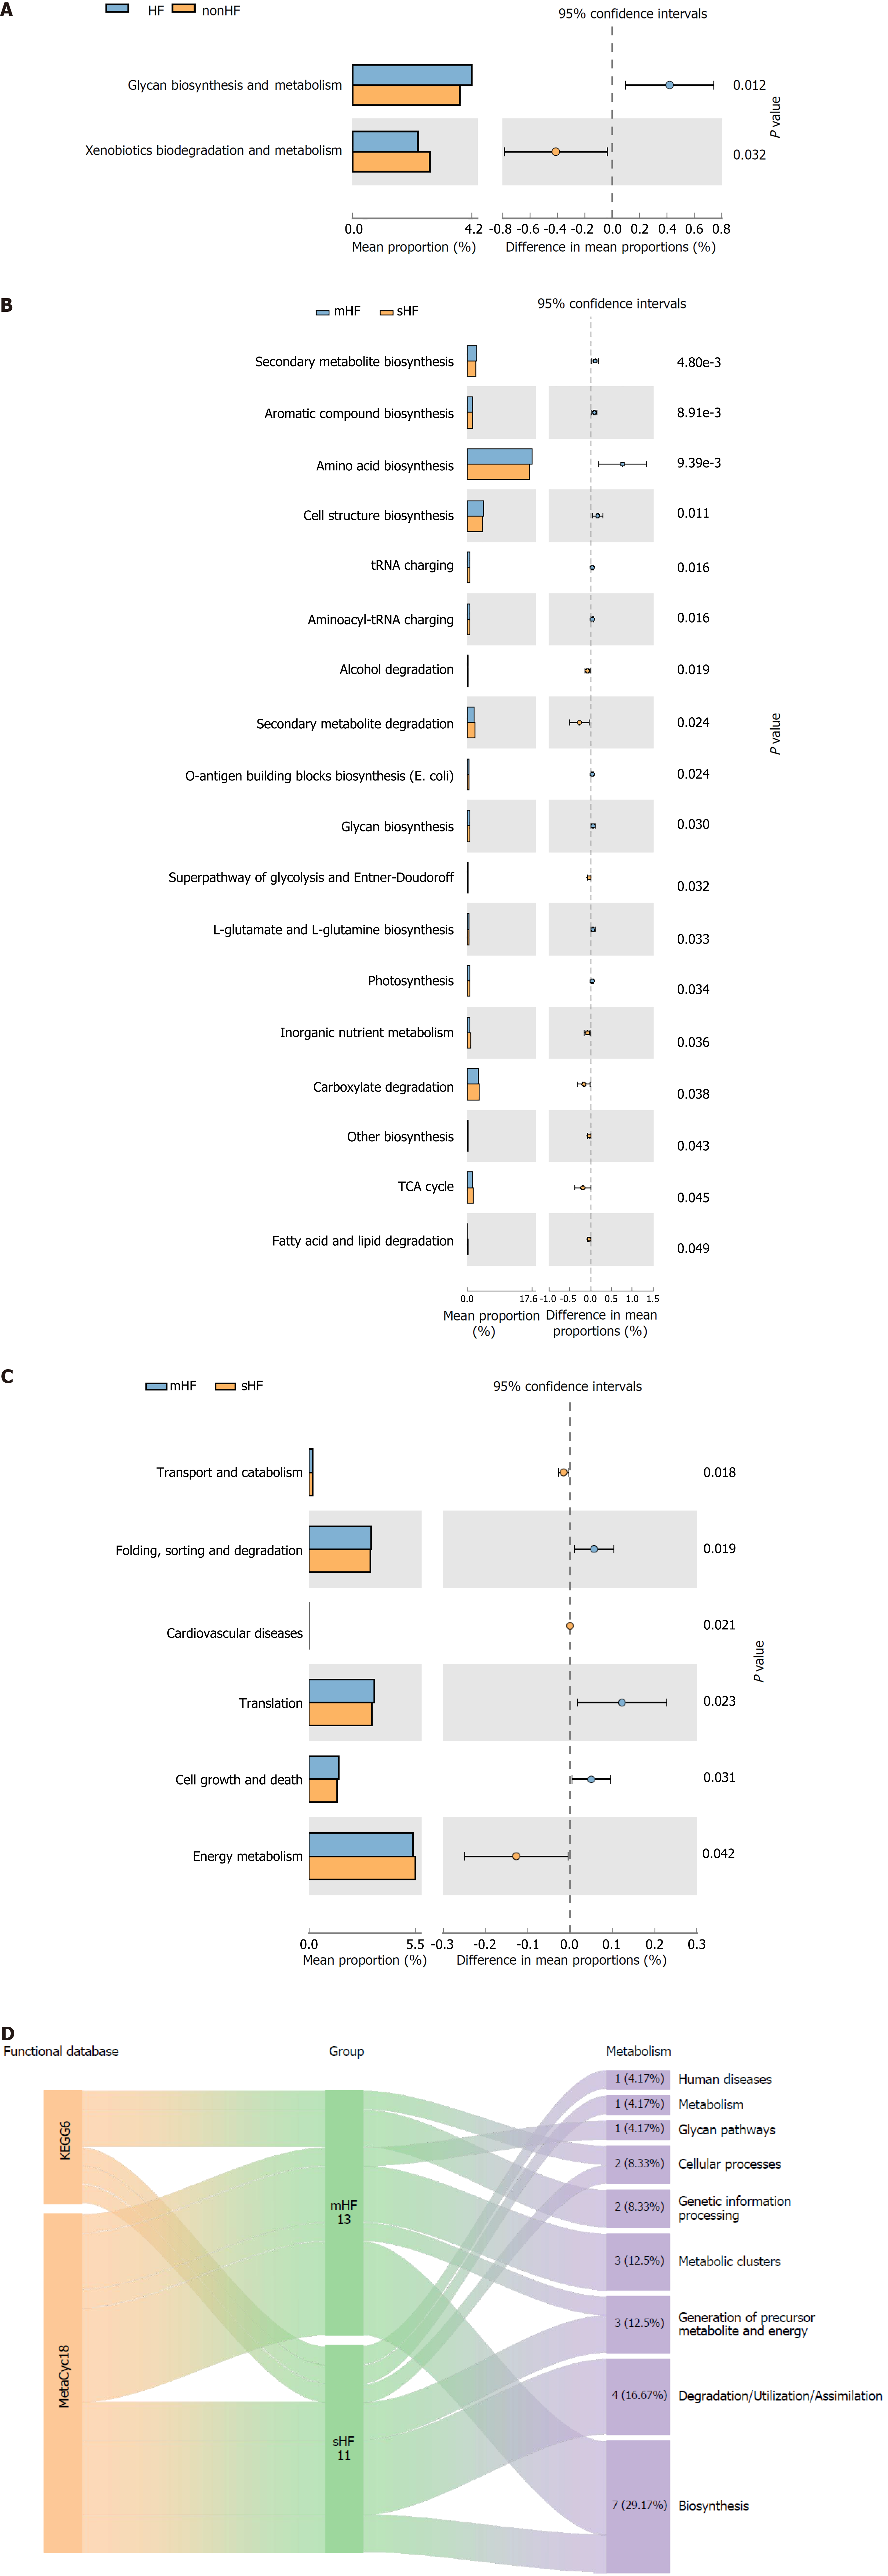
Figure 6 The relationship between key signaling pathways and hepatic fibrosis progression.
A: The differential microbiota metabolic pathways between non-hepatic fibrosis (HF) and HF groups in Kyoto Encyclopedia of Genes and Genomes (KEGG) databases; B and C: The differential microbiota metabolic pathways between mild HF (mHF) and significant HF (sHF) groups in KEGG and MetaCyc databases, respectively; D: The subgroup analysis of mHF and sHF revealed 24 differential pathways in KEGG and MetaCyc databases. t-test was used to assess the significance of differences in microbial community functioning between different subgroups. HF: Hepatic fibrosis; mHF: Mild hepatic fibrosis; sHF: Significant hepatic fibrosis; TCA: Tricarboxylic acid; KEGG: Kyoto Encyclopedia of Genes and Genomes.
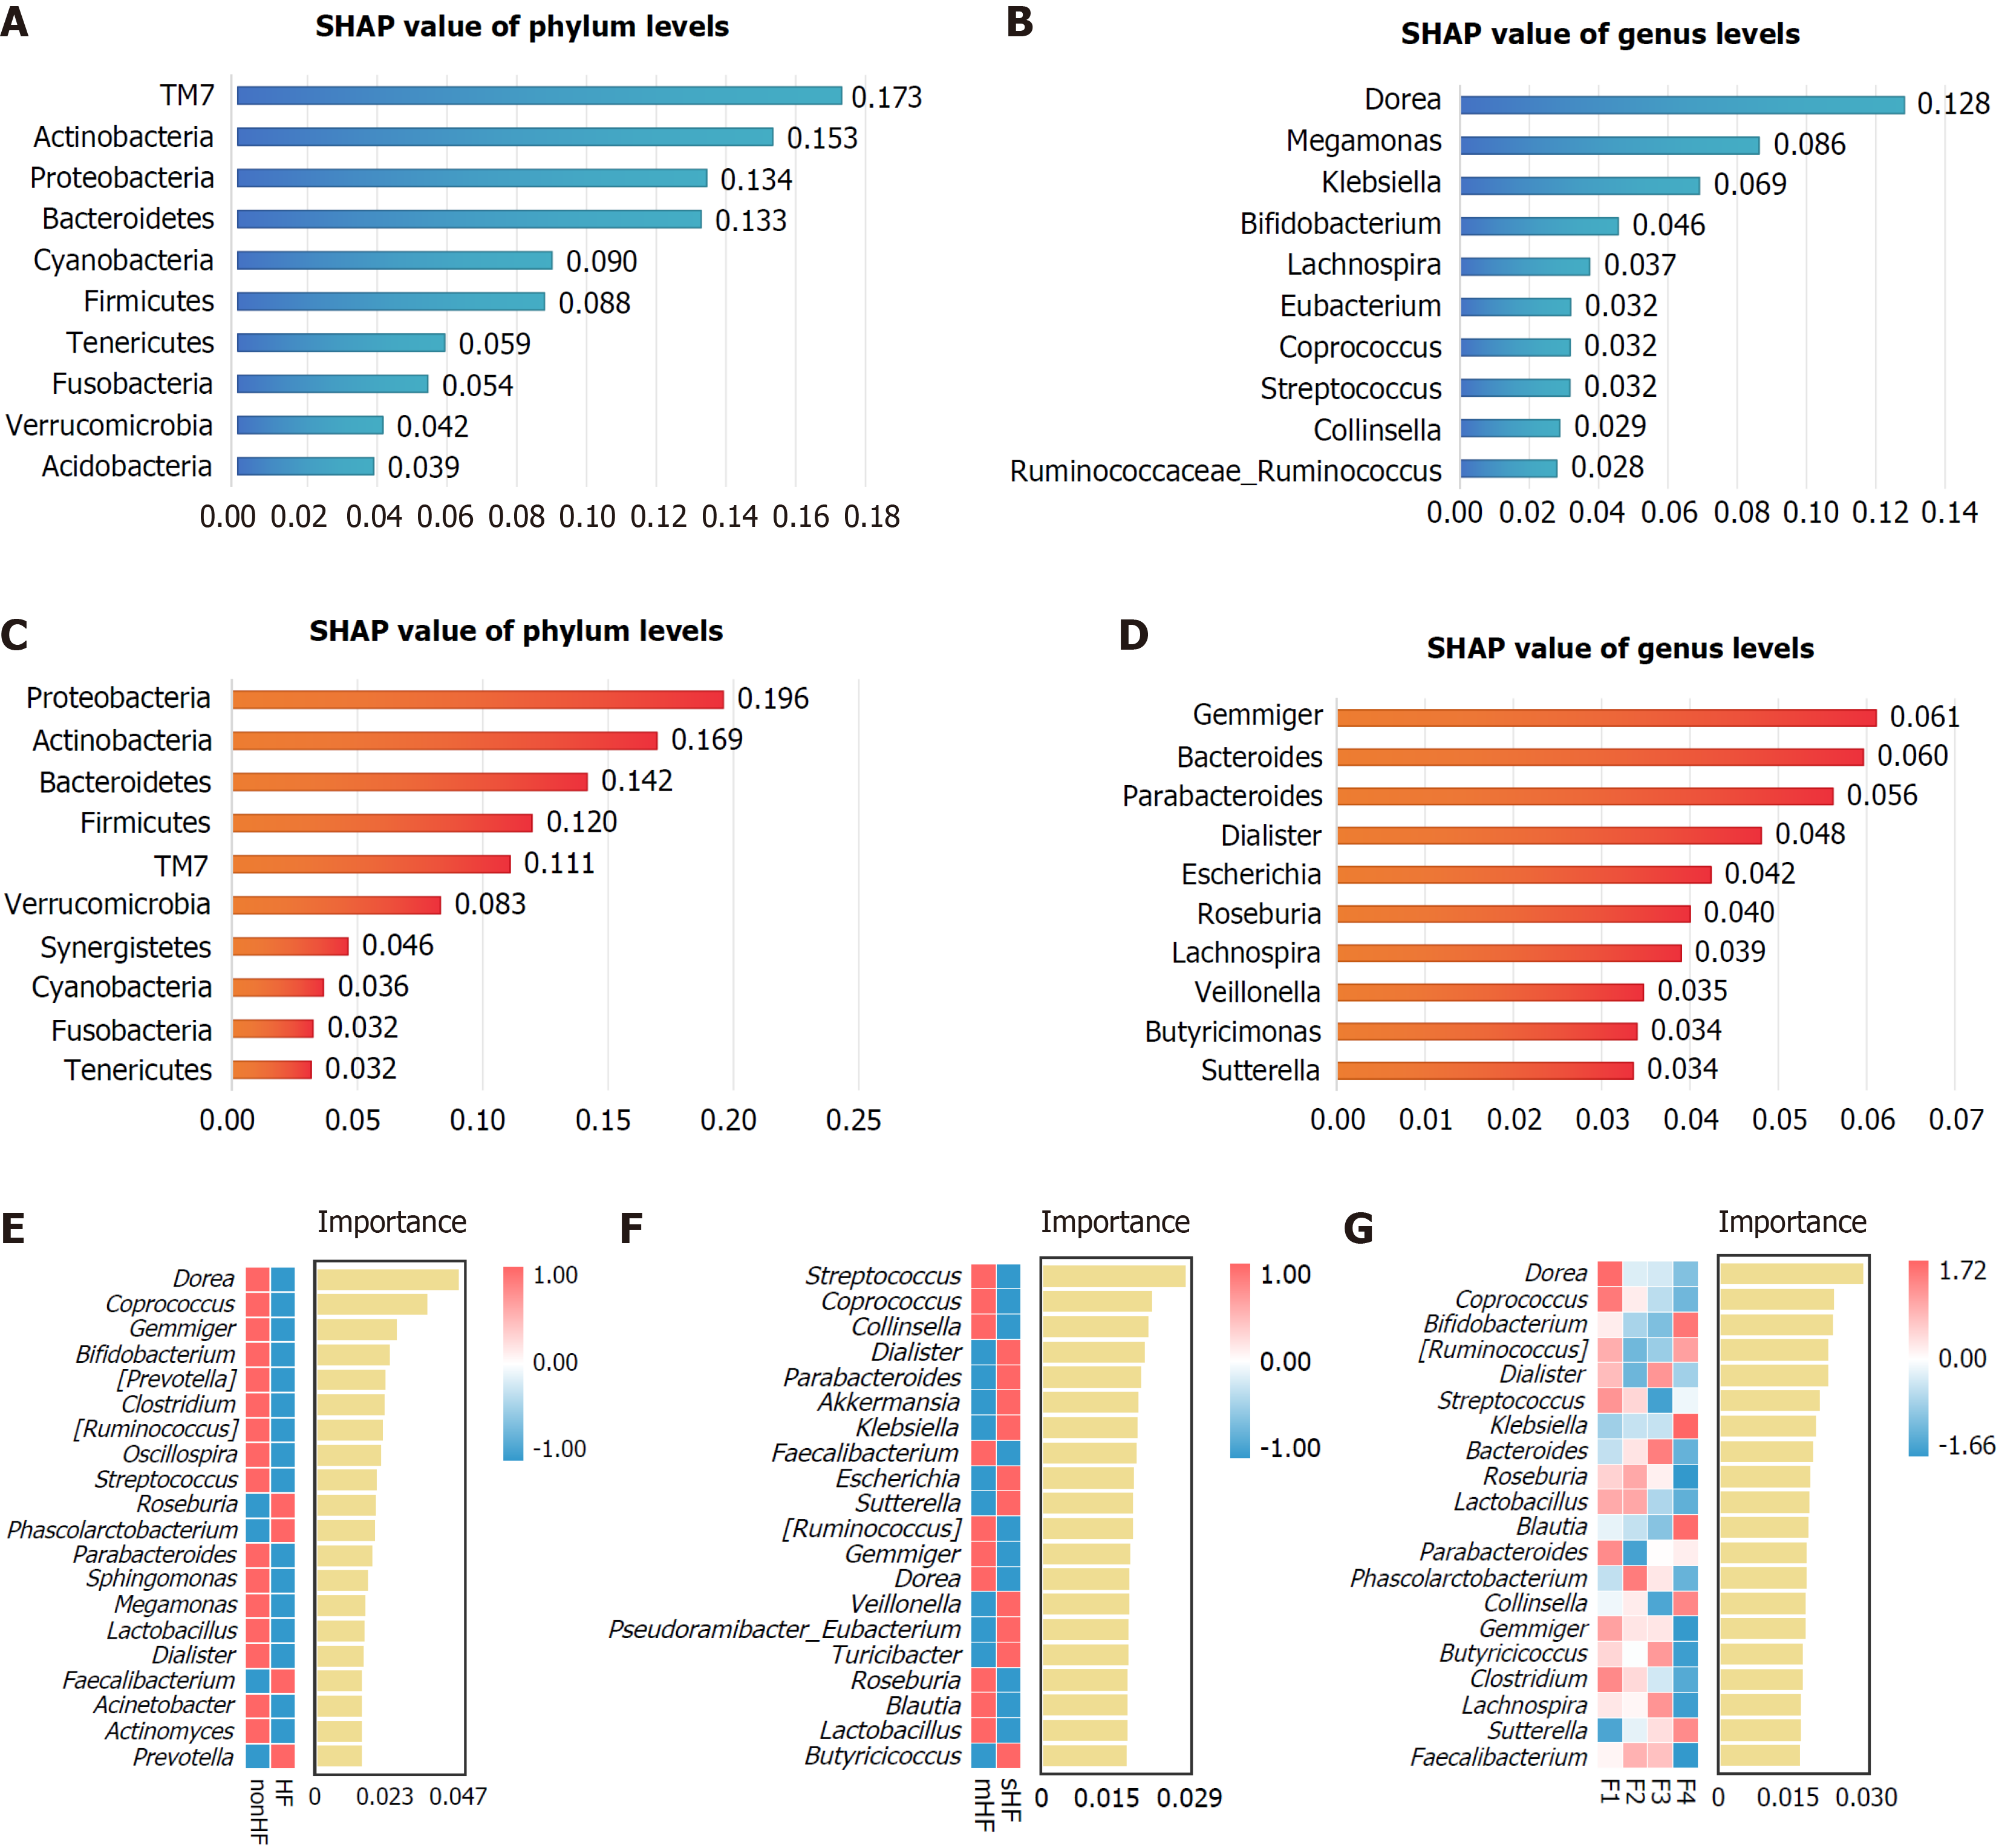
Figure 7 Machine learning-based identification of key gut microbiota in hepatic fibrosis.
A and B: The greatest differences in relative abundance between the hepatic fibrosis (HF) and non-HF groups according to the eXtreme gradient boosting (XGBoost) machine learning algorithm of top 10 phyla (A) and genera (B); C and D: The greatest differences in relative abundance between the mild HF and significant HF groups according to the XGBoost algorithm of top 10 phyla (C) and genera (D); E-G: The top 20 significant signatures of gut microbiota at the genus level according to the random forest algorithm. SHAP: Shapley additive explanations; HF: Hepatic fibrosis; mHF: Mild hepatic fibrosis; sHF: Significant hepatic fibrosis.
- Citation: Zhu Y, Geng SY, Chen Y, Ru QJ, Zheng Y, Jiang N, Zhu FY, Zhang YS. Machine learning algorithms reveal gut microbiota signatures associated with chronic hepatitis B-related hepatic fibrosis. World J Gastroenterol 2025; 31(16): 105985
- URL: https://www.wjgnet.com/1007-9327/full/v31/i16/105985.htm
- DOI: https://dx.doi.org/10.3748/wjg.v31.i16.105985


