Copyright
©The Author(s) 2025.
World J Gastroenterol. Apr 28, 2025; 31(16): 104758
Published online Apr 28, 2025. doi: 10.3748/wjg.v31.i16.104758
Published online Apr 28, 2025. doi: 10.3748/wjg.v31.i16.104758
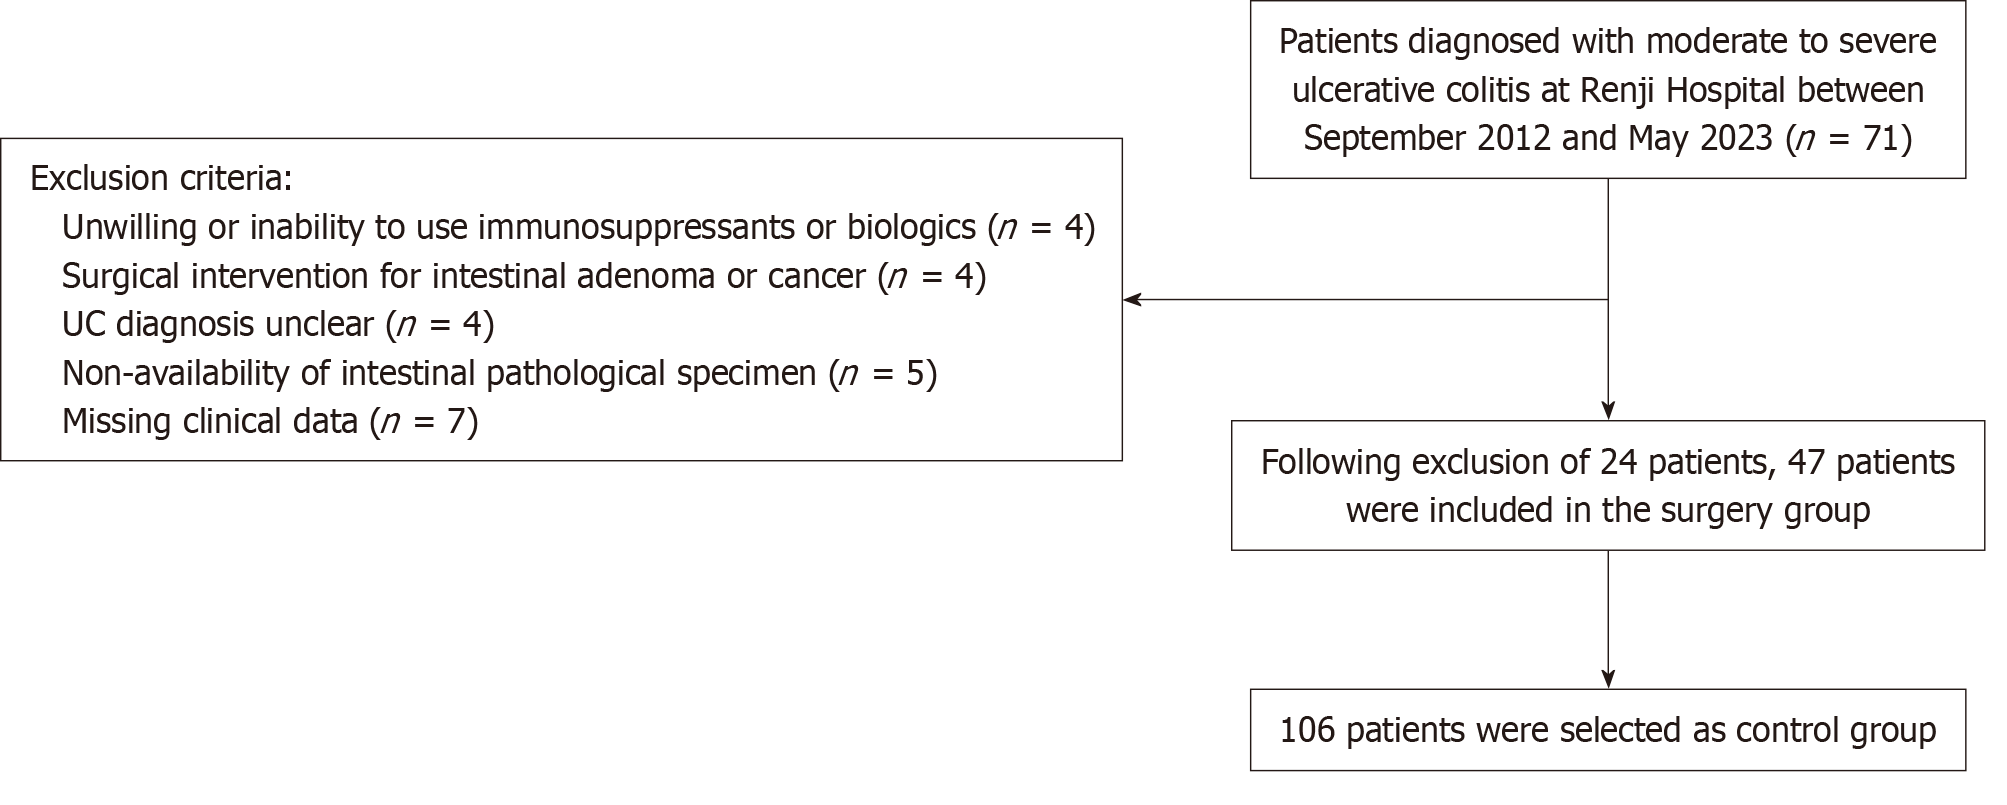
Figure 1 Flowchart of participant selection.
UC: Ulcerative colitis.
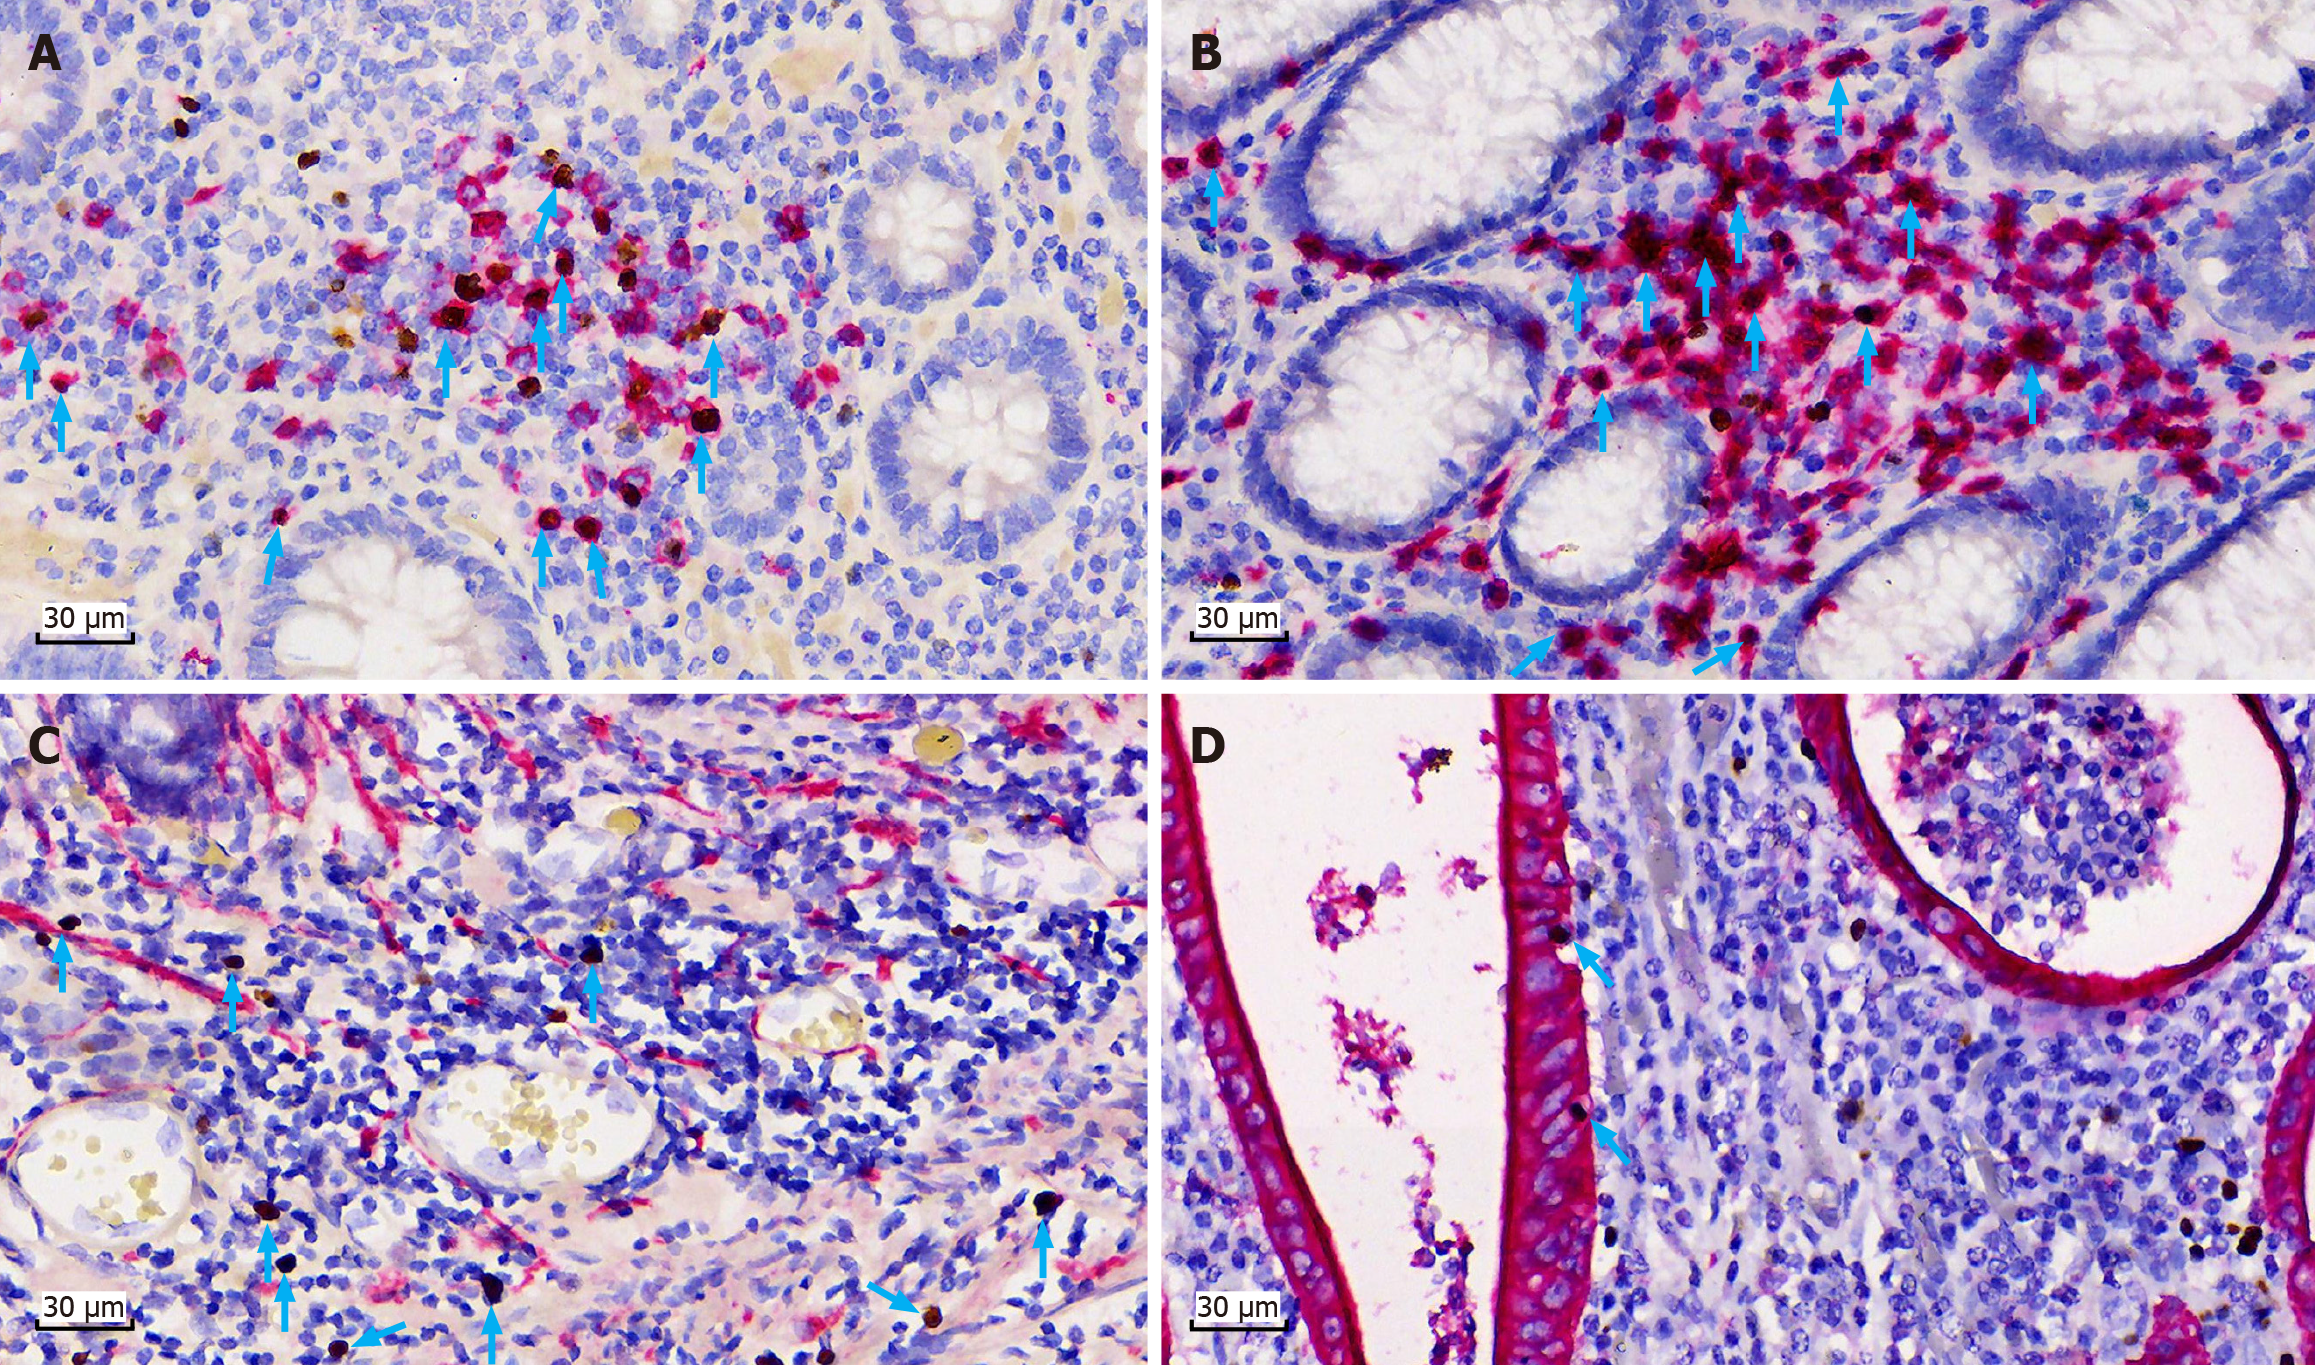
Figure 2 Phenotype of Epstein-Barr virus-infected cells in patients with moderate to severe ulcerative colitis determined by Epstein-Barr virus-encoded small RNA in situ hybridization and Epstein-Barr virus-encoded small RNA-immunohistochemistry (× 400).
A: Immunohistochemical colocalization with Epstein-Barr virus-encoded small RNA (EBER)-positive cells: Blue arrows indicate positive staining. Cytoplasmic and membrane signals are red for antigen CD20 positive (a specific B lymphocyte marker), and nuclear signals are brown for EBER-positive cells; B: Immunohistochemical colocalization with EBER-positive cells: Blue arrows indicate positive staining. Cytoplasmic and membrane signals are red for antigen CD3 positive (a specific T lymphocyte marker), and nuclear signals are brown for EBER-positive cells; C: Blue arrows indicate EBER-positive cells (nuclear signal is brown), and no EBER-positive cells show positive staining for antigen CD56 (a specific NK cell marker); D: Immunohistochemical colocalization with EBER-positive cells: Blue arrows indicate EBER-positive intraepithelial lymphocytes (nuclear signal is brown) among the intestinal epithelial cells (cytoplasmic and membrane signals are red in CK staining positive areas).
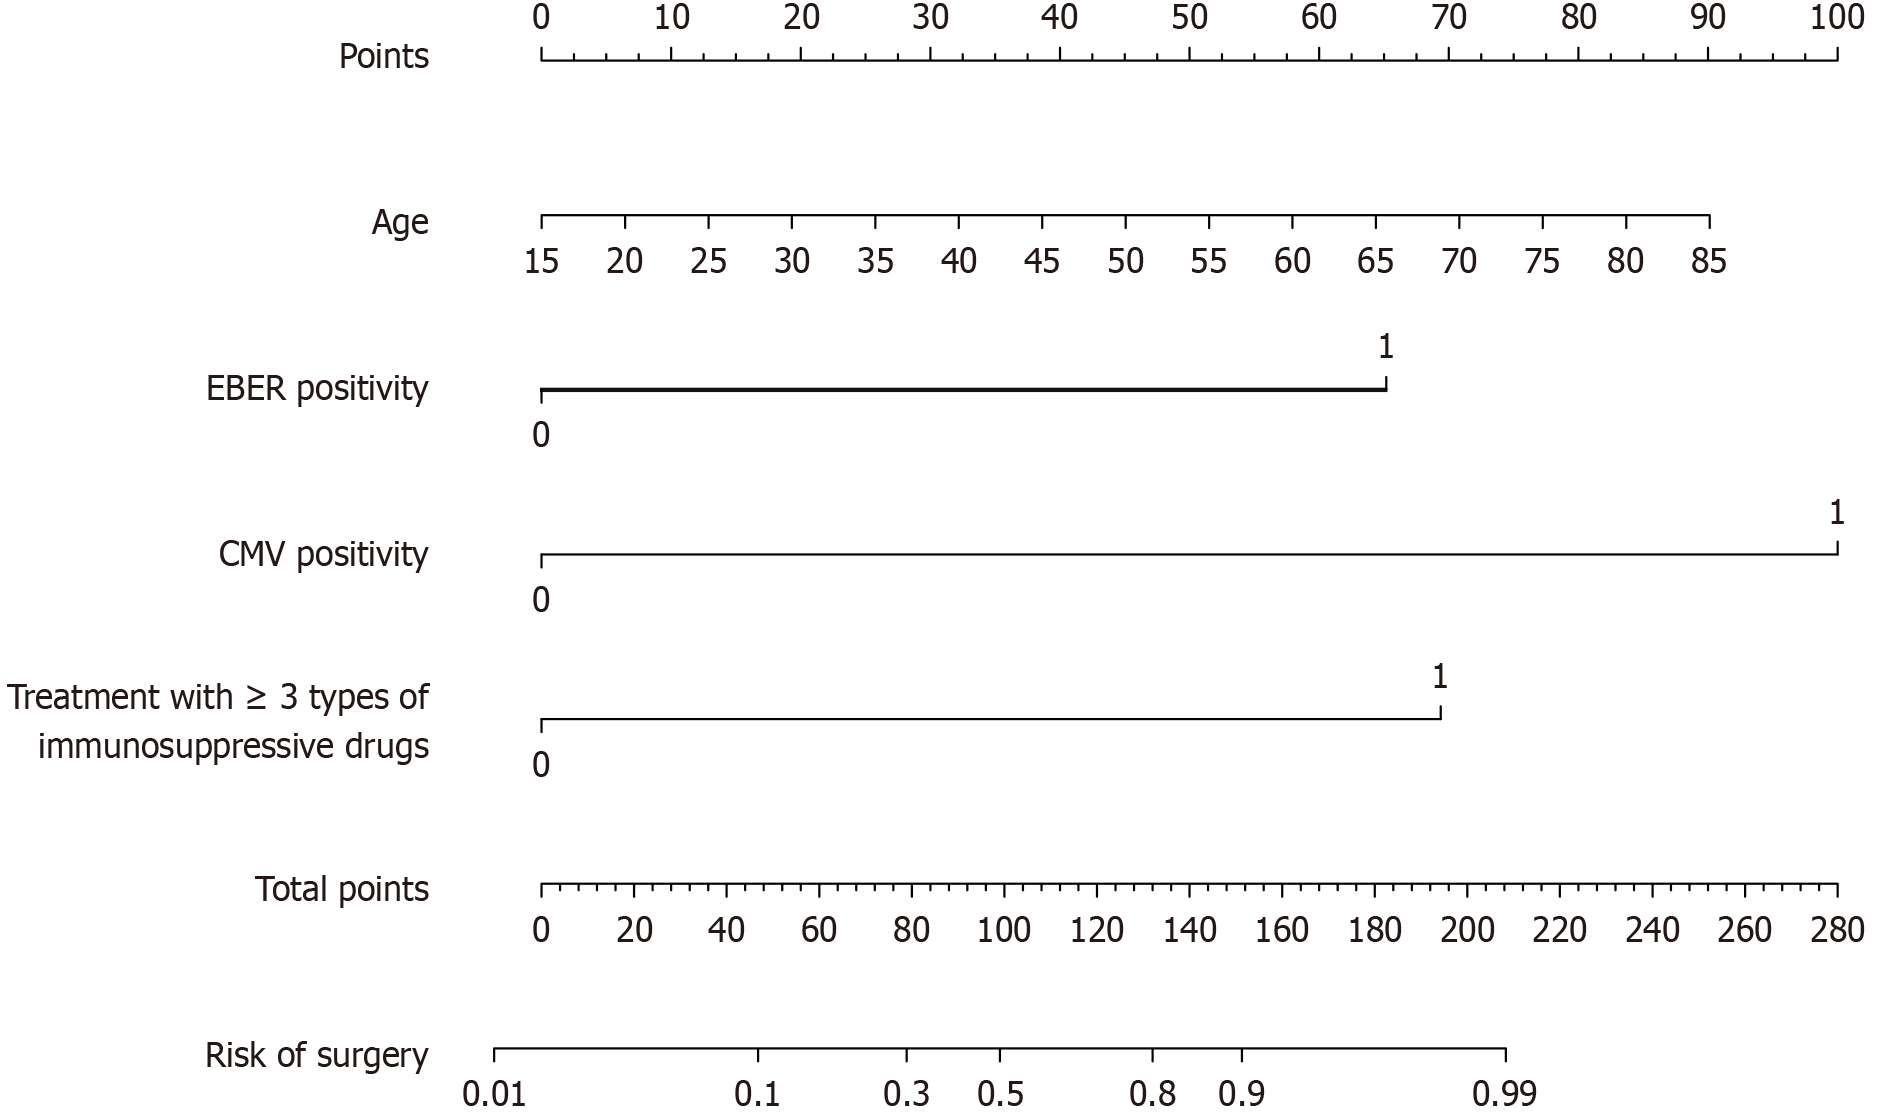
Figure 3 Nomogram for predicting surgery in patients with moderate to severe ulcerative colitis.
EBER: Epstein-Barr virus-encoded small RNA; CMV: Cytomegalovirus.
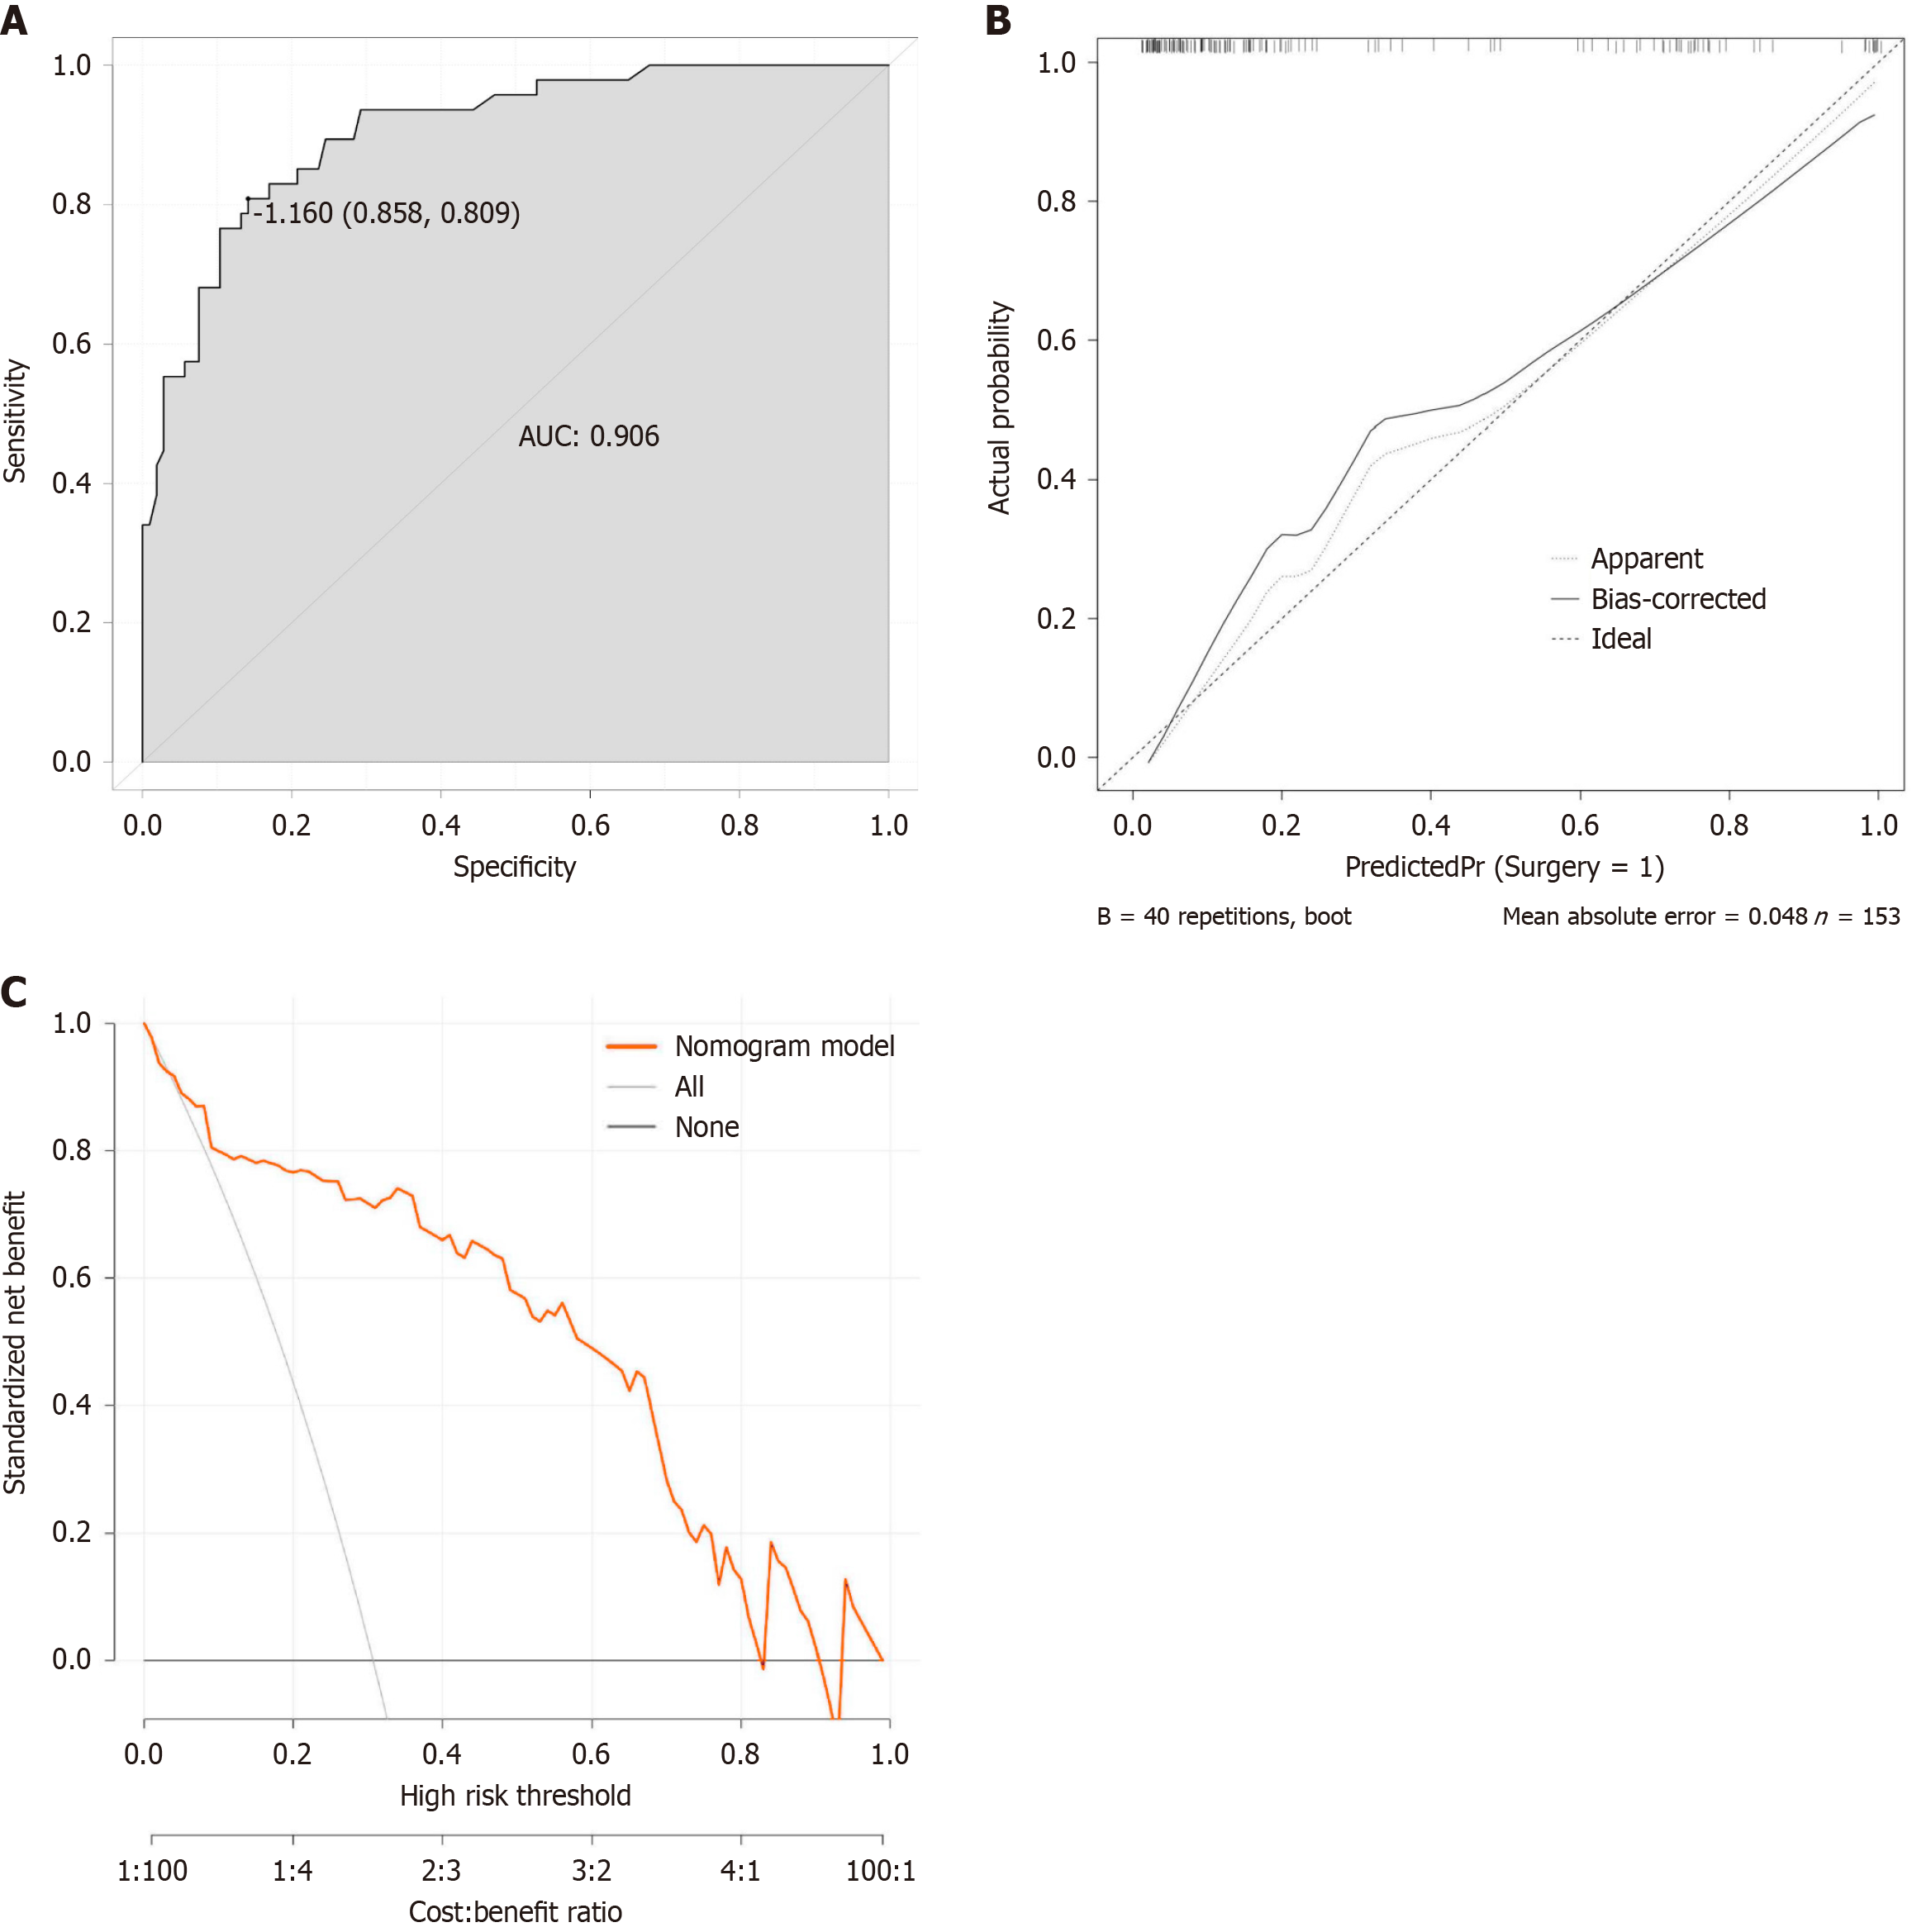
Figure 4 Analysis of the predictive model.
A: Receiver operating characteristic curve analysis of the predictive model used in this study; B: Calibration curve of the predictive model; C: Decision curve analysis of the predictive model. AUC: The area under the receiver operating characteristic curve.
- Citation: Zhang H, Gu X, He W, Zhao SL, Cao ZJ. Epstein-Barr virus infection is an independent risk factor for surgery in patients with moderate-to-severe ulcerative colitis. World J Gastroenterol 2025; 31(16): 104758
- URL: https://www.wjgnet.com/1007-9327/full/v31/i16/104758.htm
- DOI: https://dx.doi.org/10.3748/wjg.v31.i16.104758


