Copyright
©The Author(s) 2025.
World J Gastroenterol. Apr 21, 2025; 31(15): 105720
Published online Apr 21, 2025. doi: 10.3748/wjg.v31.i15.105720
Published online Apr 21, 2025. doi: 10.3748/wjg.v31.i15.105720
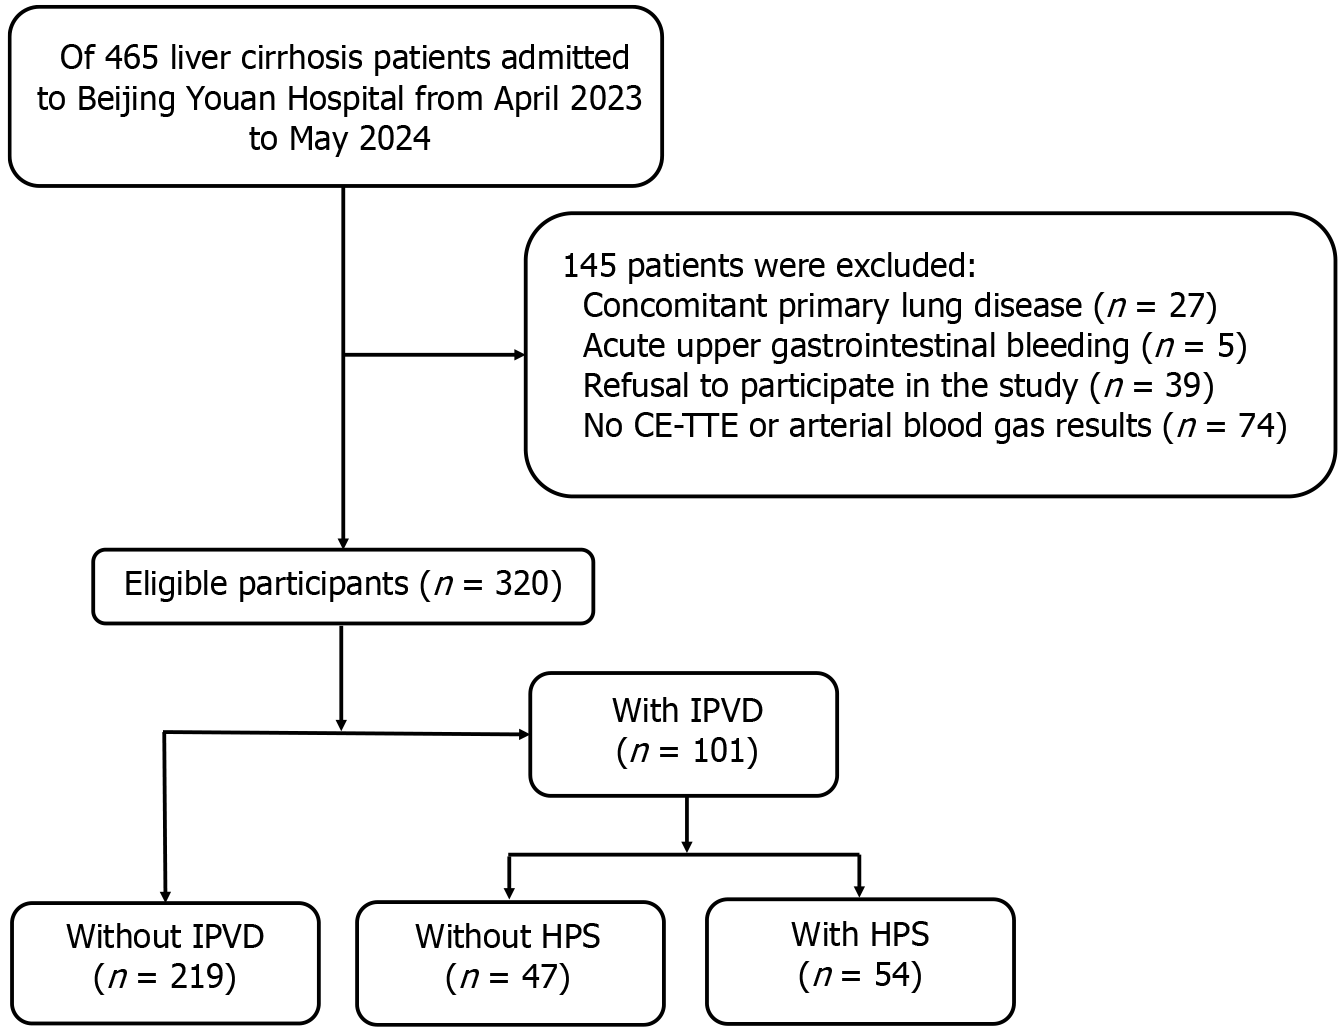
Figure 1 Flow diagram of patient enrollment.
CE-TTE: Contrast-enhanced transthoracic echocardiography; HPS: Hepatopulmonary syndrome; IPVD: Intrapulmonary vascular dilatation.
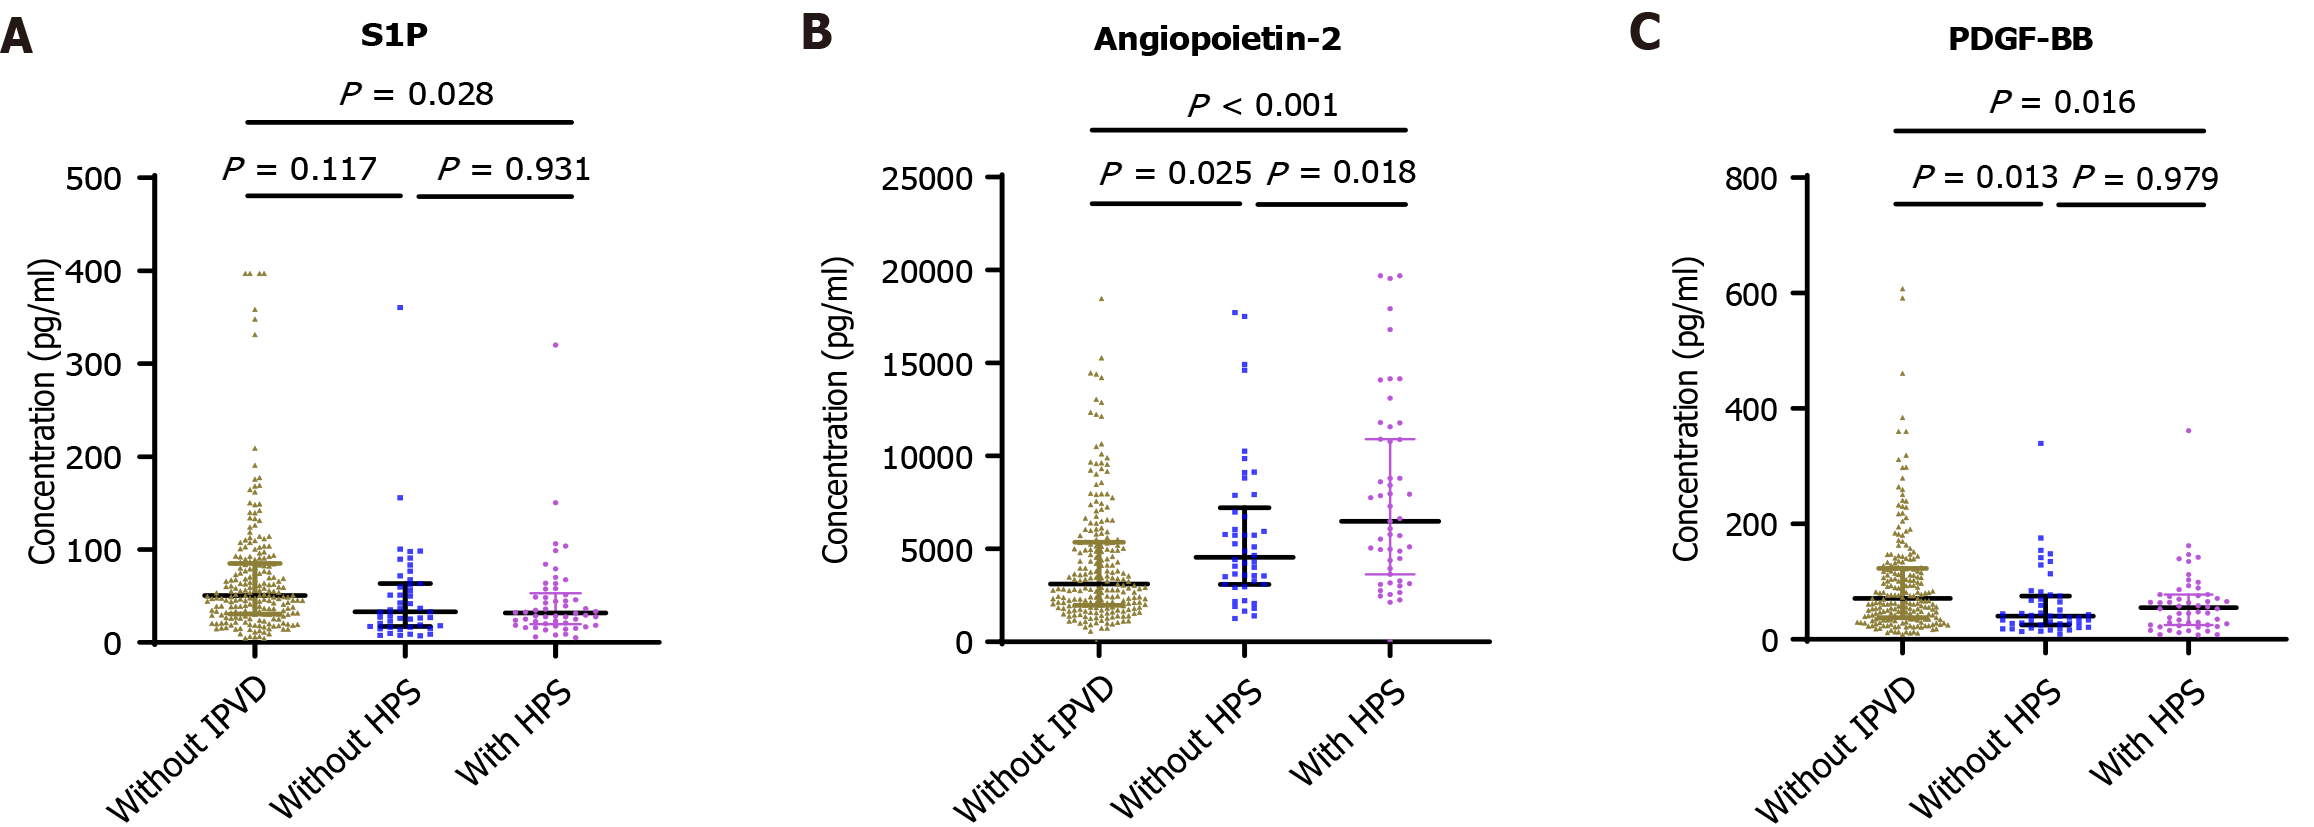
Figure 2 Novel biomarkers for intrapulmonary vascular dilatation and hepatopulmonary syndrome in patients with cirrhosis.
Comparisons among multiple groups were performed using the Kruskal-Wallis rank sum test. A: Serum sphingosine 1 phosphate concentration; B: Serum angiopoietin-2 concentration; C: Serum platelet-derived growth factor BB concentration. HPS: Hepatopulmonary syndrome; IPVD: Intrapulmonary vascular dilatation; PDGF-BB: Platelet-derived growth factor BB; S1P: Sphingosine 1 phosphate.
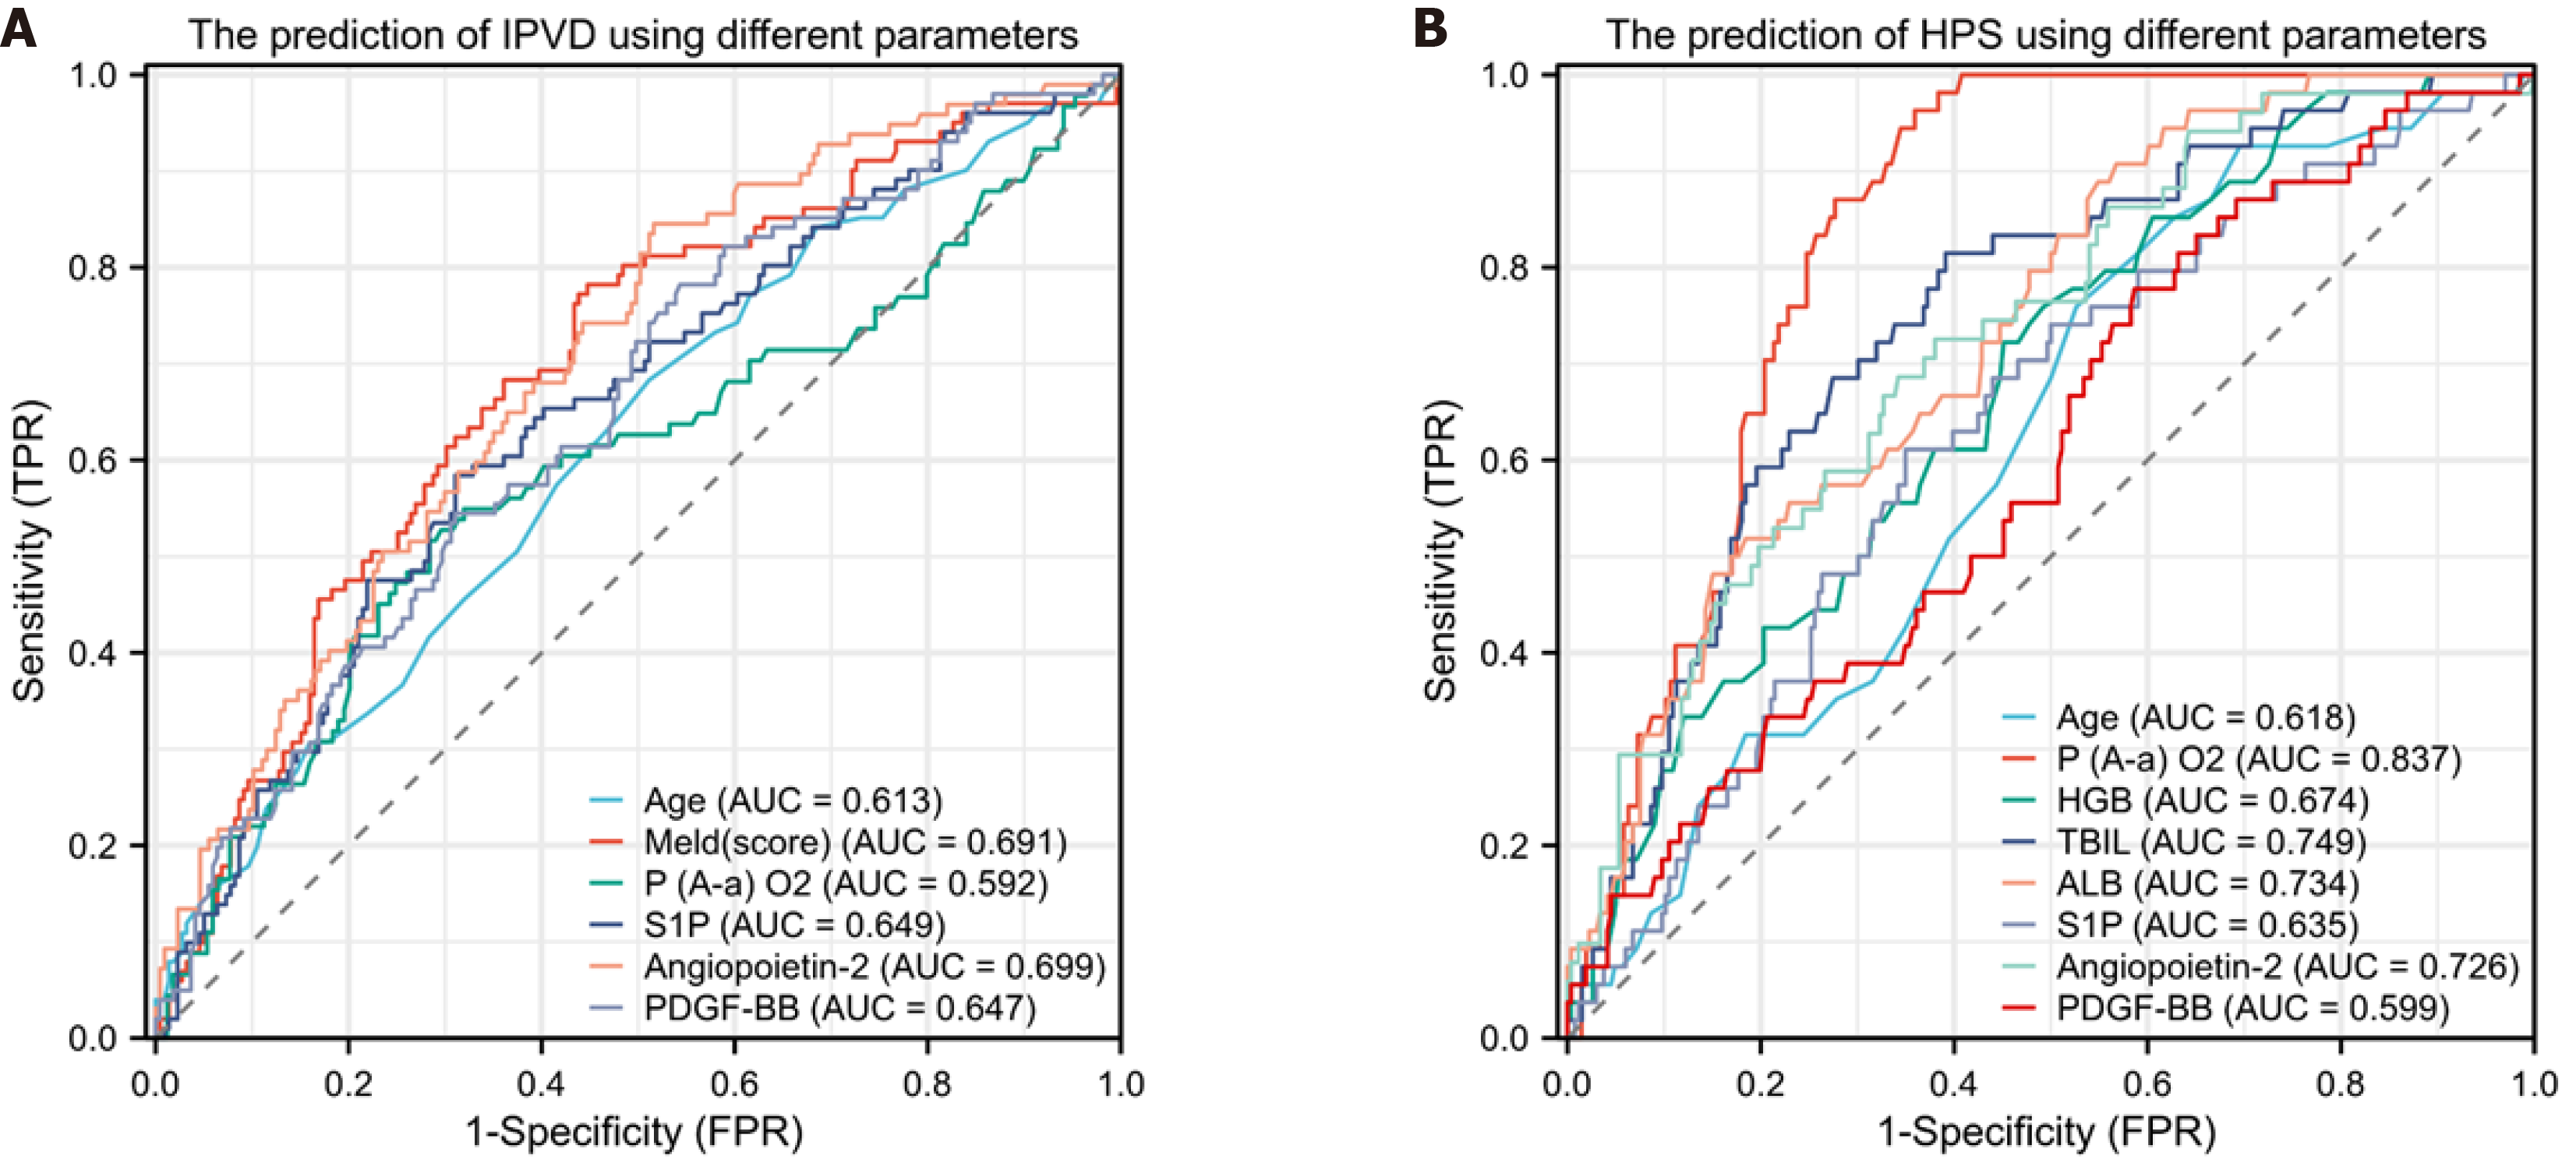
Figure 3 Receiver operating characteristic curves for predicting intrapulmonary vascular dilatation and hepatopulmonary syndrome by different parameters.
A: Predicting intrapulmonary vascular dilatation (IPVD) in patients with cirrhosis. Area under the curve (AUC) for: Age was 0.613 (95% confidence interval [CI]: 0.546-0.679), Model for End-Stage Liver Disease (MELD) (score) 0.691 (95%CI: 0.629-0.753), arterial oxygen pressure 0.565 (95%CI: 0.496-0.633), reticulocalbin 3 0.587 (95%CI: 0.518-0.656), sphingosine 1 phosphate (S1P) 0.649 (95%CI: 0.584-0.714), angiopoietin-2 0.699 (95%CI: 0.638-0.760), and platelet-derived growth factor BB (PDGF-BB) 0.647 (95%CI: 0.583-0.711); B: Predicting hepatopulmonary syndrome (HPS) in patients with cirrhosis. AUC for age was 0.618 (95%CI: 0.542-0.693), pulmonary alveolar-arterial oxygen gradient (P(A-a)O2) 0.837 (95%CI: 0.790-0.885), hemoglobin (HGB) 0.674 (95%CI: 0.600-0.749), total bilirubin (TBIL) 0.749 (95%CI: 0.681-0.818), albumin (ALB) 0.734 (95%CI: 0.667-0.801), S1P 0.635 (95%CI: 0.556-0.713); angiopoietin-2 0.726 (95%CI: 0.652-0.800), and PDGF-BB 0.599 (95%CI: 0.519-0.679). FPR: False-positive rate; TPR: True-positive rat.
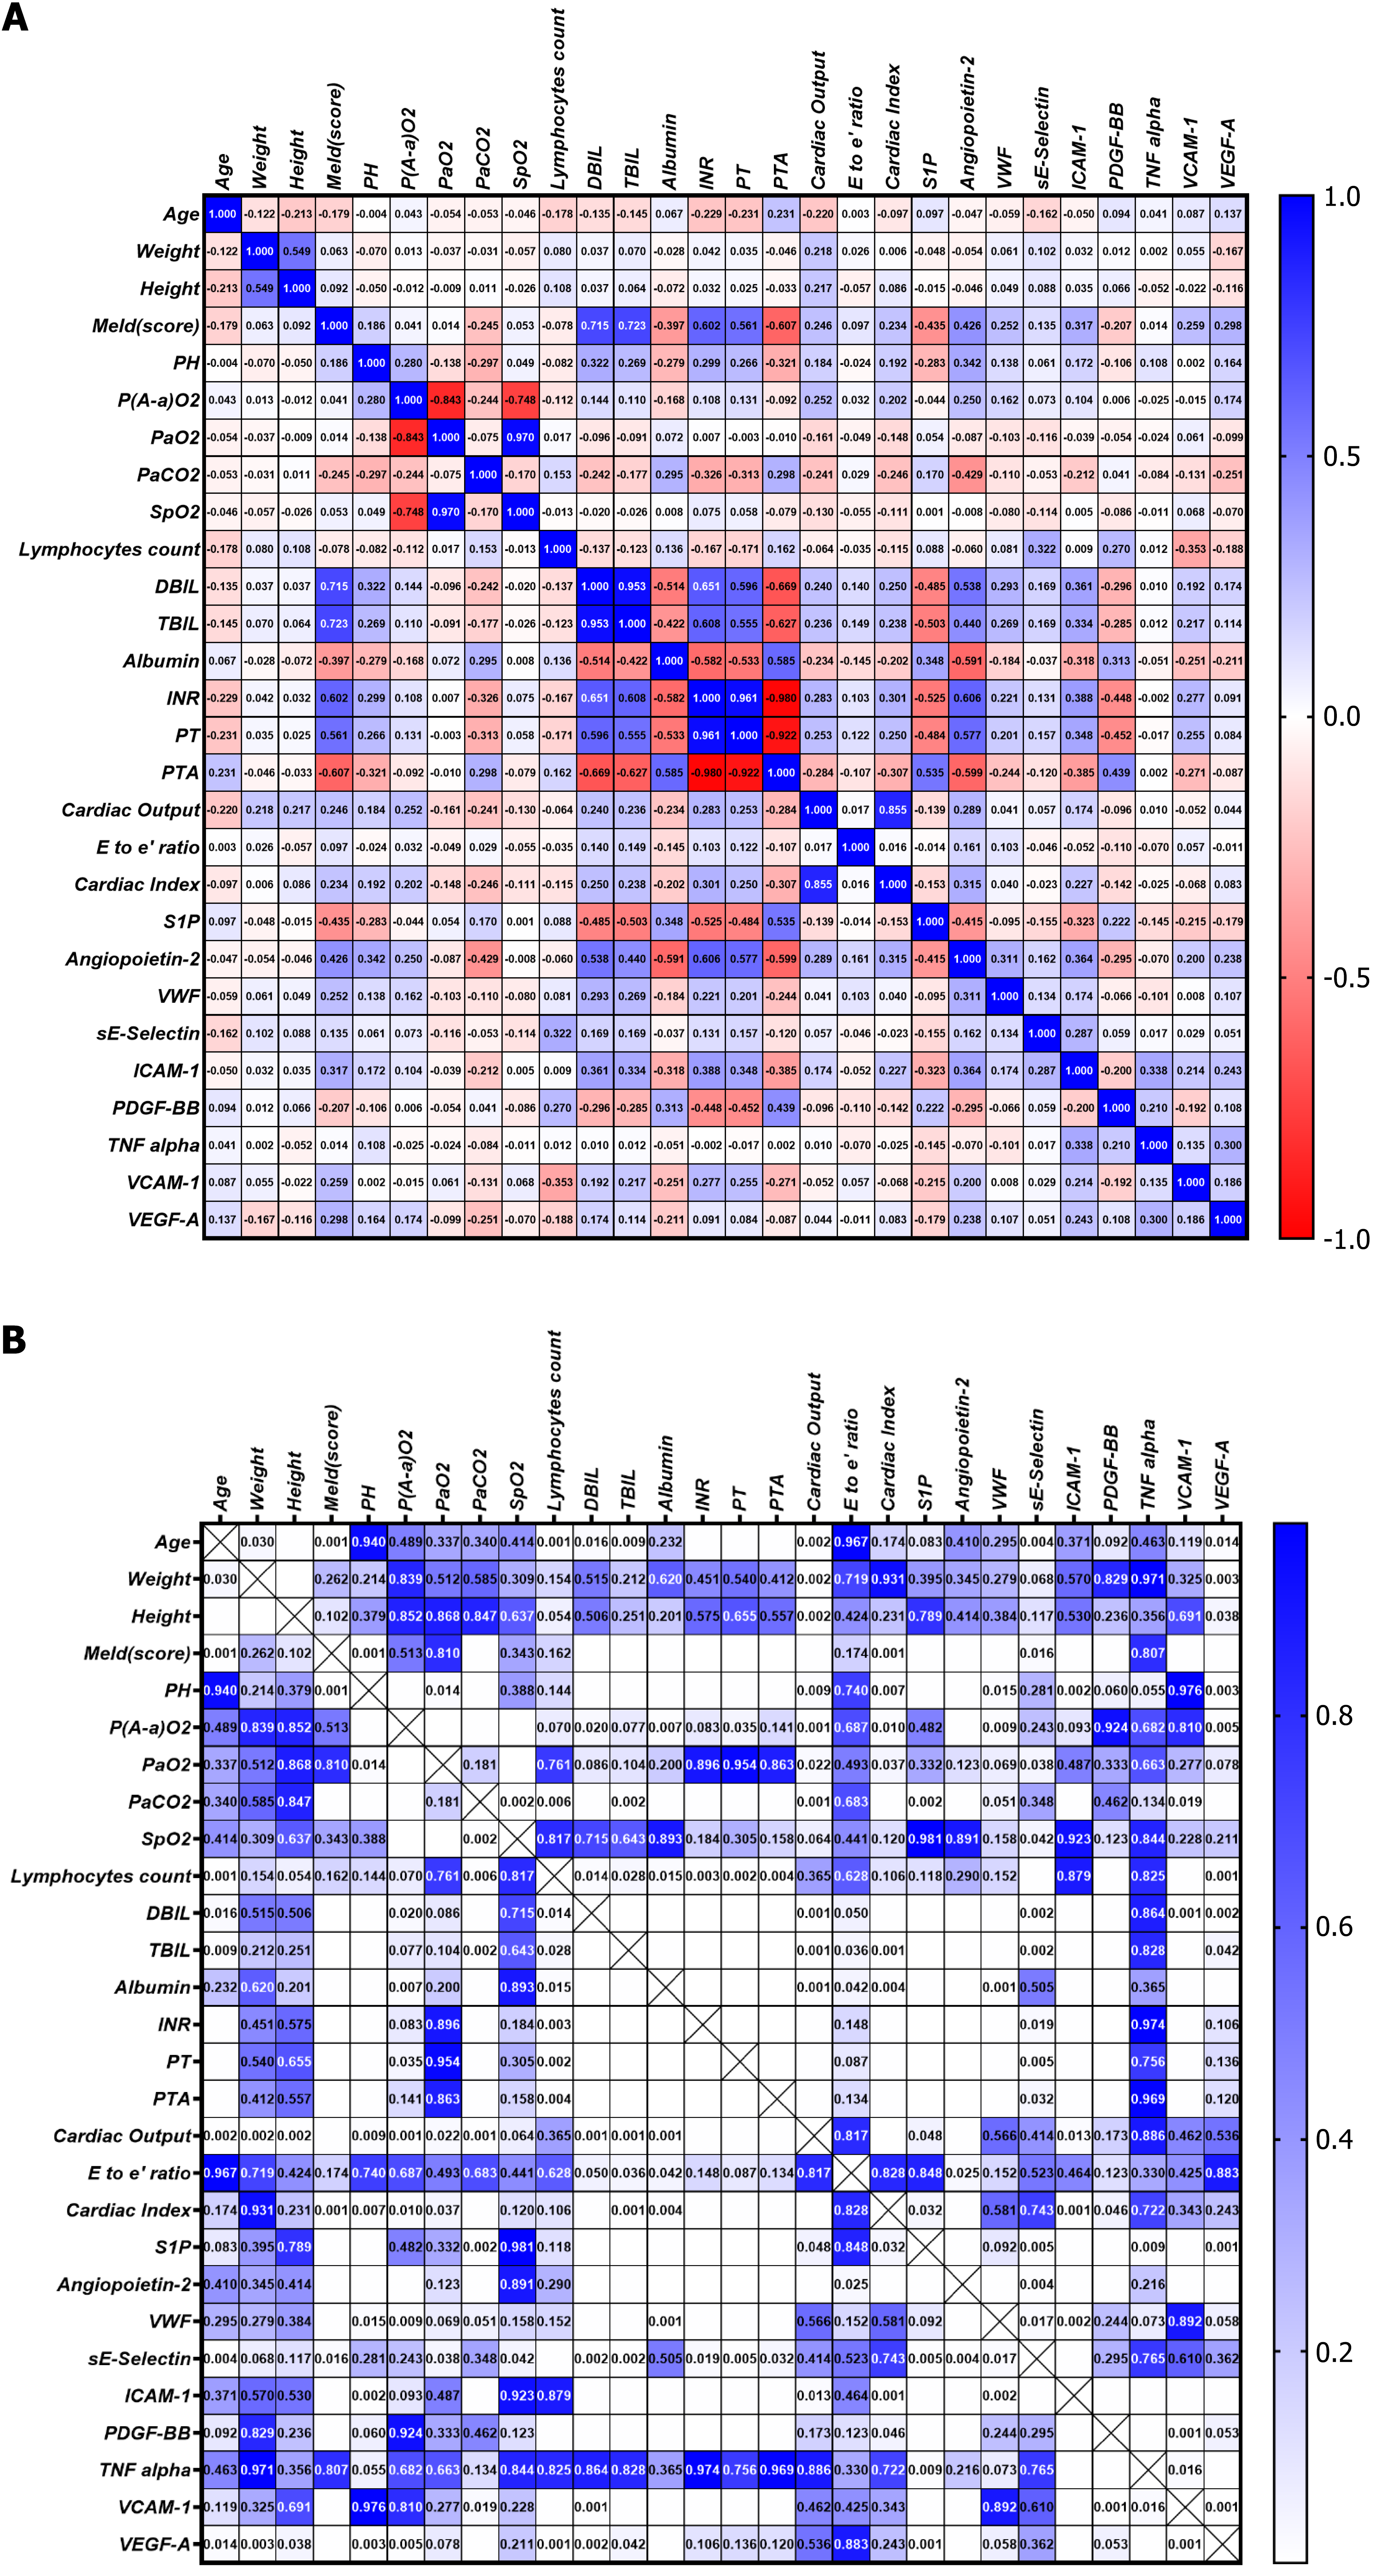
Figure 4 Heatmap depicting the correlation between clinical parameters and biomarkers.
A: The values are presented as Spearman’s correlation coefficient (r) for a sample of 320 runners. The colormap ranges from 1 to -1, with blue indicating the highest value and red indicating the lowest value; B: Heatmap of corresponding P values. The colormap ranges from 0 to 1, with blue representing the largest value and white representing the smallest value. White cells without numerical values indicate that the P value is smaller than 0.001, indicating a highly significant correlation. DBIL: Direct bilirubin; ICAM-1: Intercellular adhesion molecule-1; INR: International normalized ratio; MELD: Model for End-Stage Liver Disease; P(A-a)O2: Alveolar-arterial oxygen gradient; PaO2: Partial pressure of oxygen in arterial blood; PaCO2: Partial pressure of carbon dioxide in arterial blood; PDGF-BB: Platelet-derived growth factor BB; PH: Potential of hydrogen; PT: Prothrombin time; PTA: Prothrombin time activity; S1P: Sphingosine 1 phosphate; SpO2: Peripheral oxygen saturation; TBIL: Total bilirubin; TNF: Tumor necrosis factor; VCAM-1: Vascular cell adhesion molecule-1; VEGF-A: Vascular endothelial growth factor A; vWF: Von Willebrand factor.
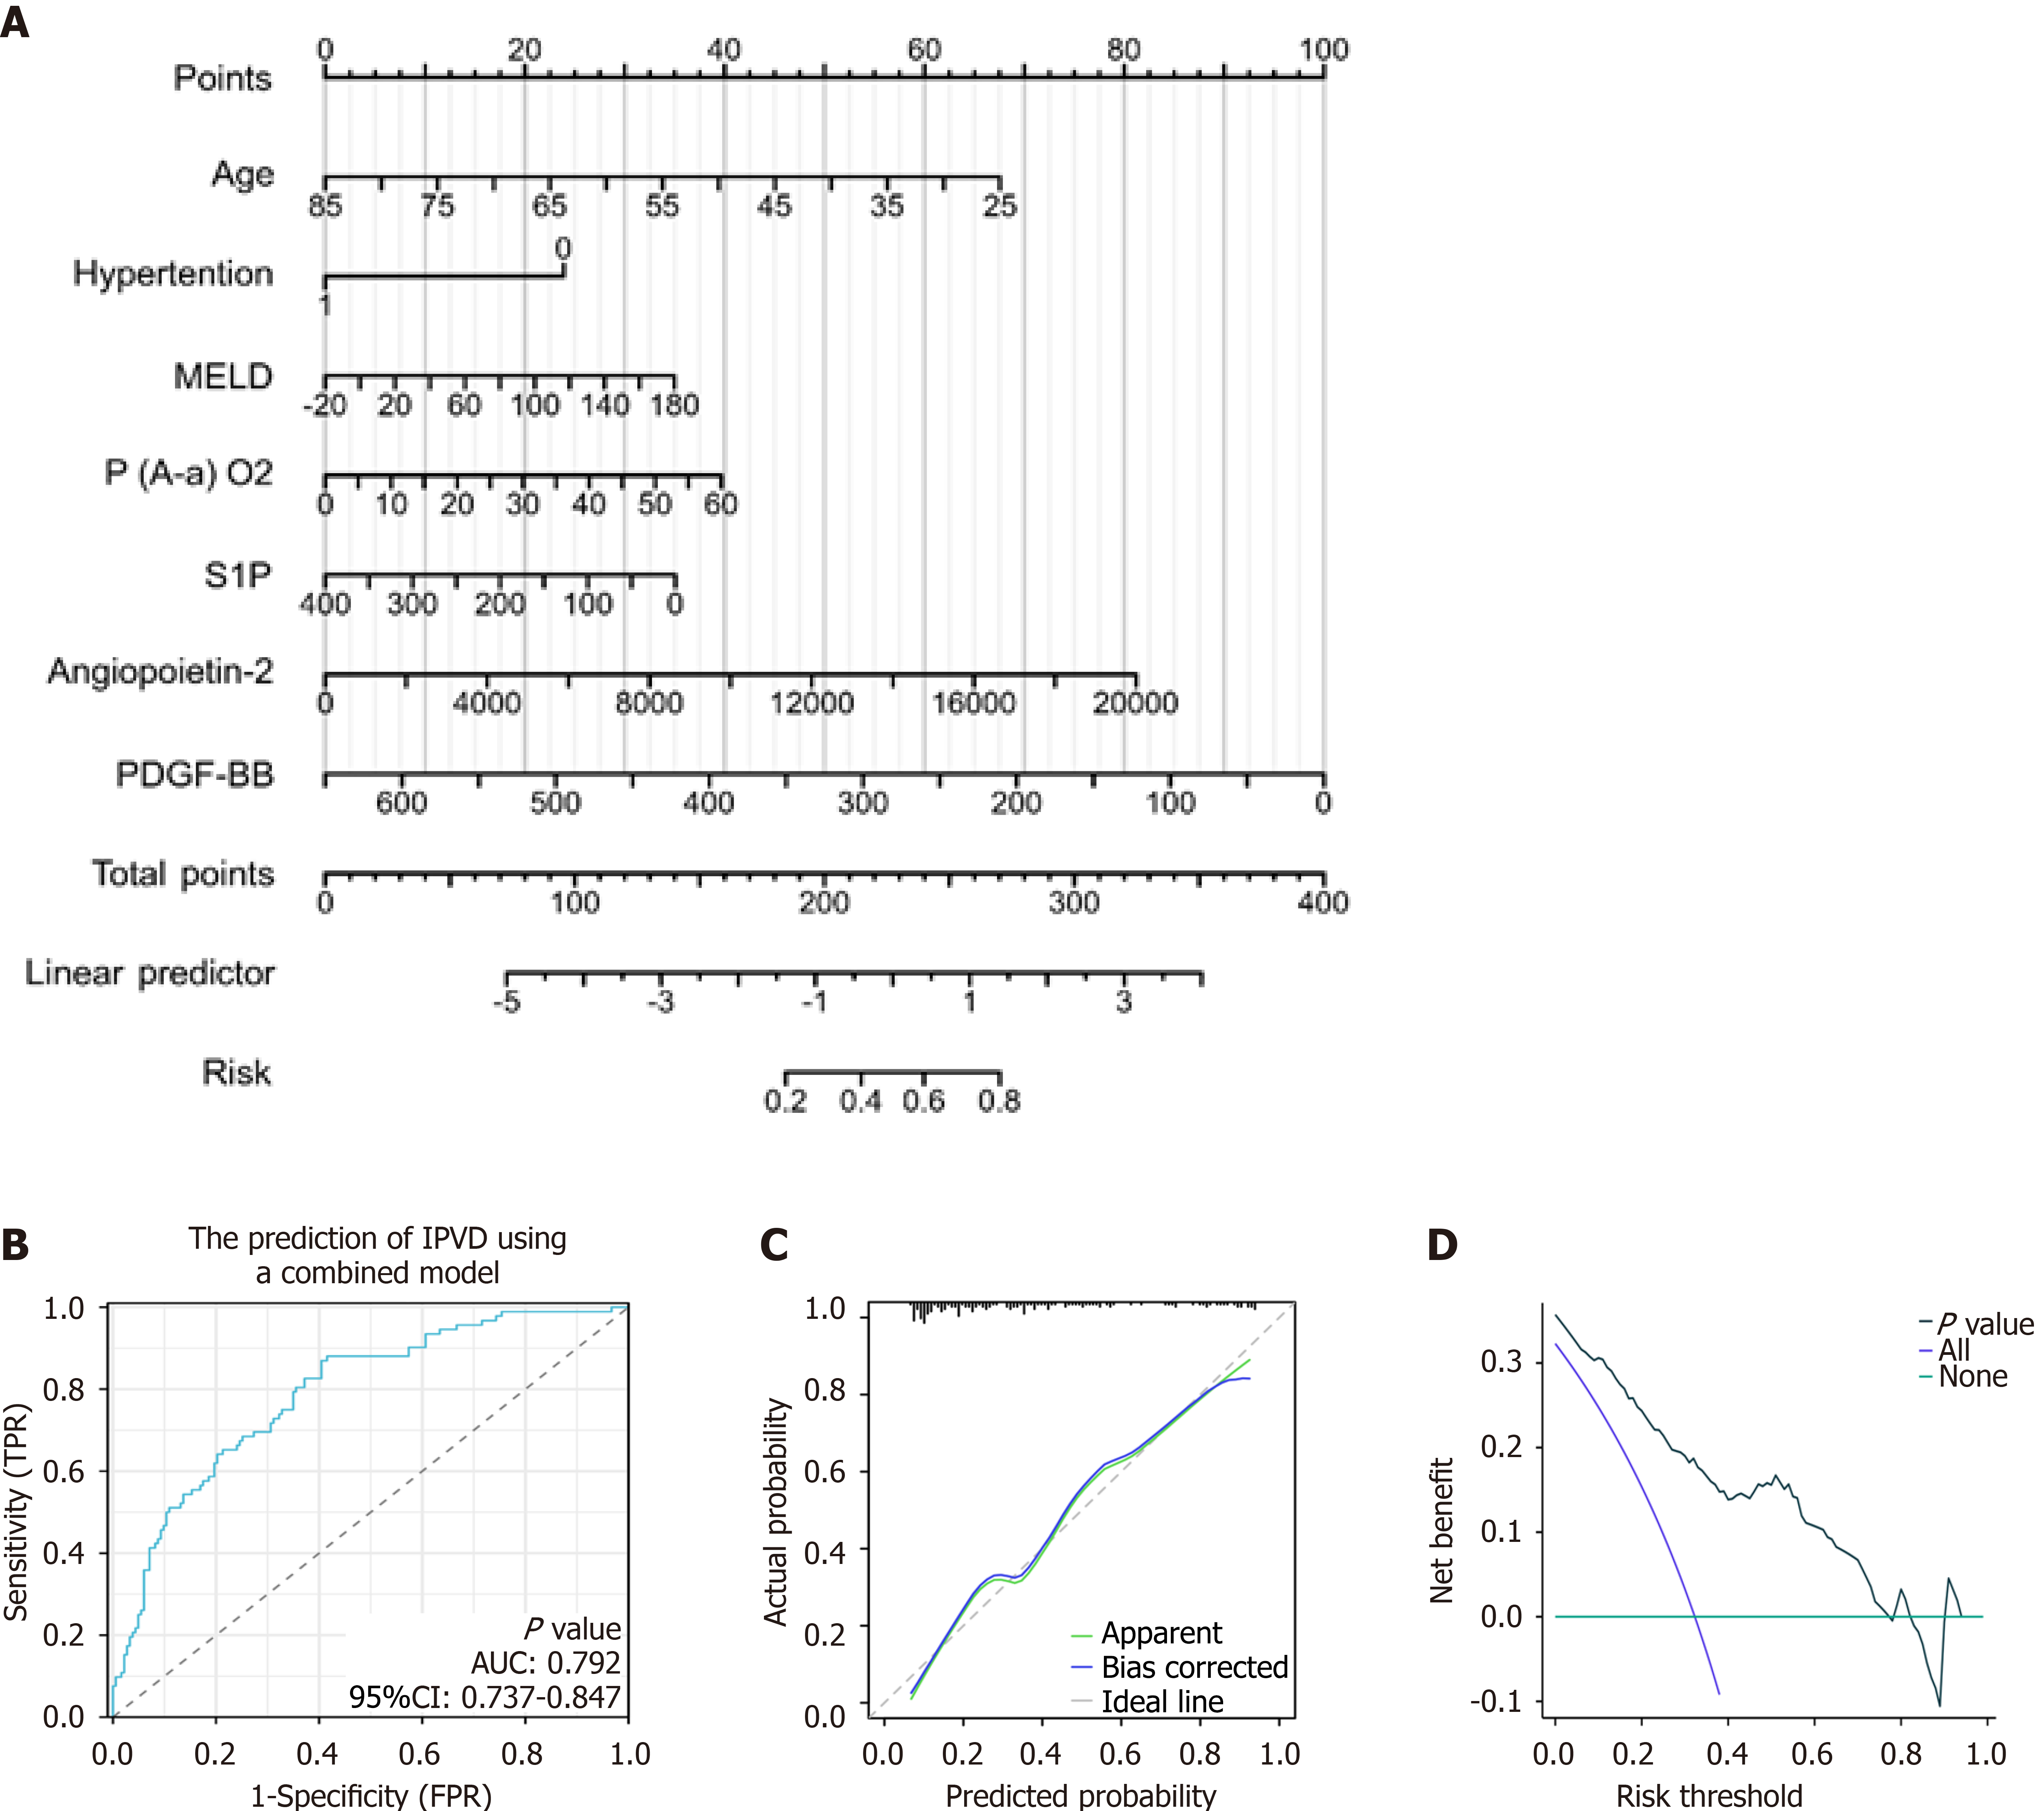
Figure 5 Predictive model for intrapulmonary vascular dilatation combining clinical parameters and biomarkers.
A: Nomogram of the predictive model for intrapulmonary vascular dilatation (IPVD) in patients with cirrhosis. This model integrates four clinical parameters and three biomarkers; B: Receiver operating characteristic (ROC) curve predicting IPVD in patients with cirrhosis. Area under the curve (AUC) was 0.792 (95% confidence interval [CI]: 0.737-0.847); C: Calibration curves; D: Decision curve analysis of the nomogram for the prediction of IPVD. FPR: False-positive rate; MELD: Model for End-Stage Liver Disease; P(A-a)O2: Alveolar-arterial oxygen gradient; PDGF-BB: Platelet-derived growth factor BB; S1P: Sphingosine 1 phosphate; TPR: True-positive rate.
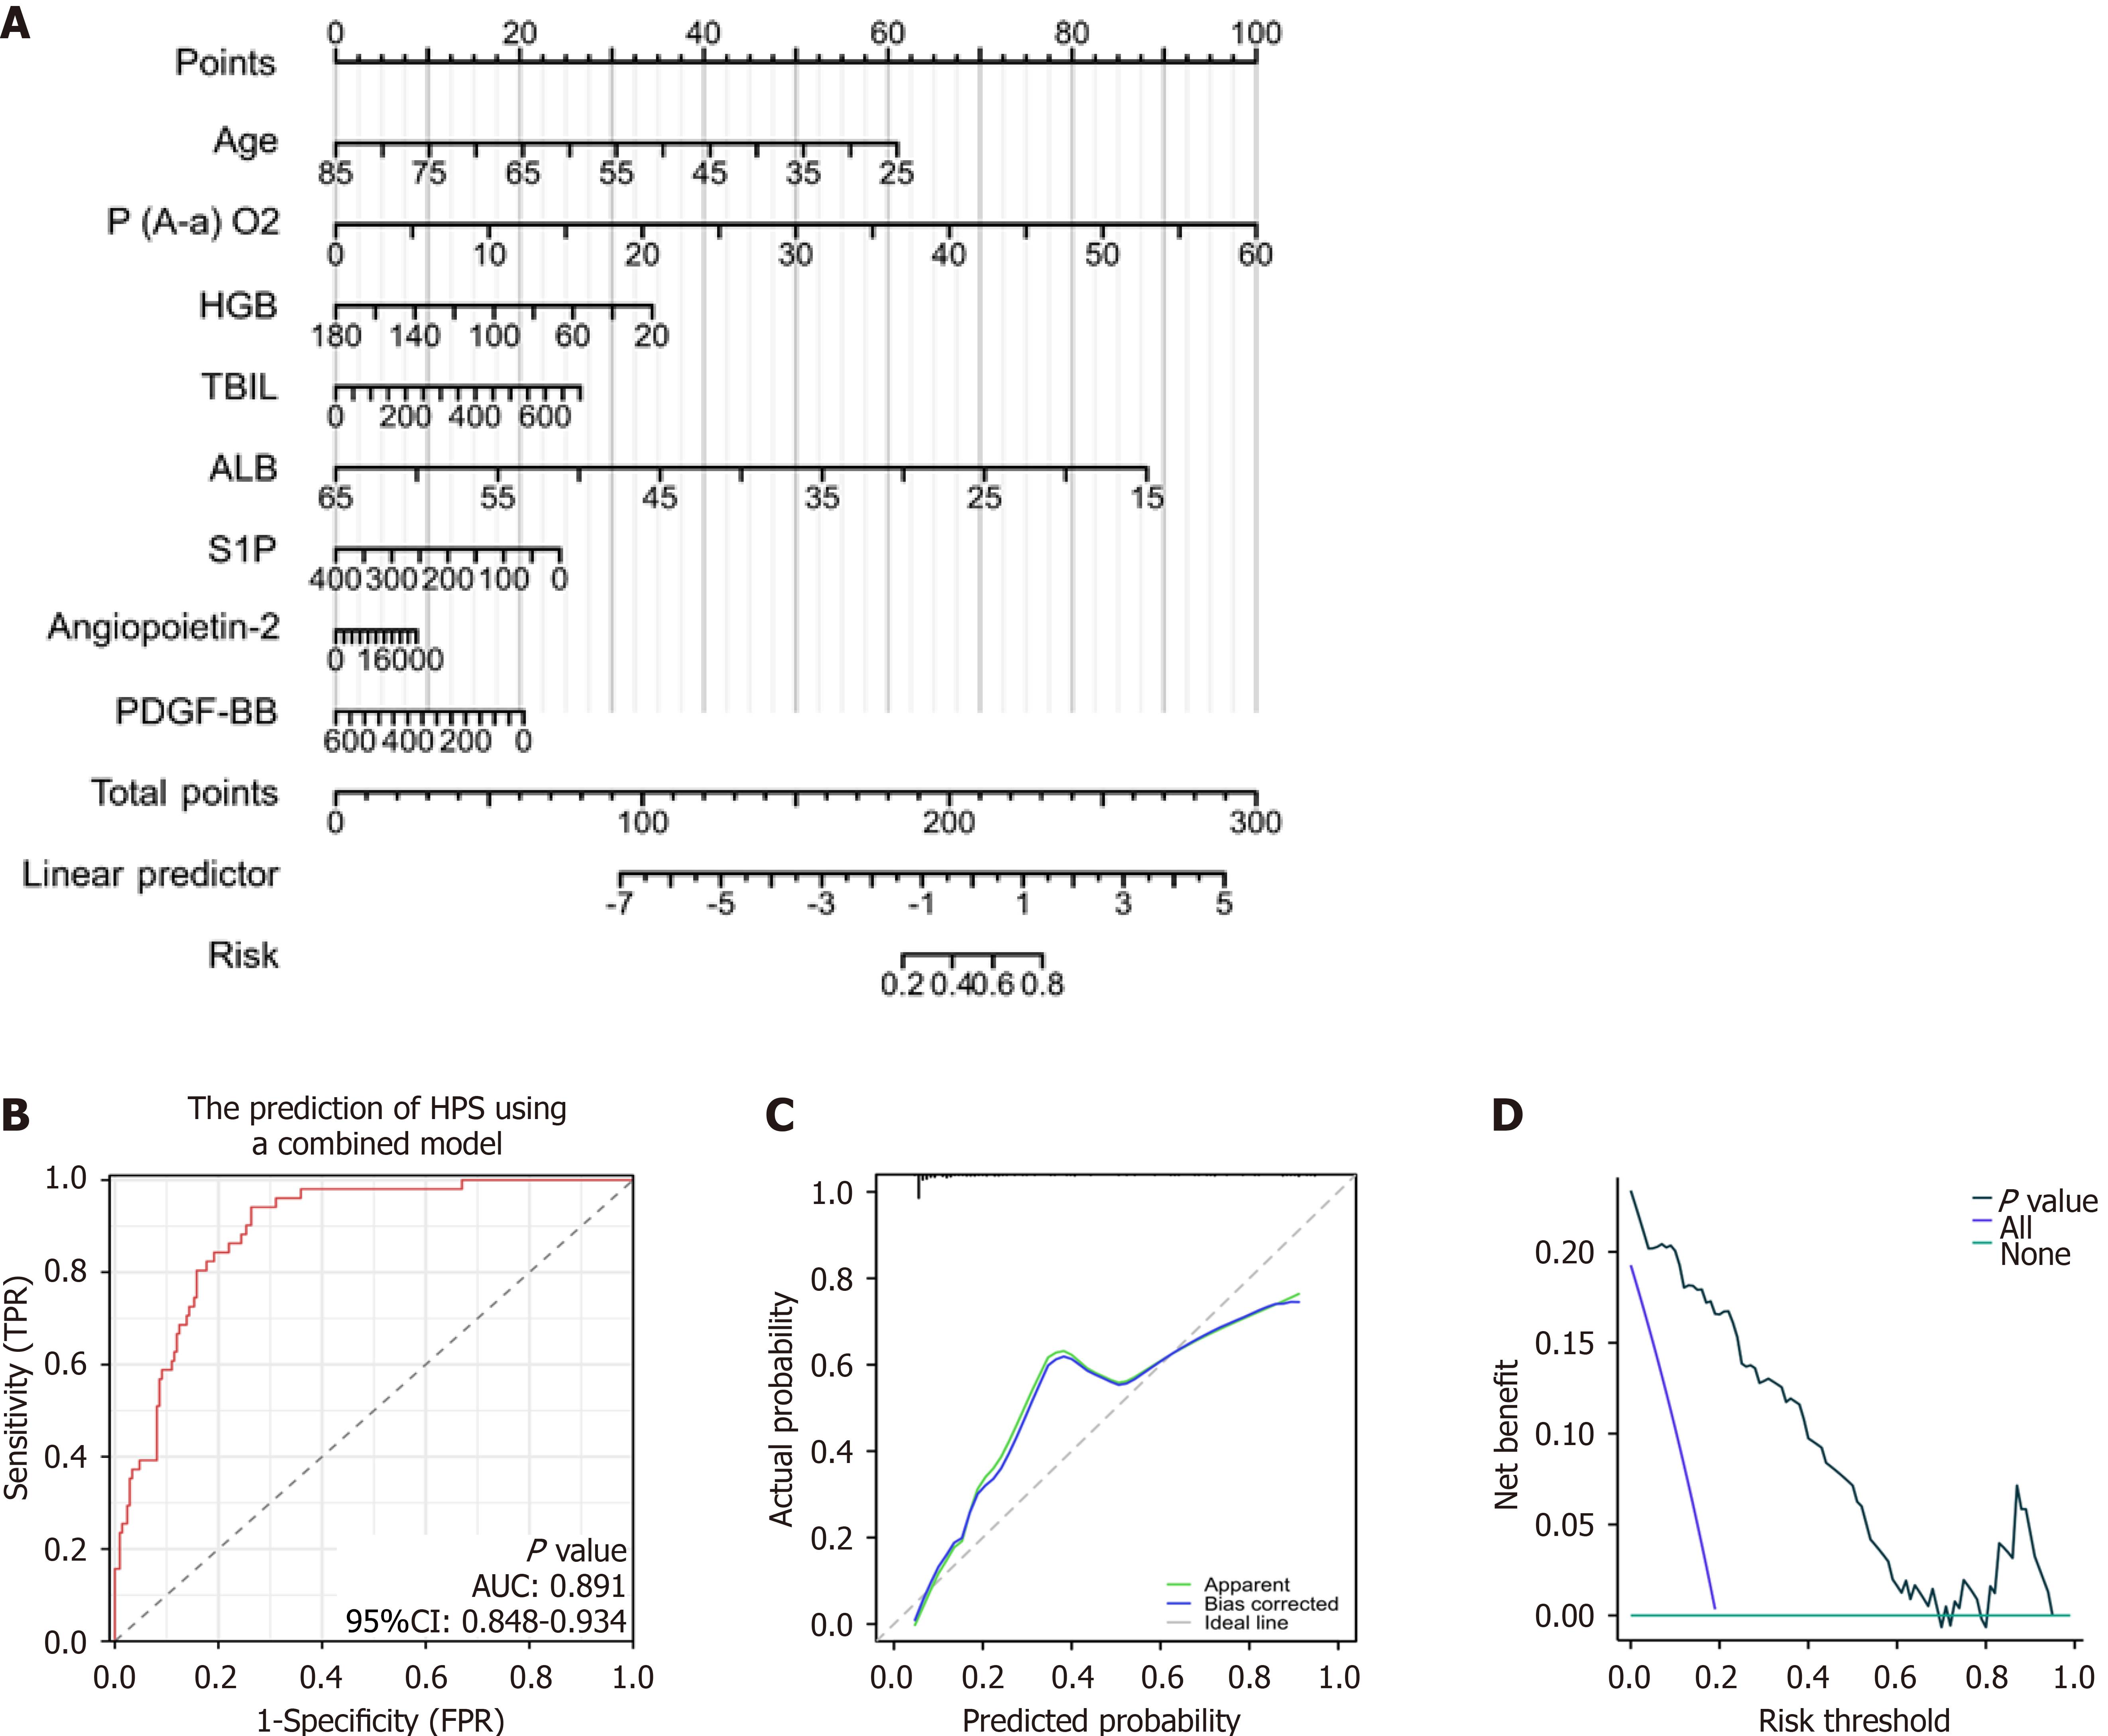
Figure 6 Predictive model for hepatopulmonary syndrome combining clinical parameters and biomarkers.
A: Nomogram of the predictive model for hepatopulmonary syndrome (HPS) in patients with cirrhosis. This model integrates two clinical parameters and six biomarkers; B: Receiver operating characteristic (ROC) curve predicting HPS in patients with cirrhosis. Area under the curve (AUC) was 0.891 (95% confidence interval [CI]: 0.848-0.934); C: Calibration curves; D: Decision curve analysis of the nomogram for the prediction of HPS. ALB: Albumin; HGB: Hemoglobin; FPR: False-positive rate; P(A-a)O2: Alveolar-arterial oxygen gradient; PDGF-BB: Platelet-derived growth factor BB; S1P: Sphingosine 1 phosphate; TBIL: Total bilirubin; TPR: True-positive rate.
- Citation: Wu ZP, Wang YF, Shi FW, Cao WH, Sun J, Yang L, Ding FP, Hu CX, Kang WW, Han J, Yang RH, Song QK, Jin JW, Shi HB, Ma YM. Predictive models and clinical manifestations of intrapulmonary vascular dilatation and hepatopulmonary syndrome in patients with cirrhosis: Prospective comparative study. World J Gastroenterol 2025; 31(15): 105720
- URL: https://www.wjgnet.com/1007-9327/full/v31/i15/105720.htm
- DOI: https://dx.doi.org/10.3748/wjg.v31.i15.105720


