Copyright
©The Author(s) 2025.
World J Gastroenterol. Apr 21, 2025; 31(15): 104996
Published online Apr 21, 2025. doi: 10.3748/wjg.v31.i15.104996
Published online Apr 21, 2025. doi: 10.3748/wjg.v31.i15.104996
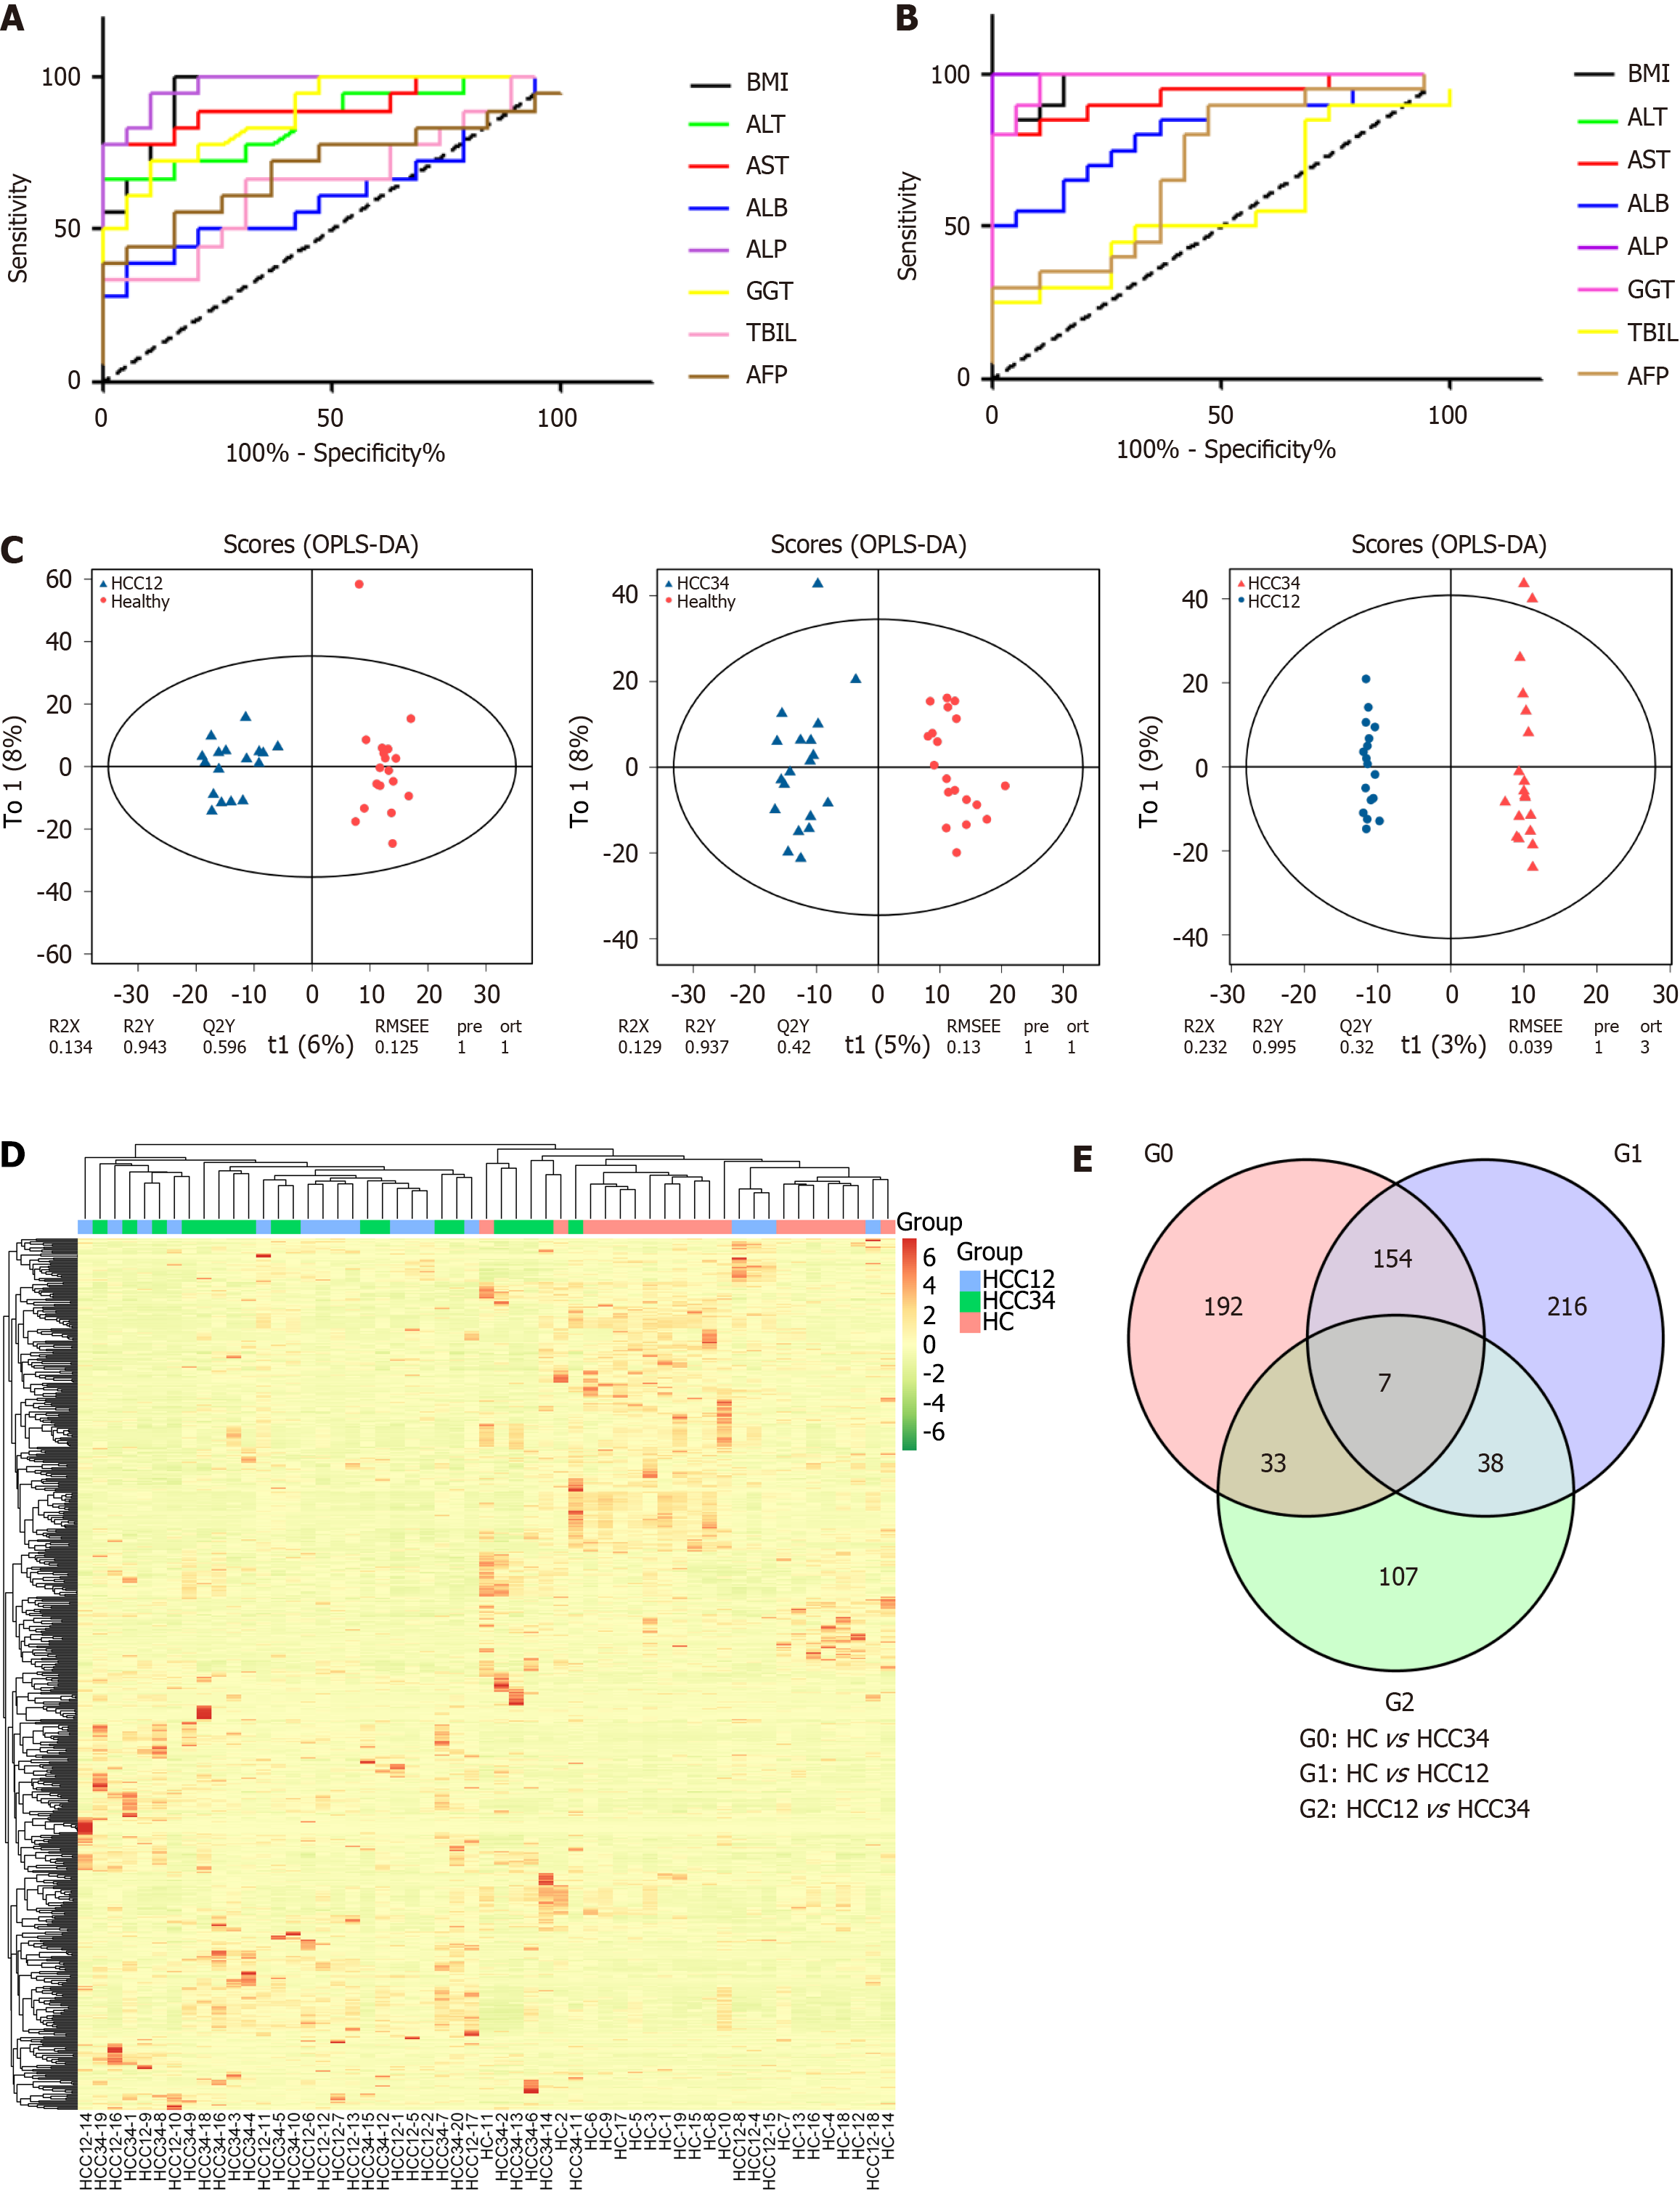
Figure 1 Receiver operating characteristic analysis of serum indicators and alteration analysis of fecal metabolic profiling.
A and B: Receiver operating characteristic curves of healthy control (HC) vs comprising patients with stage I and II hepatocellular carcinoma (HCC12) (A) and HC vs comprising patients with stage III and IV hepatocellular carcinoma (HCC34) (B); C: Orthogonal partial least squares discriminant analysis score plots of HC vs HCC12, HC vs HCC34, and HCC12 vs HCC34; D: Clustered heatmap of the differential metabolites in each group; E: Venn diagram of the differential metabolites in each comparison. BMI: Body mass index; ALT: Alanine aminotransferase; AST: Aspartate aminotransferase; ALB: Albumin; ALP: Alkaline phosphatase; GGT: γ-glutamyl transferase; TBIL: Total bilirubin; AFP: Alpha-fetoprotein; OPLS-DA: Orthogonal partial least squares discriminant analysis; HC: Healthy control; HCC: Hepatocellular carcinoma; HCC12: Comprising patients with stage I and II hepatocellular carcinoma; HCC34: Comprising patients with stage III and IV hepatocellular carcinoma.
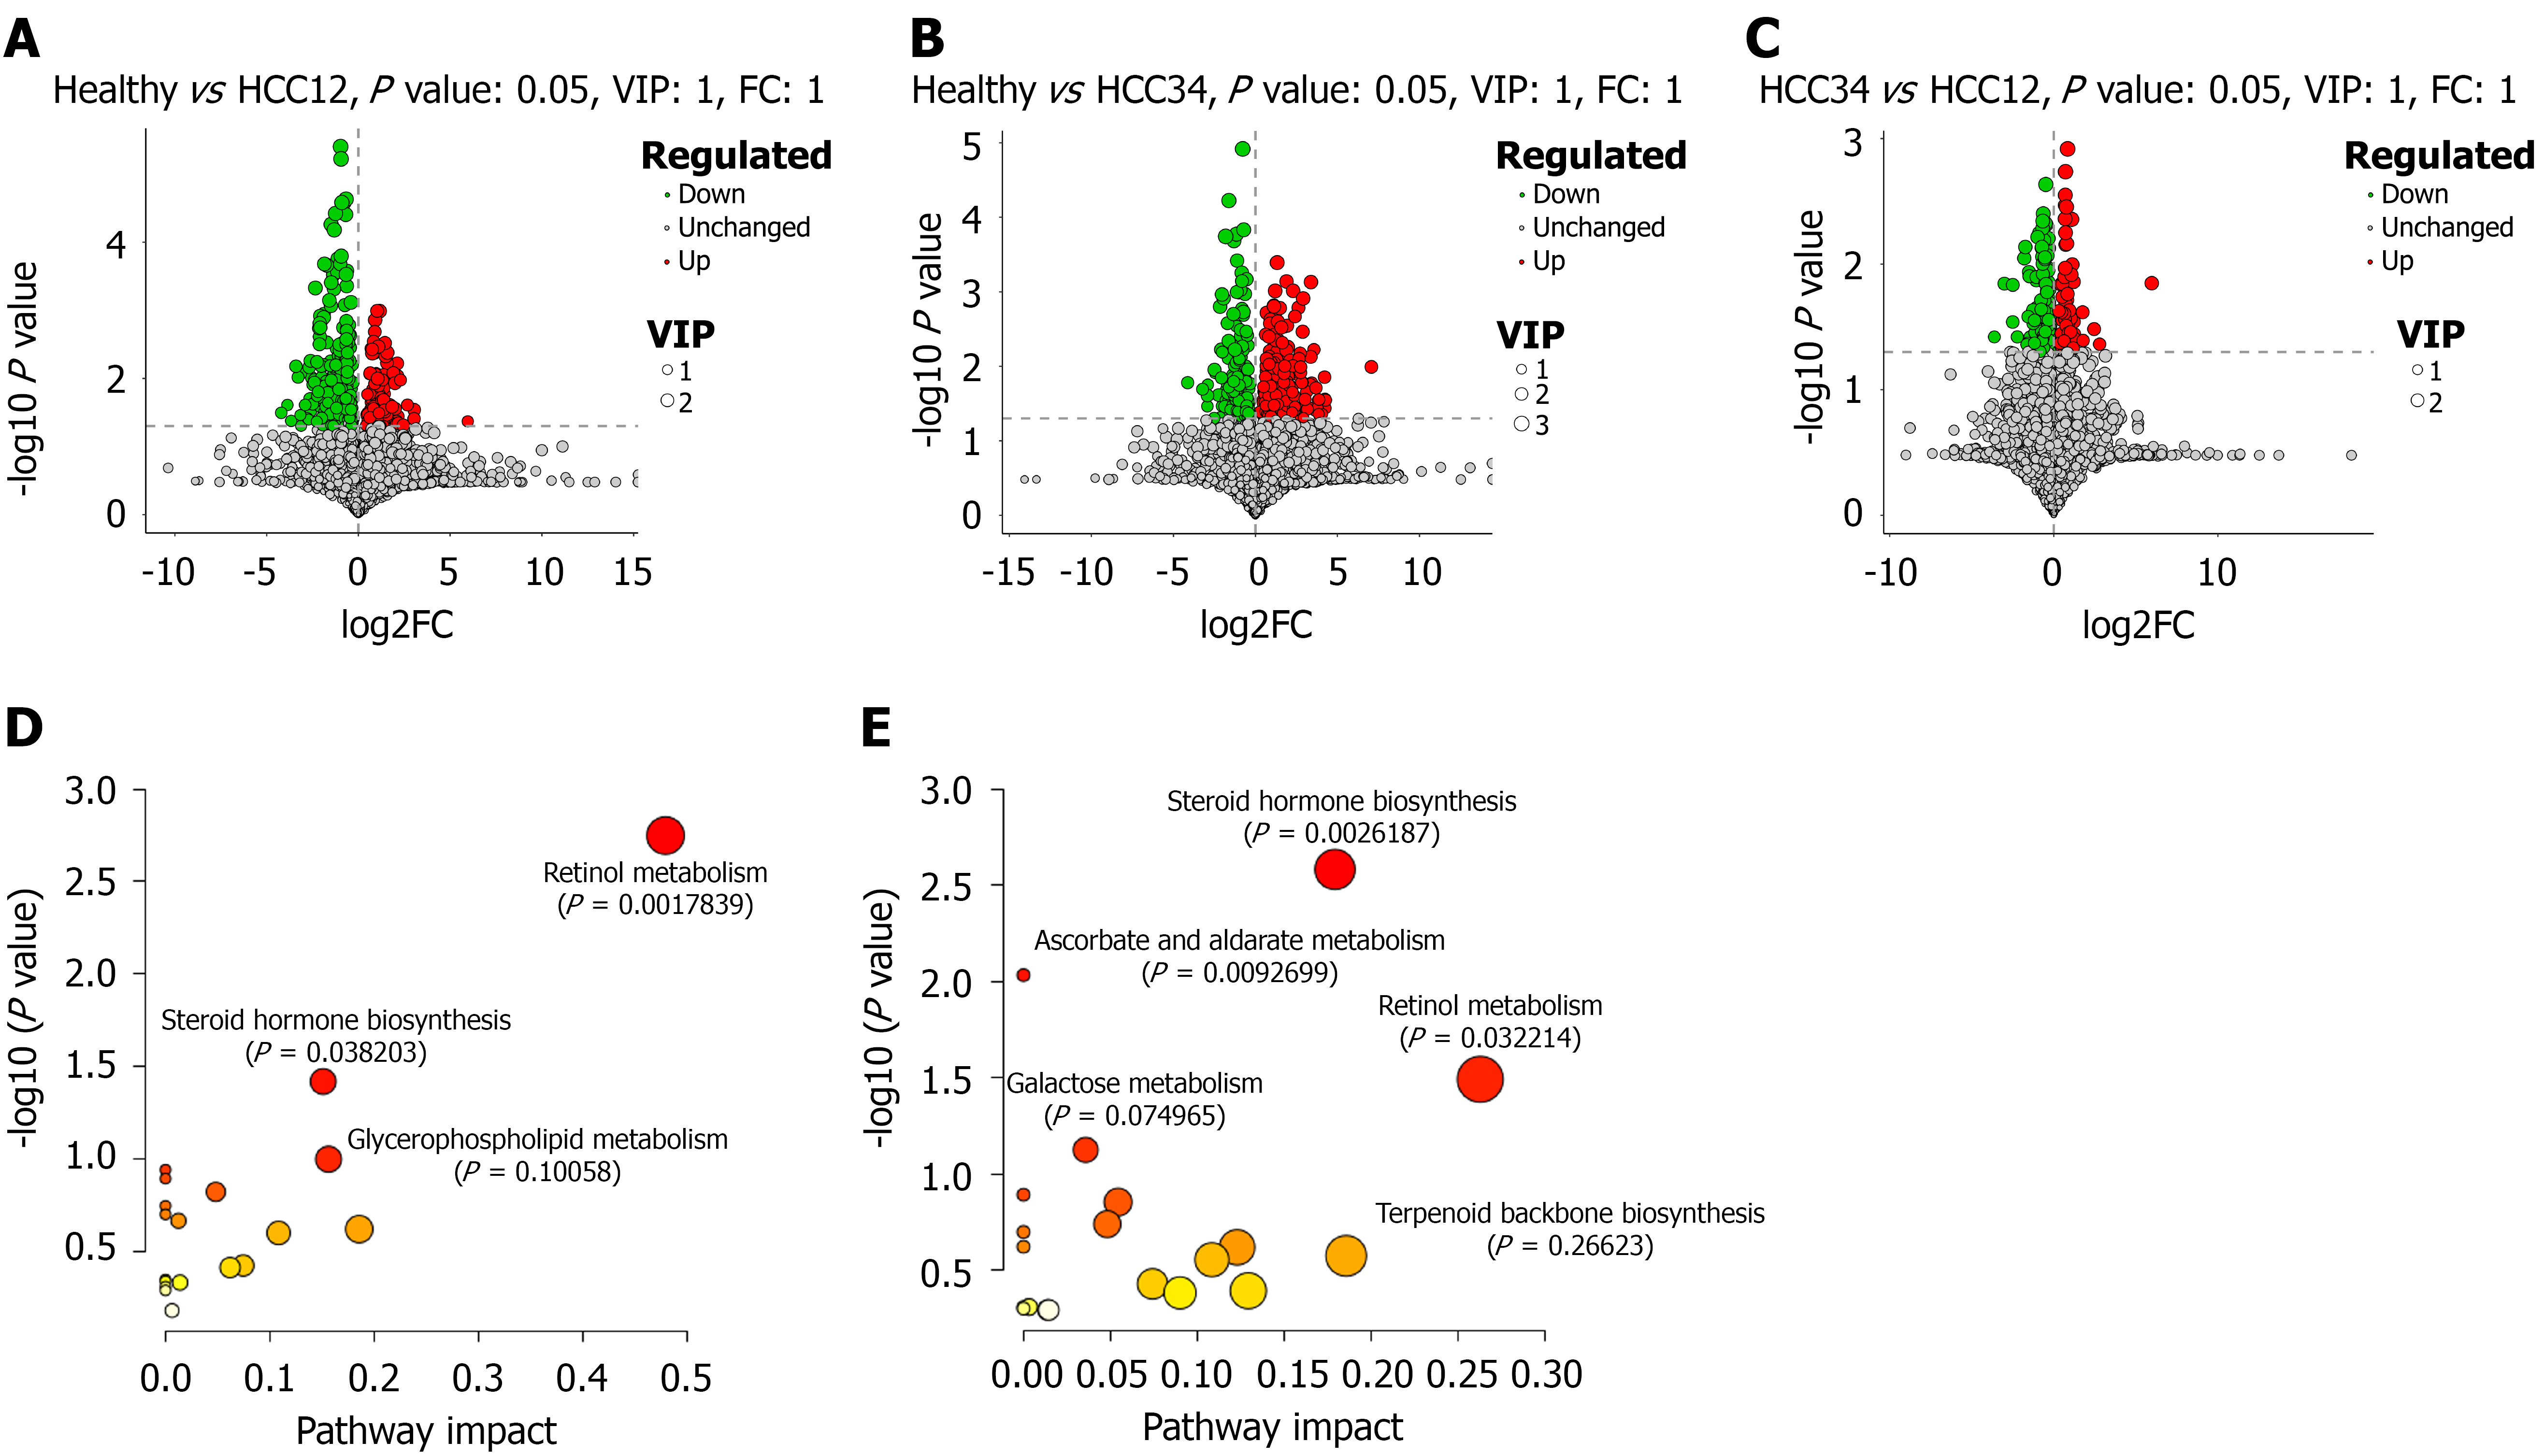
Figure 2 Volcano plots of the differential metabolites and bubble plots of the Kyoto Encyclopedia of Genes and Genomes pathways.
A-C: The differential metabolites of healthy control (HC) vs comprising patients with stage I and II hepatocellular carcinoma (HCC12) (A), HC vs comprising patients with stage III and IV hepatocellular carcinoma (HCC34) (B), and HCC12 vs HCC34 (C) were displayed as volcano plots; D and E: Kyoto Encyclopedia of Genes and Genomes enrichment analysis was separately performed on the MetaboAnalyst website (https://www.metaboanalyst.ca/) for the differential metabolites in the two comparisons, namely HC vs HCC12 (D) and HC vs HCC34 (E). HCC: Hepatocellular carcinoma; HCC12: Comprising patients with stage I and II hepatocellular carcinoma; HCC34: Comprising patients with stage III and IV hepatocellular carcinoma; VIP: Variable importance in projection; FC: Fold change.
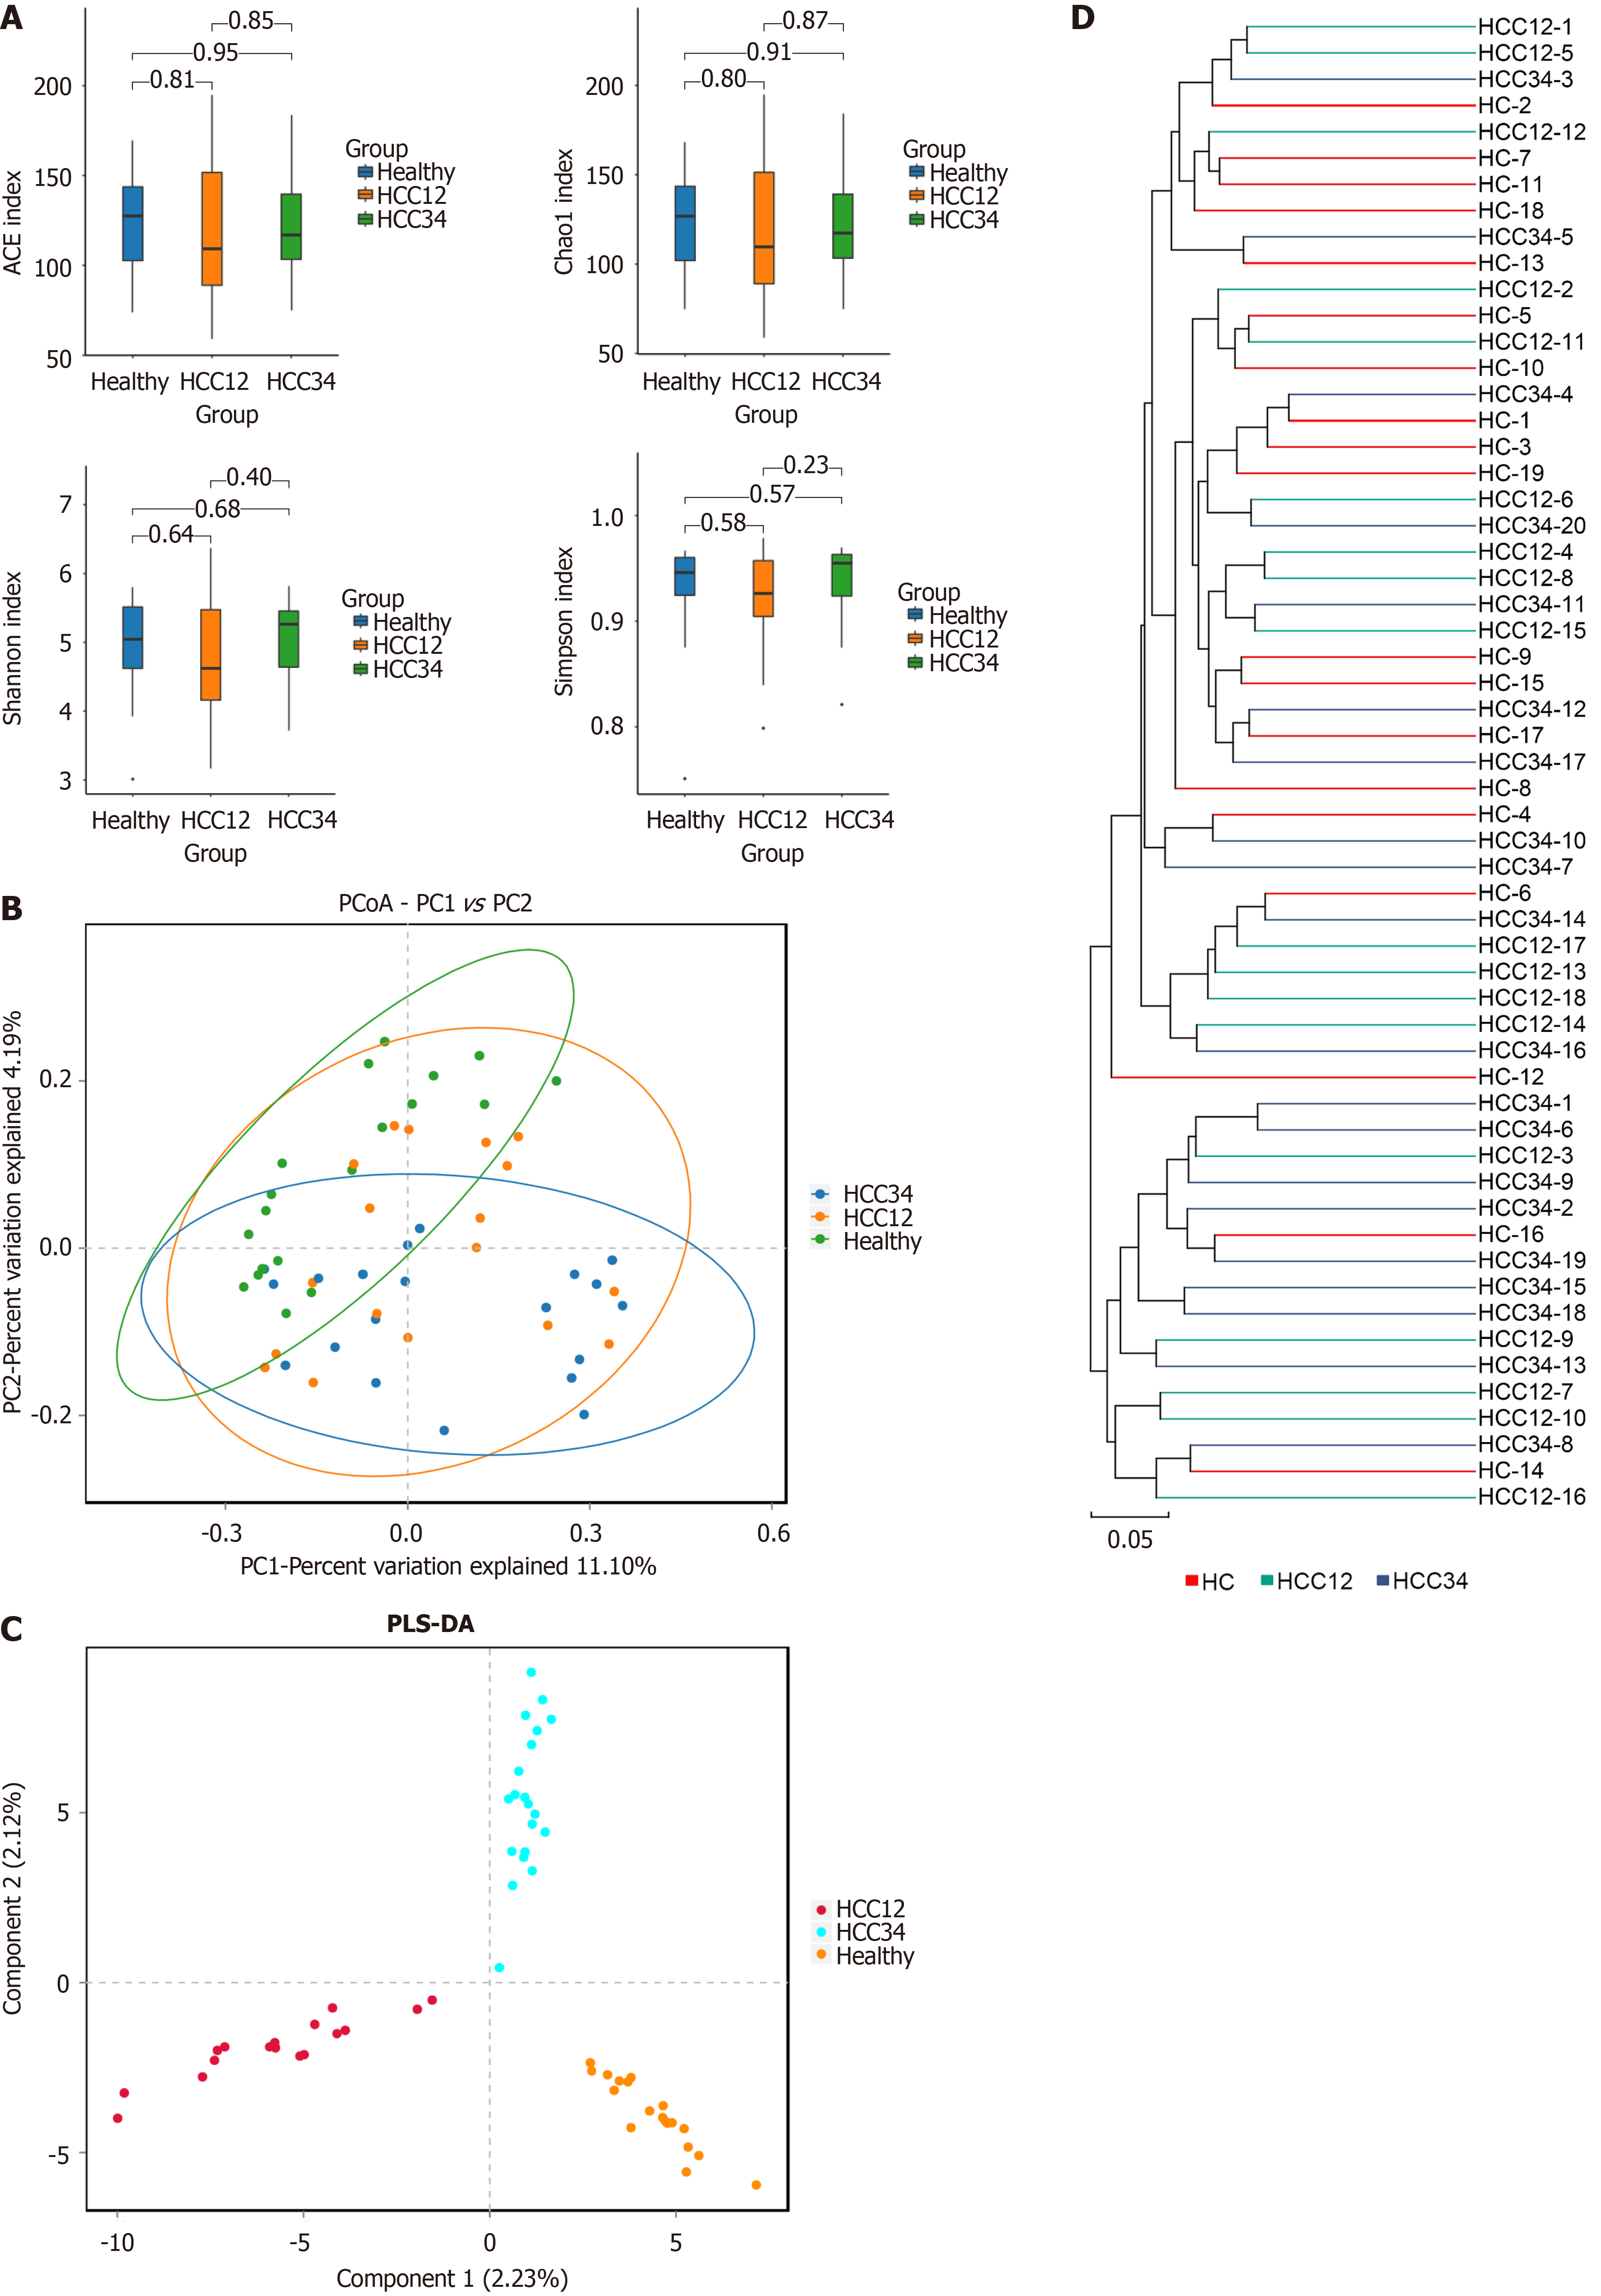
Figure 3 Alterations of the ecological structure of the intestinal bacteria in patients with hepatocellular carcinoma.
A: Assessment of α-diversity within fecal samples sourced from patients with hepatocellular carcinoma; B: Visualization of unweighted UniFrac principal component analysis scores through a scatter plot; C: Scatter plot of orthogonal partial least squares discriminant analysis of the metabolic profiling of each group; D: Construction of a hierarchical clustering dendrogram utilizing the unweighted pair group method with arithmetic mean. PCoA: Principal component analysis; HCC12: Comprising patients with stage I and II hepatocellular carcinoma; HCC34: Comprising patients with stage III and IV hepatocellular carcinoma; ACE: Abundance-based coverage estimator; PLS-DA: Partial least squares discriminant analysis; HC: Healthy control.
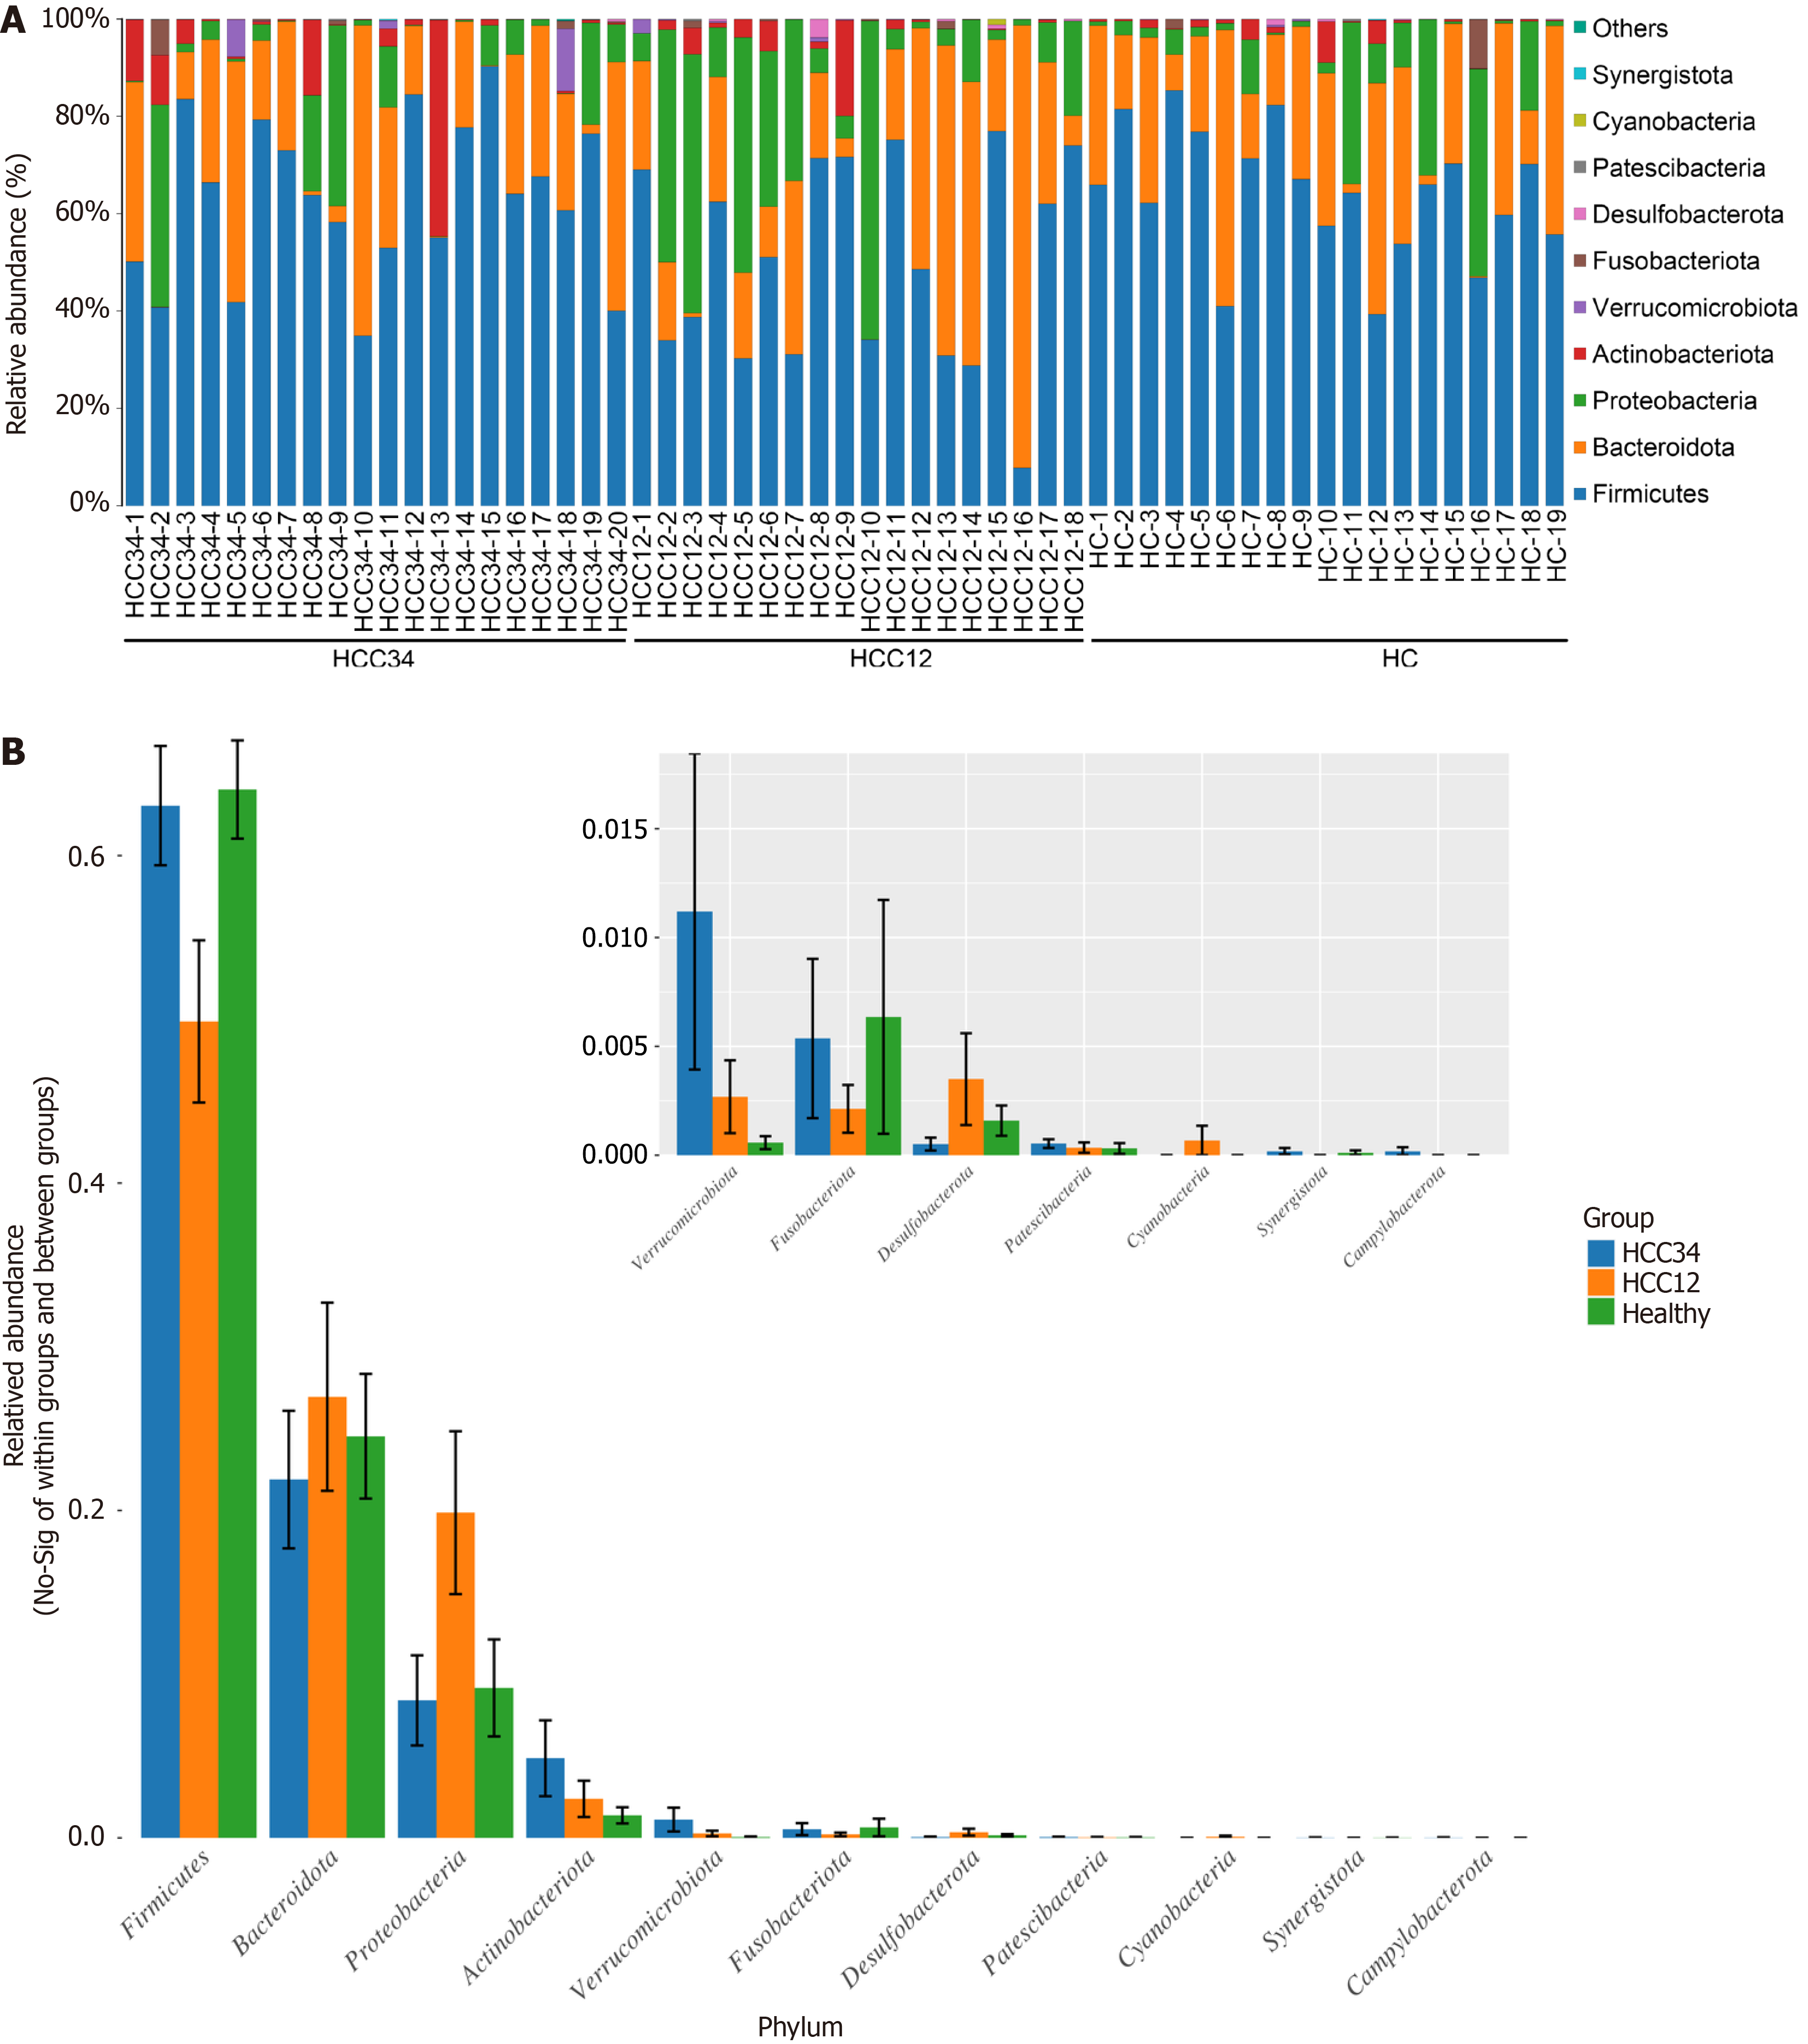
Figure 4 The phylum-level composition of the gut microbiota in patients with hepatocellular carcinoma.
A: The 10 phyla with the highest abundance in each sample; B: Variance analysis of the 10 most abundant bacterial phyla among the groups. HC: Healthy control; HCC: Hepatocellular carcinoma; HCC12: Comprising patients with stage I and II hepatocellular carcinoma; HCC34: Comprising patients with stage III and IV hepatocellular carcinoma.
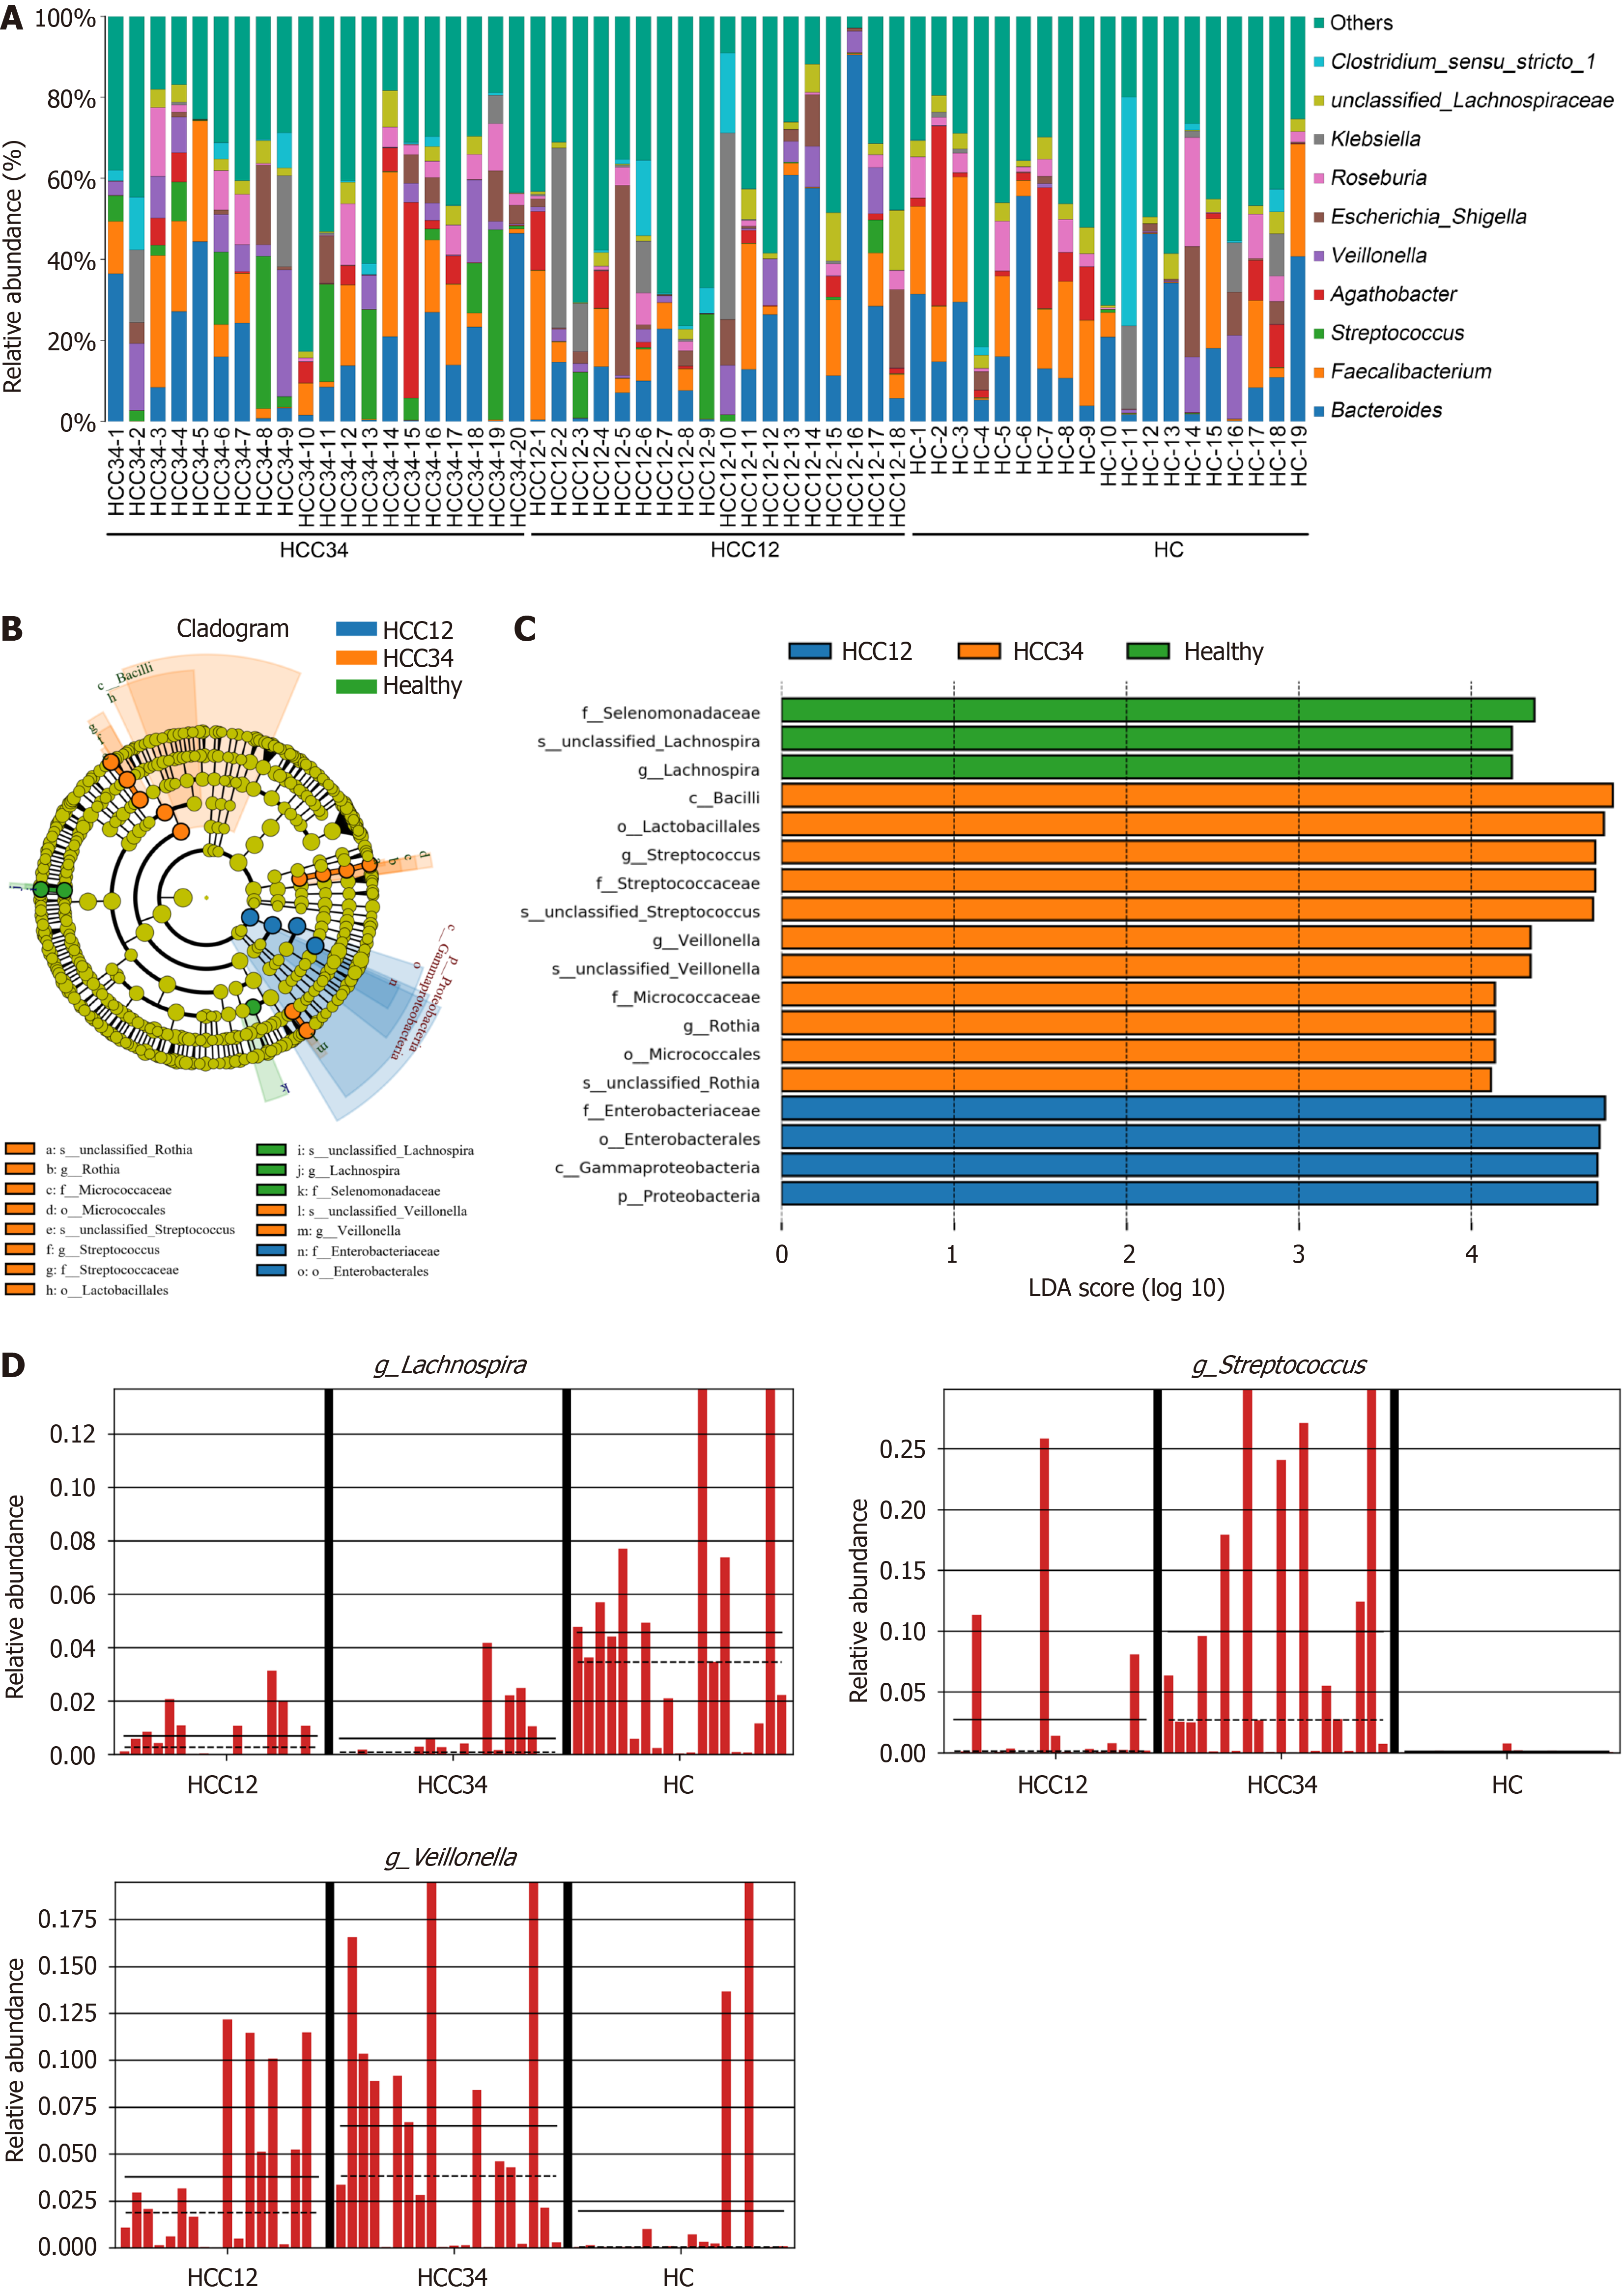
Figure 5 Screening of the dominant differential bacterial communities in patients with hepatocellular carcinoma.
A: The top 10 most dominant bacterial genera and their proportional presence in the three groups; B: Linear discriminant analysis effect size; C: Linear discriminant analysis score; D: Three representative bacterial genera with significant intergroup differences. The median is indicated by the dashed line, whereas the solid line denotes the mean. HCC: Hepatocellular carcinoma; HC: Healthy control; HCC12: Comprising patients with stage I and II hepatocellular carcinoma; HCC34: Comprising patients with stage III and IV hepatocellular carcinoma; LDA: Linear discriminant analysis.
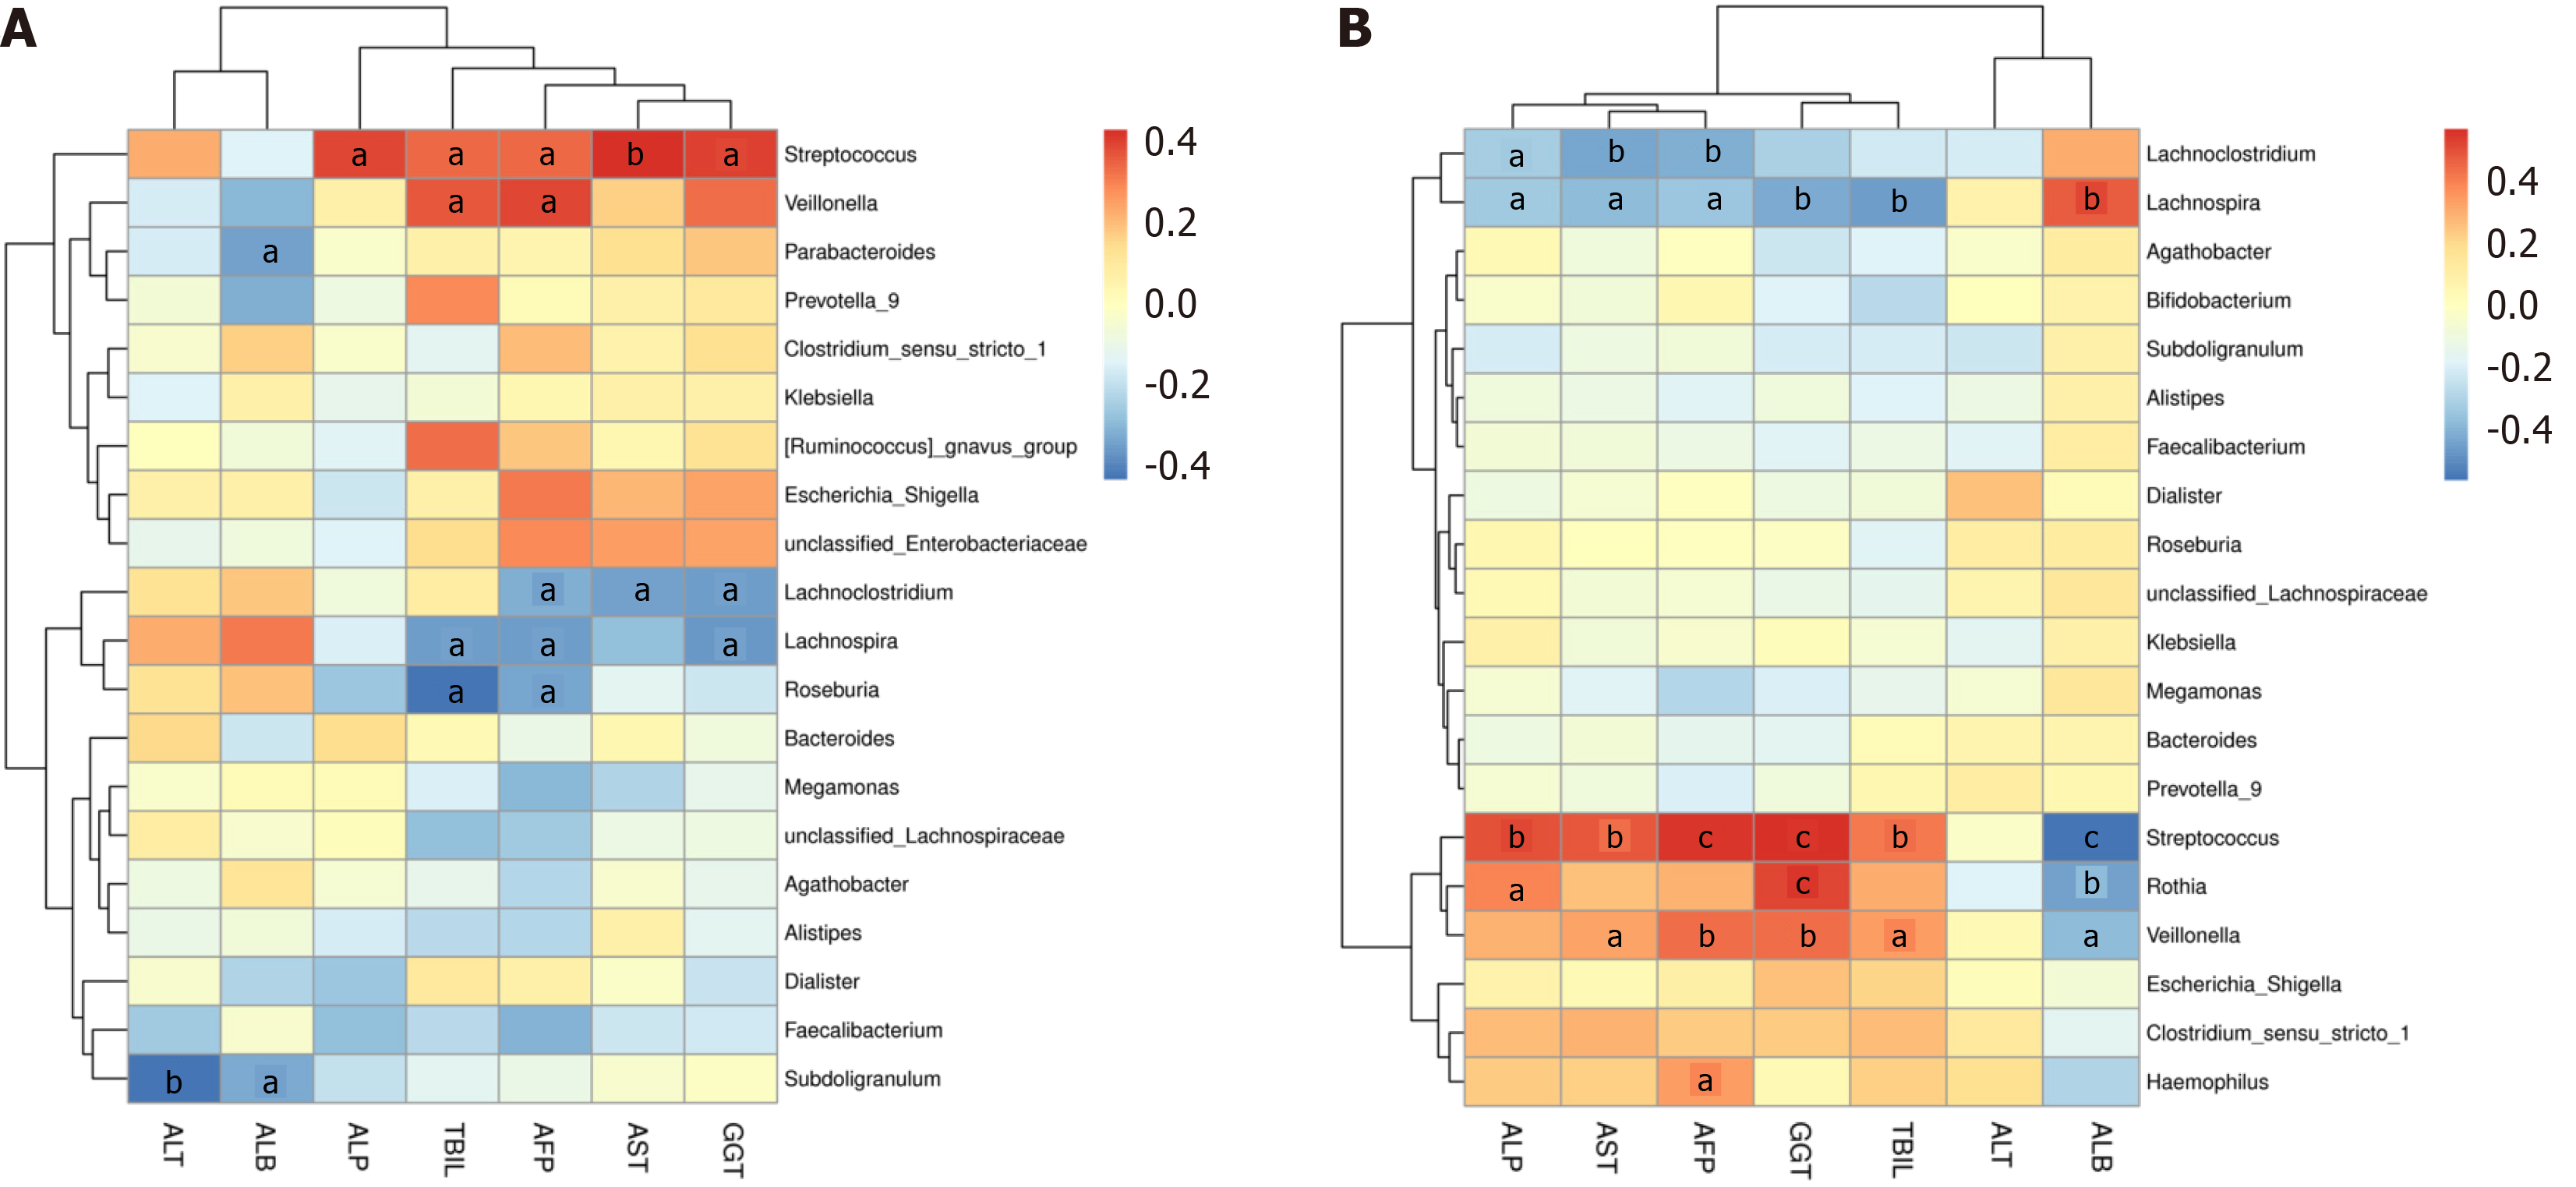
Figure 6 Correlation analysis of intestinal microbiota and serum indicators.
The heatmap presents the correlations between the top 20 differentially abundant bacterial genera and serum indicators. A: In the comparisons healthy control (HC) vs comprising patients with stage I and II hepatocellular carcinoma (HCC12); B: HC vs comprising patients with stage III and IV hepatocellular carcinoma (HCC34). aP < 0.05. bP < 0.01. cP < 0.001. ALT: Alanine aminotransferase; AST: Aspartate aminotransferase; ALB: Albumin; ALP: Alkaline phosphatase; GGT: γ-glutamyl transferase; TBIL: Total bilirubin; AFP: Alpha-fetoprotein.
Figure 7 Heatmap of the correlations between differential metabolites and bacterial genera in fecal samples.
A-C: Correlation analysis of the differential metabolites and bacterial genera based on comparisons including healthy control (HC) vs comprising patients with stage I and II hepatocellular carcinoma (HCC12) (A), HC vs comprising patients with stage III and IV hepatocellular carcinoma (HCC34) (B), and HCC12 vs HCC34 (C). Correlation analysis was conducted between differential metabolites and bacteria at the phylum (upper panel) and genus level (lower panel).
- Citation: Feng J, Wang JP, Hu JR, Li P, Lv P, He HC, Cheng XW, Cao Z, Han JJ, Wang Q, Su Q, Liu LX. Multi-omics reveals the associations among the fecal metabolome, intestinal bacteria, and serum indicators in patients with hepatocellular carcinoma. World J Gastroenterol 2025; 31(15): 104996
- URL: https://www.wjgnet.com/1007-9327/full/v31/i15/104996.htm
- DOI: https://dx.doi.org/10.3748/wjg.v31.i15.104996


