Copyright
©The Author(s) 2025.
World J Gastroenterol. Apr 14, 2025; 31(14): 99897
Published online Apr 14, 2025. doi: 10.3748/wjg.v31.i14.99897
Published online Apr 14, 2025. doi: 10.3748/wjg.v31.i14.99897
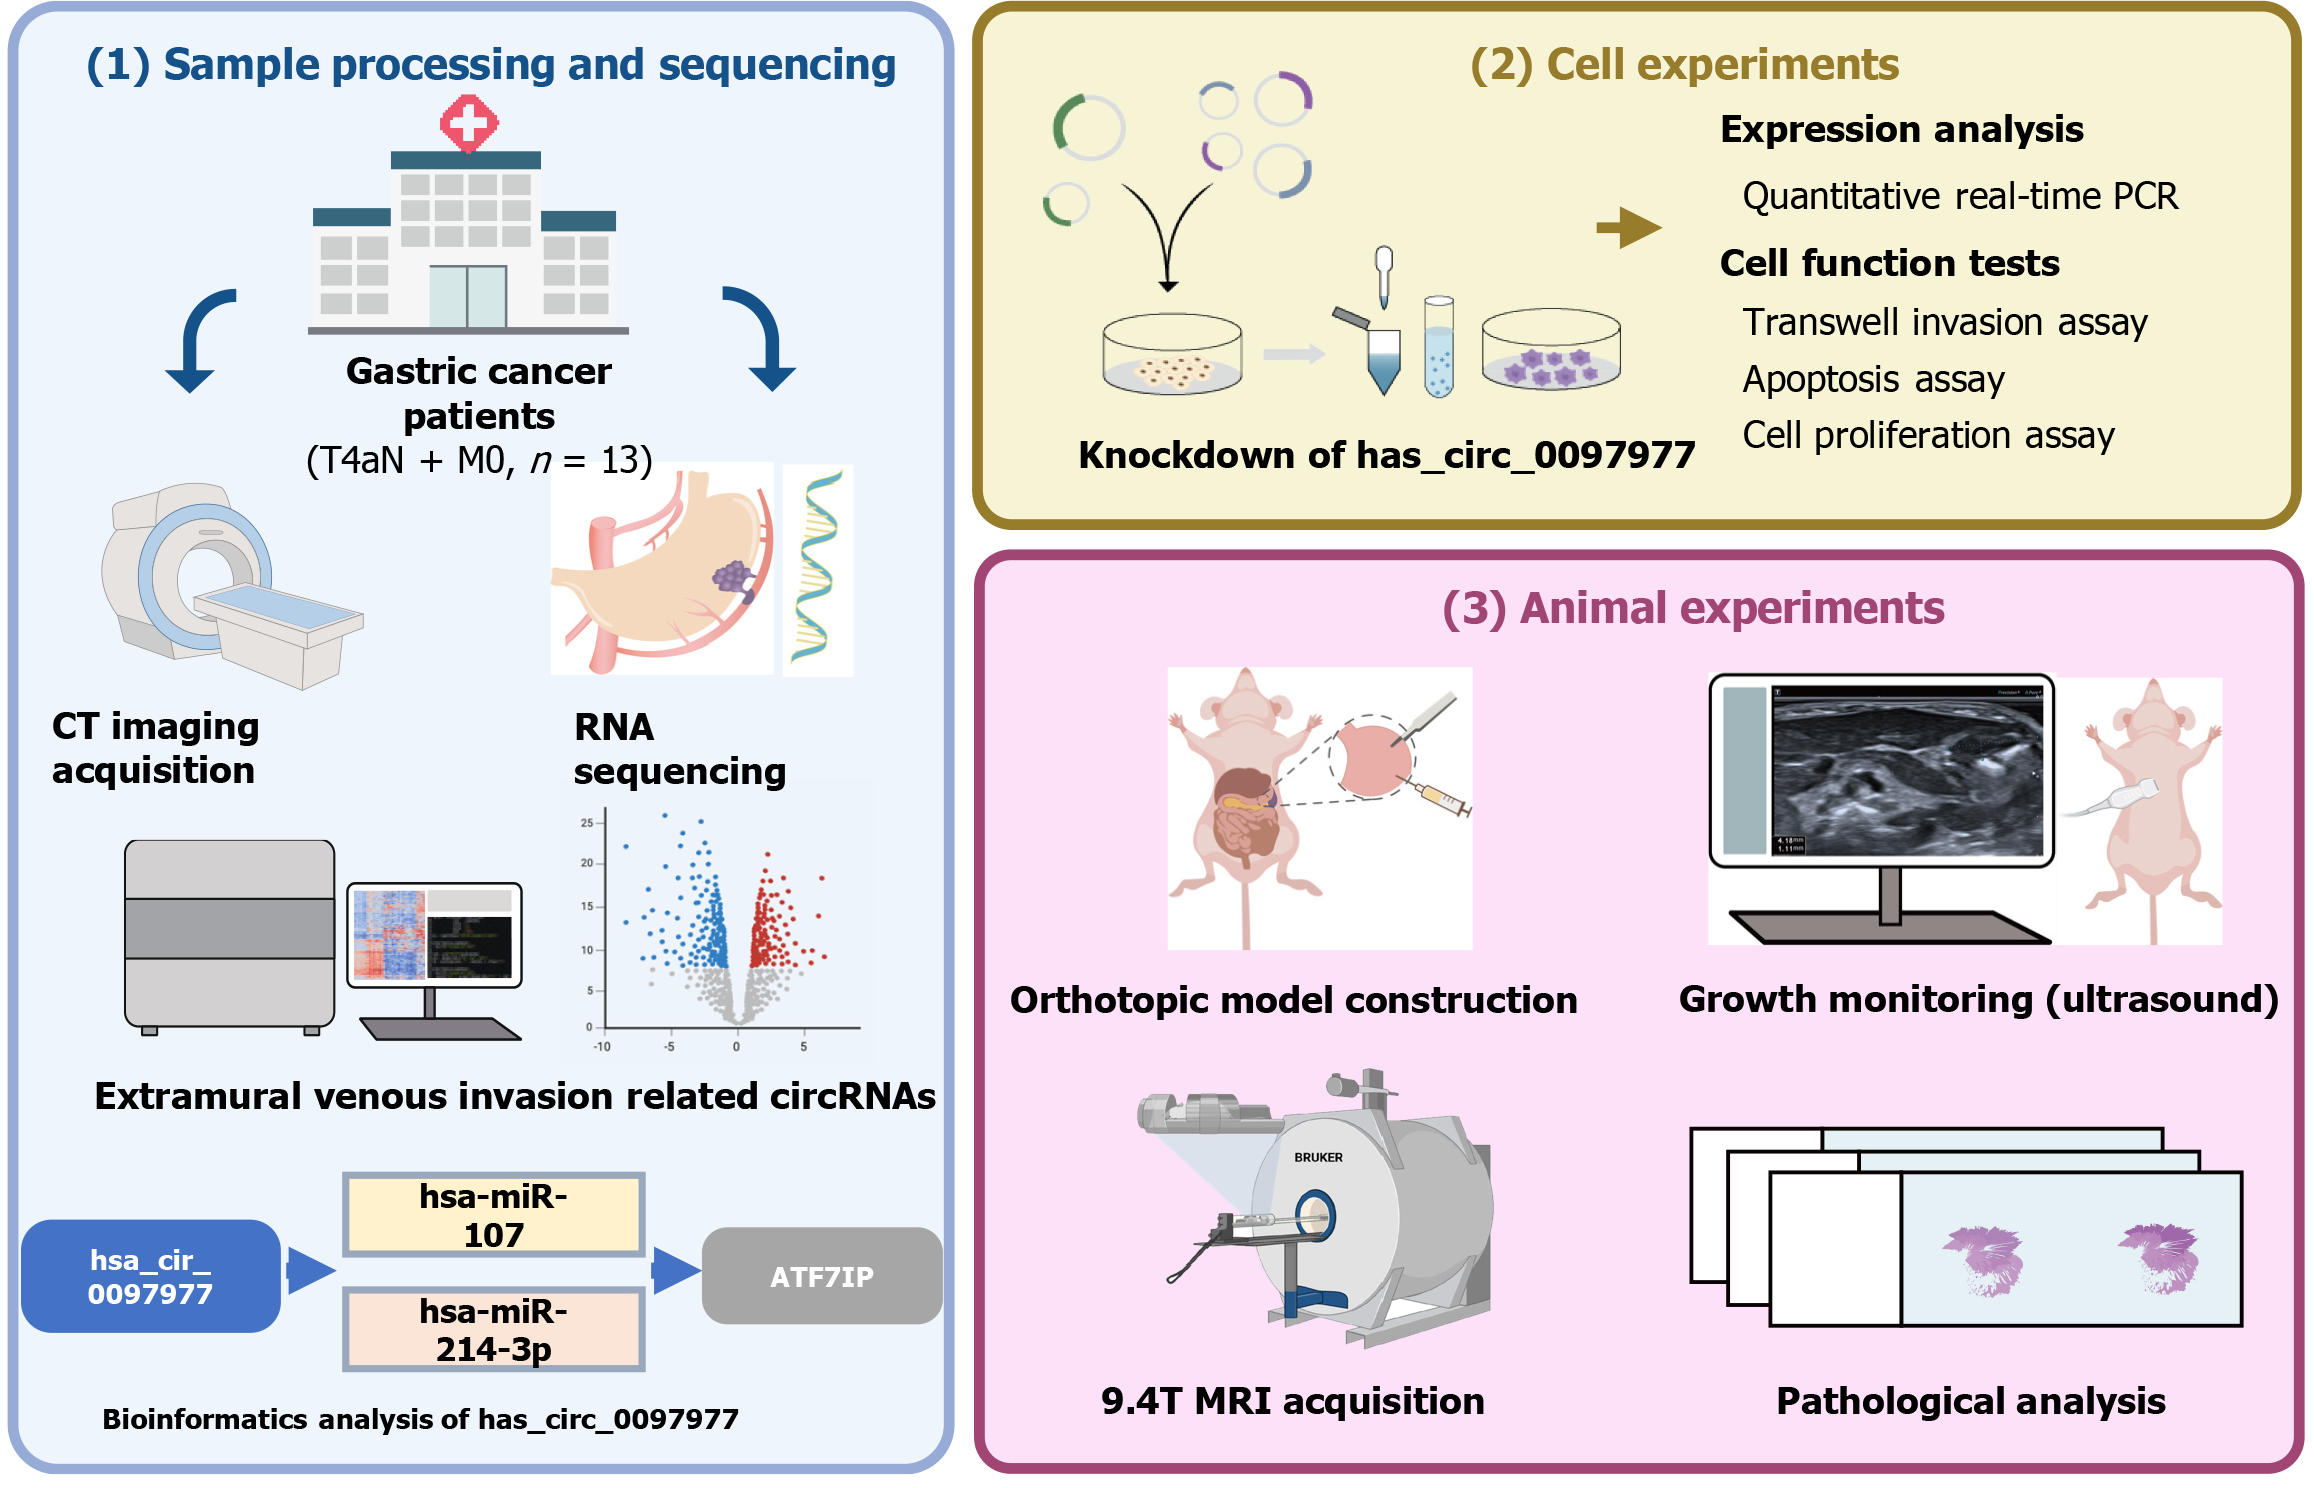
Figure 1 The overall workflow.
CT: Computed tomography; MRI: Magnetic resonance imaging.
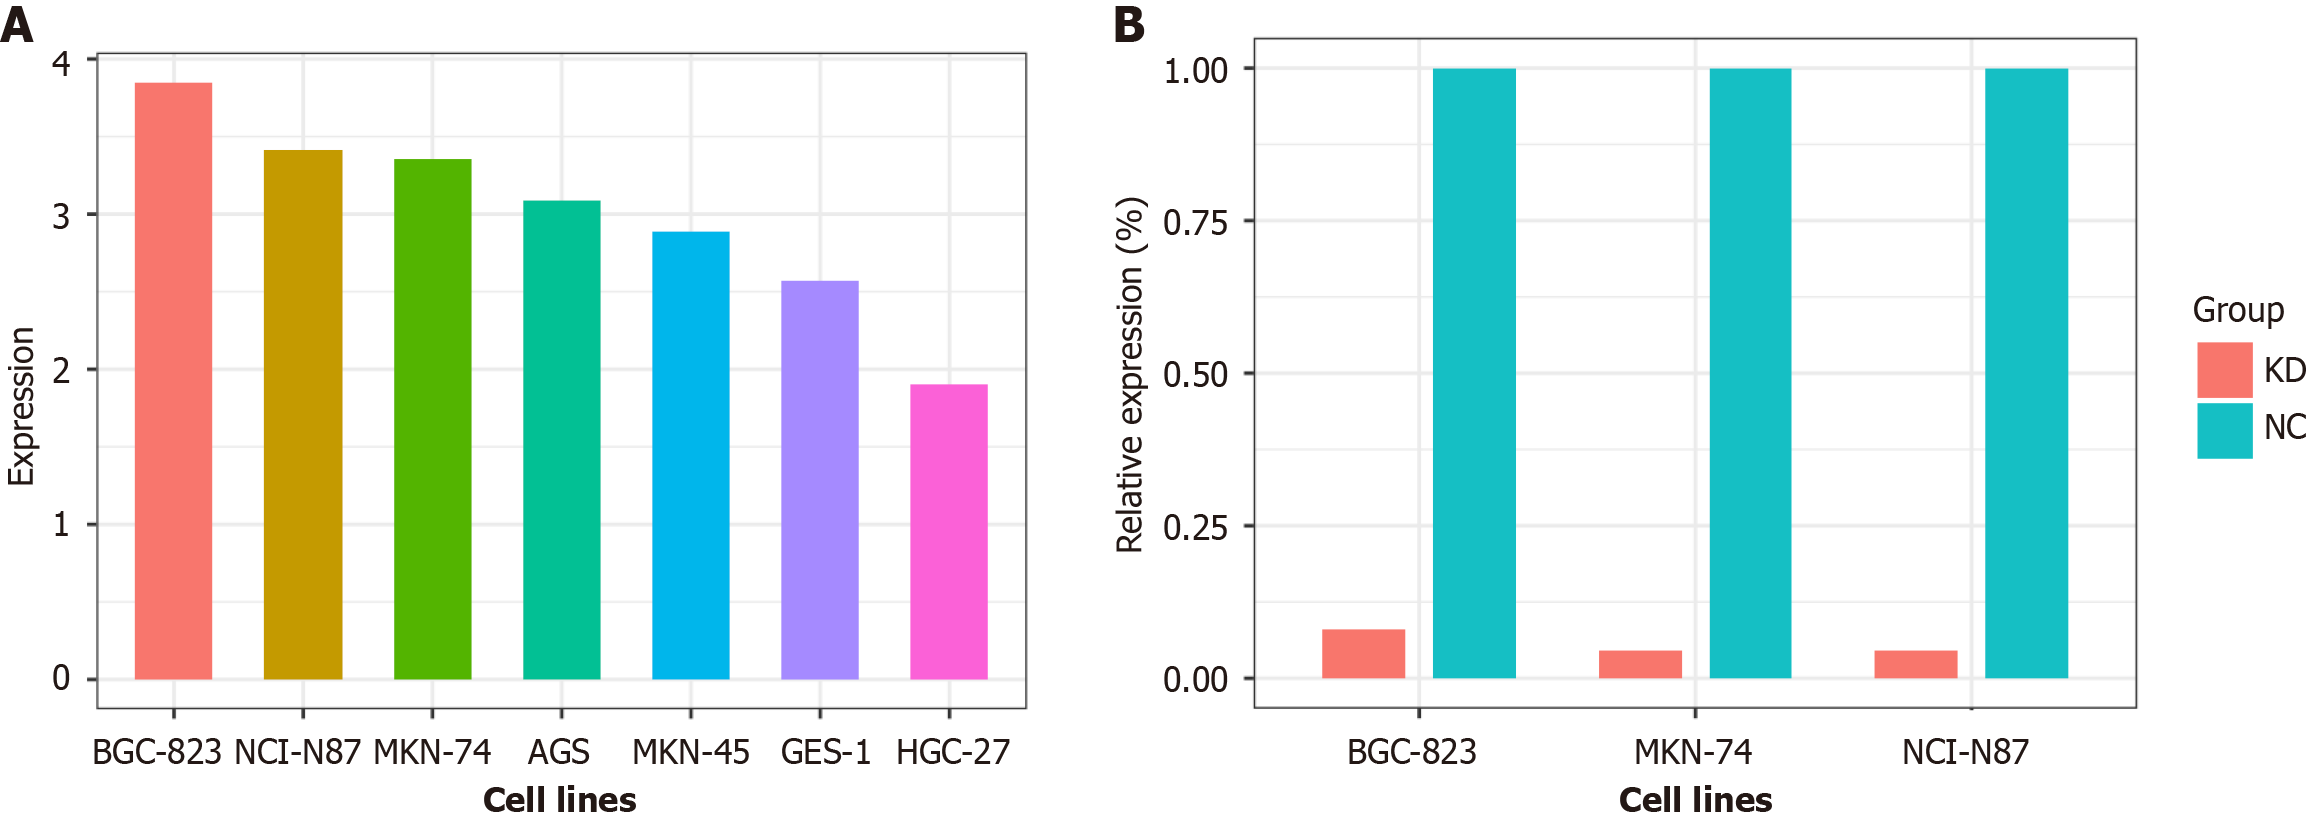
Figure 2 The expression of hsa_circ_0097977 in gastric cancer cell lines.
A: The expression of hsa_circ_0097977 in normal gastric mucosal epithelial cells and six human gastric cancer cell lines. The relative value (RV) of expression of each circRNA was determined by the 2-Δct method using glyceraldehyde-3-phosphate dehydrogenase as a normalizer. The expression value of each circRNA was scaled to a reasonable range with the following equation: Log2 (RV × 10000 + 1); B: The relative expression level of hsa_circ_0097977 in cells after transfection. The relative expression level was calculated as 2-∆∆Ct × 100%. KD: Knockdown; NC: Negative control.
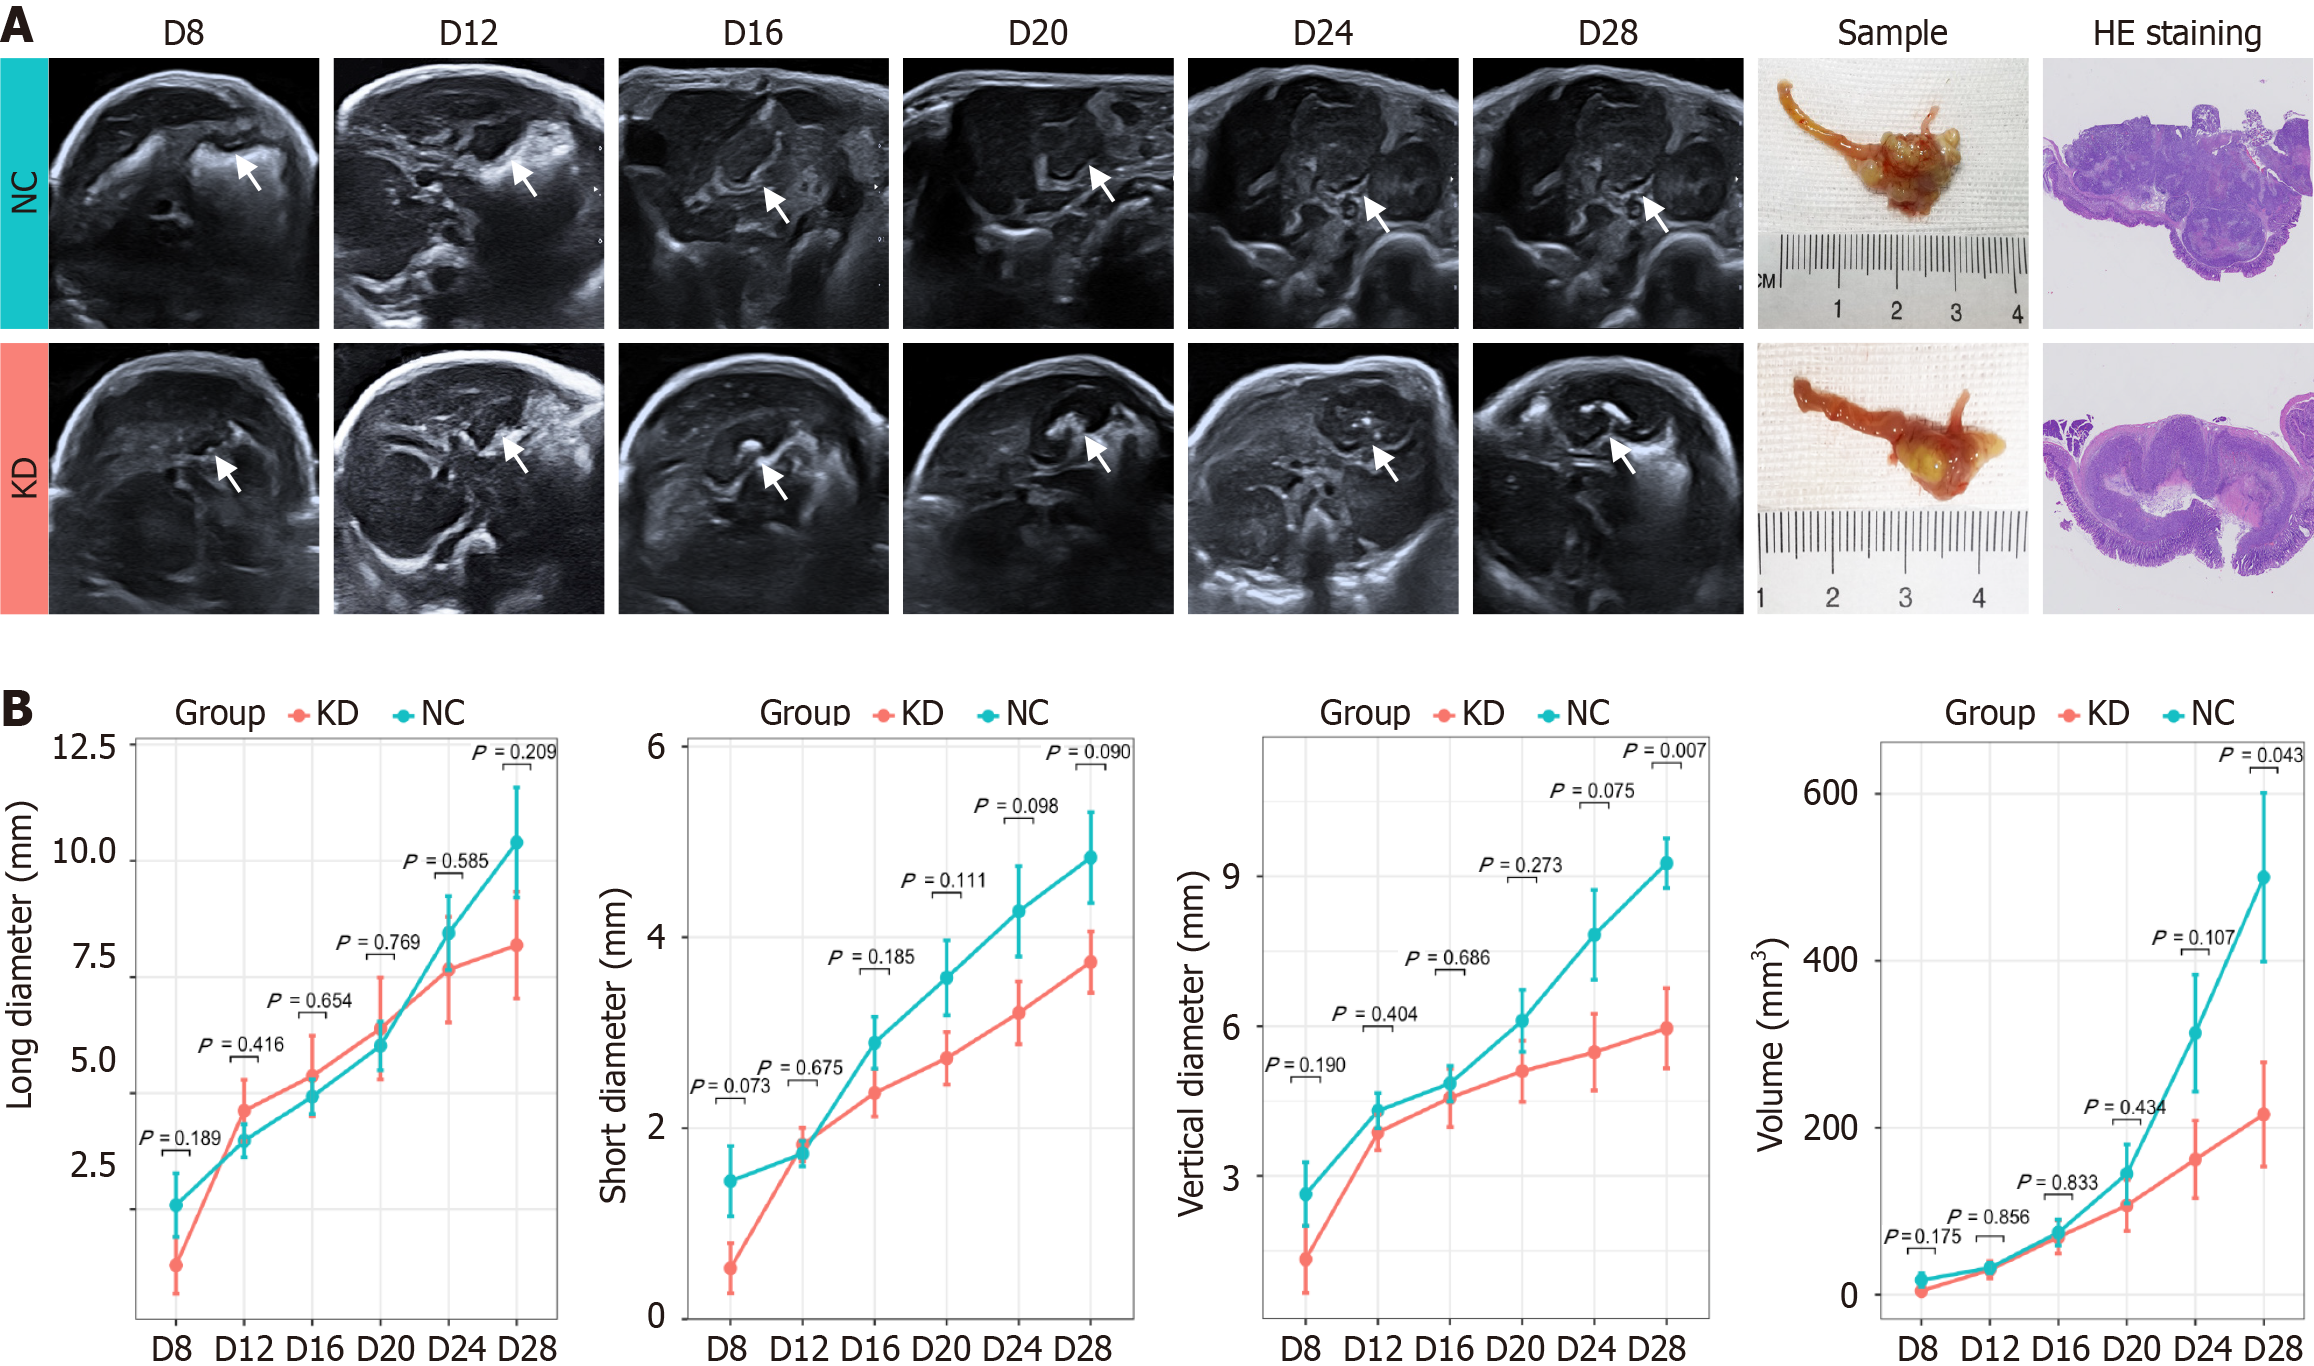
Figure 3 Monitoring of tumor growth in the NCI-N87 orthotopic mouse model.
A: The tumor growth of the orthotopic model, gross pathology and hematoxylin & eosin staining (10 ×) in the negative control group and knockdown group; B: Long diameter, short diameter, vertical diameter and volume change curve. KD: Knockdown; NC: Negative control; HE staining: Hematoxylin & eosin staining.
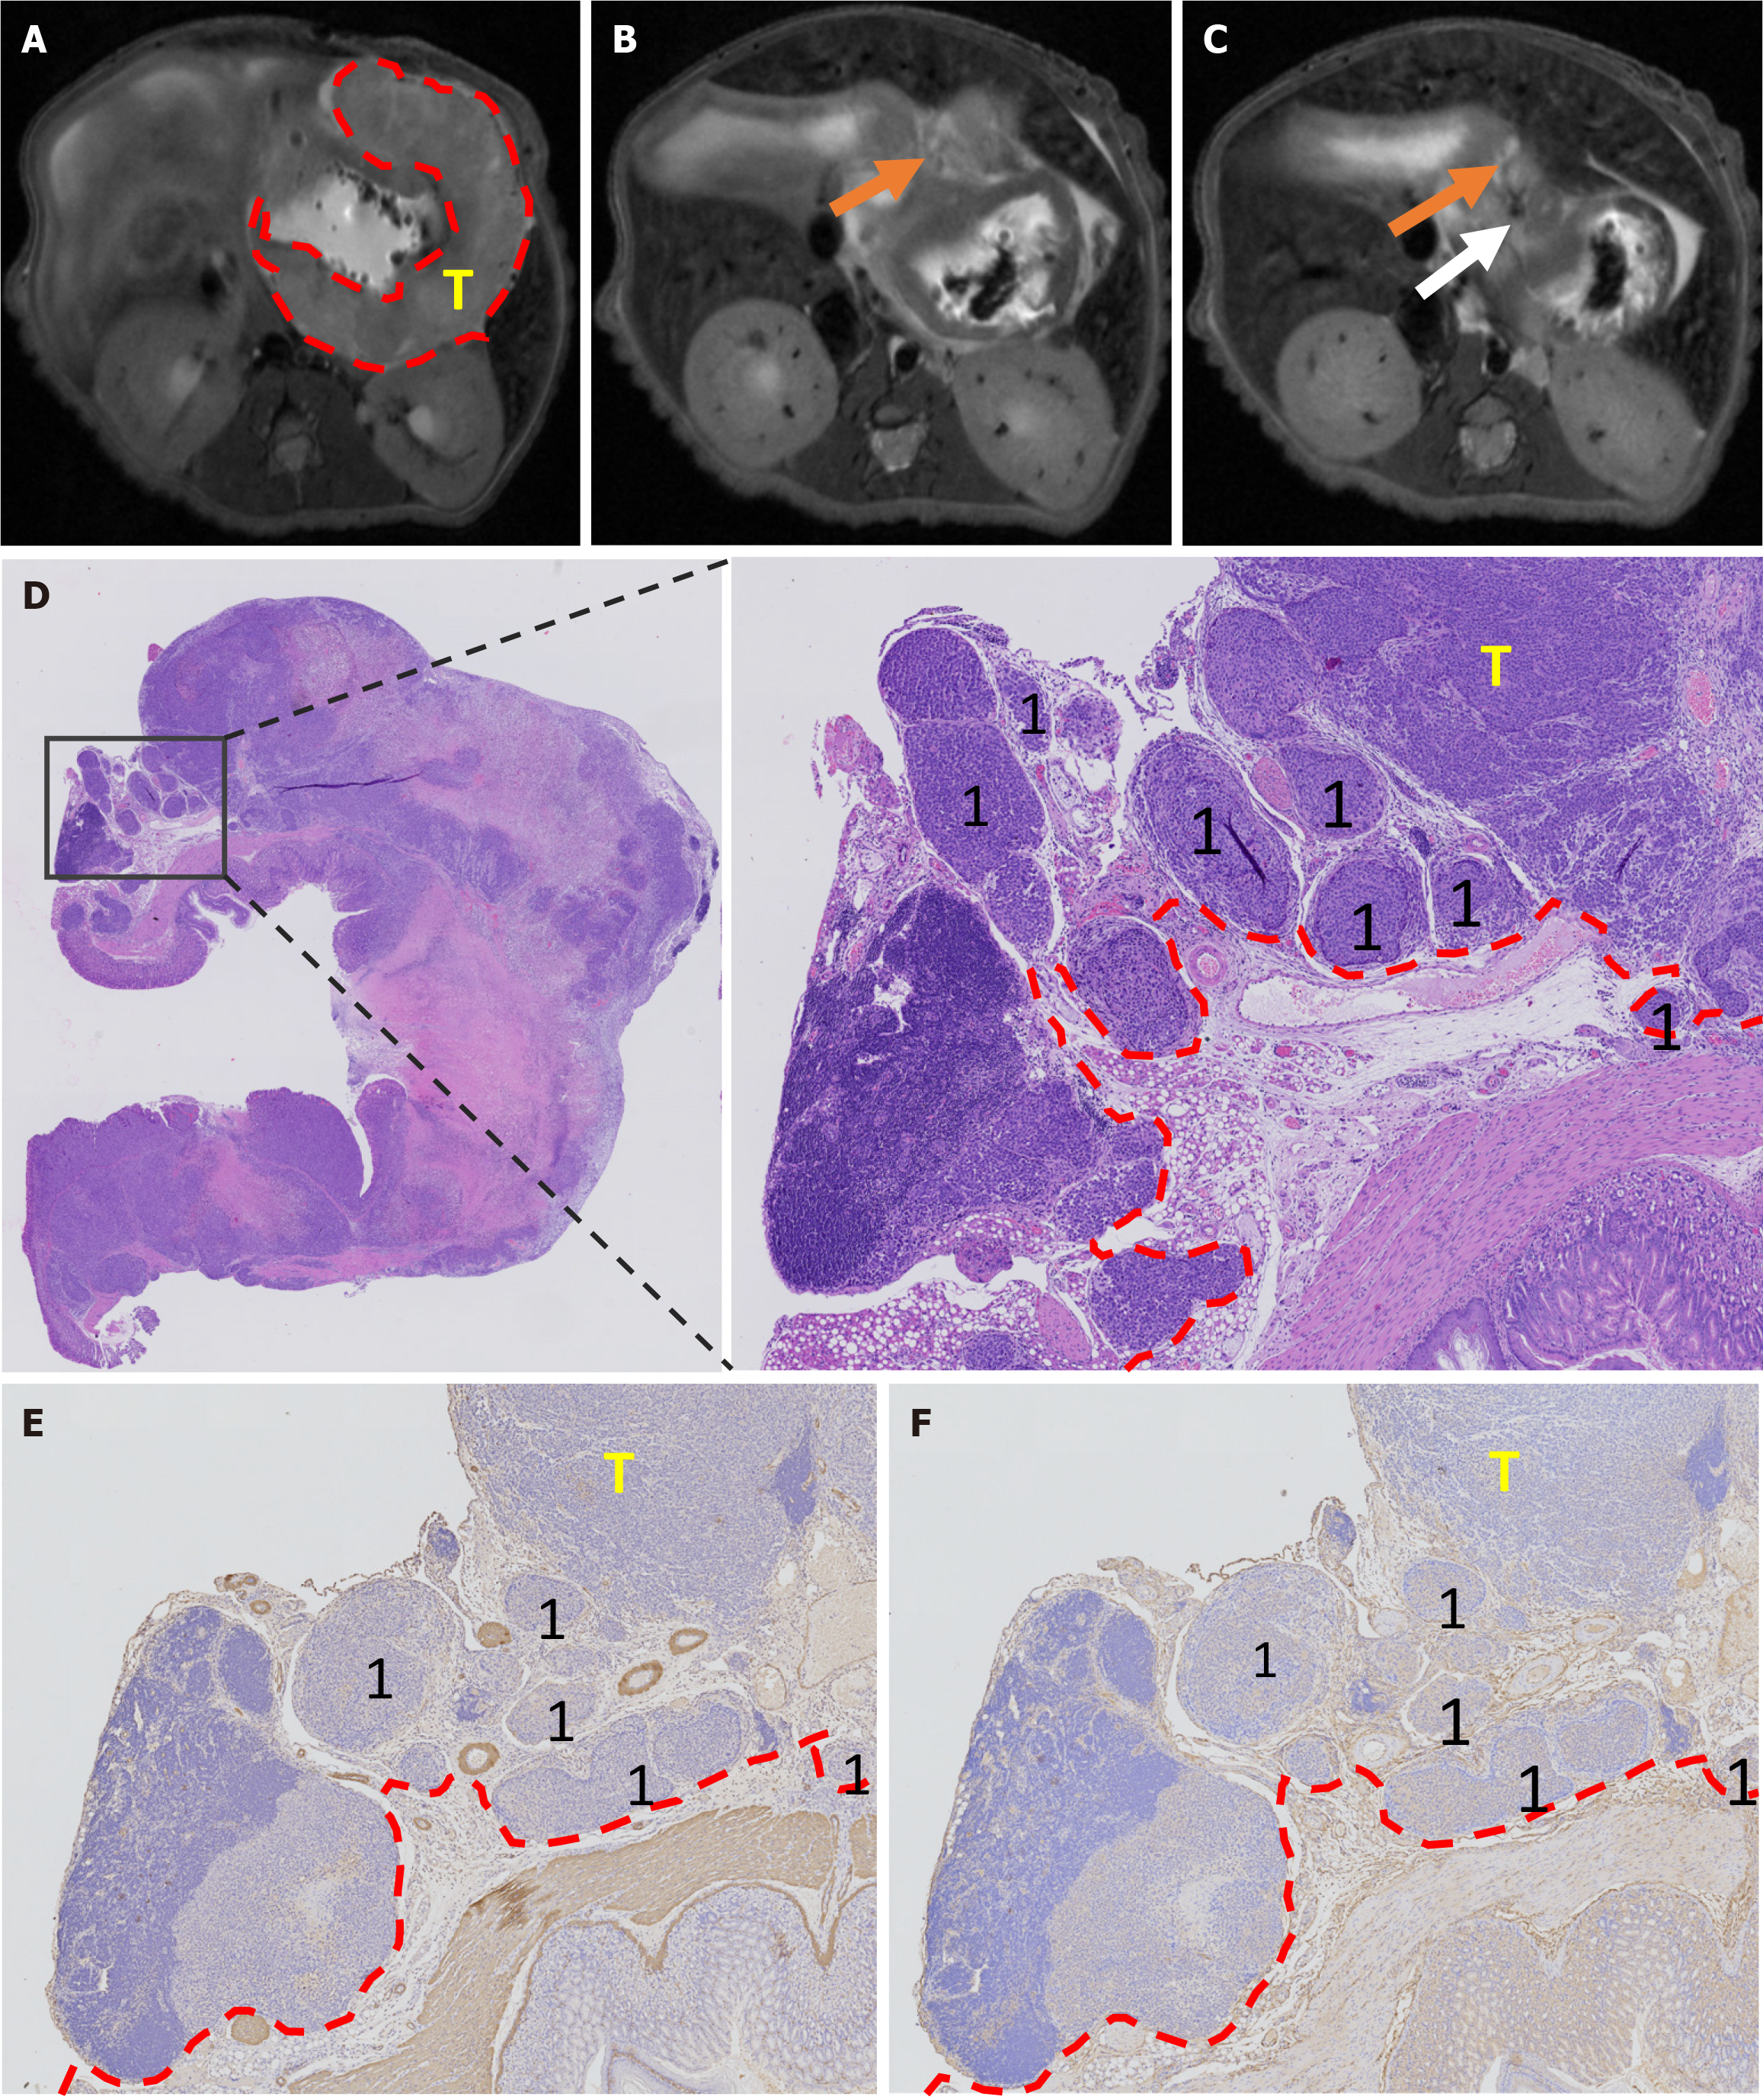
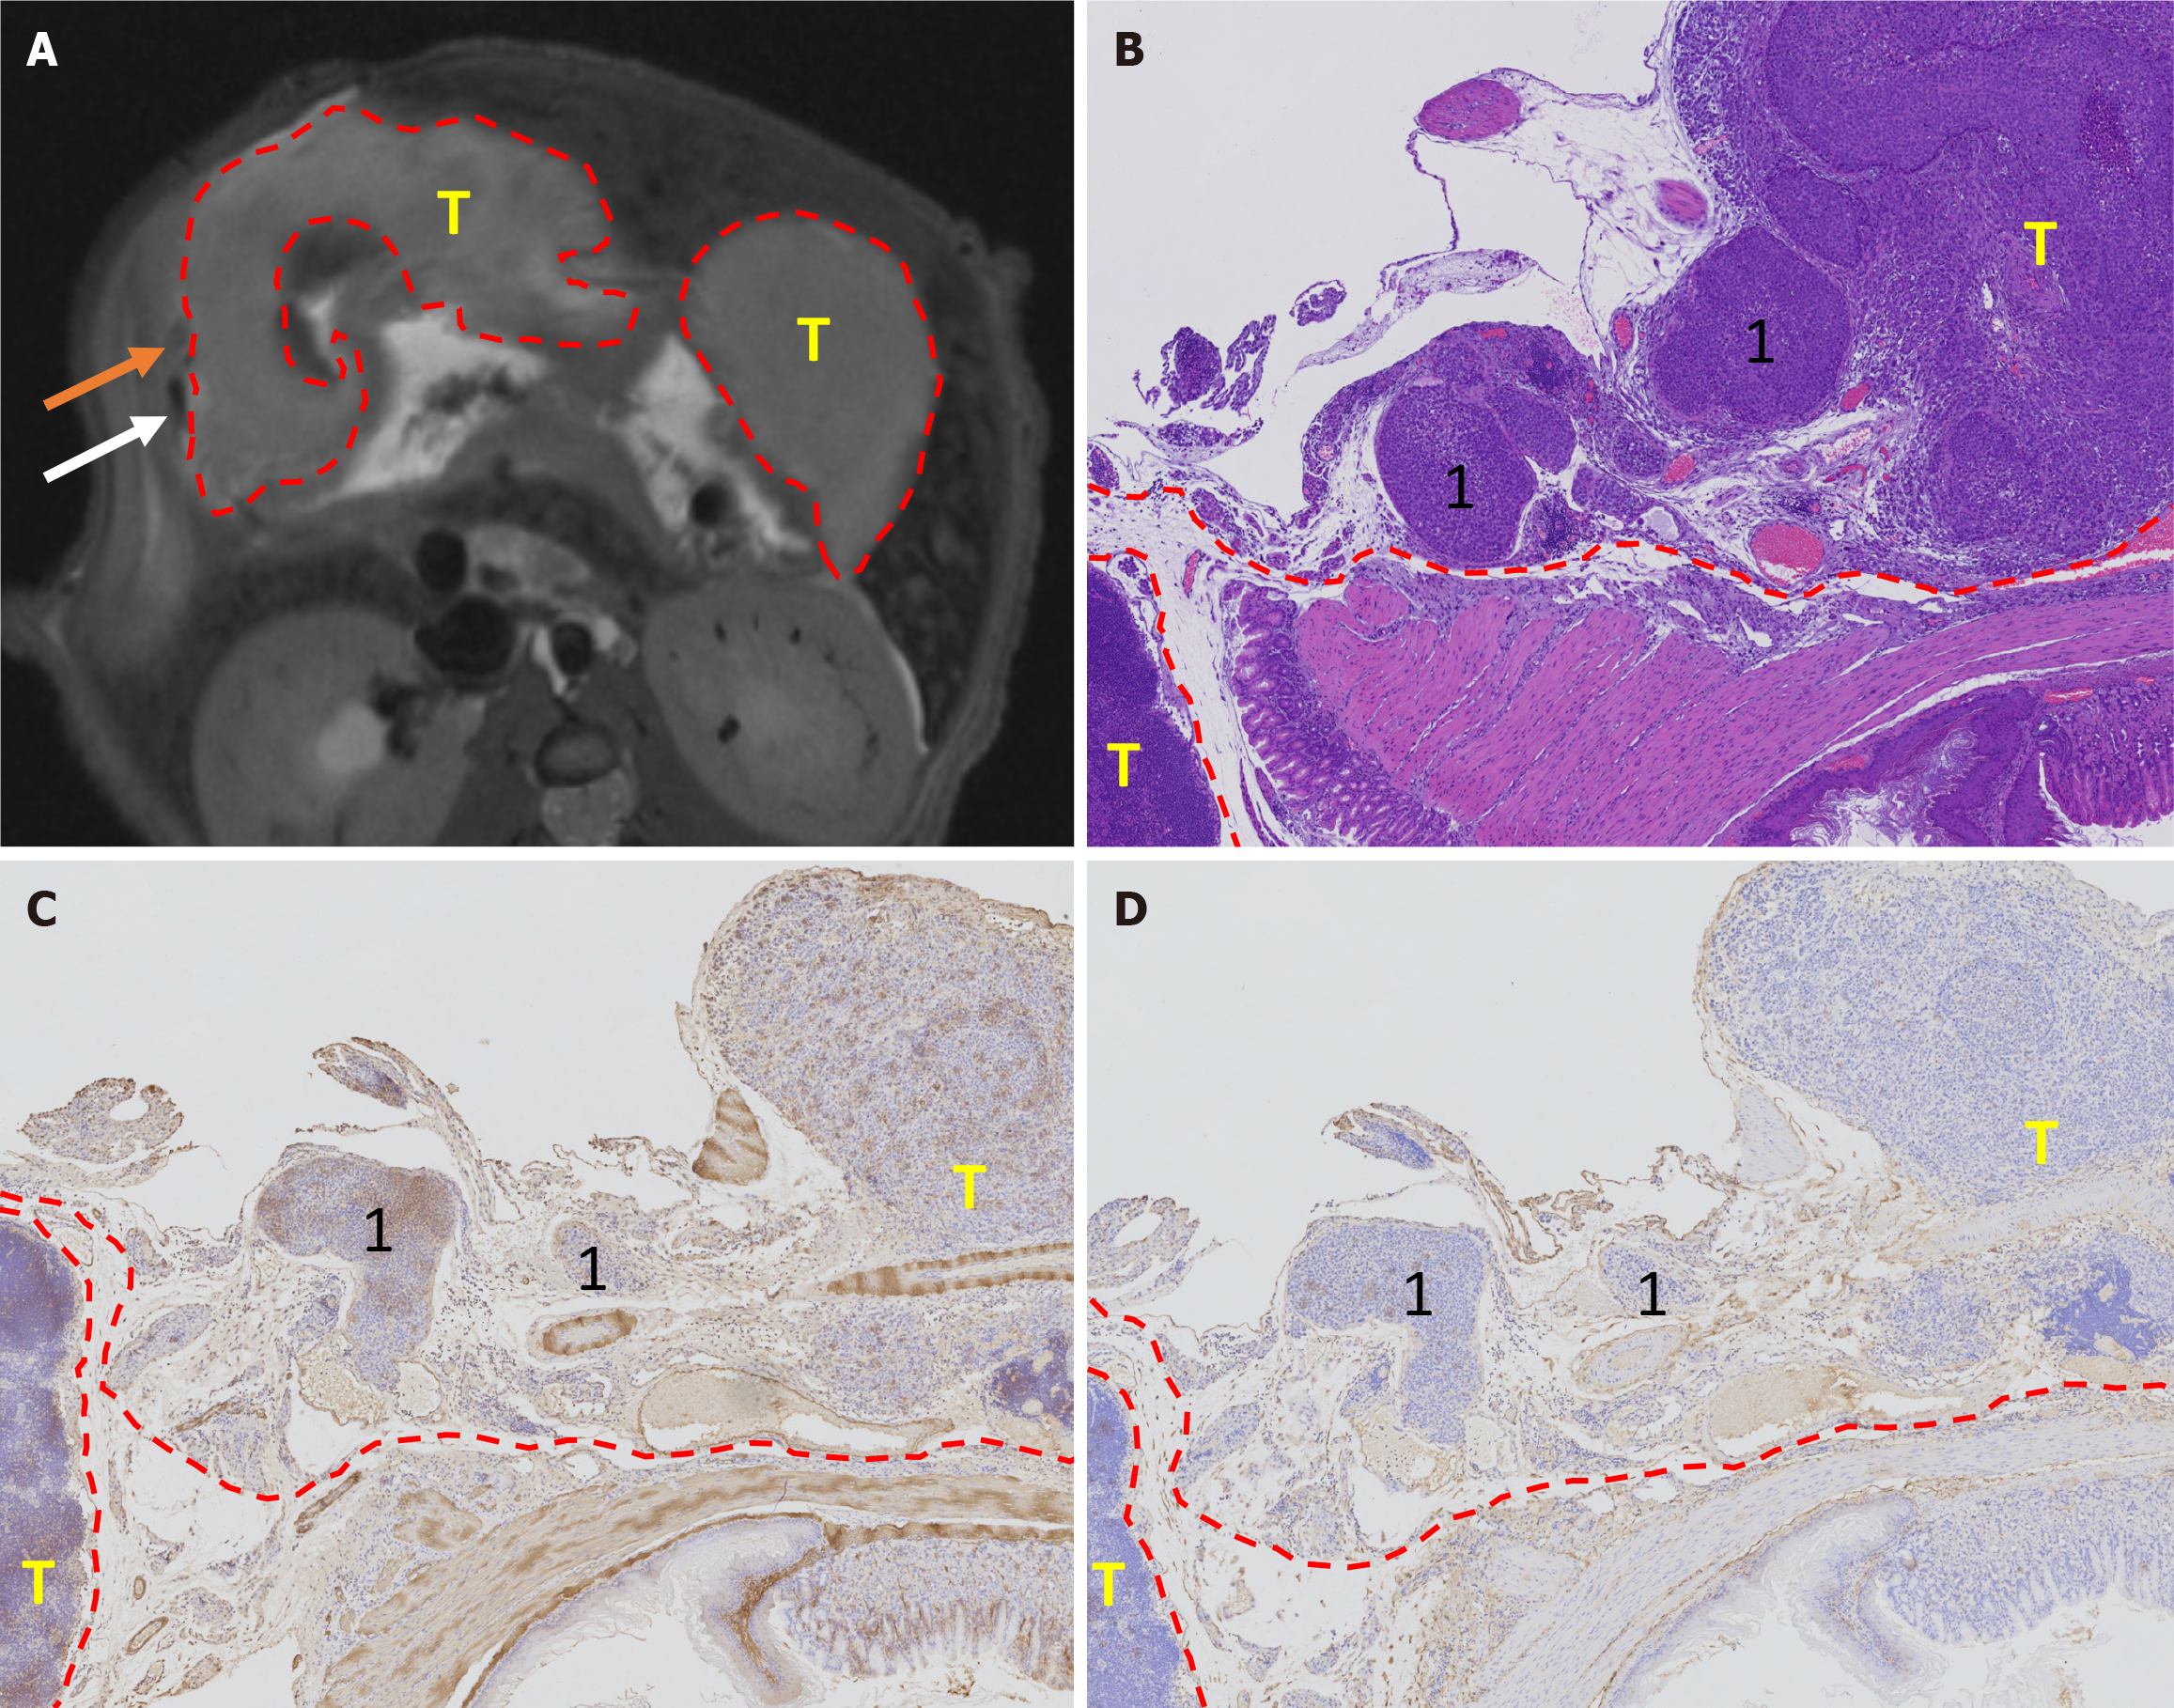
Figure 4 Extramural venous invasion in gastric cancer orthotopic mouse model perpendicular to the plane of magnetic resonance imaging axial image.
A: T2-weighted fat-suppressed images, gastric cancer is manifested as a significant thickening of the gastric wall with heterogeneous signal intensity (within the red circle); B: Extramural venous invasion-detected detected on magnetic resonance imaging (mrEMVI) is visible as a tubular structure with a slightly high signal (orange arrow); C: This tubular structure can be observed in continuous layers and is connected to both the tumor and nearby blood vessels (white arrow); D: Hematoxylin and eosin staining of tumor (10 × and 200 ×); E: Alpha-smooth muscle actin staining (200 ×); F: CD34 staining (200 ×). 1Extramural venous invasion; T: Tumor; red dashed line: Tumor boundary.
Figure 5 Extramural venous invasion in a gastric cancer orthotopic mouse model visualized parallel to the plane of magnetic resonance imaging axial imaging.
A: T2-weighted fat-suppressed images showing gastric cancer, characterized by a thickened gastric wall with homogeneous signal intensity (within the red circle). Extramural venous invasion appears as a tubular structure with slightly high signal (orange arrow), connected to the tumor and adjacent vessels (white arrow); B: Hematoxylin & eosin staining of the tumor (200 ×); C: Smooth muscle actin staining (200 ×); D: CD34 staining (200 ×). 1Extramural venous invasion; T: Tumor; red dashed line: Tumor boundary.
Figure 6 Heatmap features in the knockdown and negative control groups.
pEMVI: Pathological extramural venous invasion; mrEMVI: Magnetic resonance imaging-detected extramural venous invasion; KD: Knockdown; NC: Negative control.
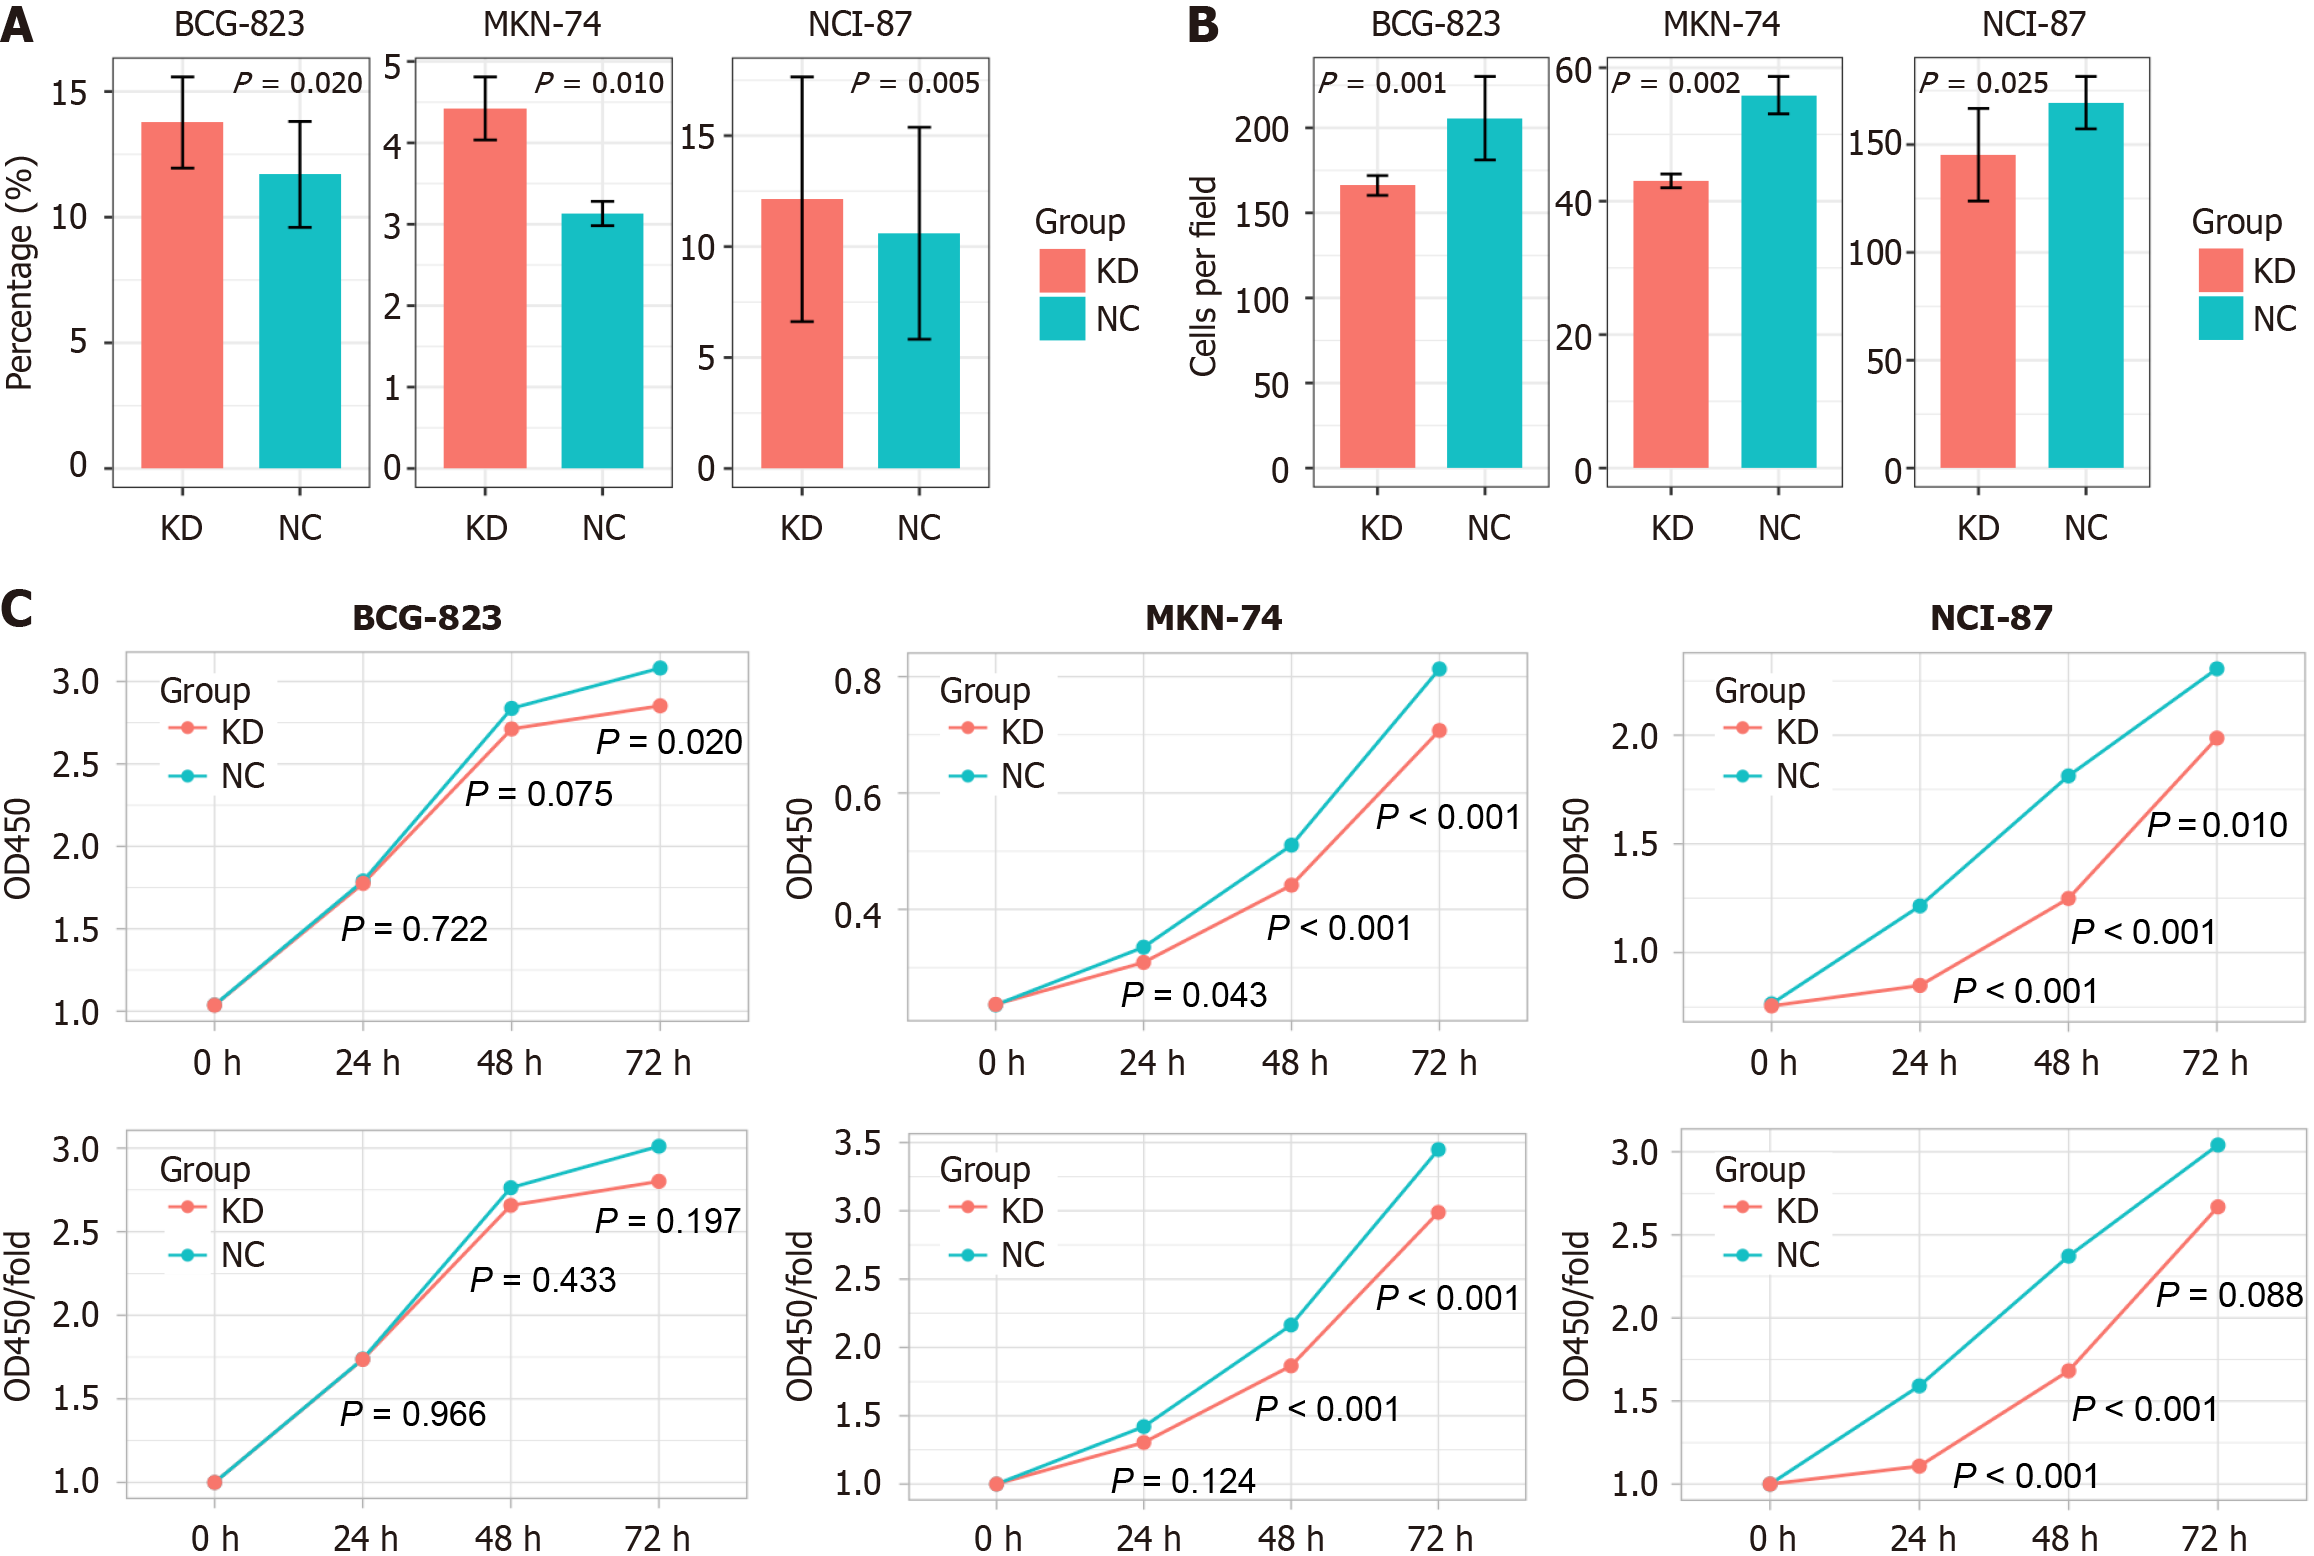
Figure 7 Results of the cell function test.
A: Cell apoptosis of BGC-823, MKN-74 and NCI-N87 cells transfected with negative control or knockdown lentivirus; B: Cell invasion of BGC-823, MKN-74 and NCI-N87 cells transfected with negative control or knockdown lentivirus; C: Cell proliferation of BGC-823, MKN-74 and NCI-N87 cells transfected with negative control or knockdown lentivirus. KD: Knockdown; NC: Negative control.
- Citation: Feng CZ, Gou XY, Liu YQ, Xin YW, Zhang YL, Zhao HM, Wei SC, Hong N, Wang Y, Cheng J. Extramural venous invasion in gastric cancer: 9.4T magnetic resonance imaging assessment and circular RNA functional analysis. World J Gastroenterol 2025; 31(14): 99897
- URL: https://www.wjgnet.com/1007-9327/full/v31/i14/99897.htm
- DOI: https://dx.doi.org/10.3748/wjg.v31.i14.99897


