Copyright
©The Author(s) 2025.
World J Gastroenterol. Apr 14, 2025; 31(14): 104588
Published online Apr 14, 2025. doi: 10.3748/wjg.v31.i14.104588
Published online Apr 14, 2025. doi: 10.3748/wjg.v31.i14.104588
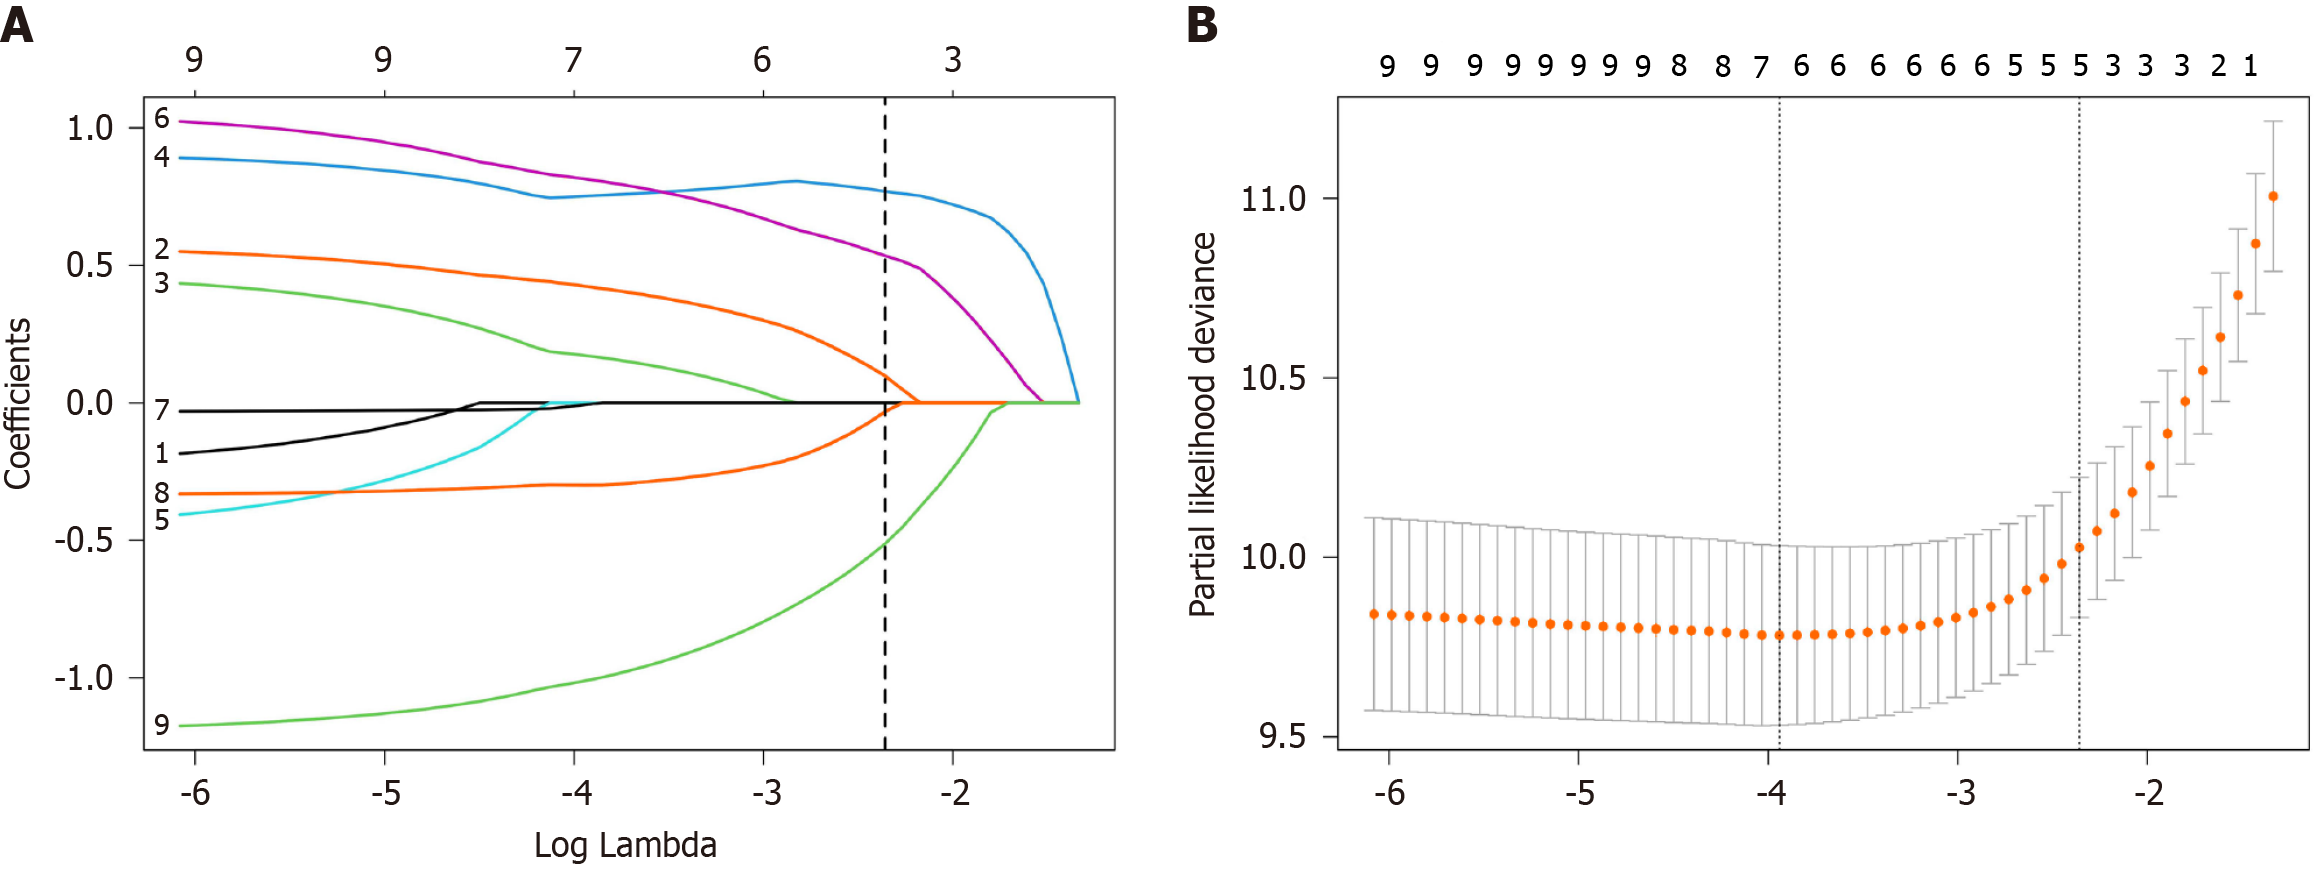
Figure 1 Feature selection based on least absolute shrinkage and selection operator regression.
A: LASSO coefficient profile; B: The optimal penalty parameter (λ) in the LASSO model determined by 10-fold cross-validation and the minimum criteria in the training set.
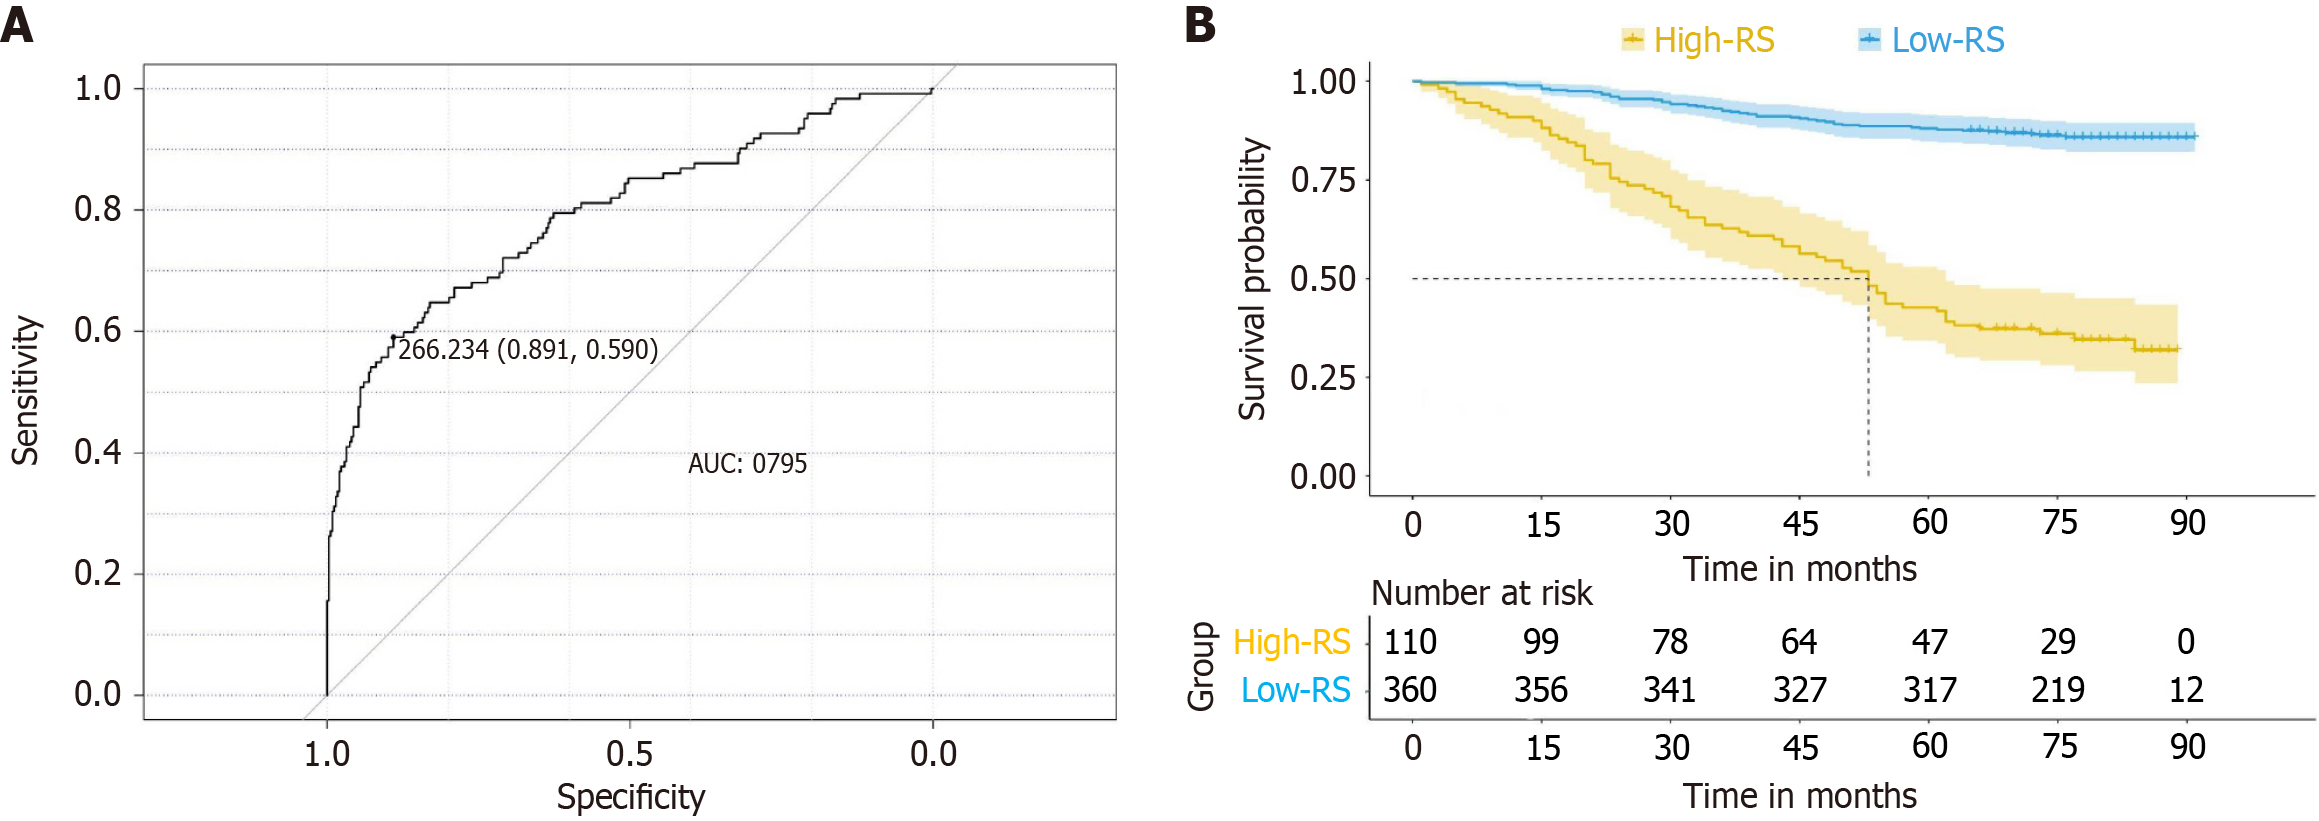
Figure 2 Risk score analysis.
A: Receiver operating characteristic curve of the risk score; B: Survival analysis of the risk score.
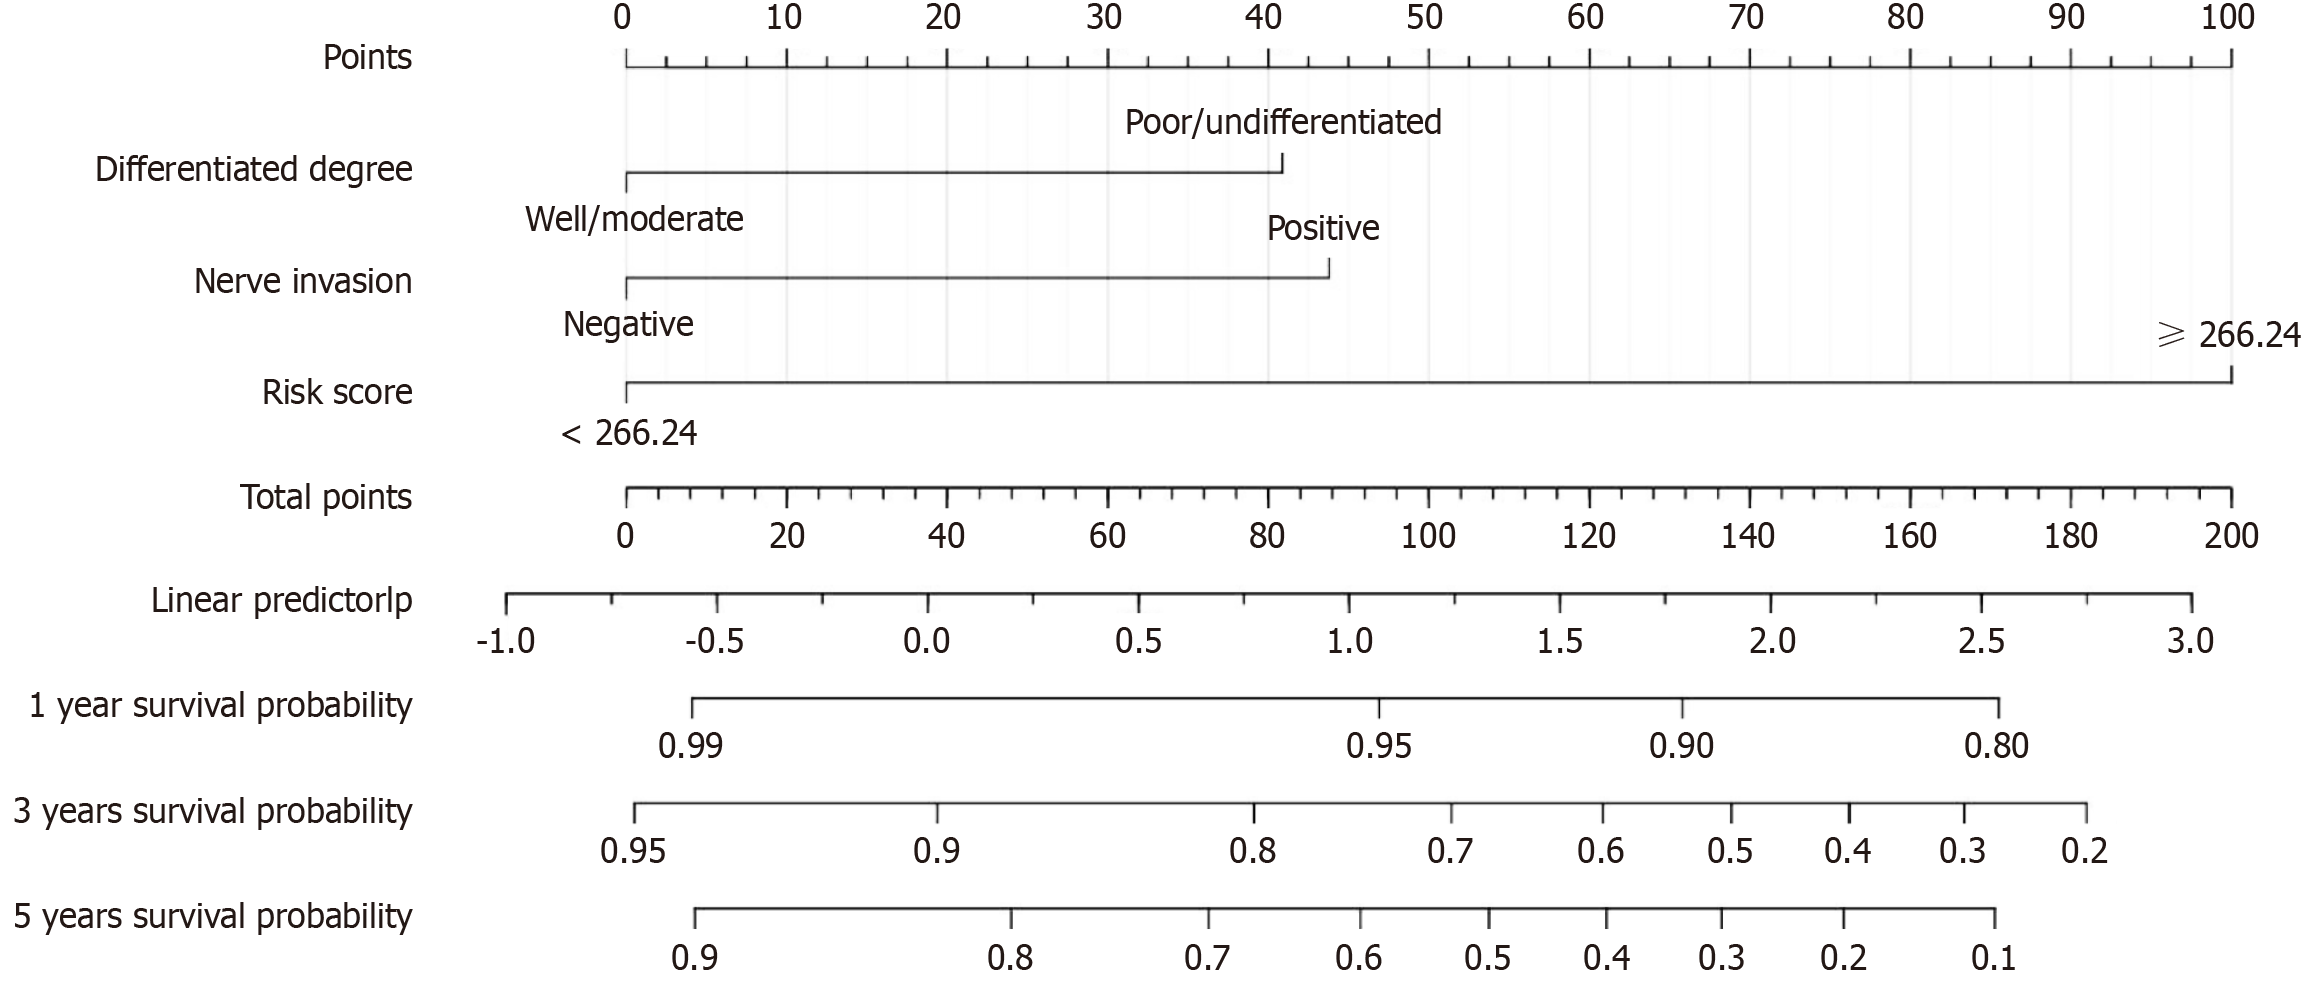
Figure 3 Survival nomogram for predicting the 1-year, 3-year, and 5-year survival rates of colorectal cancer patients.
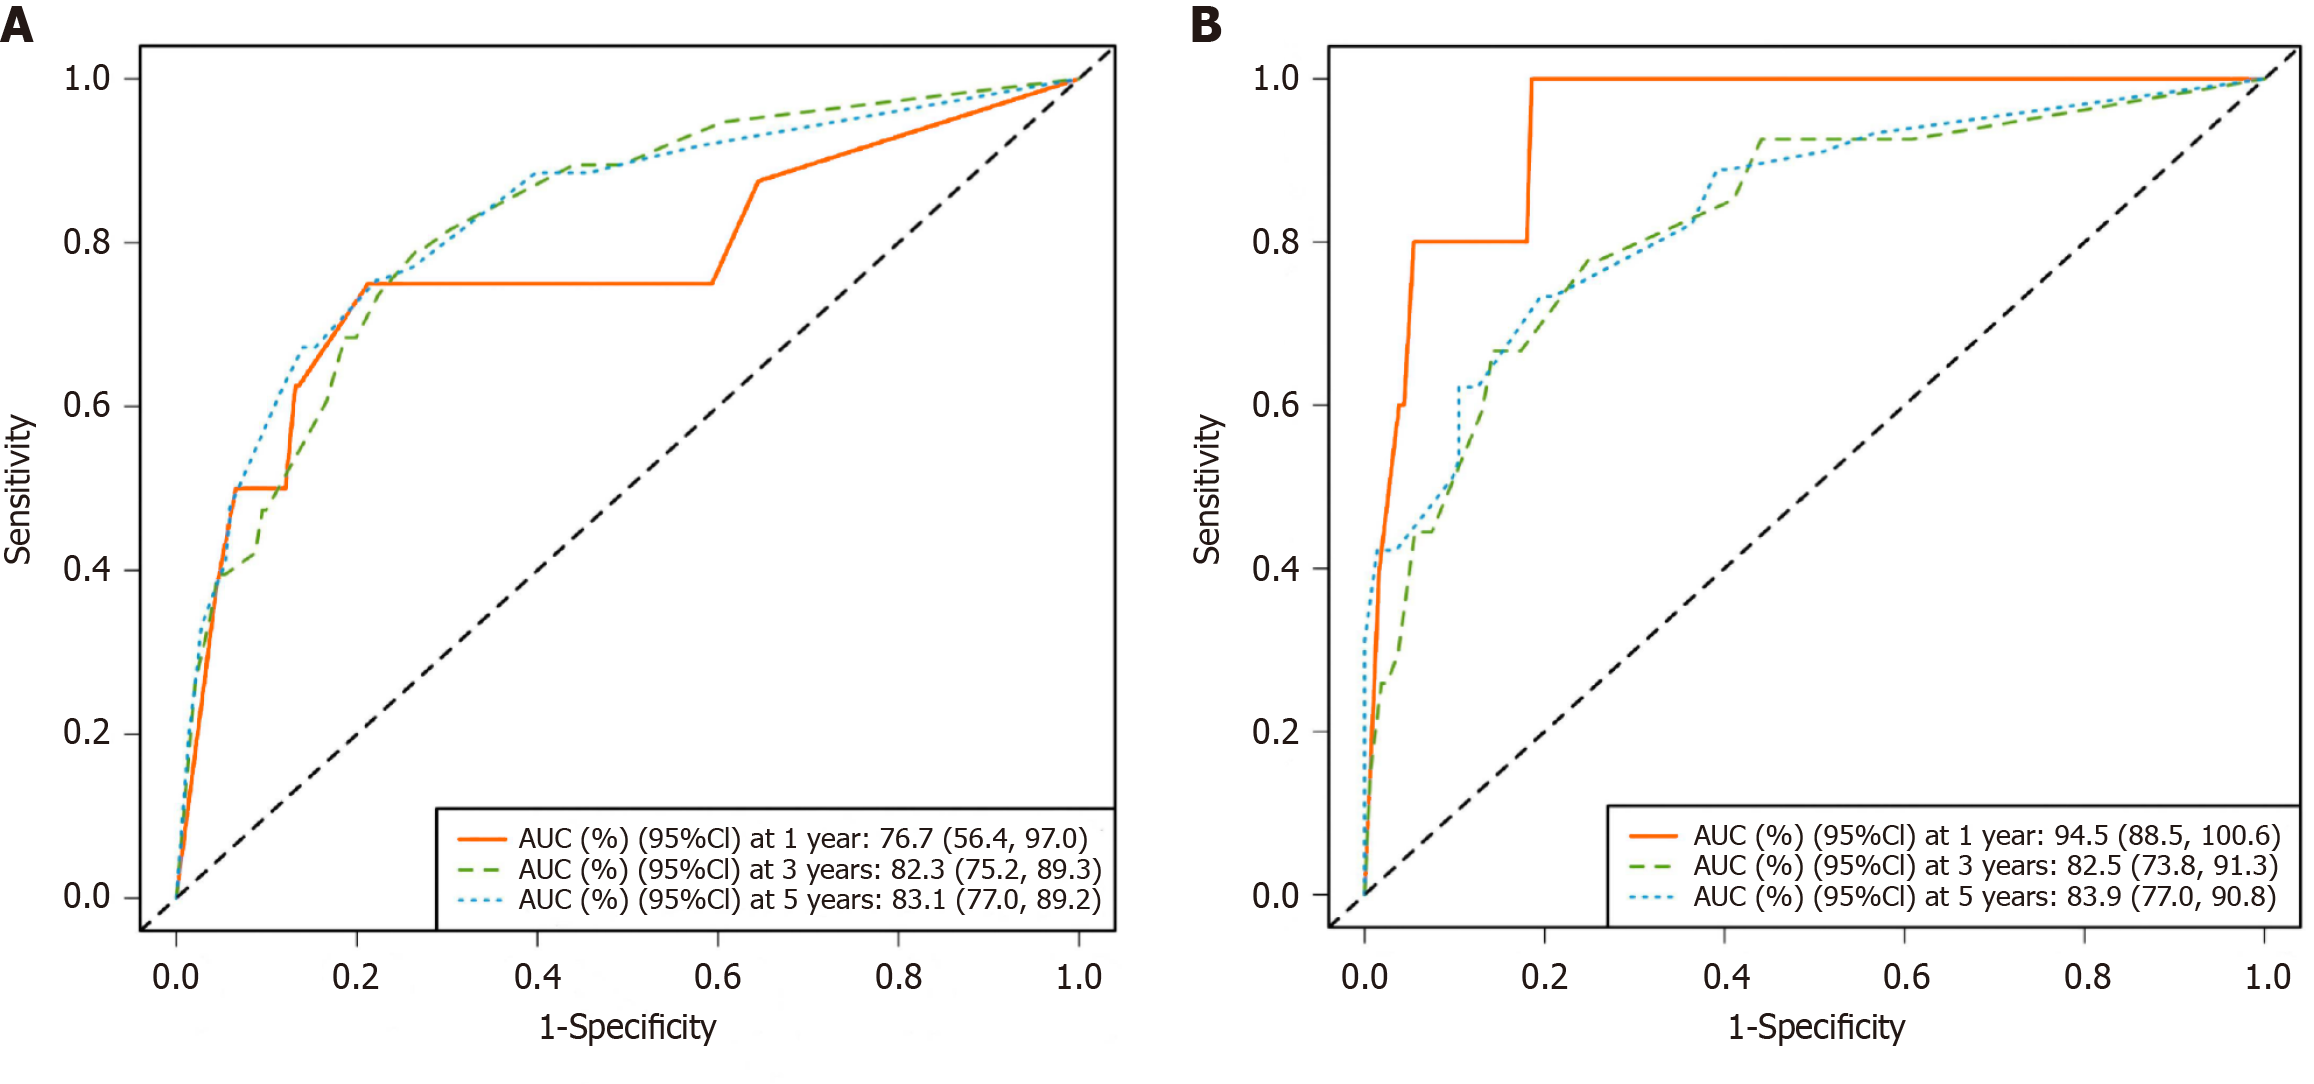
Figure 4 The area under the curves for 1-, 3-, and 5-year overall survival.
A: Training cohort; B: Validation cohort. AUC: Area under the curves.
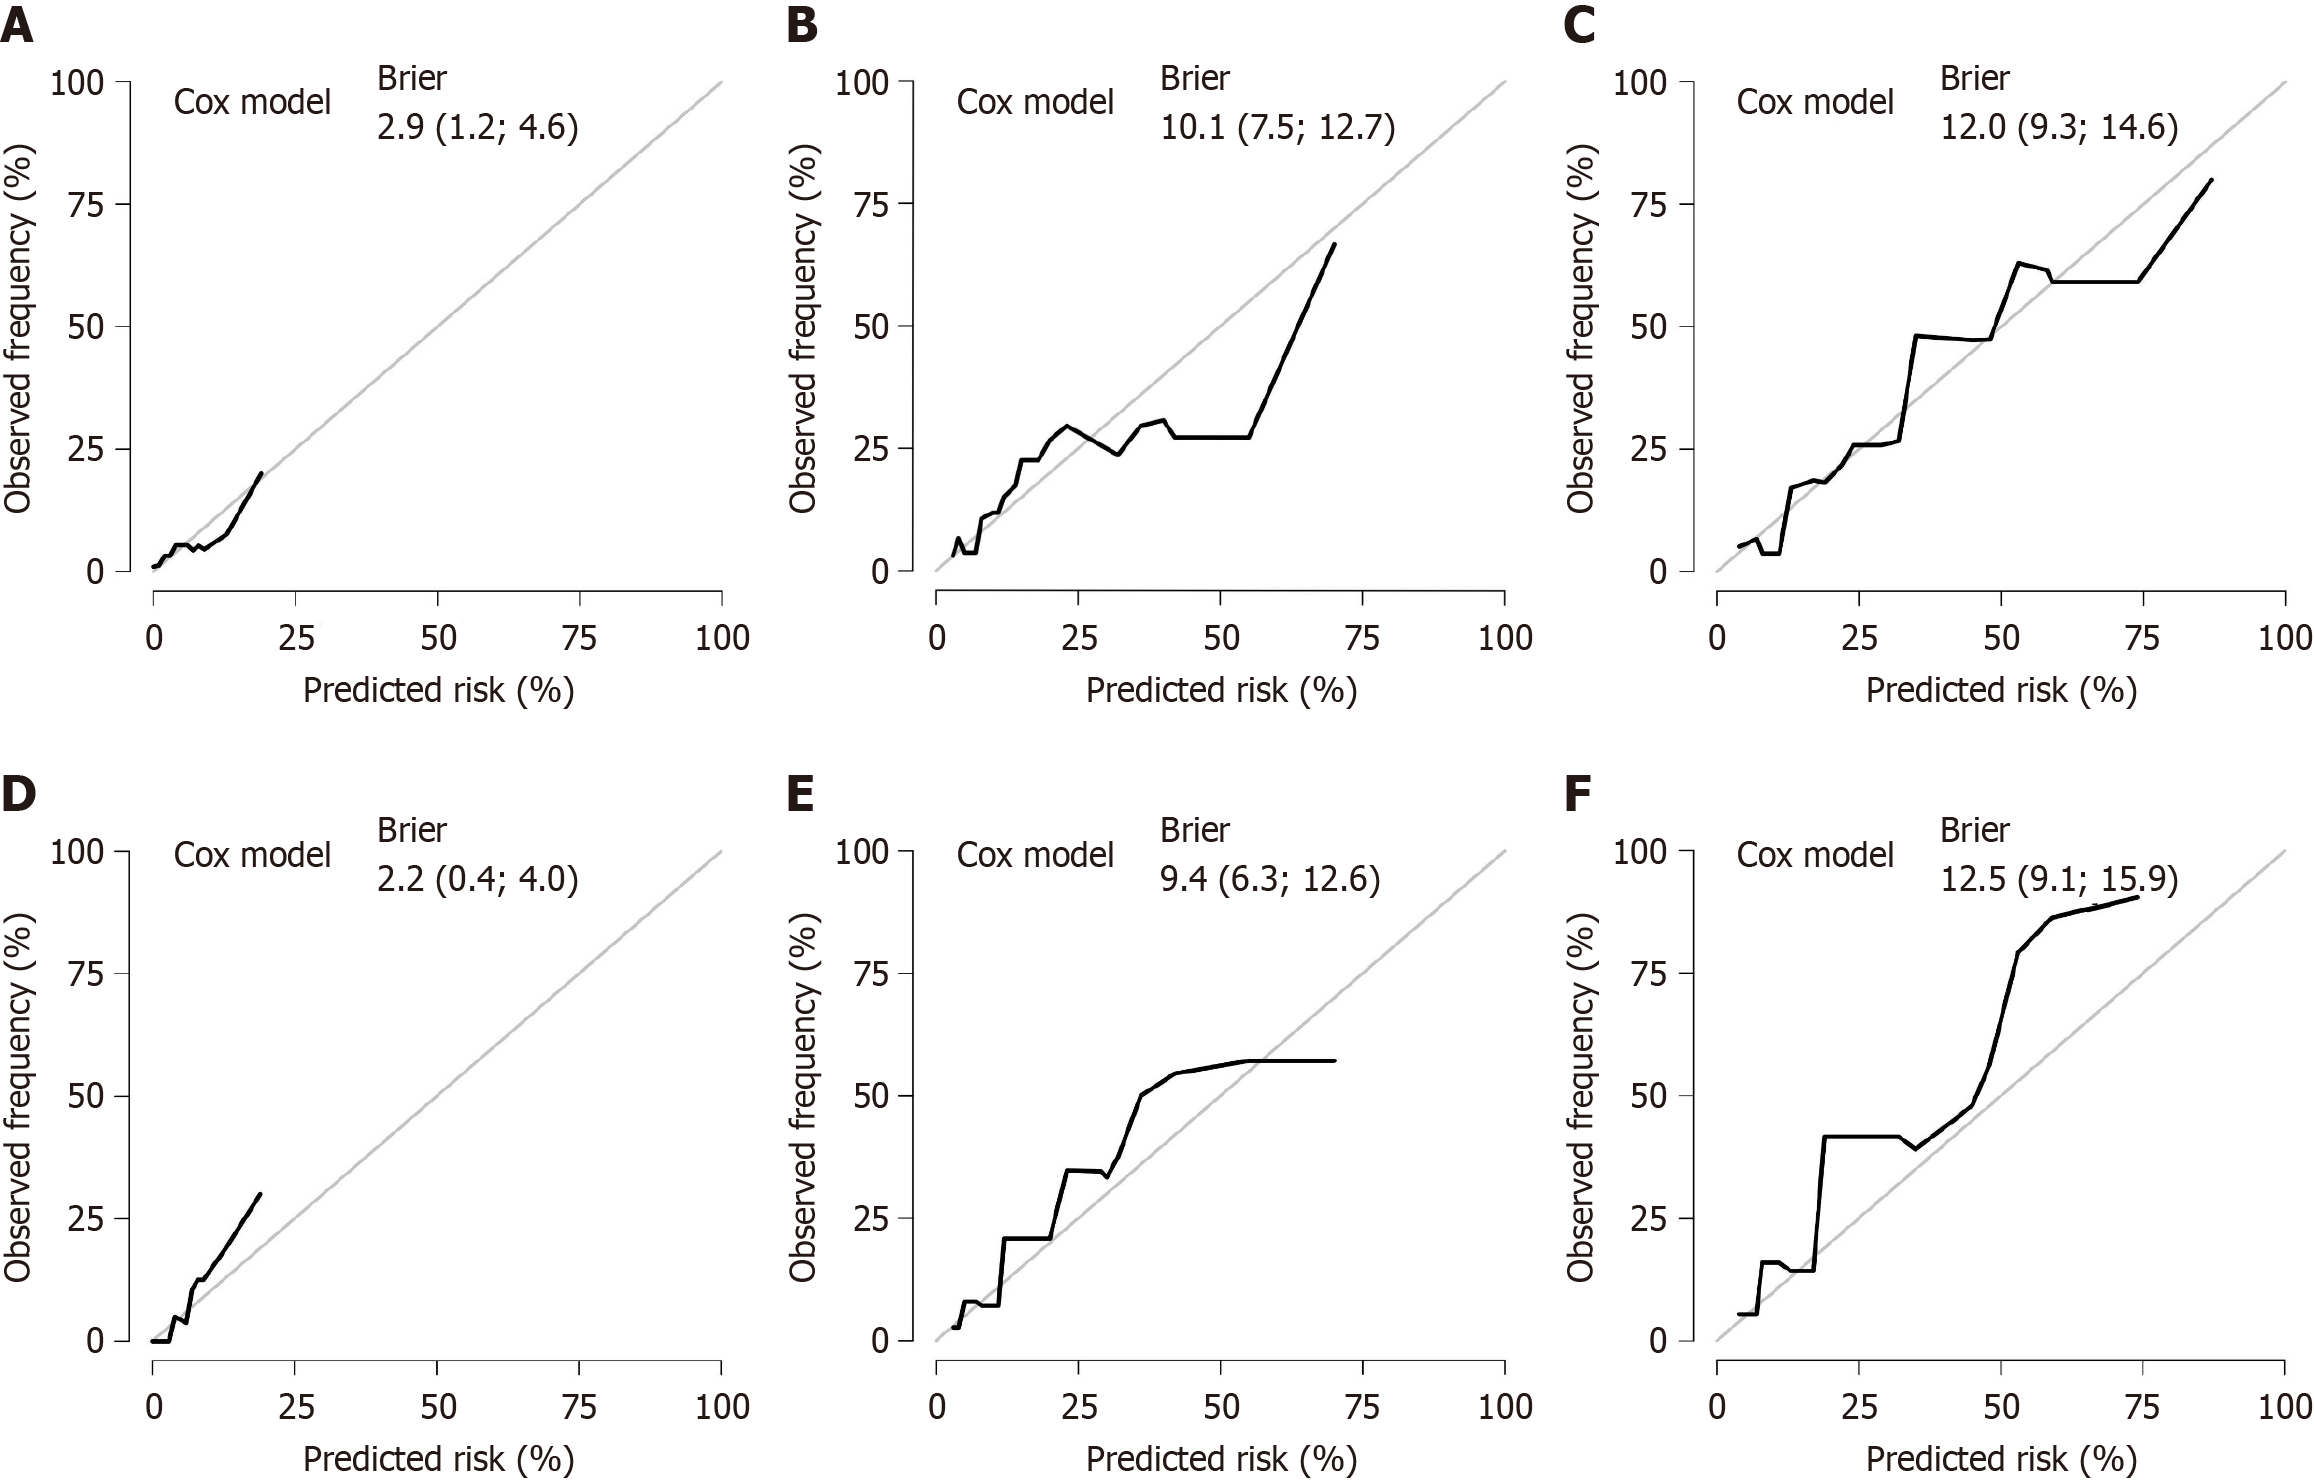
Figure 5 Calibration curves of the nomogram model for survival prediction in the training and validation cohorts.
A-C: Calibration curves for 1-year, 3-year, and 5-year overall survival (OS) in the training cohort; D-F: Calibration curves for 1-year, 3-year, and 5-year OS in the validation cohort.
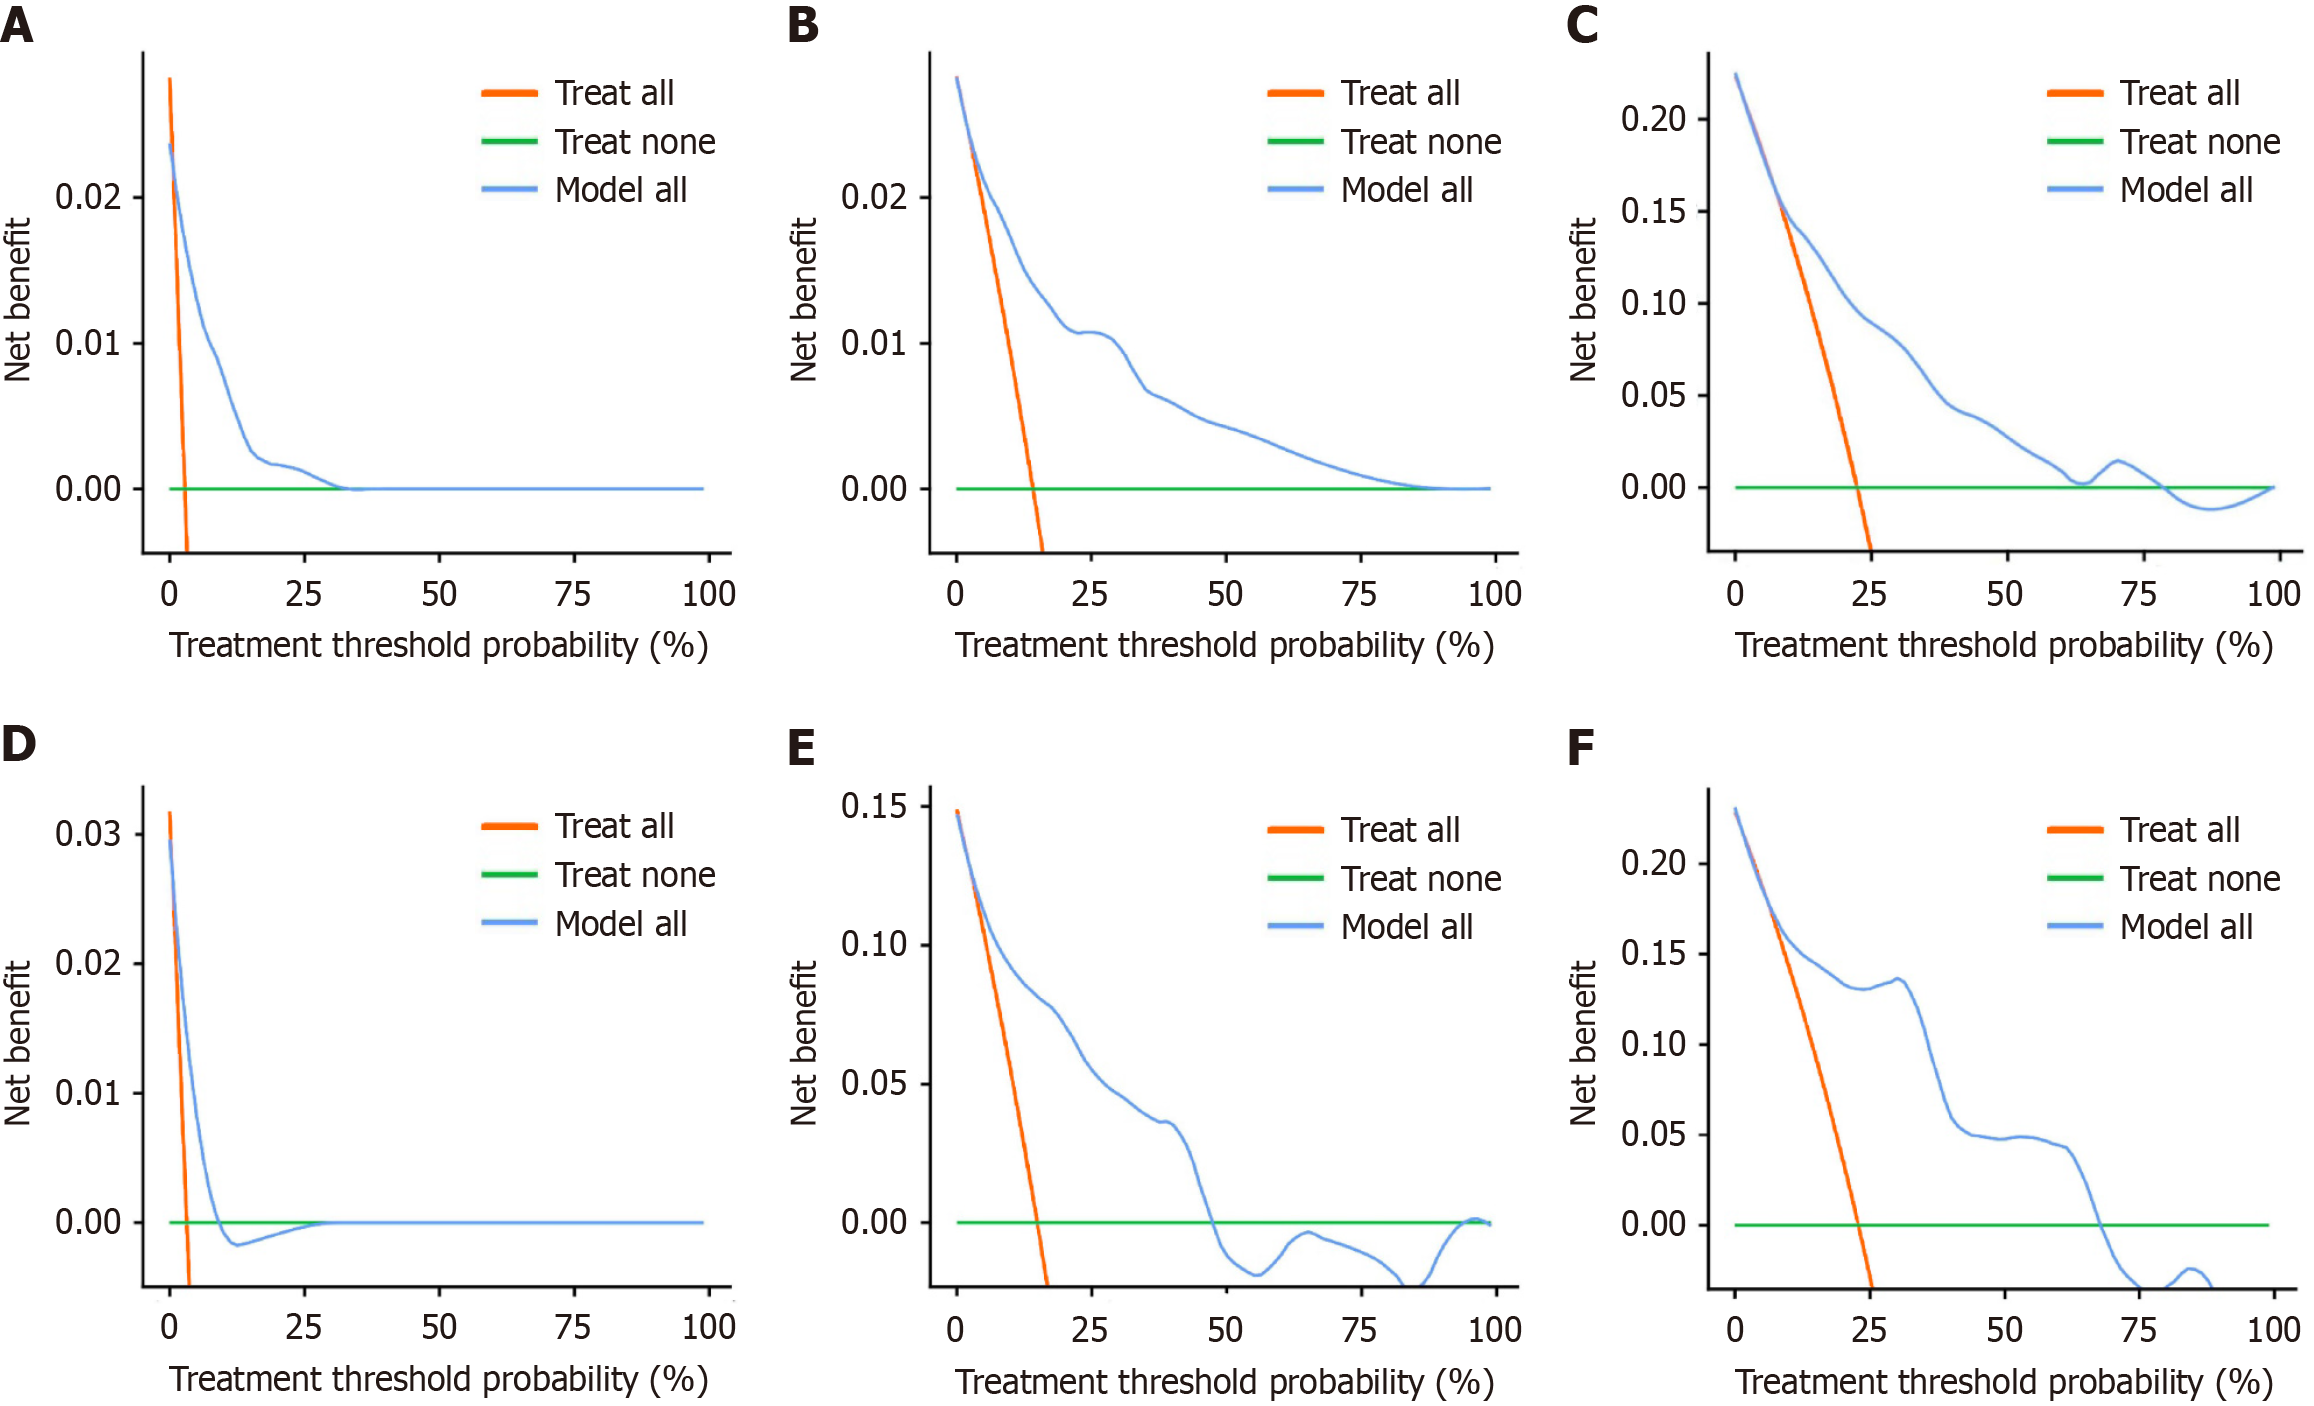
Figure 6 Decision curve analysis of the survival nomogram for predicting overall survival.
A-C: Decision curve analysis for 1-year, 3-year, and 5-year overall survival (OS) in the training cohort; D-F: Decision curve analysis for 1-year, 3-year, and 5-year OS in the validation cohort.
- Citation: Li KJ, Zhang ZY, Wang K, Sulayman S, Zeng XY, Liu J, Chen Y, Zhao ZL. Prognostic scoring system using inflammation- and nutrition-related biomarkers to predict prognosis in stage I-III colorectal cancer patients. World J Gastroenterol 2025; 31(14): 104588
- URL: https://www.wjgnet.com/1007-9327/full/v31/i14/104588.htm
- DOI: https://dx.doi.org/10.3748/wjg.v31.i14.104588


