Copyright
©The Author(s) 2025.
World J Gastroenterol. Apr 14, 2025; 31(14): 104280
Published online Apr 14, 2025. doi: 10.3748/wjg.v31.i14.104280
Published online Apr 14, 2025. doi: 10.3748/wjg.v31.i14.104280
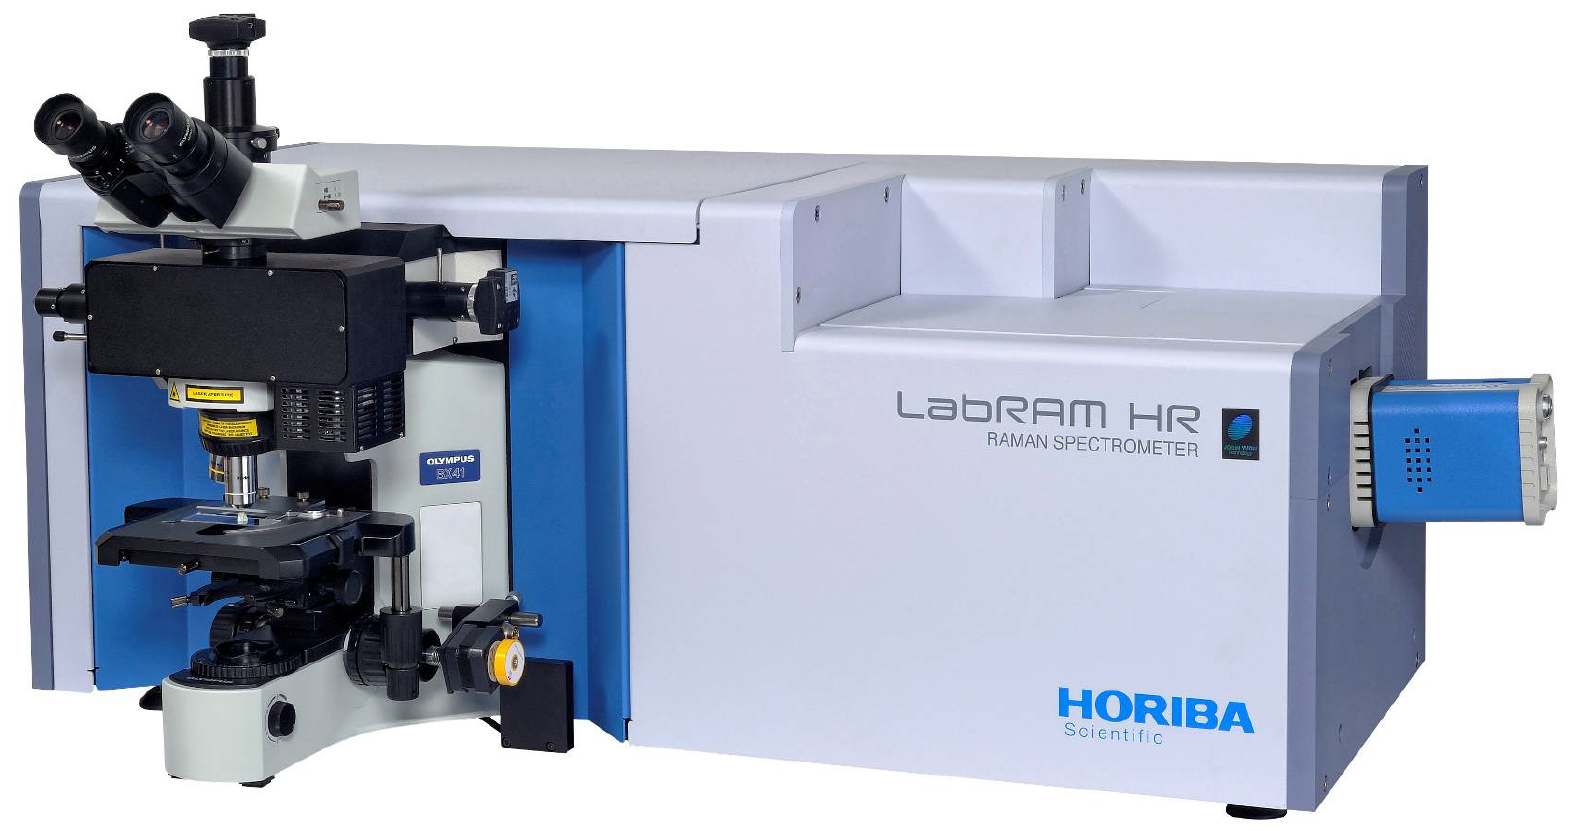
Figure 1 A new generation of high-resolution Raman spectrometer.
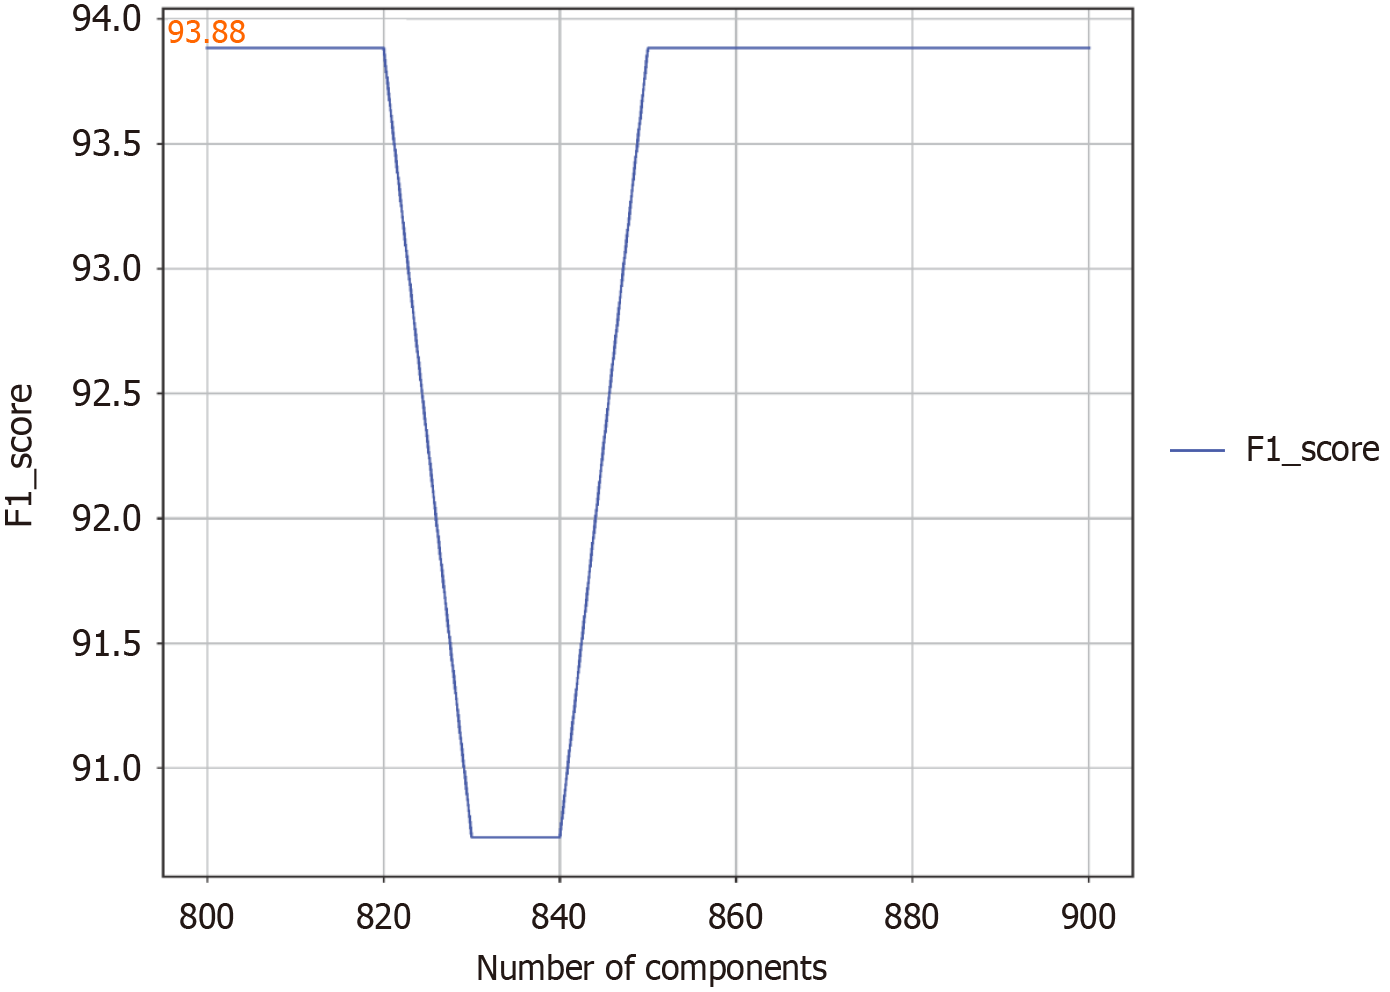
Figure 2 The relationship between the number of components selected and the F1 score.
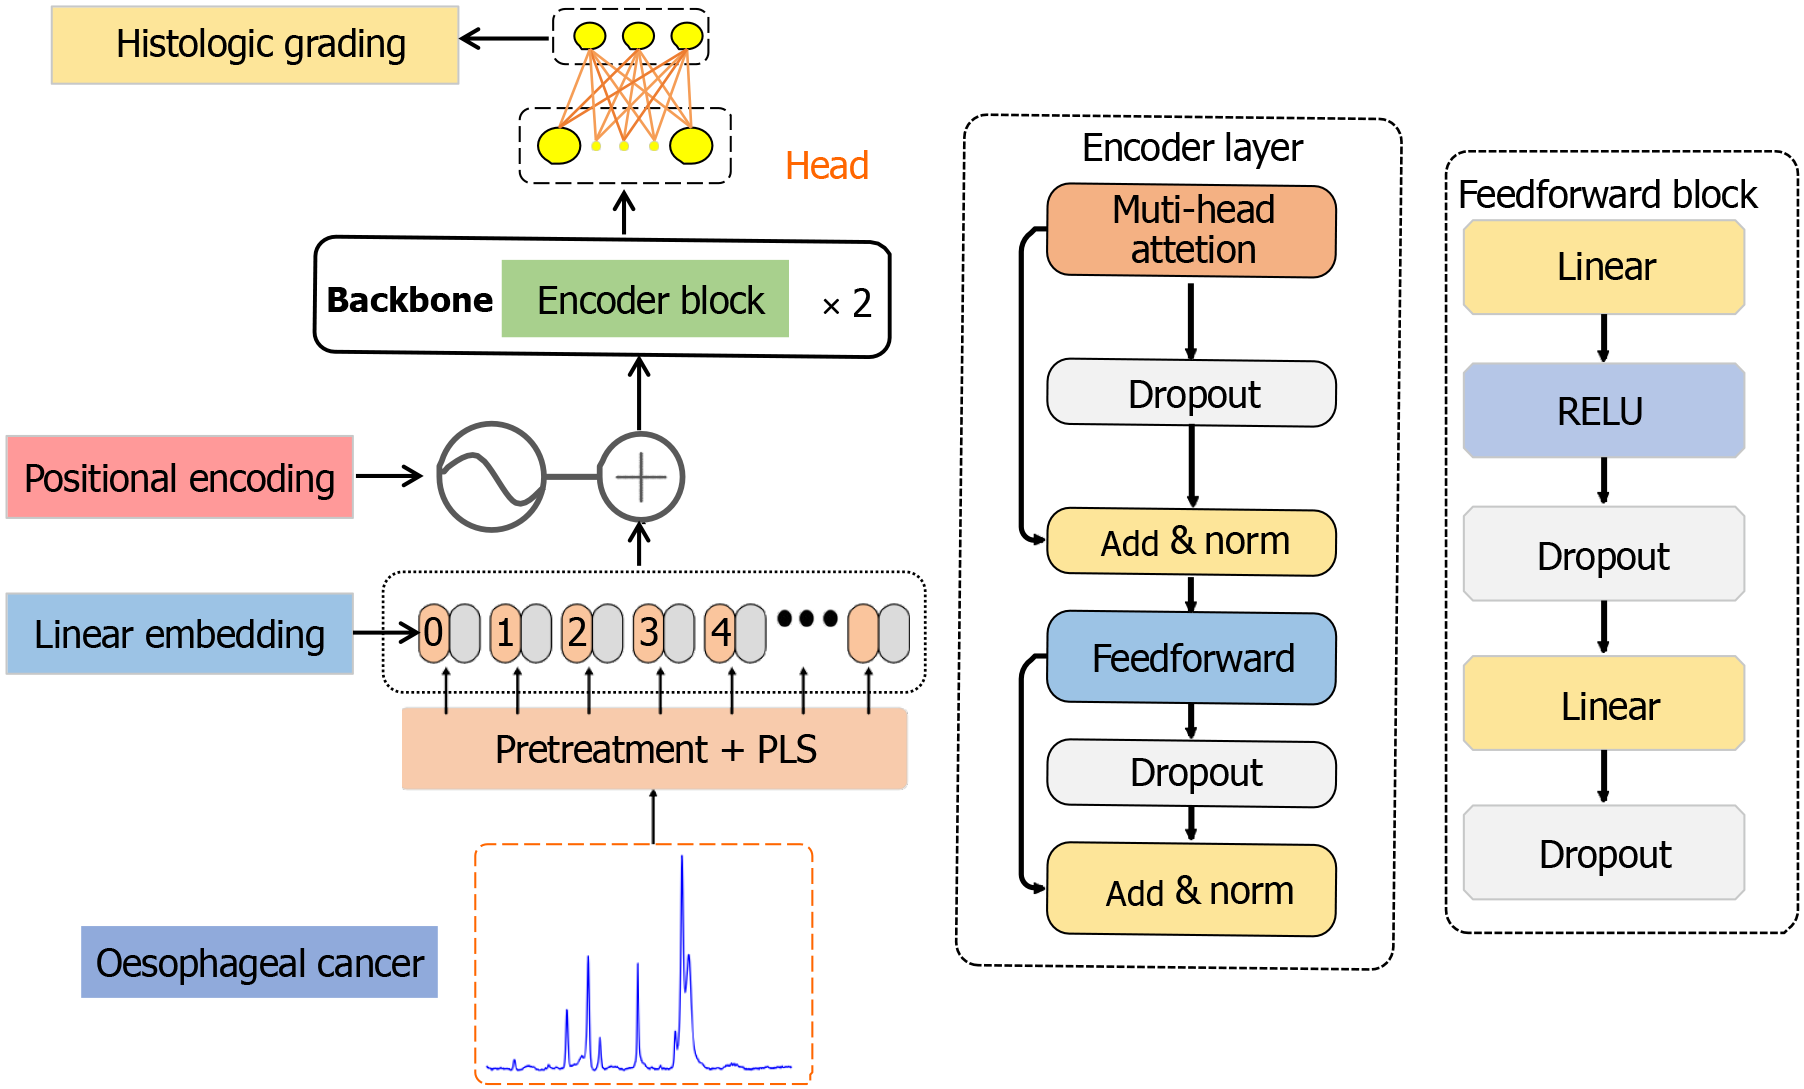
Figure 3 Architecture of 1D-transformer network model.
Raman data composed of 360 individual spectra are introduced to preprocessing + partial least-squares, a linear embedding layer, a location coding layer, a coding layer, and a classification head respectively. PLS: Partial least-squares; RELU: Rectified linear unit.
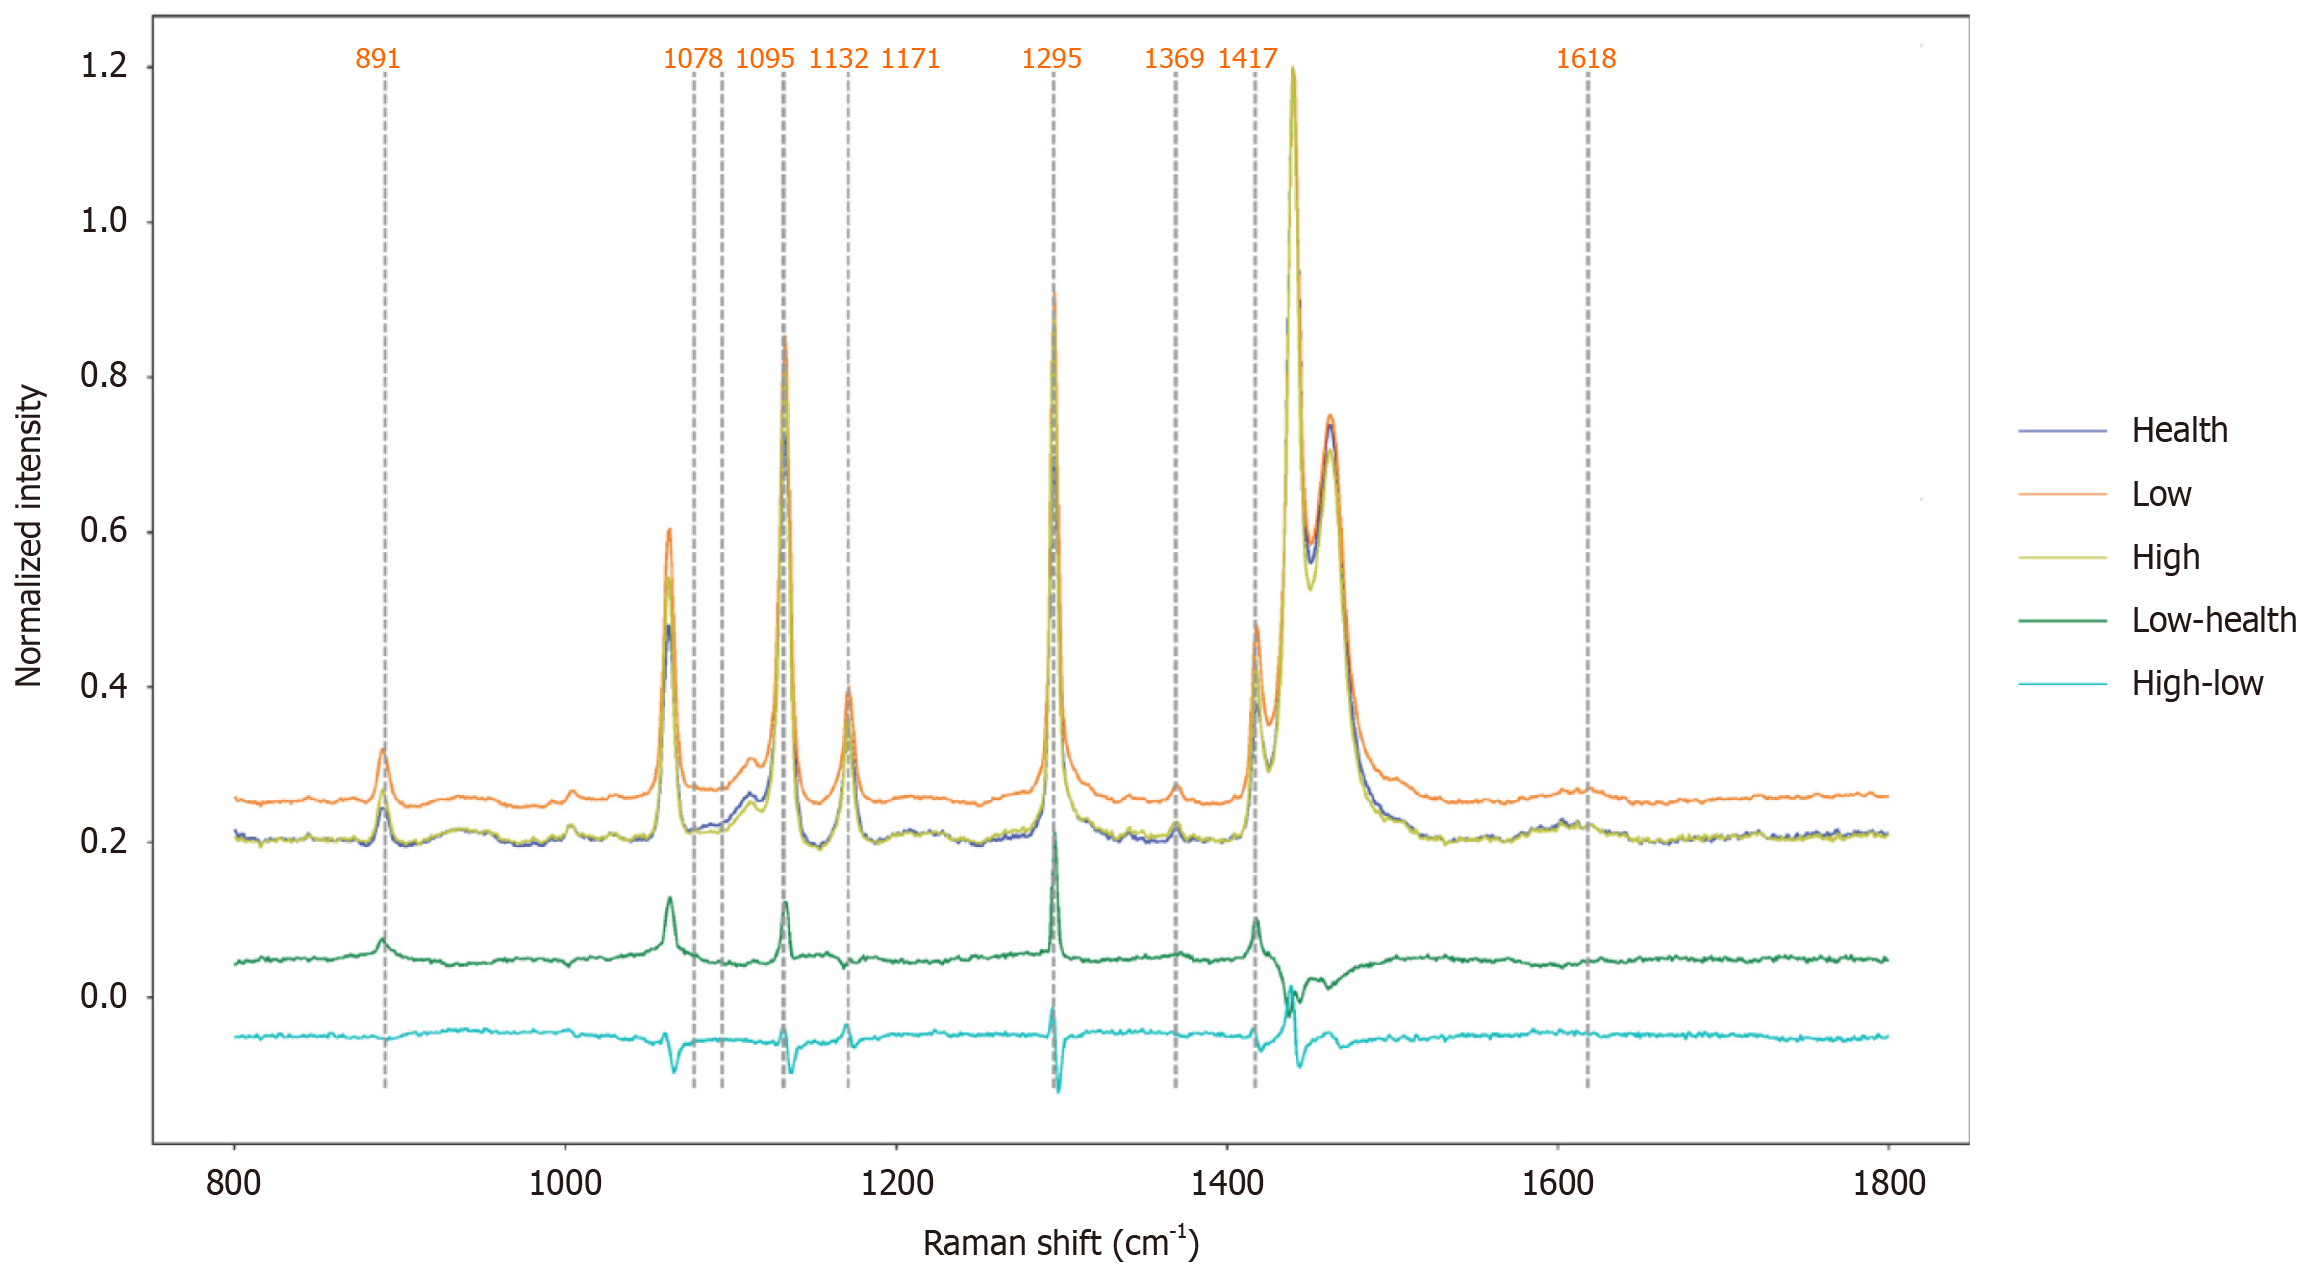
Figure 4 The average Raman spectrogram of esophageal tissues with different pathological grades.
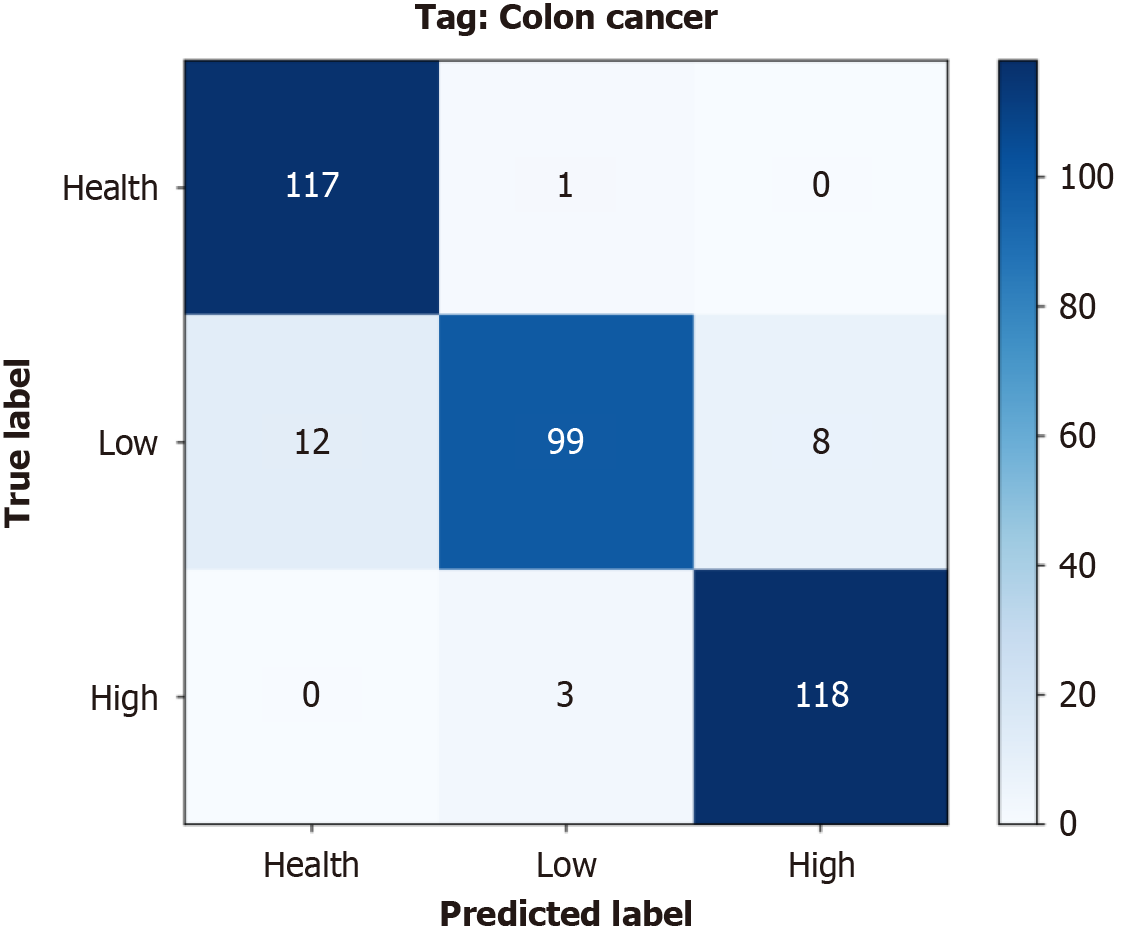
Figure 5 The cumulative confusion matrix summarizes the results of the 10 performed cross-validations.
Figure 6 The accuracy curve, cross-entropy loss curve and receiver operating characteristic curve produced for the pathology grading task of different models.
A and B: The accuracy curve and cross-entropy loss curve produced for the pathology grading task; C: Receiver operating characteristic curve and corresponding area under the curve value of the test set.
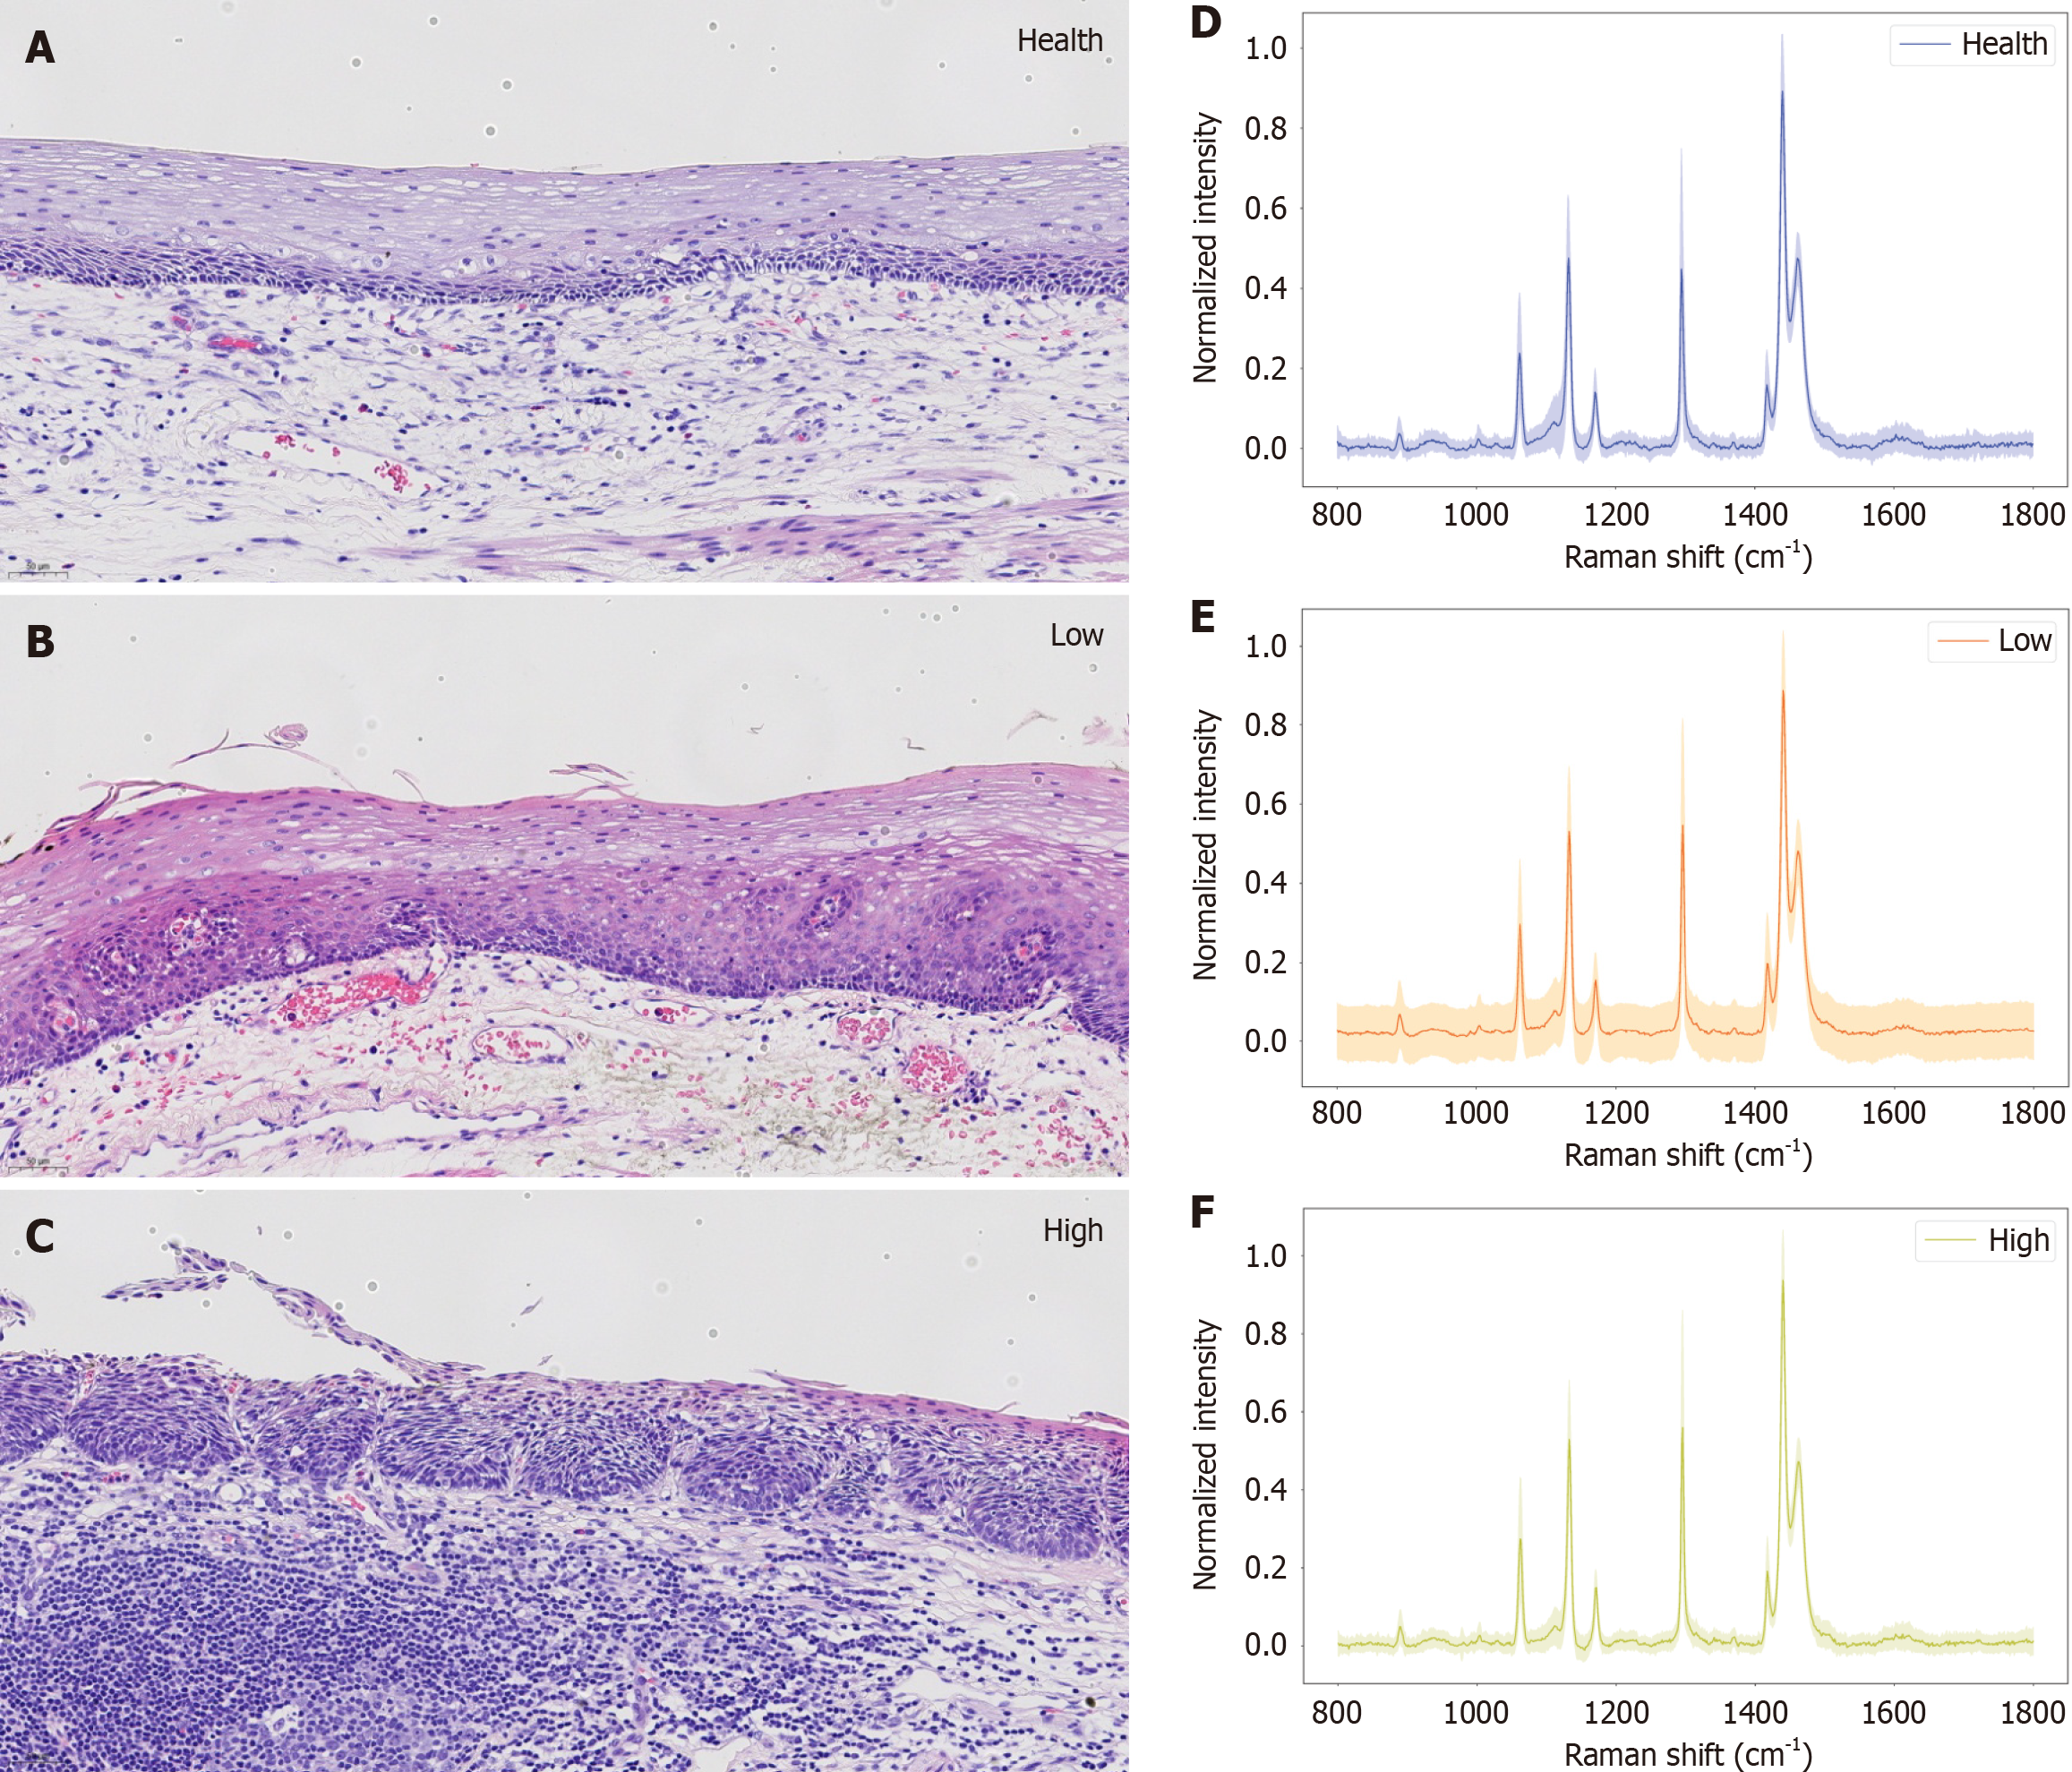
Figure 7 Corresponding histopathological images and Raman spectrograms with their corresponding spectral ranges superimposed of the three histopathological grading states of esophageal cancer.
A-C: The corresponding histopathological images of the three histopathological grading states of esophageal cancer: Healthy tissue, low-grade pathological tissue, and high-grade pathological tissue; D-F: Raman spectrograms of healthy, low-grade and high-grade lesions, respectively, with their corresponding spectral ranges superimposed.
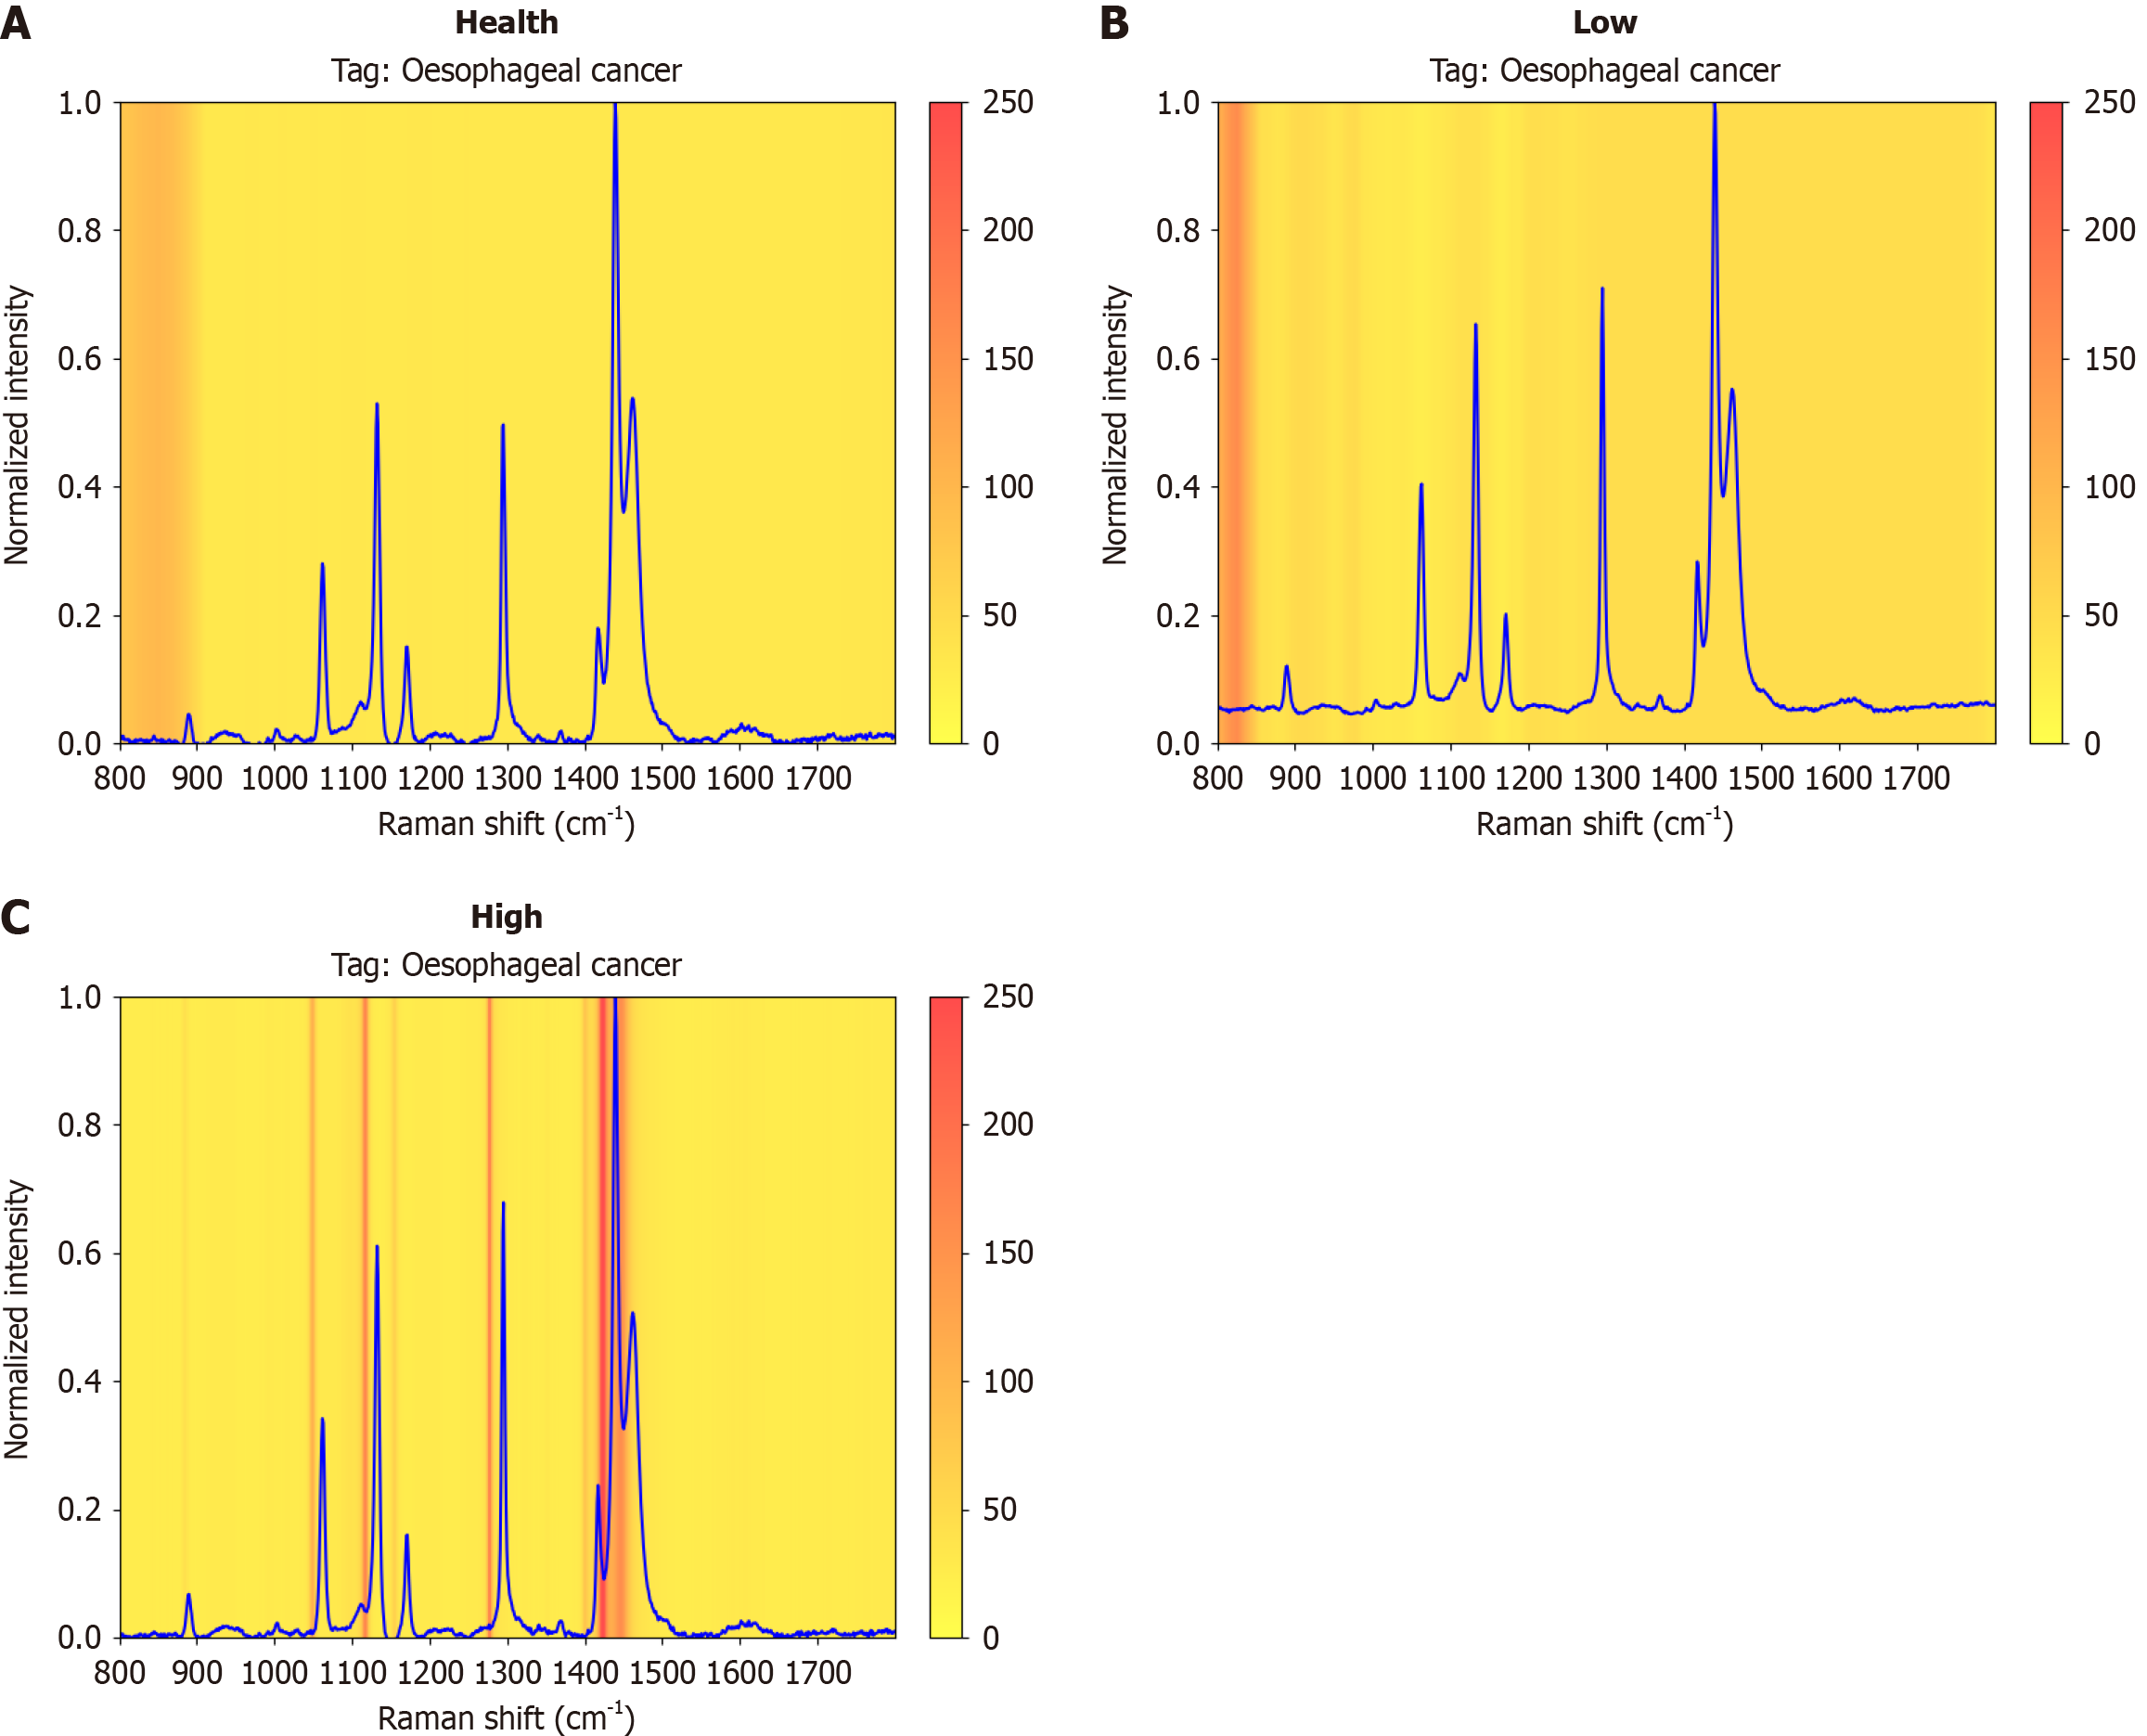
Figure 8 Raman spectra of healthy tissue, low-grade tissue and high-grade tissue and the heatmap of the neural network visualized via Grad-CAM.
A: Healthy tissue; B: Low-grade tissue; C: High-grade tissue.
- Citation: Yu XY, Chen J, Li LY, Chen FE, He Q. Rapid pathologic grading-based diagnosis of esophageal squamous cell carcinoma via Raman spectroscopy and a deep learning algorithm. World J Gastroenterol 2025; 31(14): 104280
- URL: https://www.wjgnet.com/1007-9327/full/v31/i14/104280.htm
- DOI: https://dx.doi.org/10.3748/wjg.v31.i14.104280


