Copyright
©The Author(s) 2025.
World J Gastroenterol. Apr 7, 2025; 31(13): 104697
Published online Apr 7, 2025. doi: 10.3748/wjg.v31.i13.104697
Published online Apr 7, 2025. doi: 10.3748/wjg.v31.i13.104697
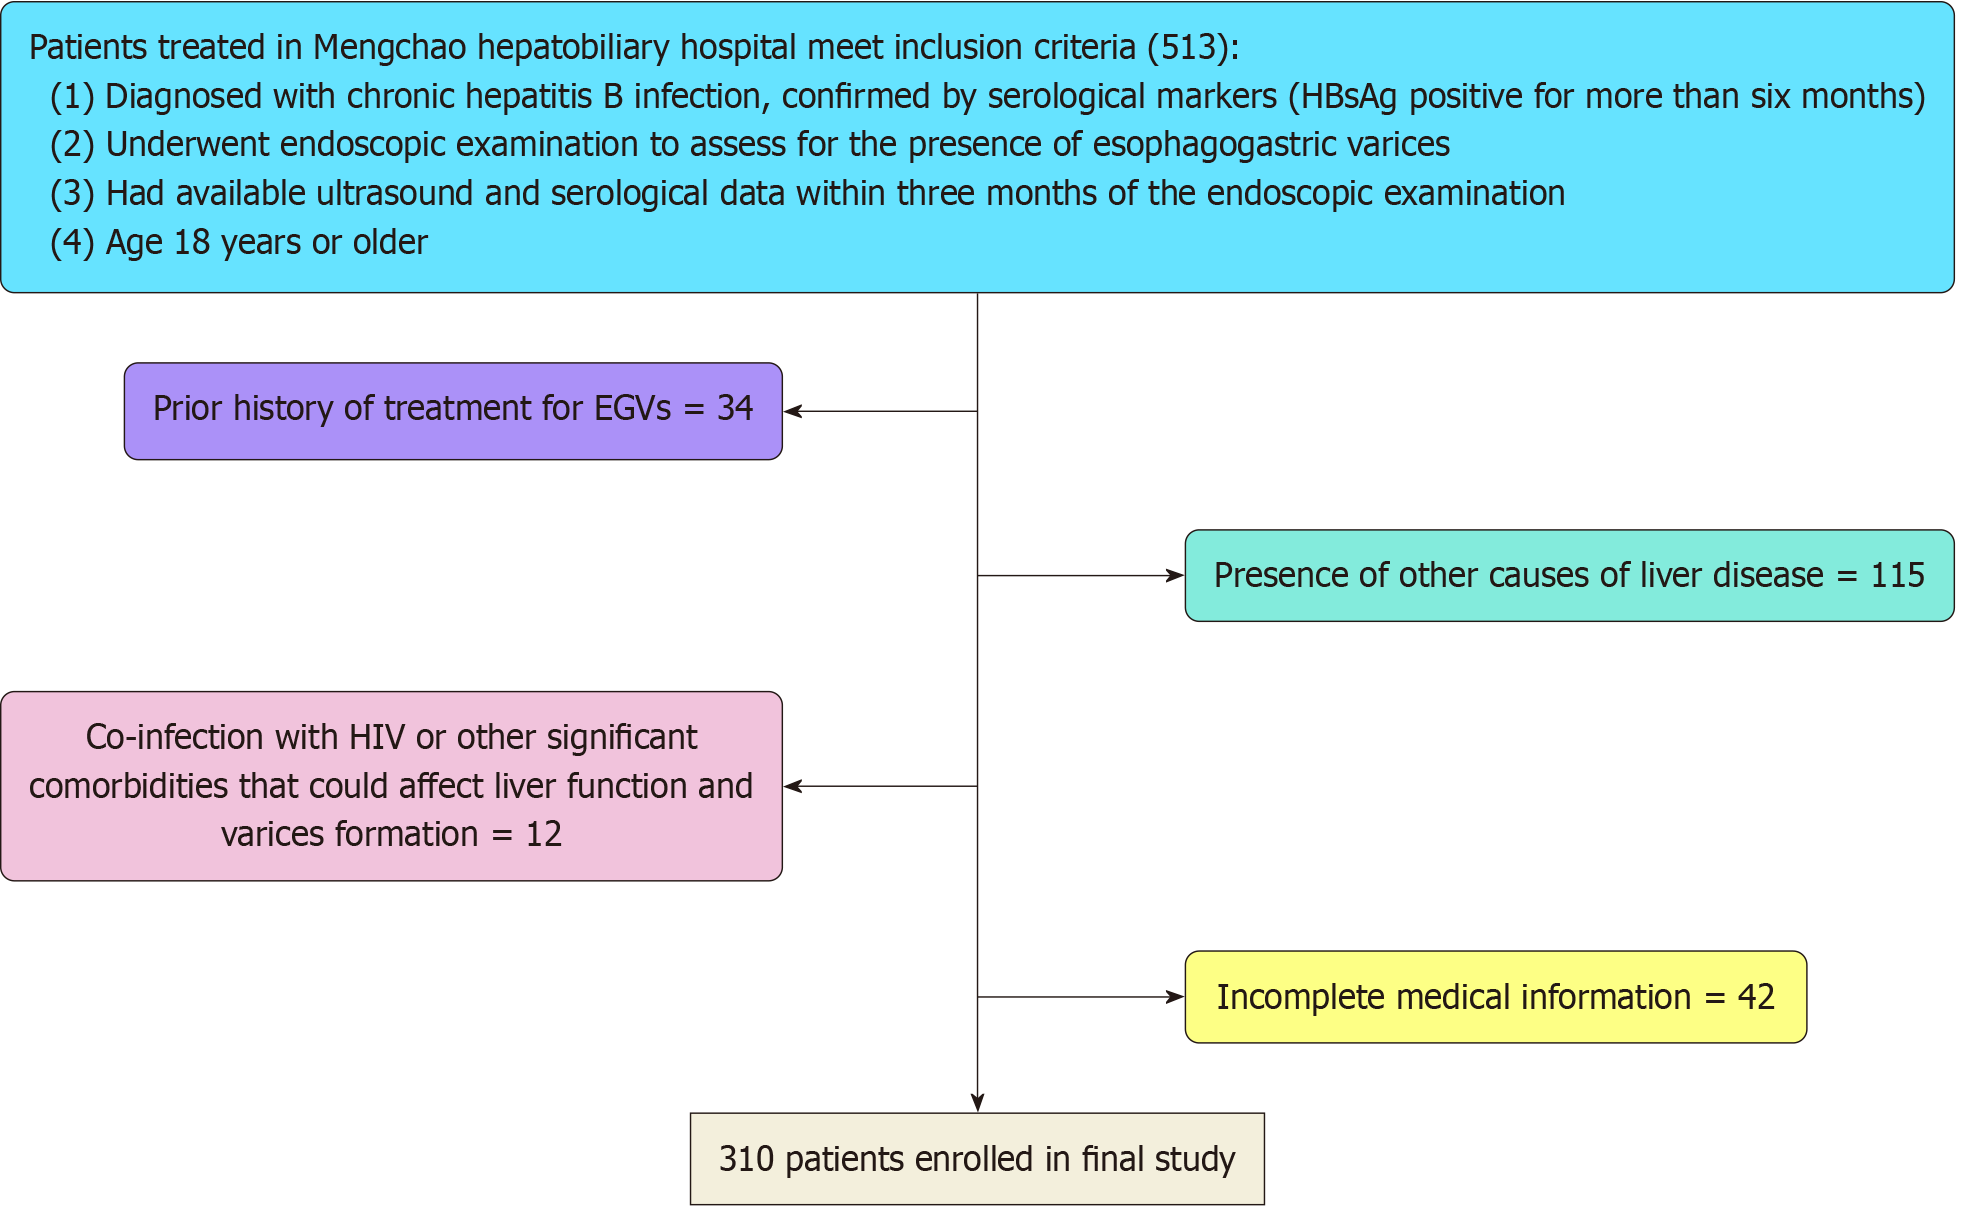
Figure 1 Patient inclusion flow.
EGVs: Esophagogastric varices; HIV: Human immunodeficiency virus; HBsAg: Hepatitis B virus surface antigen.
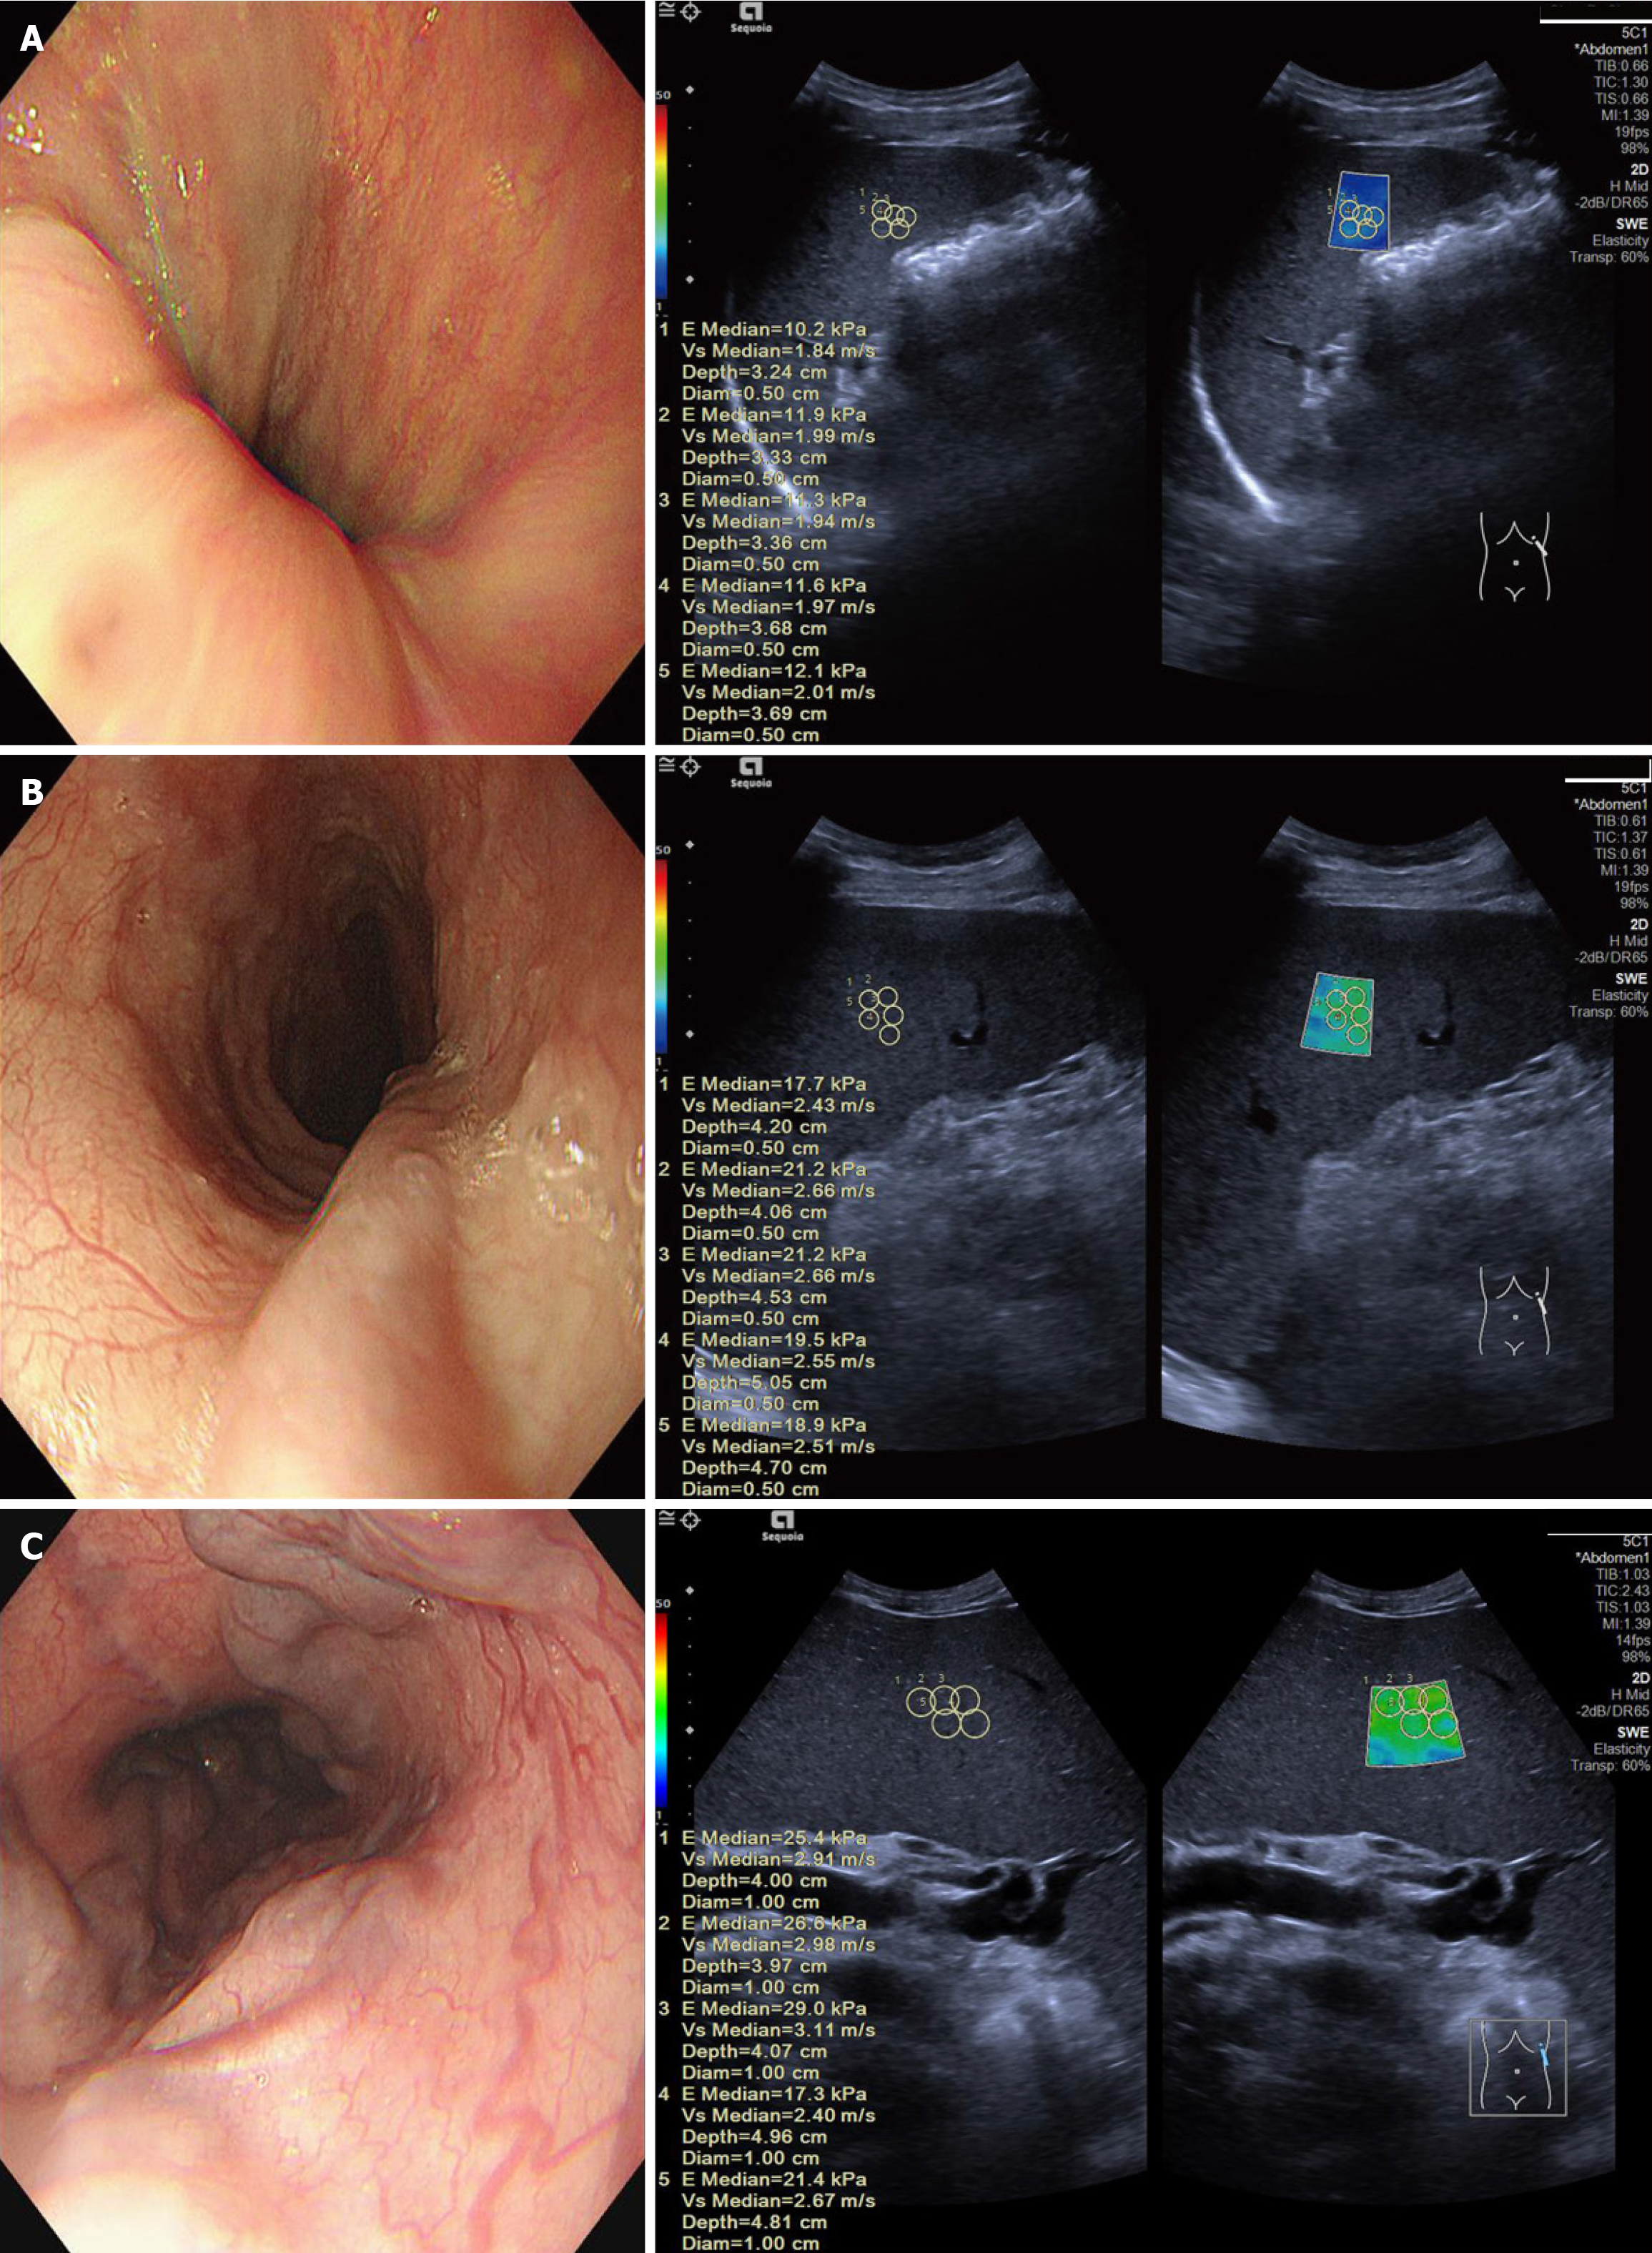
Figure 2 Esophagogastric varices of varying severity and the corresponding spleen stiffness measurements.
A: A 50-year-old male patient with mild esophagogastric varices (EGVs) as determined by endoscopy, with a median spleen stiffness value of 11.6 kPa; B: A 33-year-old male patient with moderate EGVs as determined by endoscopy, with a median spleen stiffness value of 19.5 kPa; C: A 59-year-old female patient with severe EGVs as determined by endoscopy, with a median spleen stiffness value of 25.4 kPa.
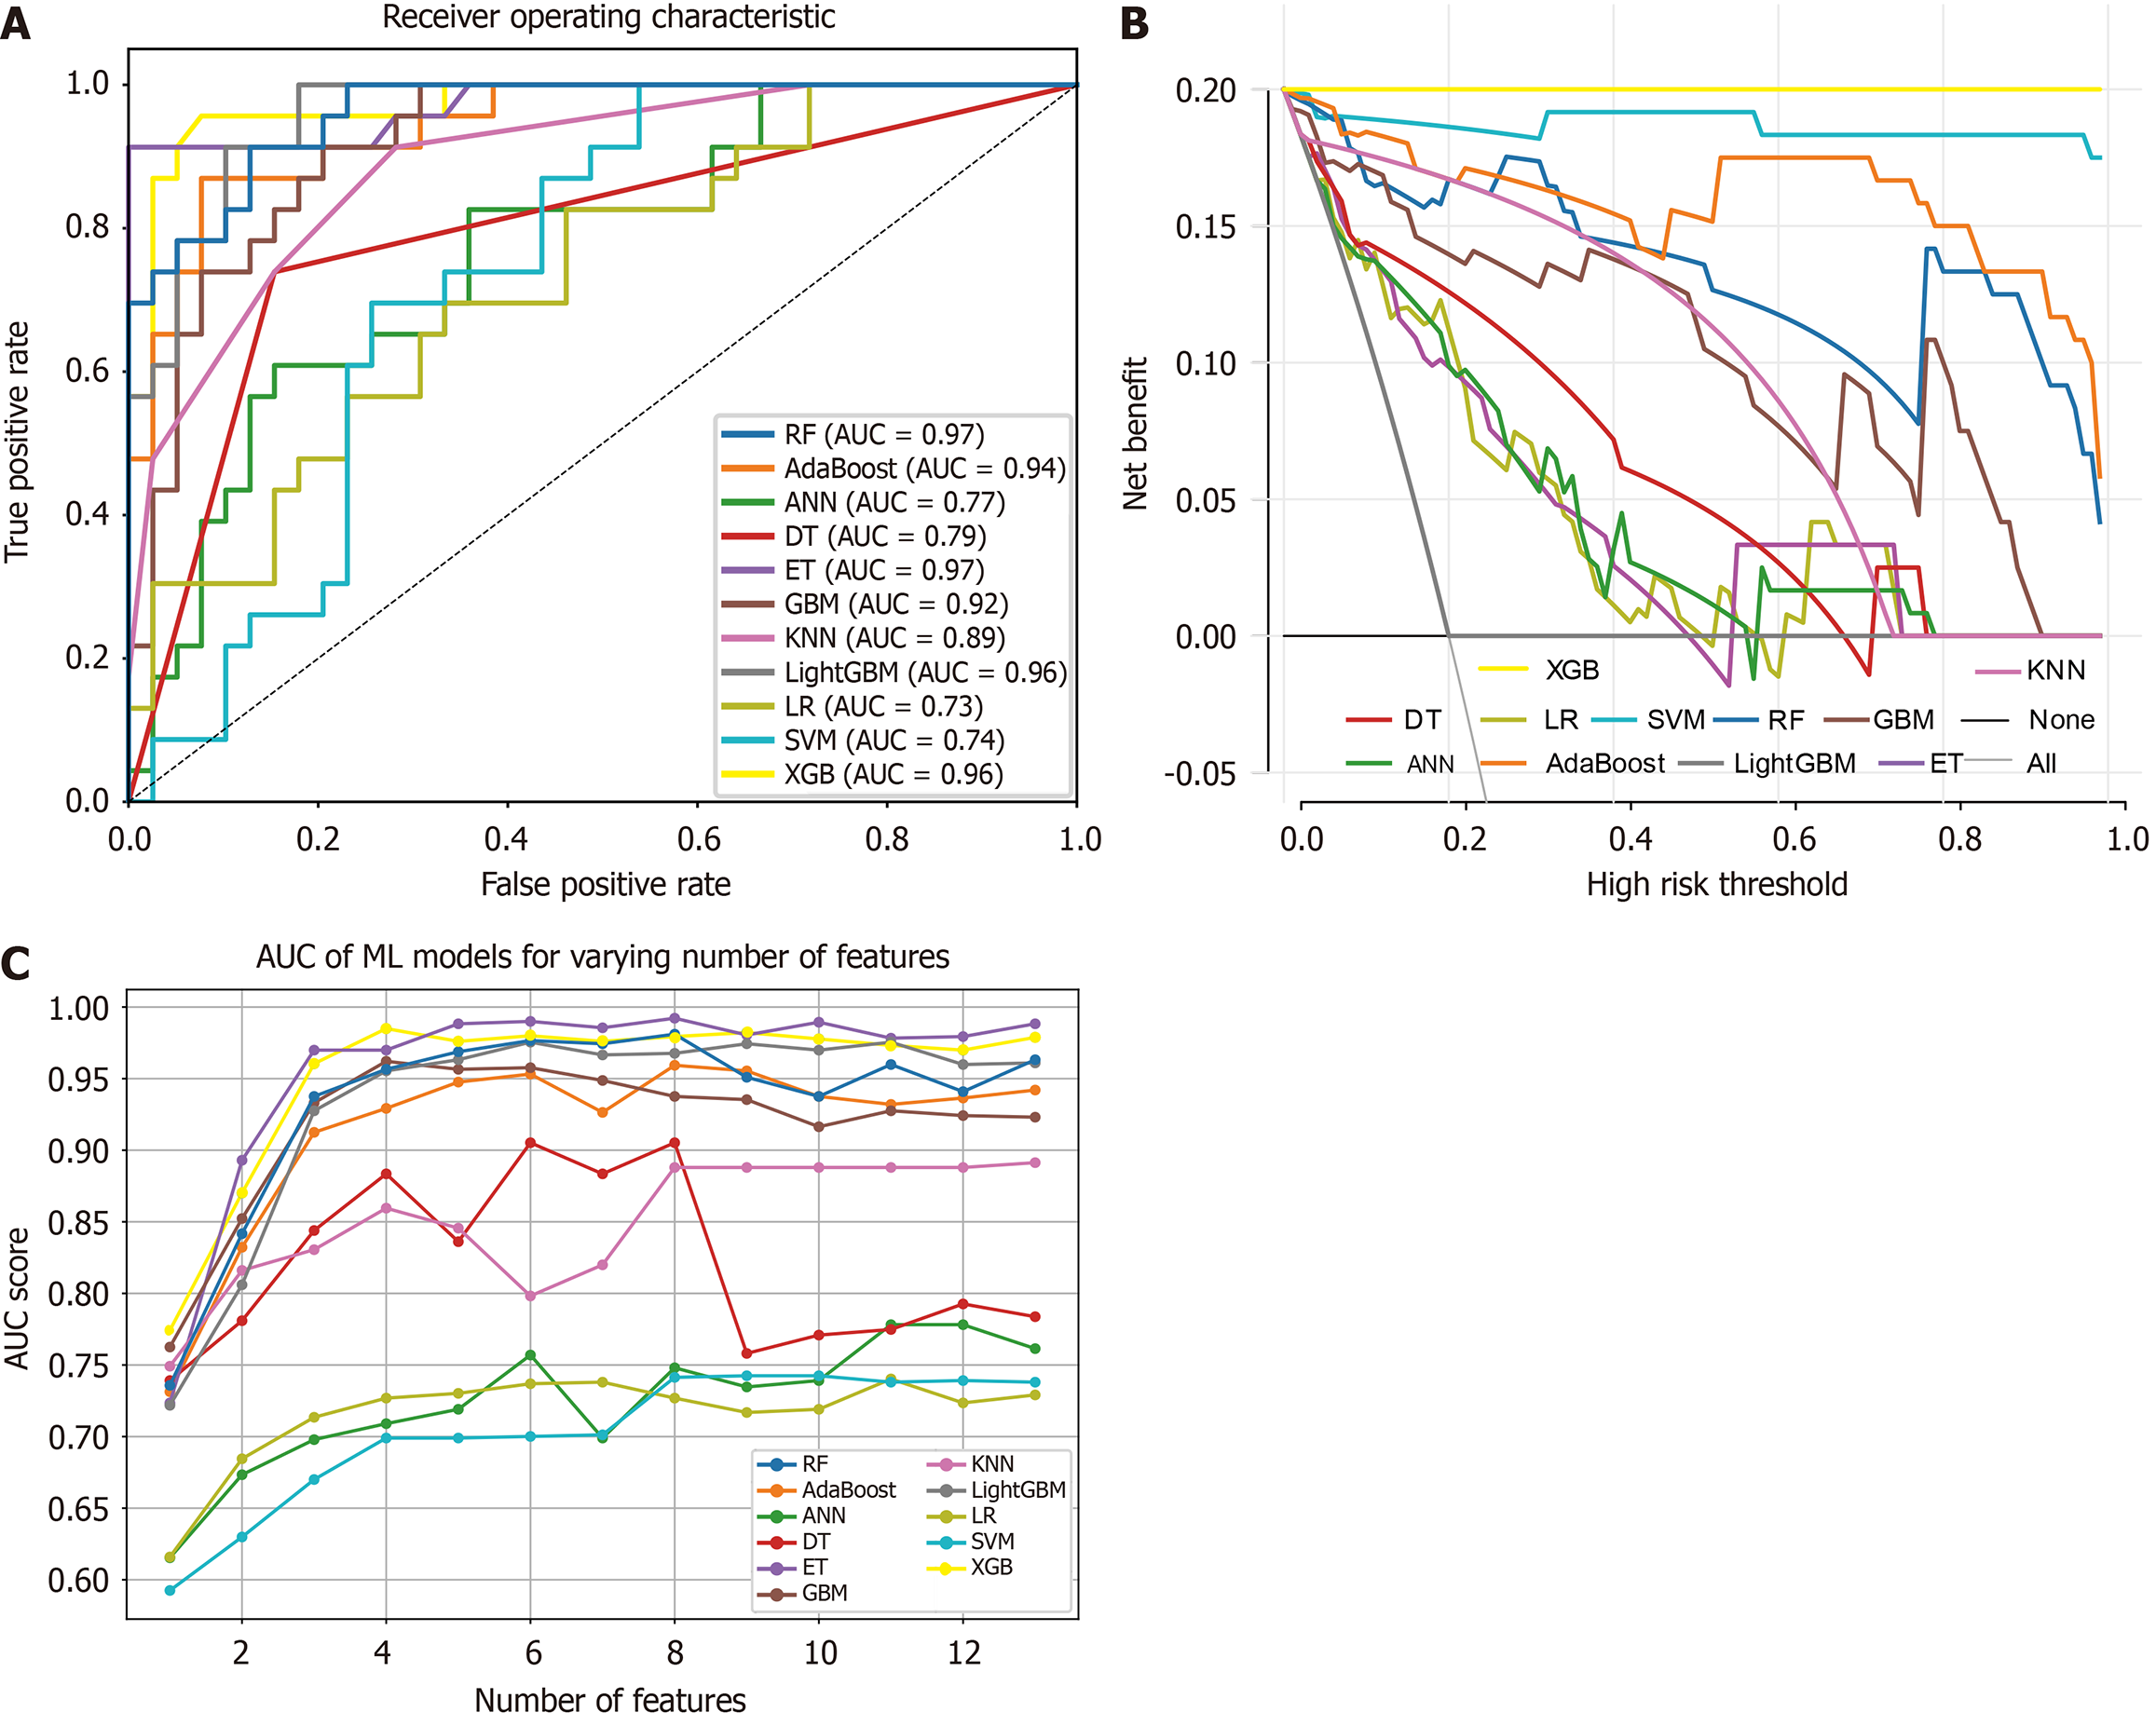
Figure 3 Curves for various prediction metrics across all models.
A: Receiver operating characteristic curves; B: Decision curve analysis curves; C: Area under the curve values corresponding to different numbers of features. AUC: Area under the curve; RF: Random forest; AdaBoost: Adaptive boosting; ANN: Artificial neural network; DT: Decision tree; ET: Extra trees; GBM: Gradient boosting machine; KNN: K-nearest neighbors; LightGBM: Light gradient boosting machine; LR: Logistic regression; SVM: Support vector machine; XGB: Extreme gradient boosting.
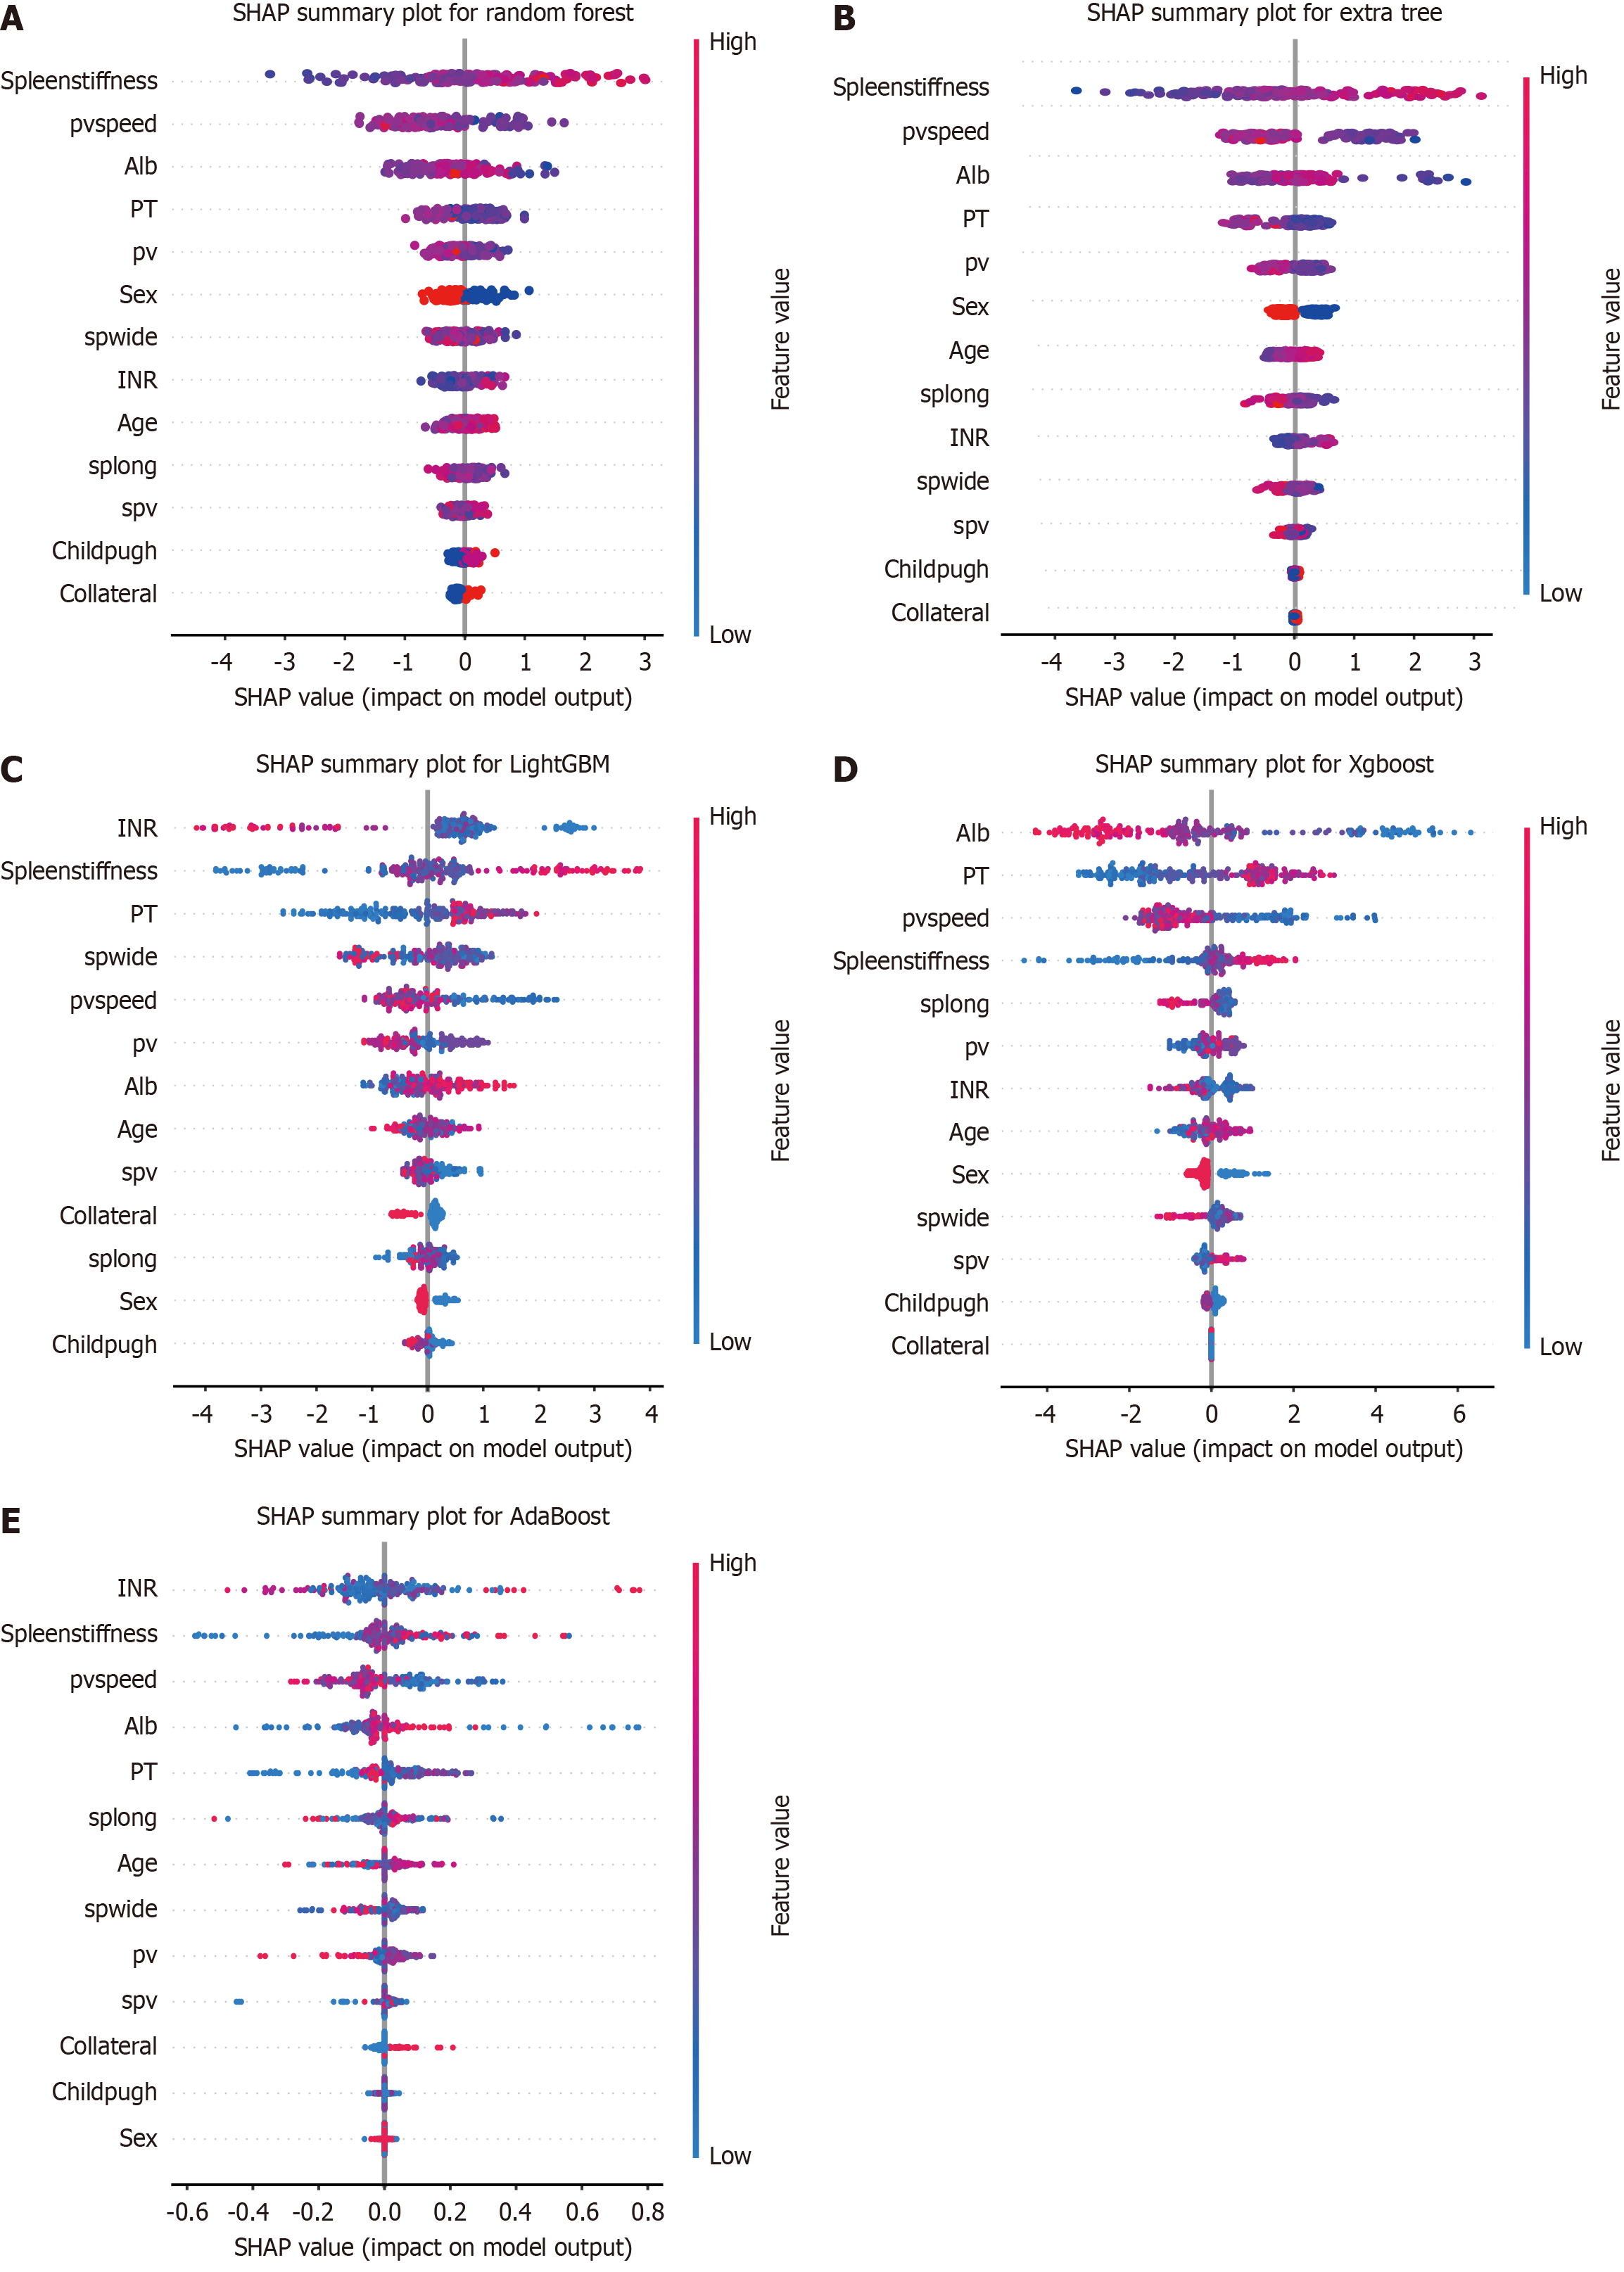
Figure 4 Overall bee swarm plot for the top five models ranked by area under curve value.
A: Random forest; B: Extra tree; C: Light gradient boosting machine; D: Extreme gradient boost; E: Adaptive boosting. SHAP: SHapley Additive exPlanation; pvspeed: Portal vein speed; Alb: Albumin; PT: Prothrombin time; pv: Portal vein; spwide: Spleen width; INR: International normalized ratio; splong: Spleen length.
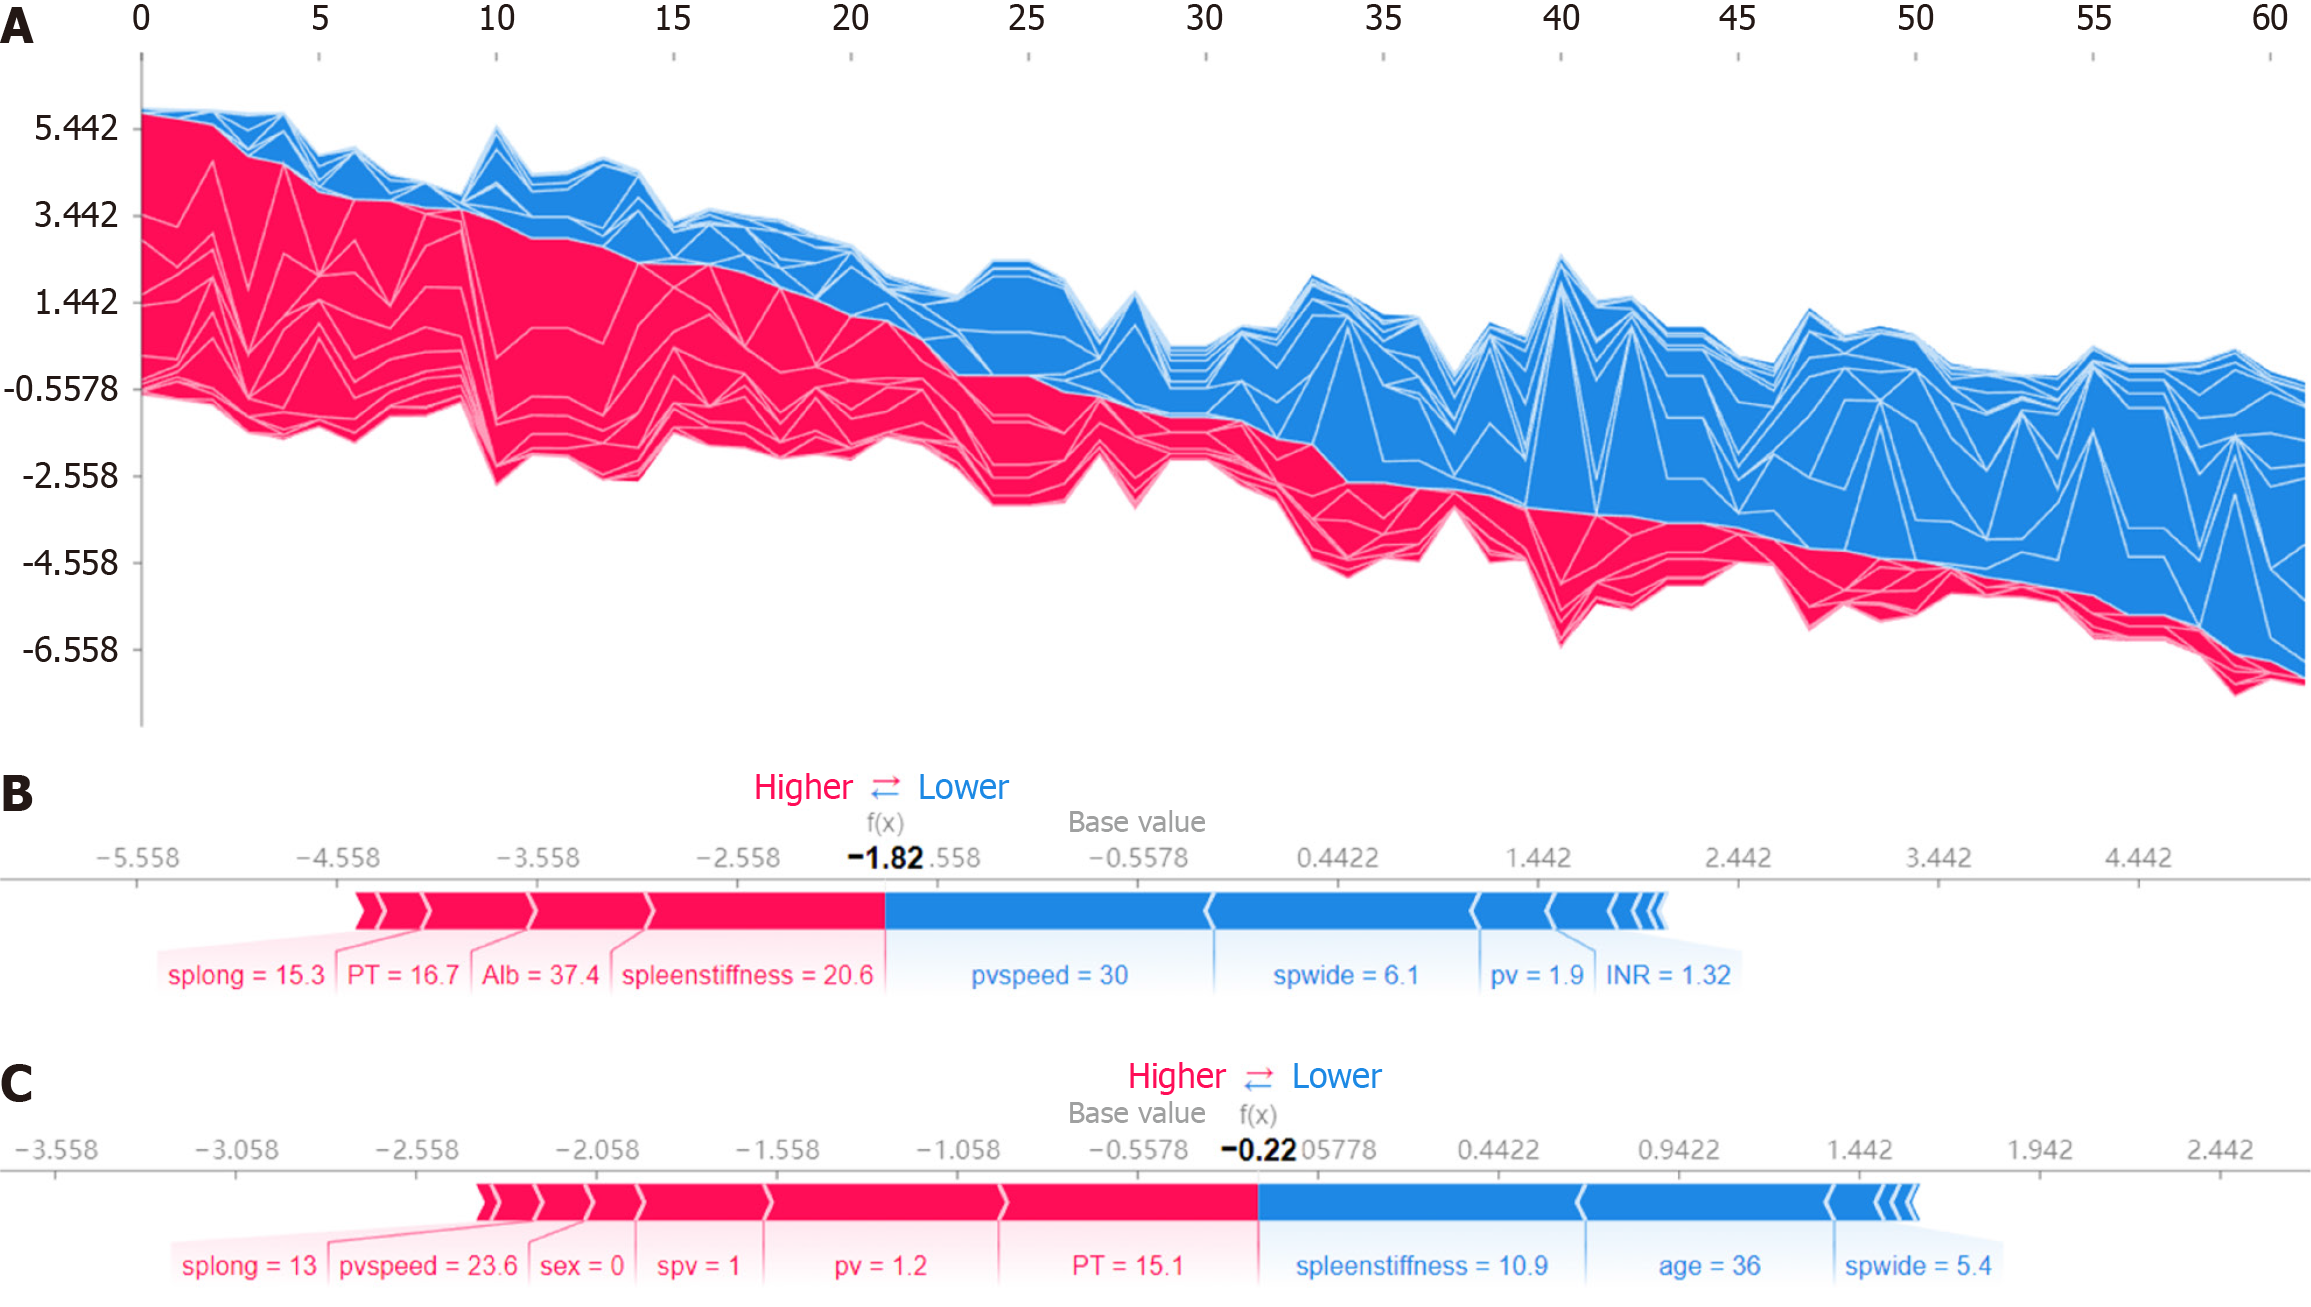
Figure 5 SHapley Additive exPlanation force plots demonstrating model predictions for actual patients.
A: The force plot for all patients illustrates the SHapley Additive exPlanation (SHAP) values, showing how each feature contributes to the predictions of the model for each individual. The x-axis represents the model output value, with red indicating an increase in the prediction score (higher risk) and blue indicating a decrease (lower risk). This comprehensive view demonstrates the impact of features like portal vein speed, spleen width and spleen stiffness on the predictions for all patients; B: The force plot application for actual patients further interprets model predictions. The force plot for inaccurately predicted patients displays the SHAP values for a case where the model prediction was incorrect. Features such as spleen length, prothrombin time and albumin are highlighted, showing their contributions to the incorrect prediction. Red bars indicate features that increased the prediction score, leading to a higher risk, while blue bars indicate features that decreased the score, indicating a lower risk; C: The force plot for accurately predicted patients shows the SHAP values for a correctly predicted case. Significant features like spleen stiffness, age and spleen width are shown with their respective contributions, demonstrating how these features combined to provide an accurate risk assessment, with red bars increasing the prediction score and blue bars decreasing it. splong: Spleen length; PT: Prothrombin time; Alb: Albumin; pvspeed: Portal vein speed; pv: Portal vein; spwide: Spleen width; INR: International normalized ratio.
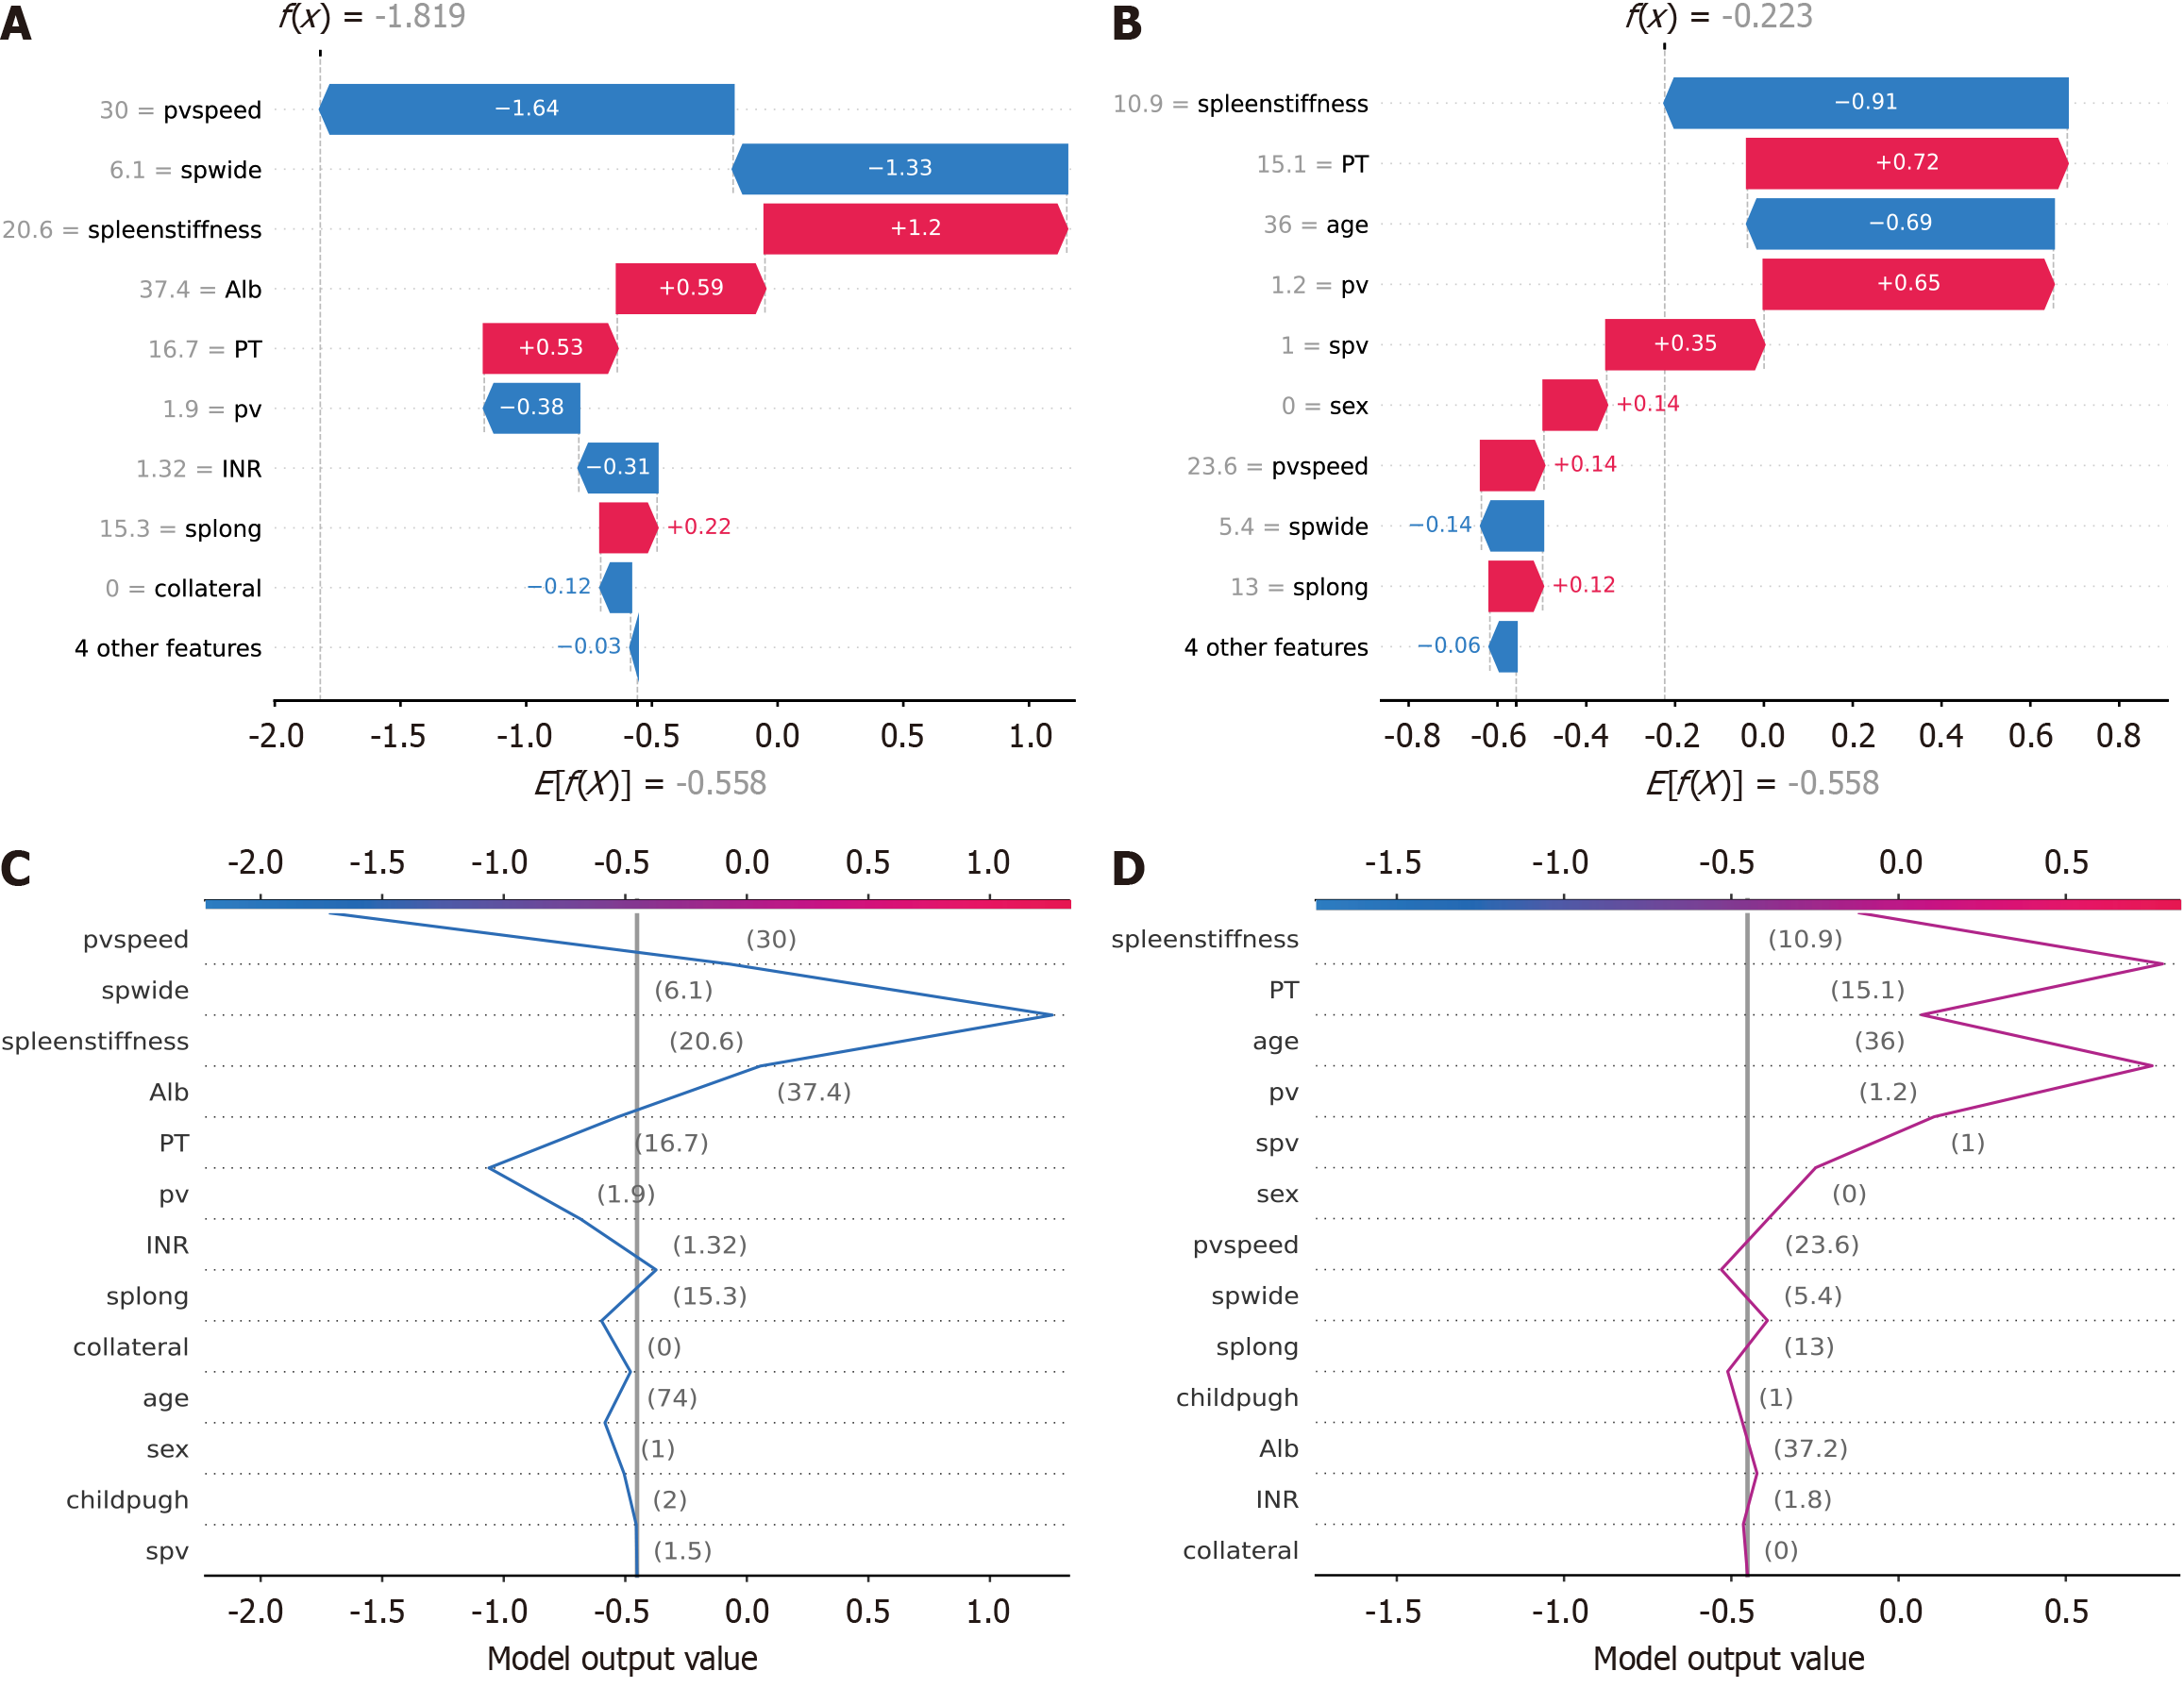
Figure 6 Waterfall and decision plots demonstrating model predictions for actual patients.
A: Waterfall plot for accurately predicted patients shows the contribution of each feature to the final prediction. Features such as portal vein speed, spleen width and spleen stiffness were key contributors. Blue bars decrease the predictive score (indicating lower risk), and red bars increase the predictive score (indicating higher risk). This plot demonstrates how the model effectively used these features to make correct predictions; B: Waterfall plot for inaccurately predicted patients displays the contributions for cases where the predictions of the model were incorrect. The same features were considered, but their combined contributions led to an incorrect prediction. This plot helped identify which features might have been misinterpreted by the model; C: Decision plot for accurately predicted patients shows how the predictive score of the model changed as each feature was considered. The cumulative impact of features such as portal vein speed, spleen width and spleen stiffness led to a correct prediction. Each point on the line represents the contribution of an additional feature to the final score; D: Decision plot for inaccurately predicted patients illustrates the cumulative effect of each feature for patients with incorrect predictions. Despite the inclusion of significant features, the cumulative contributions did not lead to an accurate prediction. This helped identify potential areas for model improvement. spwide: Spleen width; PT: Prothrombin time; pv: Portal vein; spv: Splenic vein; splong: Spleen length; Alb: Albumin; pvspeed: Portal vein speed; INR: International normalized ratio.
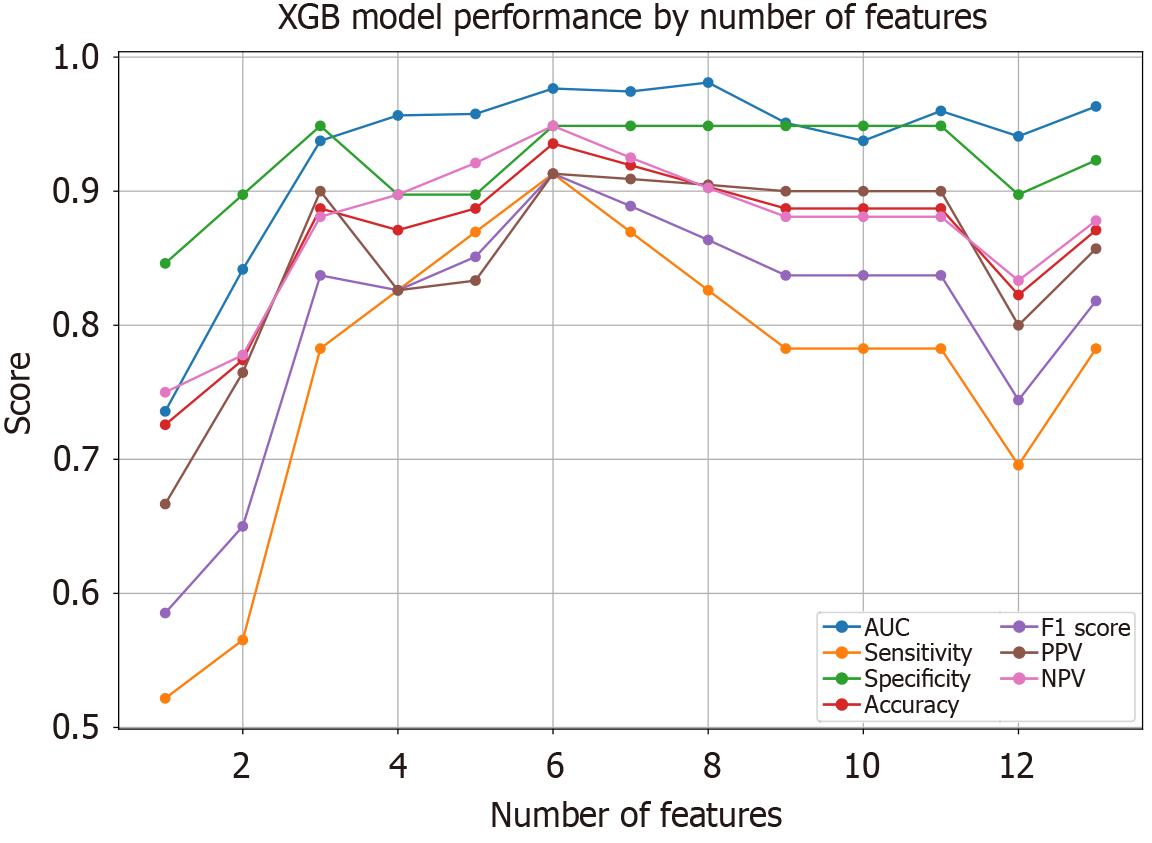
Figure 7 The changes in various predictive metrics for the extreme gradient boosting model when using different numbers of variables.
It was observed that the model achieved an optimal area under the curve with just four variables. XGB: Extreme gradient boosting; AUC: Area under the curve; PPV: Positive predictive value; NPV: Negative predictive value.
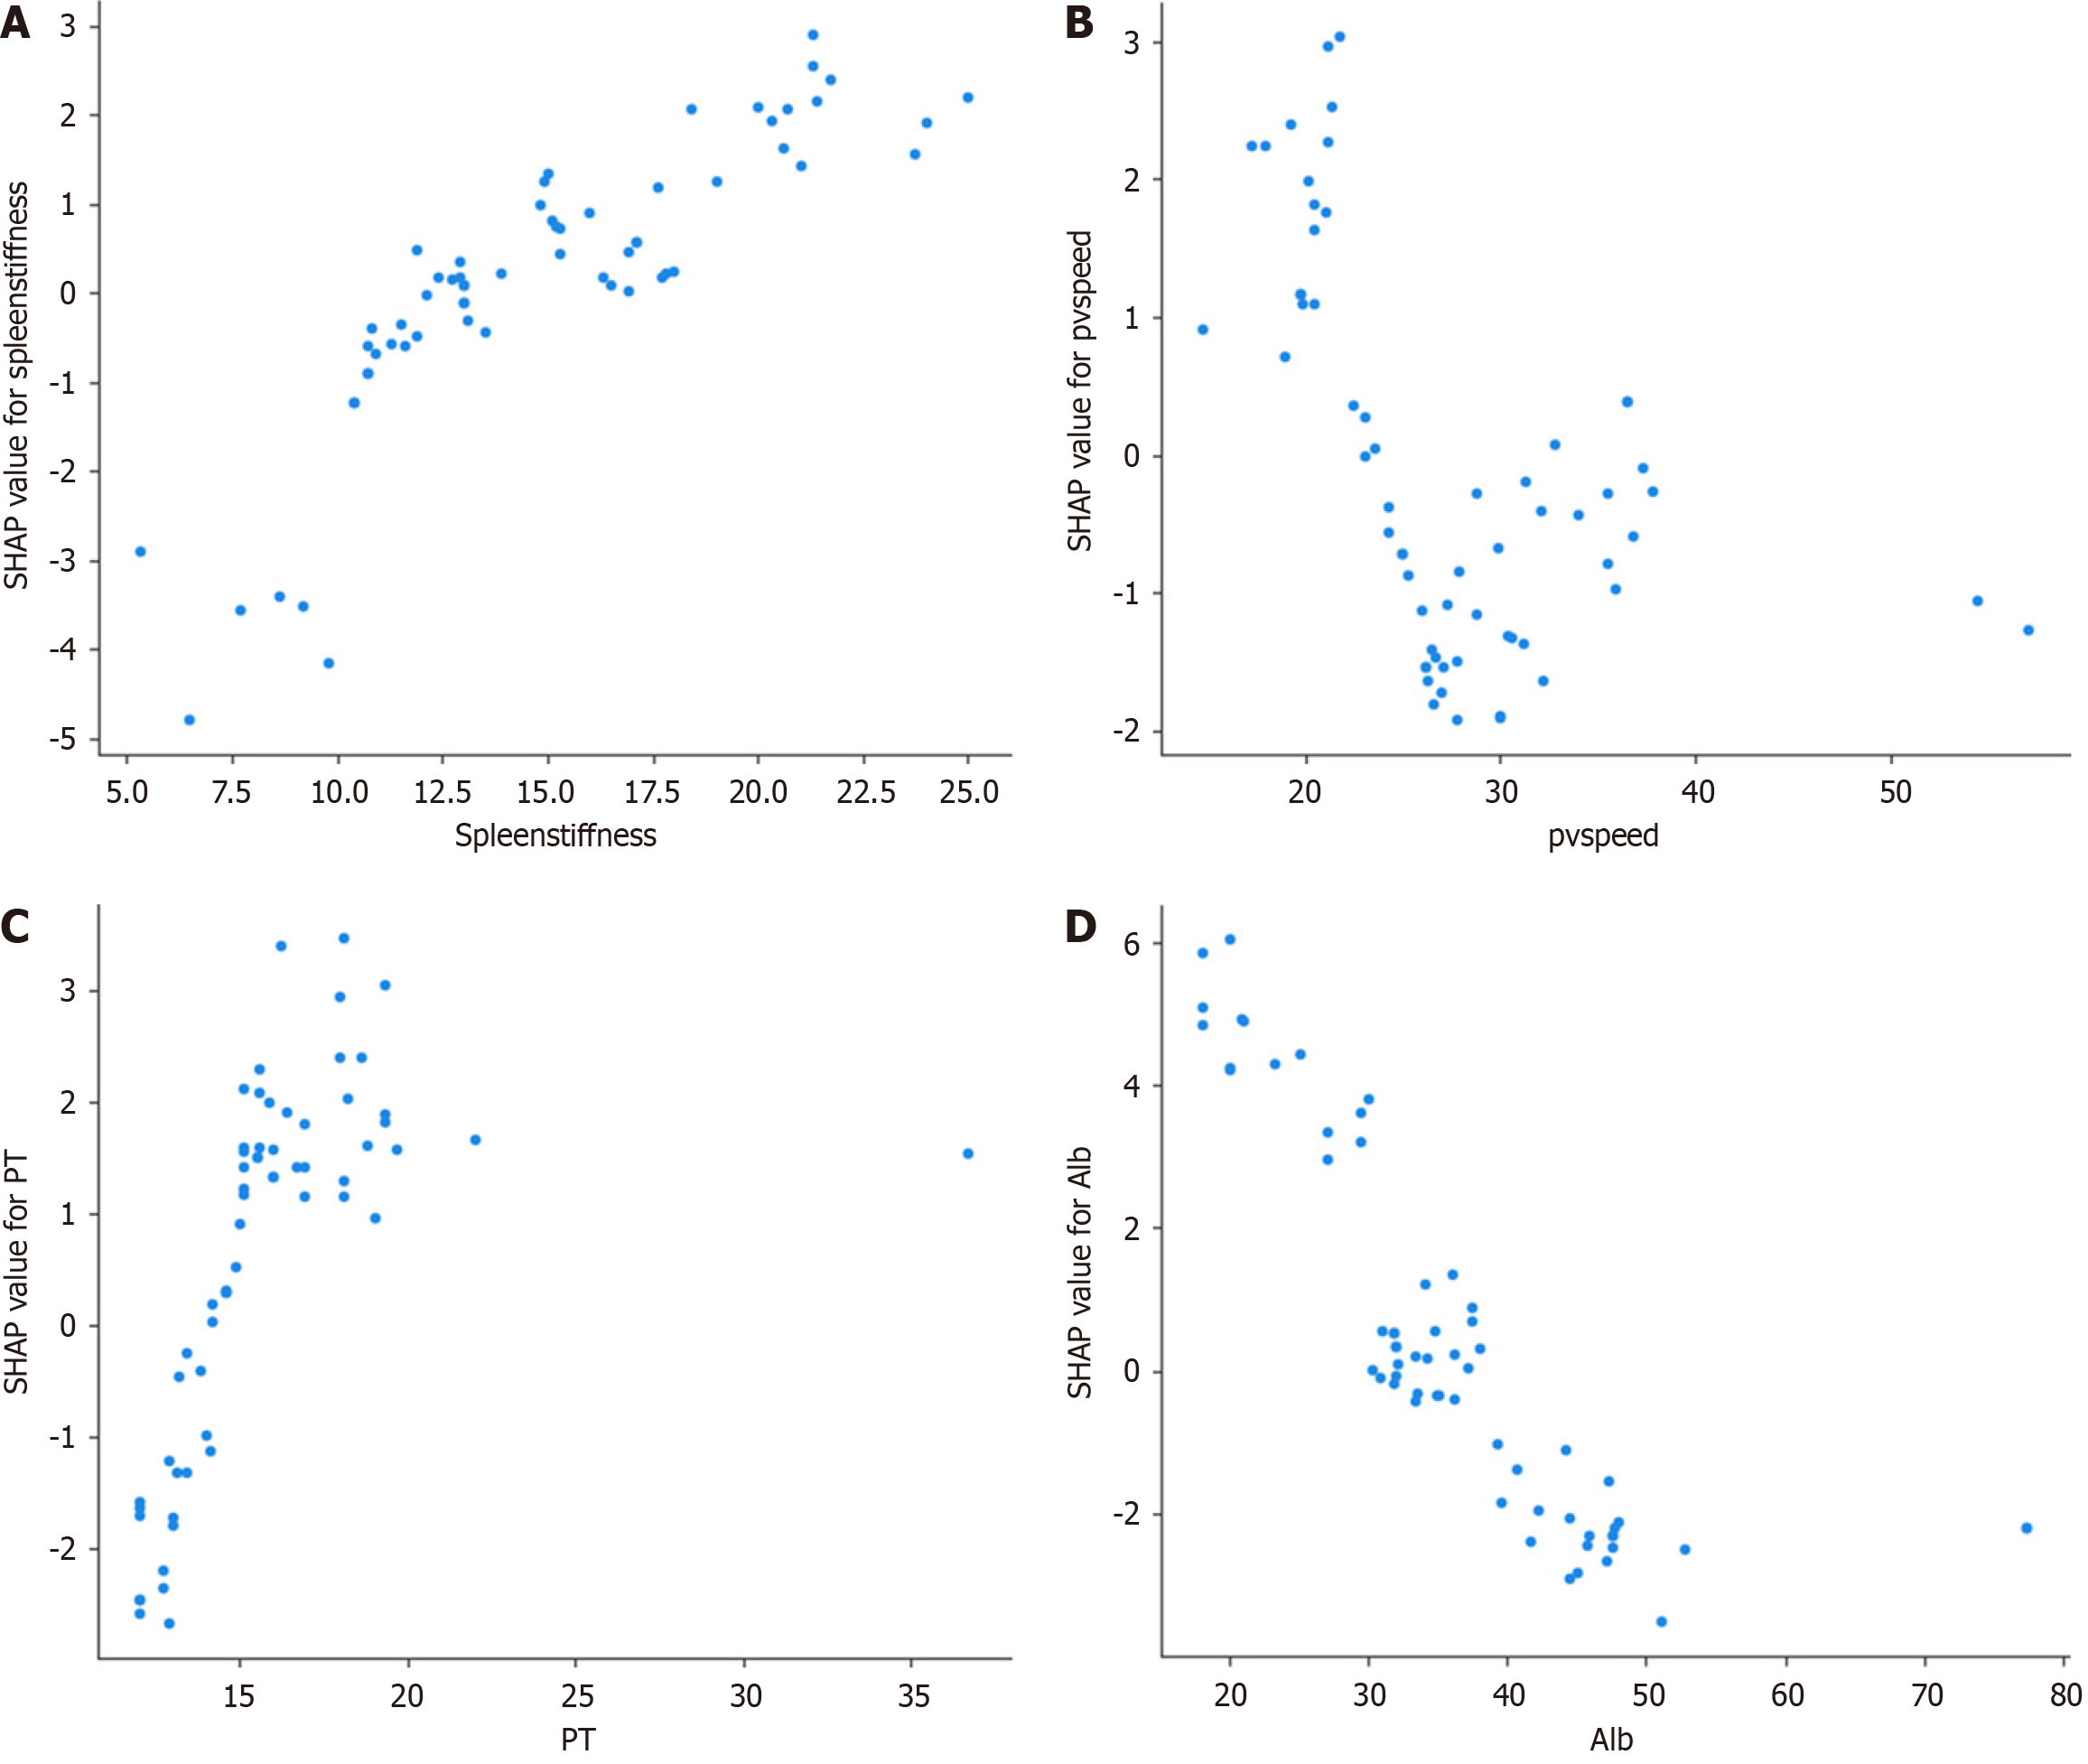
Figure 8 SHapley Additive exPlanation dependency plots for key predictive features.
This figure illustrates the SHapley Additive exPlanation (SHAP) dependency plots for key predictive features, showing how each feature influenced the predictions of the model for esophagogastric varices (EGVs). A: Relationship between spleen stiffness and its SHAP value, revealing a positive correlation where higher spleen stiffness increased the predictive score for EGVs; B: Relationship between portal vein speed and its SHAP value, indicating a negative correlation, with higher speed decreasing the predictive score; C: Relationship between prothrombin time and its SHAP value, where higher PT values were associated with higher SHAP values, suggesting an increased predictive score for EGV; D: Relationship between albumin levels and their SHAP values, showing a negative correlation where higher albumin levels decrease the predictive score. These SHAP dependency plots provide a comprehensive visualization of how individual features affected the predictions of the extreme gradient boosting model, highlighting the most influential factors in predicting high-risk EGVs and aiding in understanding the decision-making process of the model. pvspeed: Portal vein speed; PT: Prothrombin time; Alb: Albumin.
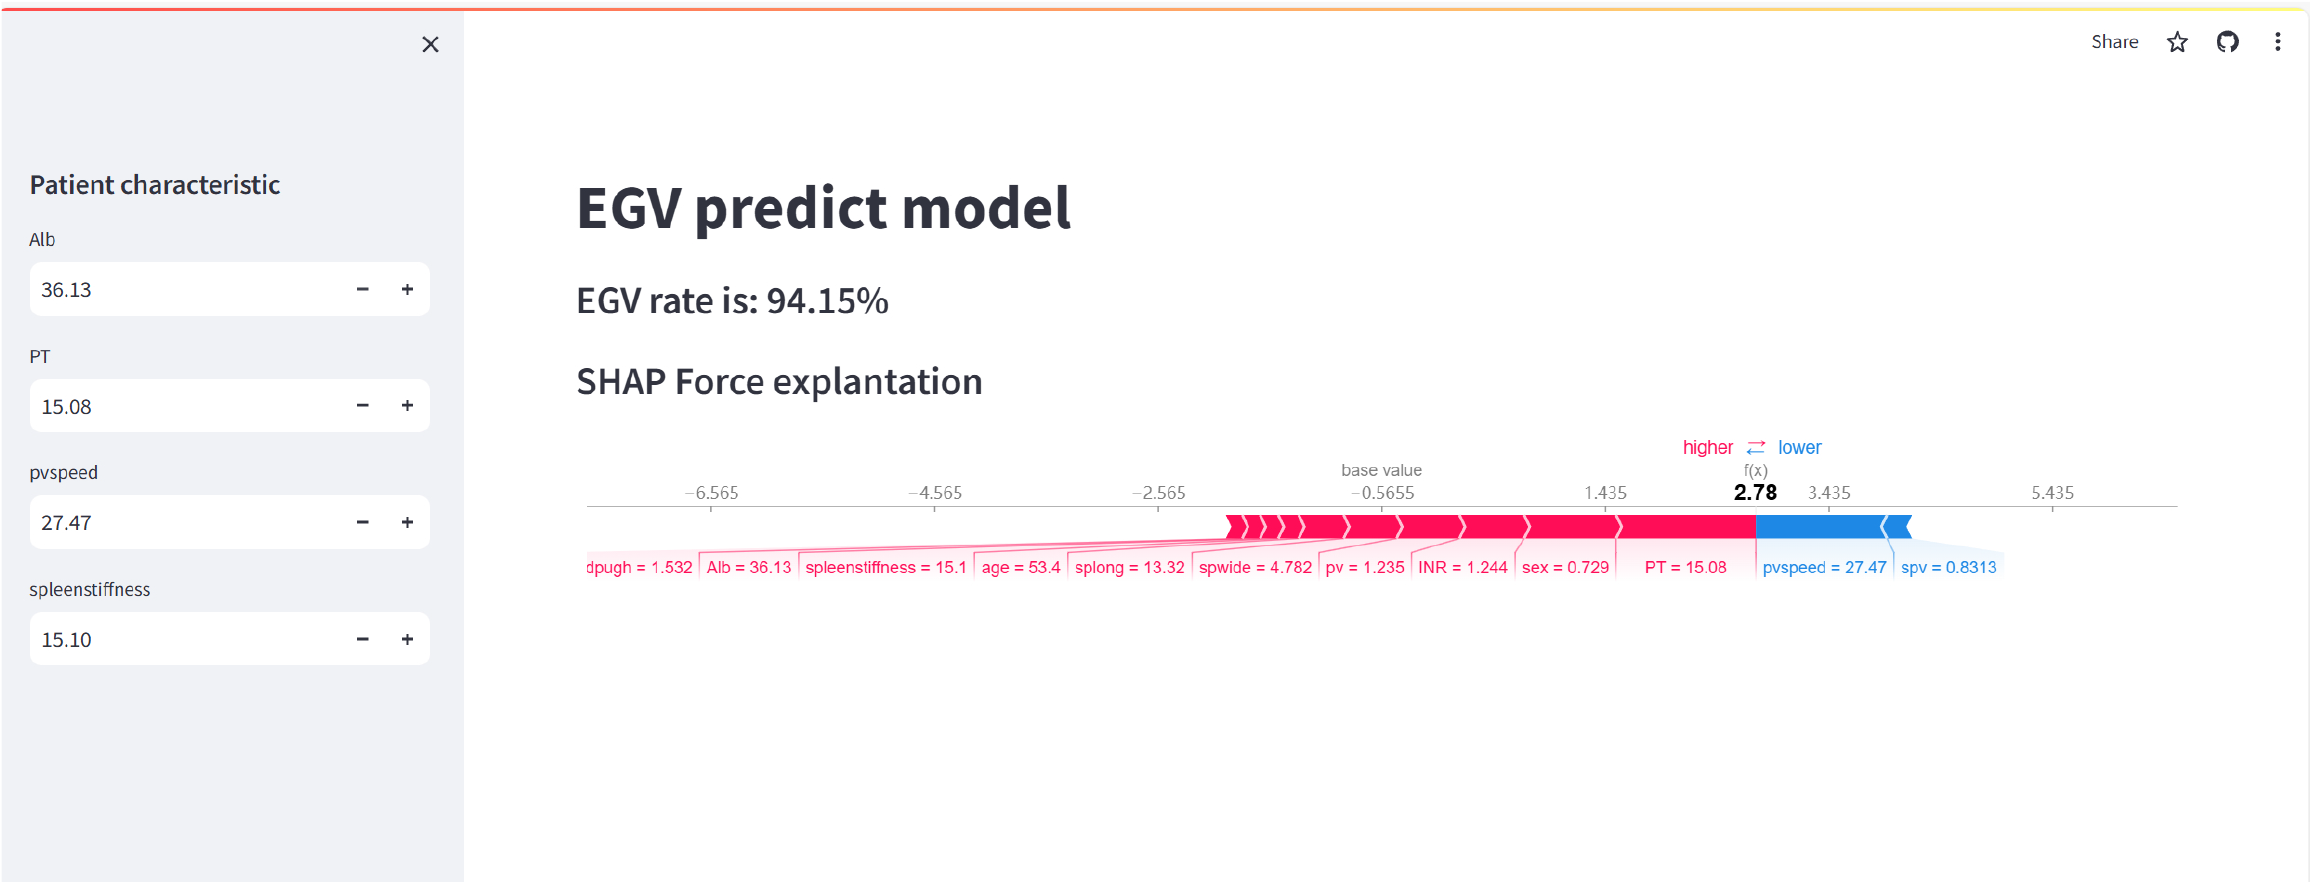
Figure 9 Web-based predictive model.
The image displays a web-based application for predicting esophagogastric varices (EGVs) using the extreme gradient boosting model. The left side of the interface allowed users to input patient characteristics, such as albumin, prothrombin time, portal vein speed and spleen stiffness. These input fields could be adjusted to reflect the specific values for each patient. The main part of the interface shows the prediction of the model, with the EGV risk rate given as 94.15%. Below this, the SHapley Additive exPlanation force plot provides an explanation of the prediction. The force plot visually represents the contribution of each feature to the final predictive score. Features such as spleen stiffness, prothrombin time and portal vein speed are highlighted, showing how they made the prediction higher or lower. The pink bars indicate features that increased the predictive score (higher risk), while blue bars indicate features that decreased it (lower risk). This tool helps clinicians understand the risk factors contributing to EGVs for individual patients by providing a clear and interactive explanation of the predictions of the model. The SHapley Additive exPlanation force plot ensures transparency in the decision-making process, making it easier for healthcare providers to trust and act on the predictions. EGV: Esophagogastric varices; Alb: Albumin; PT: Prothrombin time; pvspeed: Portal vein speed; spwide: Spleen width; pv: Portal vein; spv: Splenic vein; splong: Spleen length; INR: International normalized ratio.
- Citation: Feng SY, Ding ZR, Cheng J, Tu HB. Noninvasive prediction of esophagogastric varices in hepatitis B: An extreme gradient boosting model based on ultrasound and serology. World J Gastroenterol 2025; 31(13): 104697
- URL: https://www.wjgnet.com/1007-9327/full/v31/i13/104697.htm
- DOI: https://dx.doi.org/10.3748/wjg.v31.i13.104697


