Copyright
©The Author(s) 2025.
World J Gastroenterol. Apr 7, 2025; 31(13): 102527
Published online Apr 7, 2025. doi: 10.3748/wjg.v31.i13.102527
Published online Apr 7, 2025. doi: 10.3748/wjg.v31.i13.102527
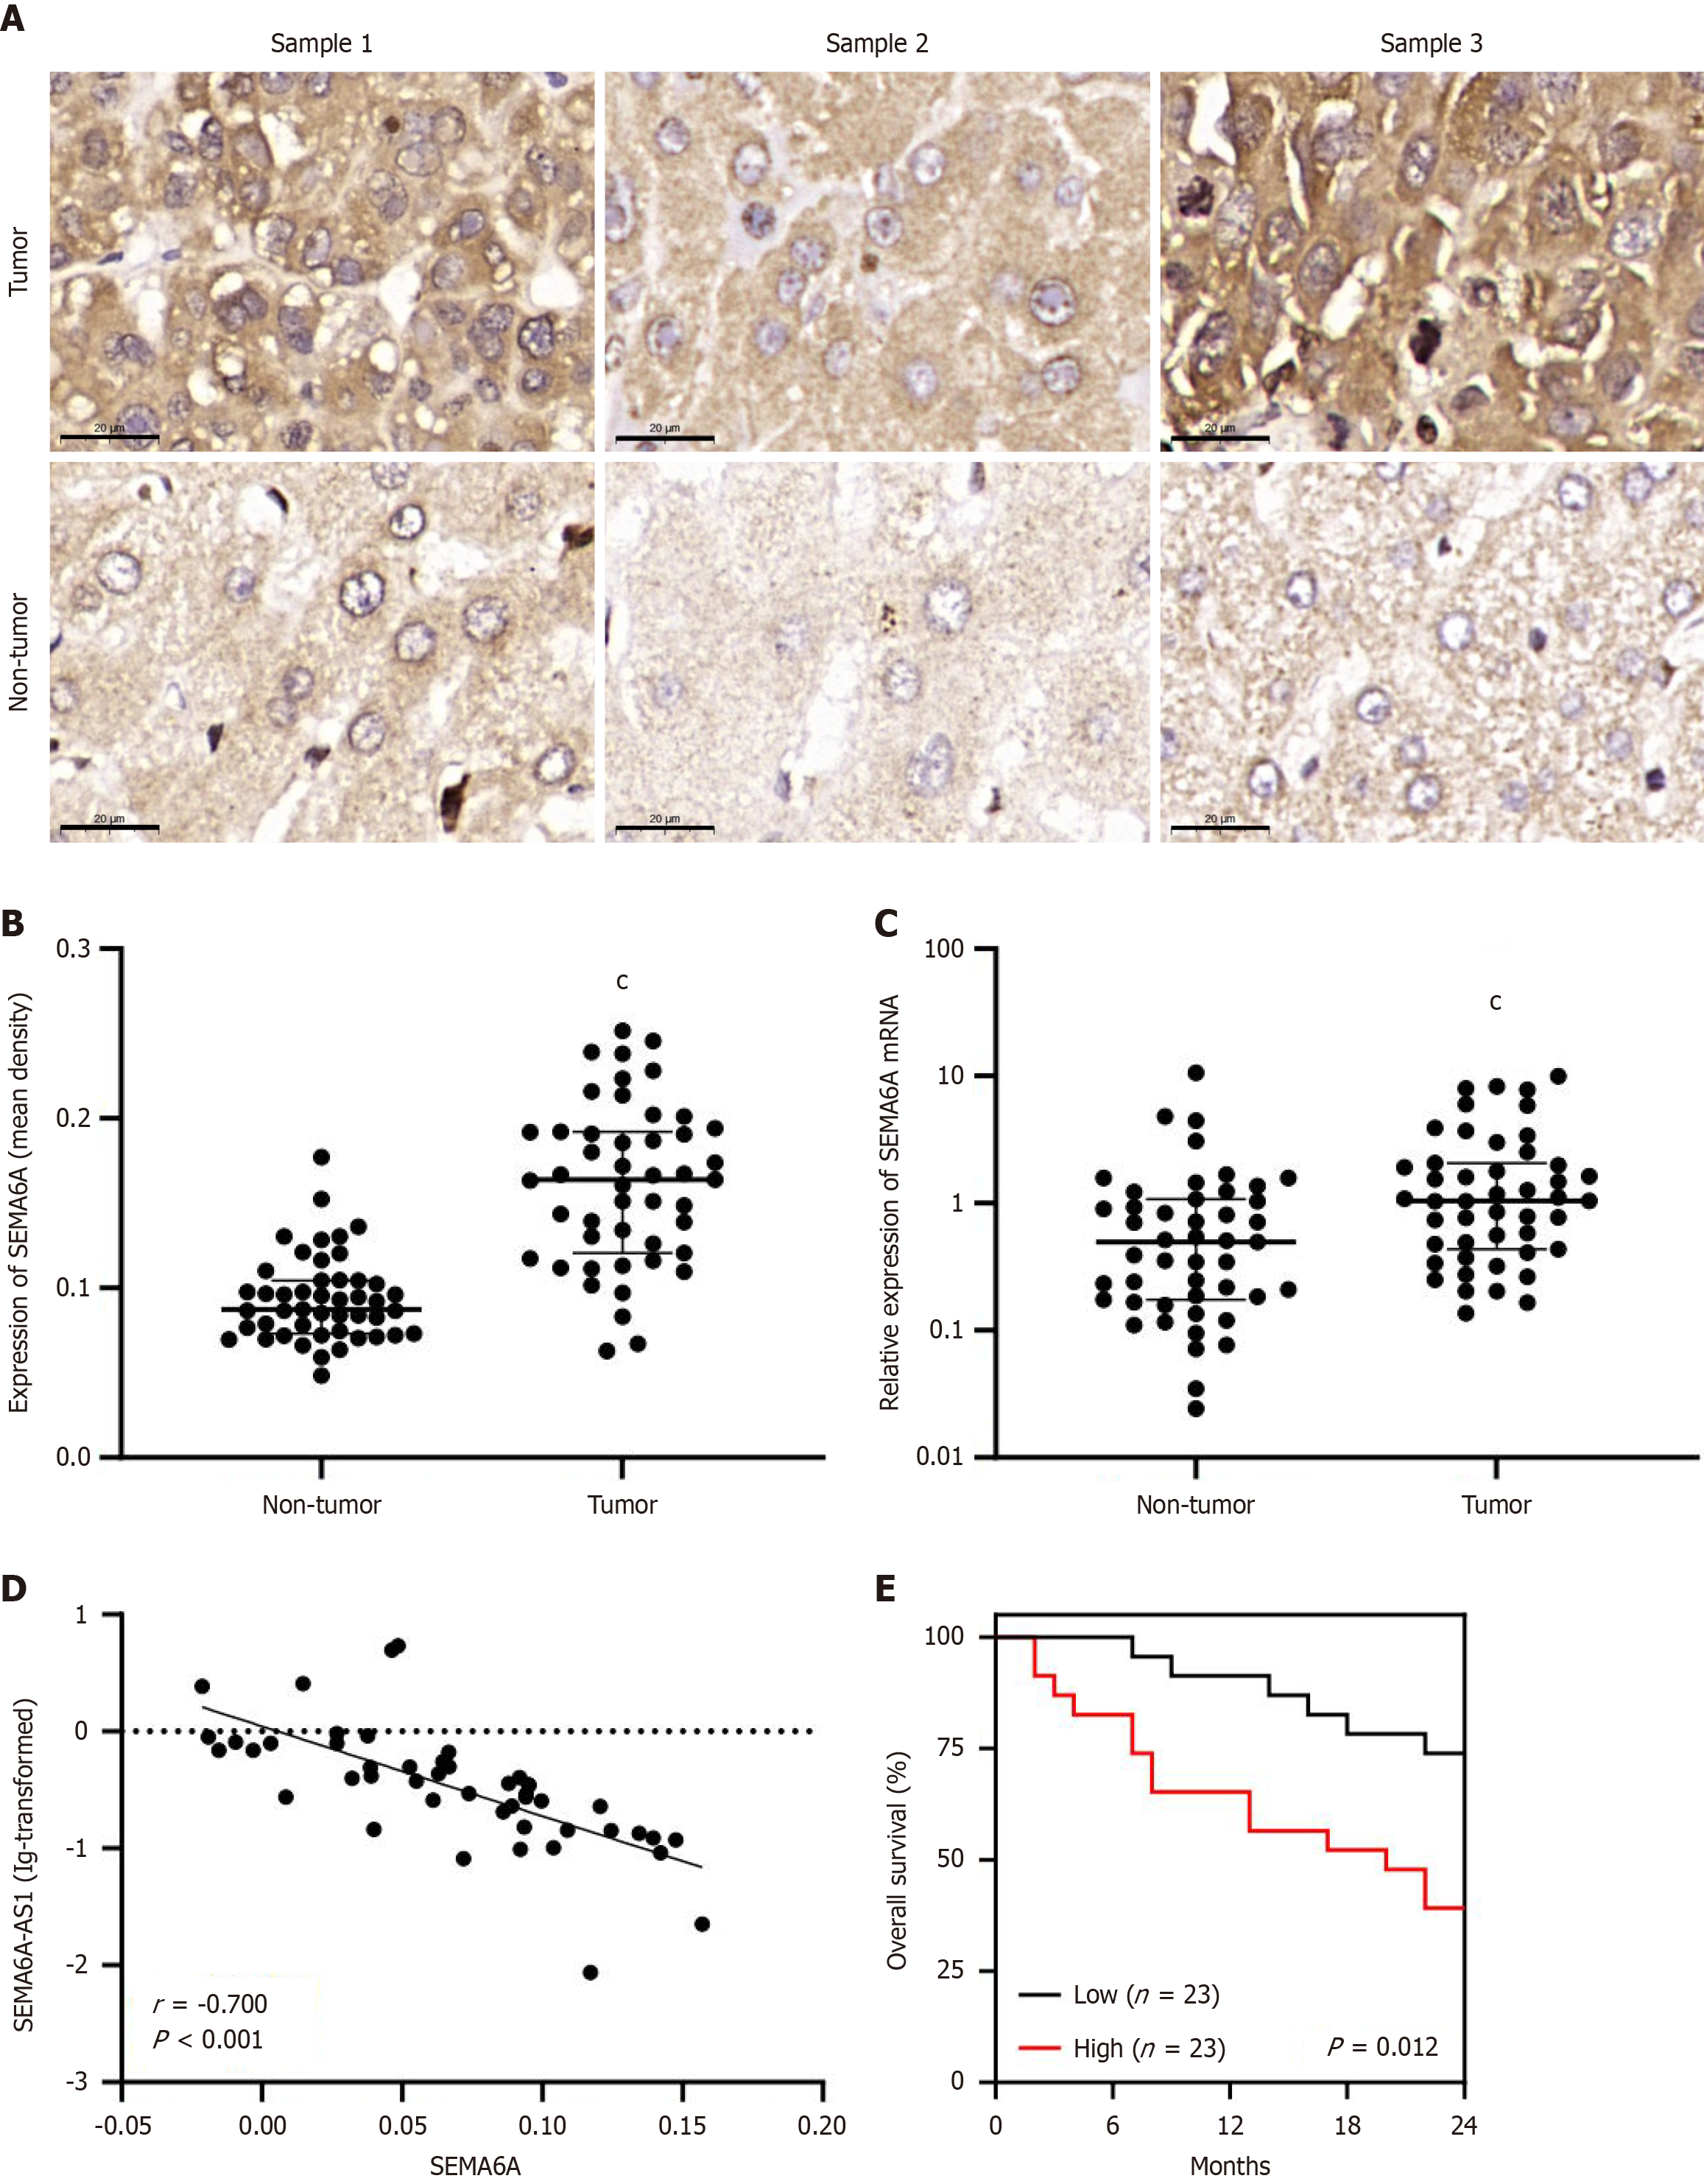
Figure 1 Semaphorin 6A is upregulated in hepatocellular carcinoma and negatively correlated with semaphorin 6A-antisense RNA 1.
A: Immunohistochemistry images of semaphorin 6A (SEMA6A) in tumor and adjacent non-tumor tissues from hepatitis B virus (HBV)-related hepatocellular carcinoma (HCC) patients (n = 47, 3 samples, scale bars indicate 20 μm); B: Quantitative analysis of immunohistochemical results; C: Relative expression of SEMA6A mRNA (tumor/non-tumor) in 47 pairs of clinical samples were measured by quantitative polymerase chain reaction; D: The correlation analysis of SEMA6A-AS1 and SEMA6A in HBV-related HCC (n = 47); E: Kaplan-Meier analysis of overall survival based on SEMA6A expression levels in HBV-related HCC patients. The median was used as the cutoff. cP < 0.001. SEMA6A: Semaphorin 6A; AS1: Antisense RNA 1.
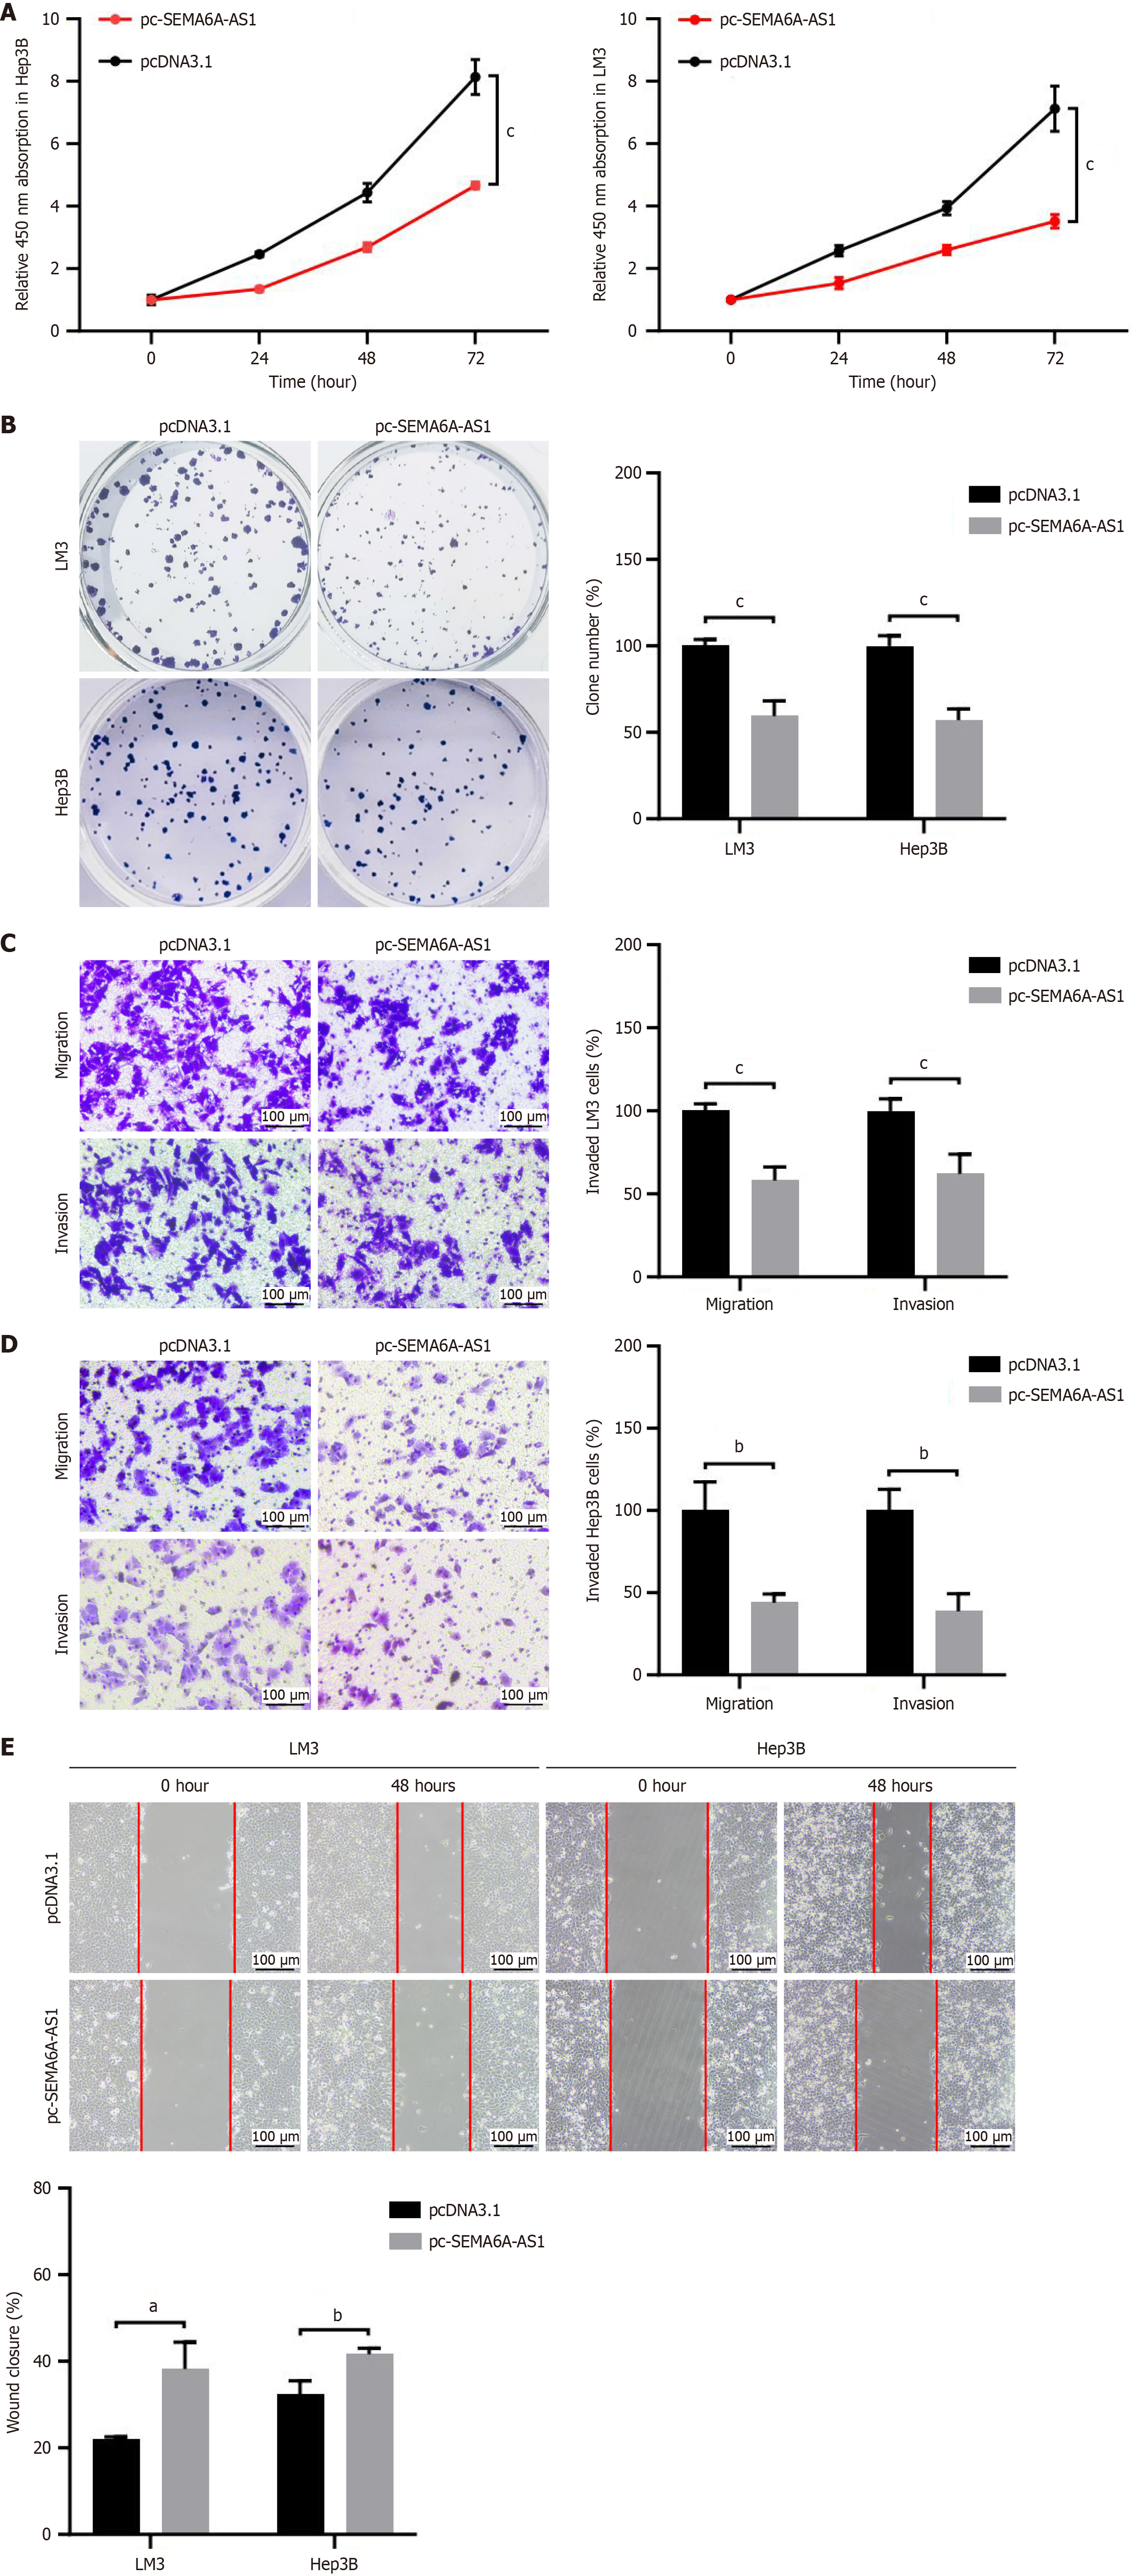
Figure 2 Overexpression of semaphorin 6A-antisense RNA 1 inhibits proliferation, migration and invasion of hepatocellular carcinoma cells.
A and B: Cell proliferation in Hep3B and LM3 cells stably transfected with pc-semaphorin 6A-antisense RNA 1 (pc-SEMA6A-AS1) or pcDNA3.1 plasmid were analyzed by Cell Counting Kit-8 assay (A) and colony formation assay (B); C and D: Transwell assay with or without Matrigel were visualized (left panel) and quantified (right panel) in pc-SEMA6A-AS1 or pcDNA3.1 plasmid stably transfected LM3 (C) and Hep3B (D) cell lines to analyze cell invasion or migration capability; E: Wound healing assays in pc-SEMA6A-AS1 or pcDNA3.1 plasmid stably transfected LM3 and Hep3B cell lines were visualized (left panel) and quantified (right panel) to assess cell migration ability. aP < 0.05, bP < 0.01, cP < 0.001. SEMA6A-AS1: Semaphorin 6A-antisense RNA 1.
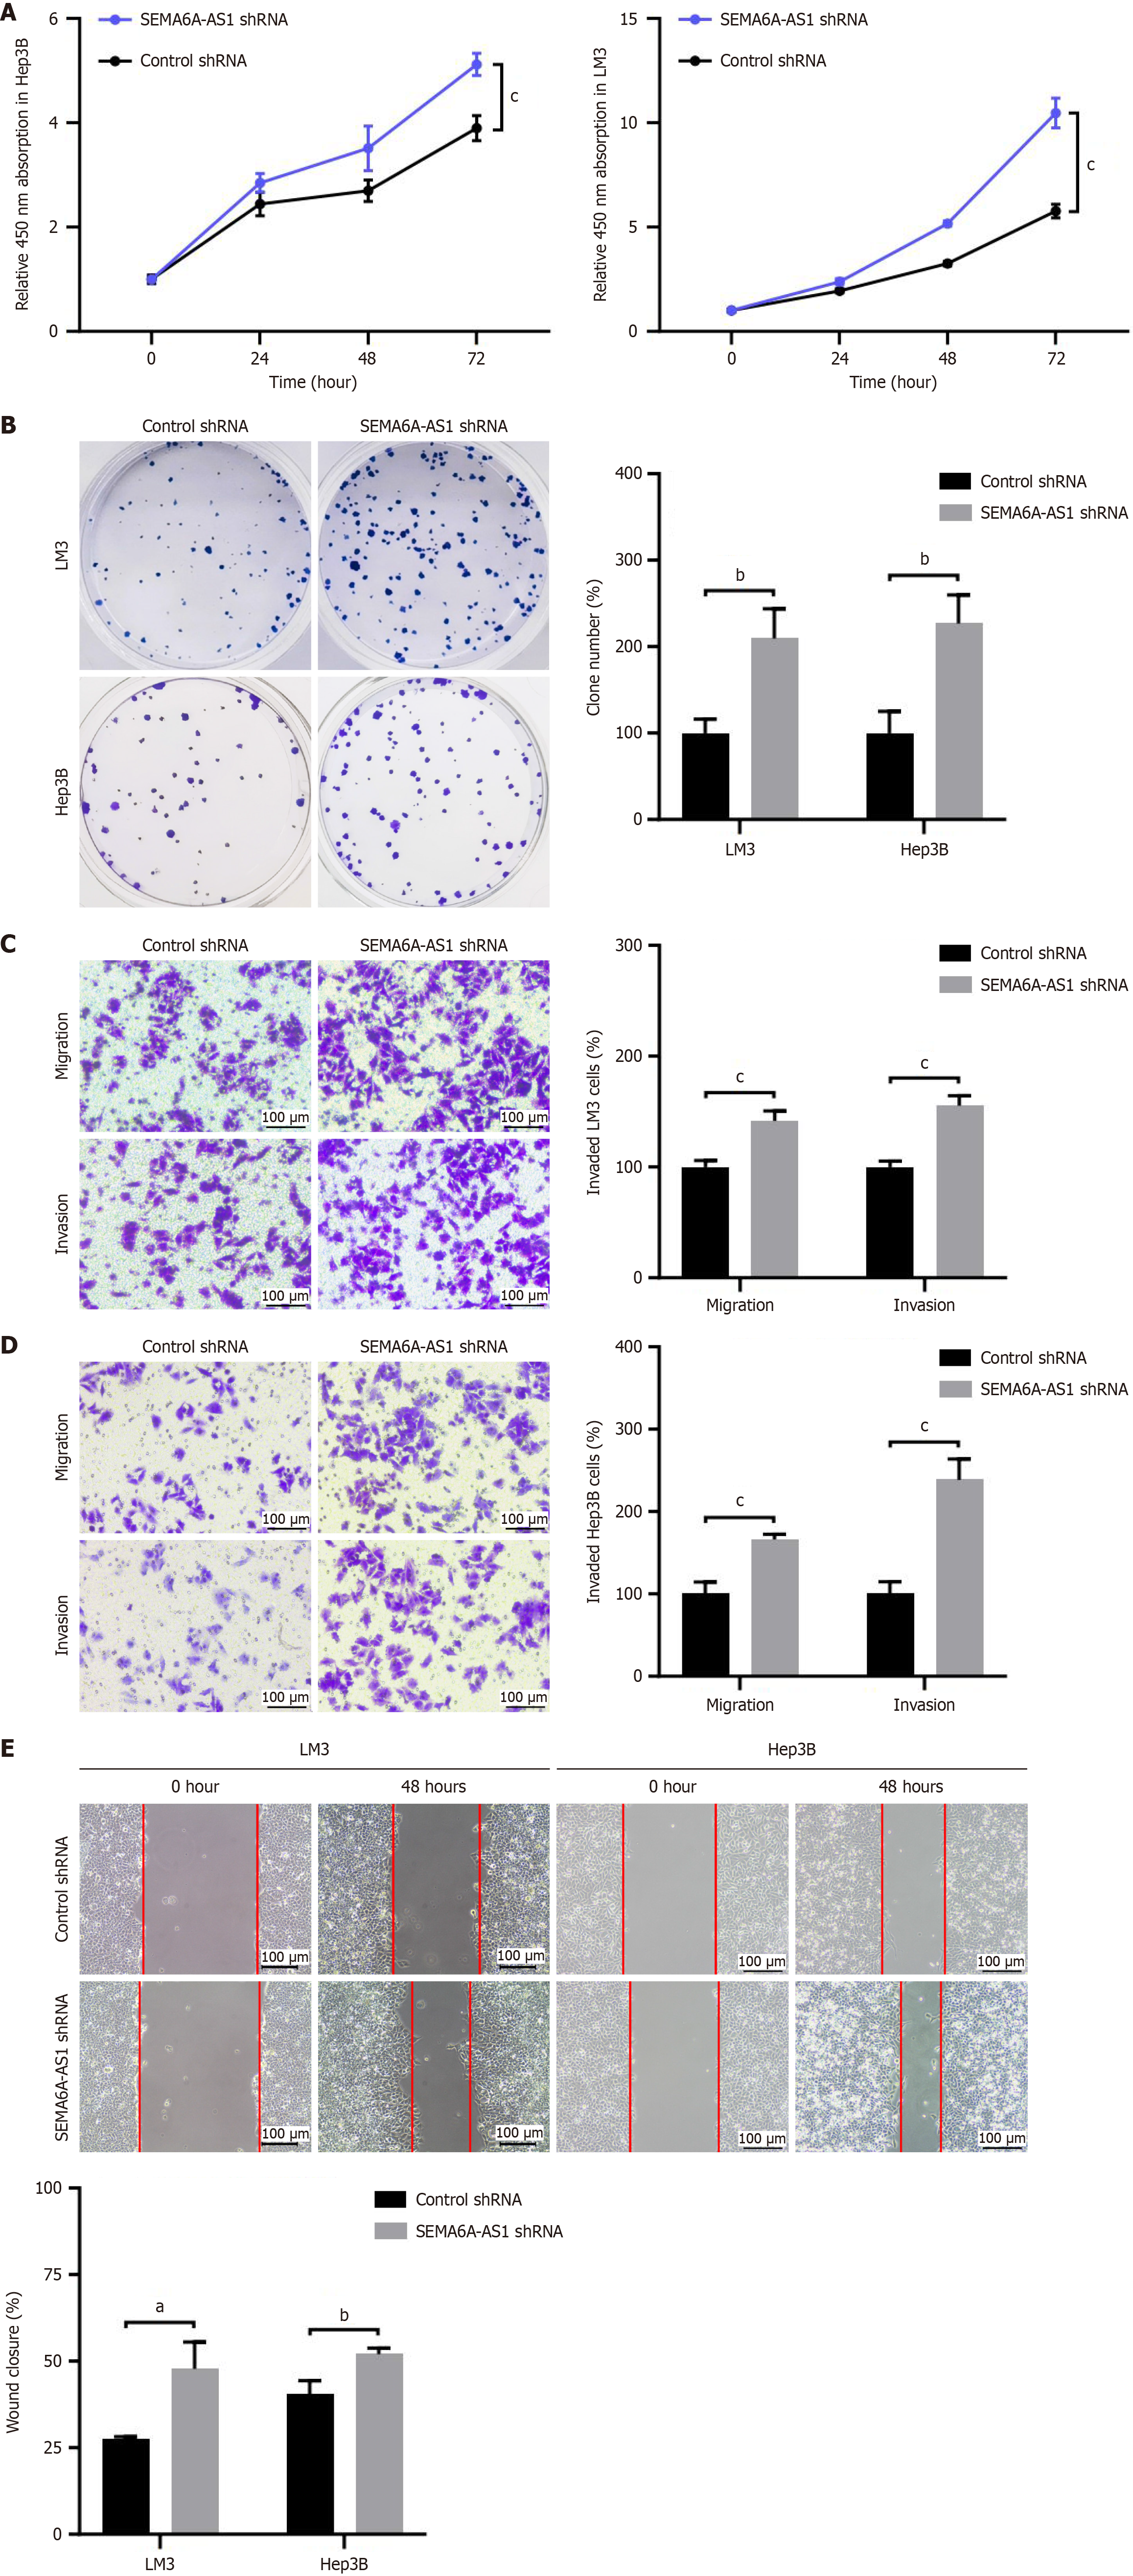
Figure 3 Inhibition of semaphorin 6A-antisense RNA 1 promotes proliferation, migration and invasion of hepatocellular carcinoma cells.
A and B: Proliferation of Hep3B and LM3 cells stably transfected with semaphorin 6A-antisense RNA 1 (SEMA6A-AS1) short hairpin RNAs (shRNA) or control shRNA were analyzed by Cell Counting Kit-8 assay (A) and colony formation assay (B); C and D: Transwell assay with or without Matrigel were visualized (left panel) and quantified (right panel) in SEMA6A-AS1 shRNA or control shRNA stably transfected LM3 (C) and Hep3B (D) cell lines to analyze cell invasion or migration capability; E: Wound healing assays in SEMA6A-AS1 shRNA or control shRNA stably transfected LM3 and Hep3B cell lines were visualized (left panel) and quantified (right panel) to assess cell migration ability. aP < 0.05, bP < 0.01, cP < 0.001. SEMA6A-AS1: Semaphorin 6A-antisense RNA 1; shRNA: Short hairpin RNAs.
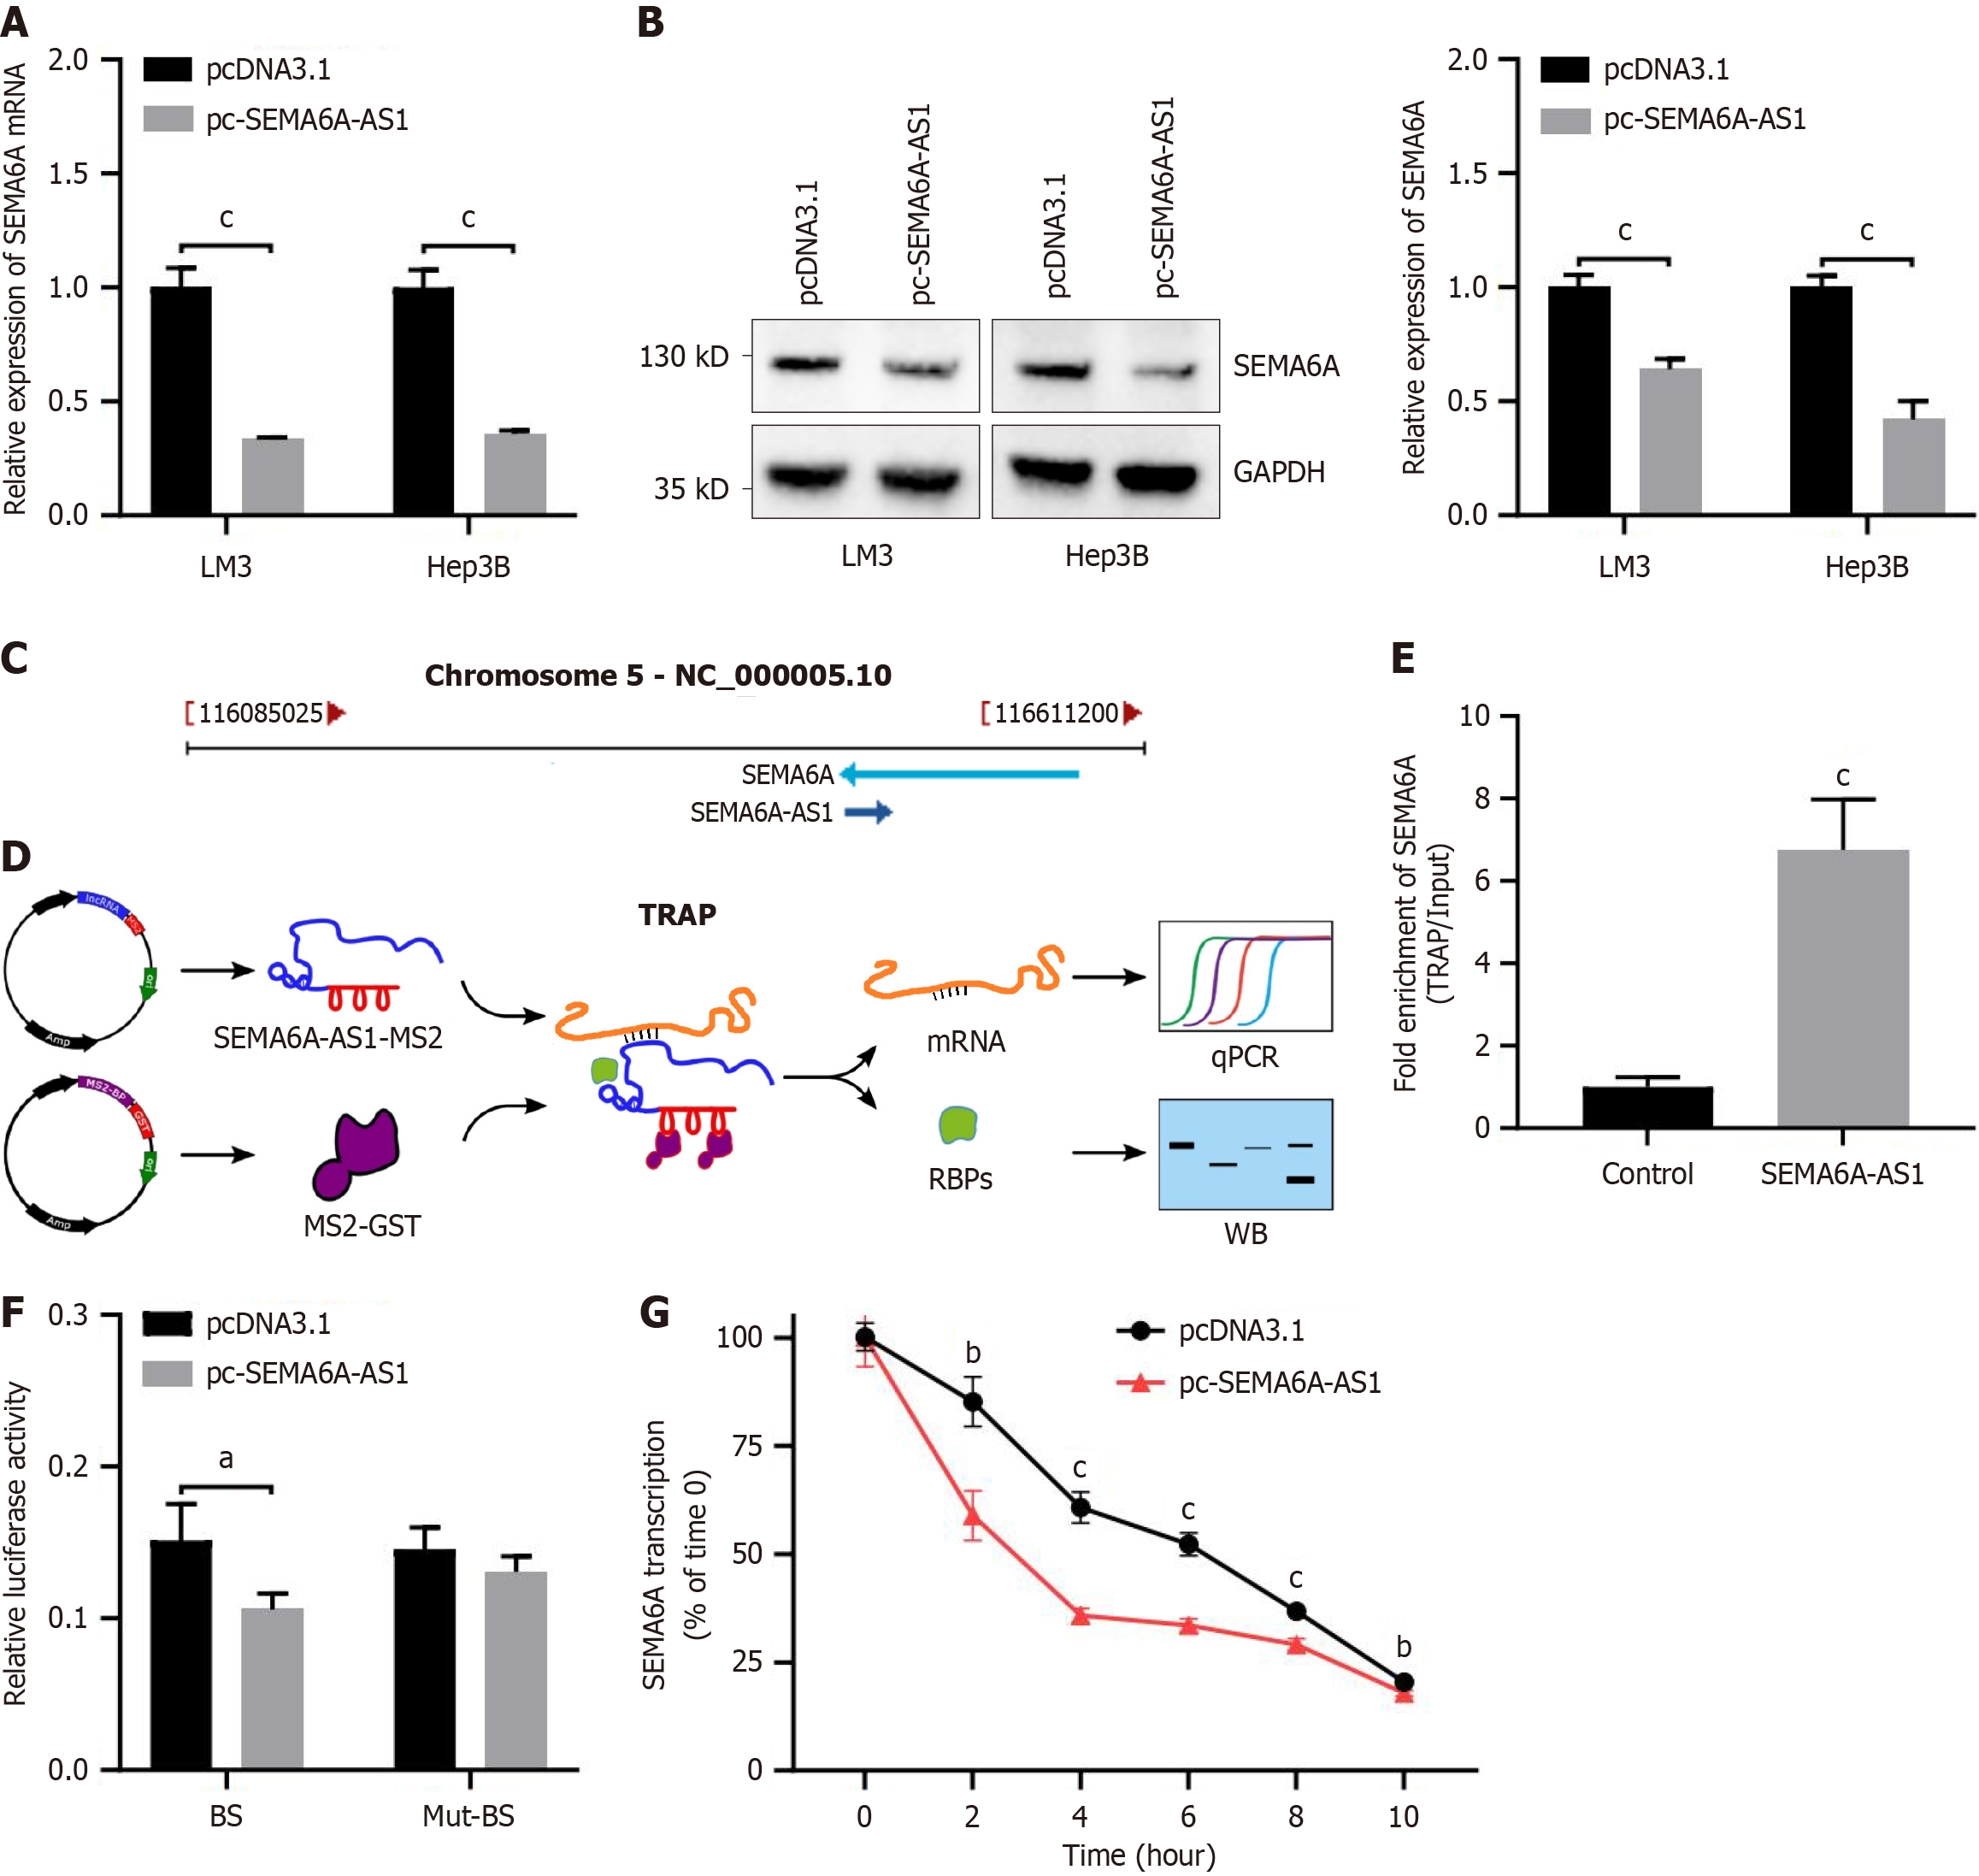
Figure 4 Semaphorin 6A-antisense RNA 1 combined with semaphorin 6A mRNA downregulates semaphorin 6A expression.
A and B: The expression levels of semaphorin 6A (SEMA6A) in Hep3B and LM3 cells stably transfected with pc-SEMA6A-AS1 or pcDNA3.1 plasmid were assessed by quantitative polymerase chain reaction (qPCR) for mRNA (A) and Western blot for protein (B); C: Transcript location of SEMA6A-AS1 and SEMA6A; D: Schematic of the tagged RNA affinity purification experiment; E: The level of SEMA6A mRNA in RNAs obtained by tagged RNA affinity purification experiment was analyzed by qPCR; F: The direct binding of SEMA6A-AS1 and SEMA6A mRNA in Hep3B cells was assayed by luciferase activity with luciferase reporter vector containing the binding site or mutant-form binding site; G: The levels of remaining SEMA6A mRNA at each timepoints after actinomycin D treatment were detected by qPCR. aP < 0.05, bP < 0.01, cP < 0.001. SEMA6A: Semaphorin 6A; TRAP: Tagged RNA affinity purification; Mut-BS: Mutant-form binding site; GST: Glutathione-S-transferase; RBPs: RNA binding proteins; qPCR: Quantitative polymerase chain reaction.
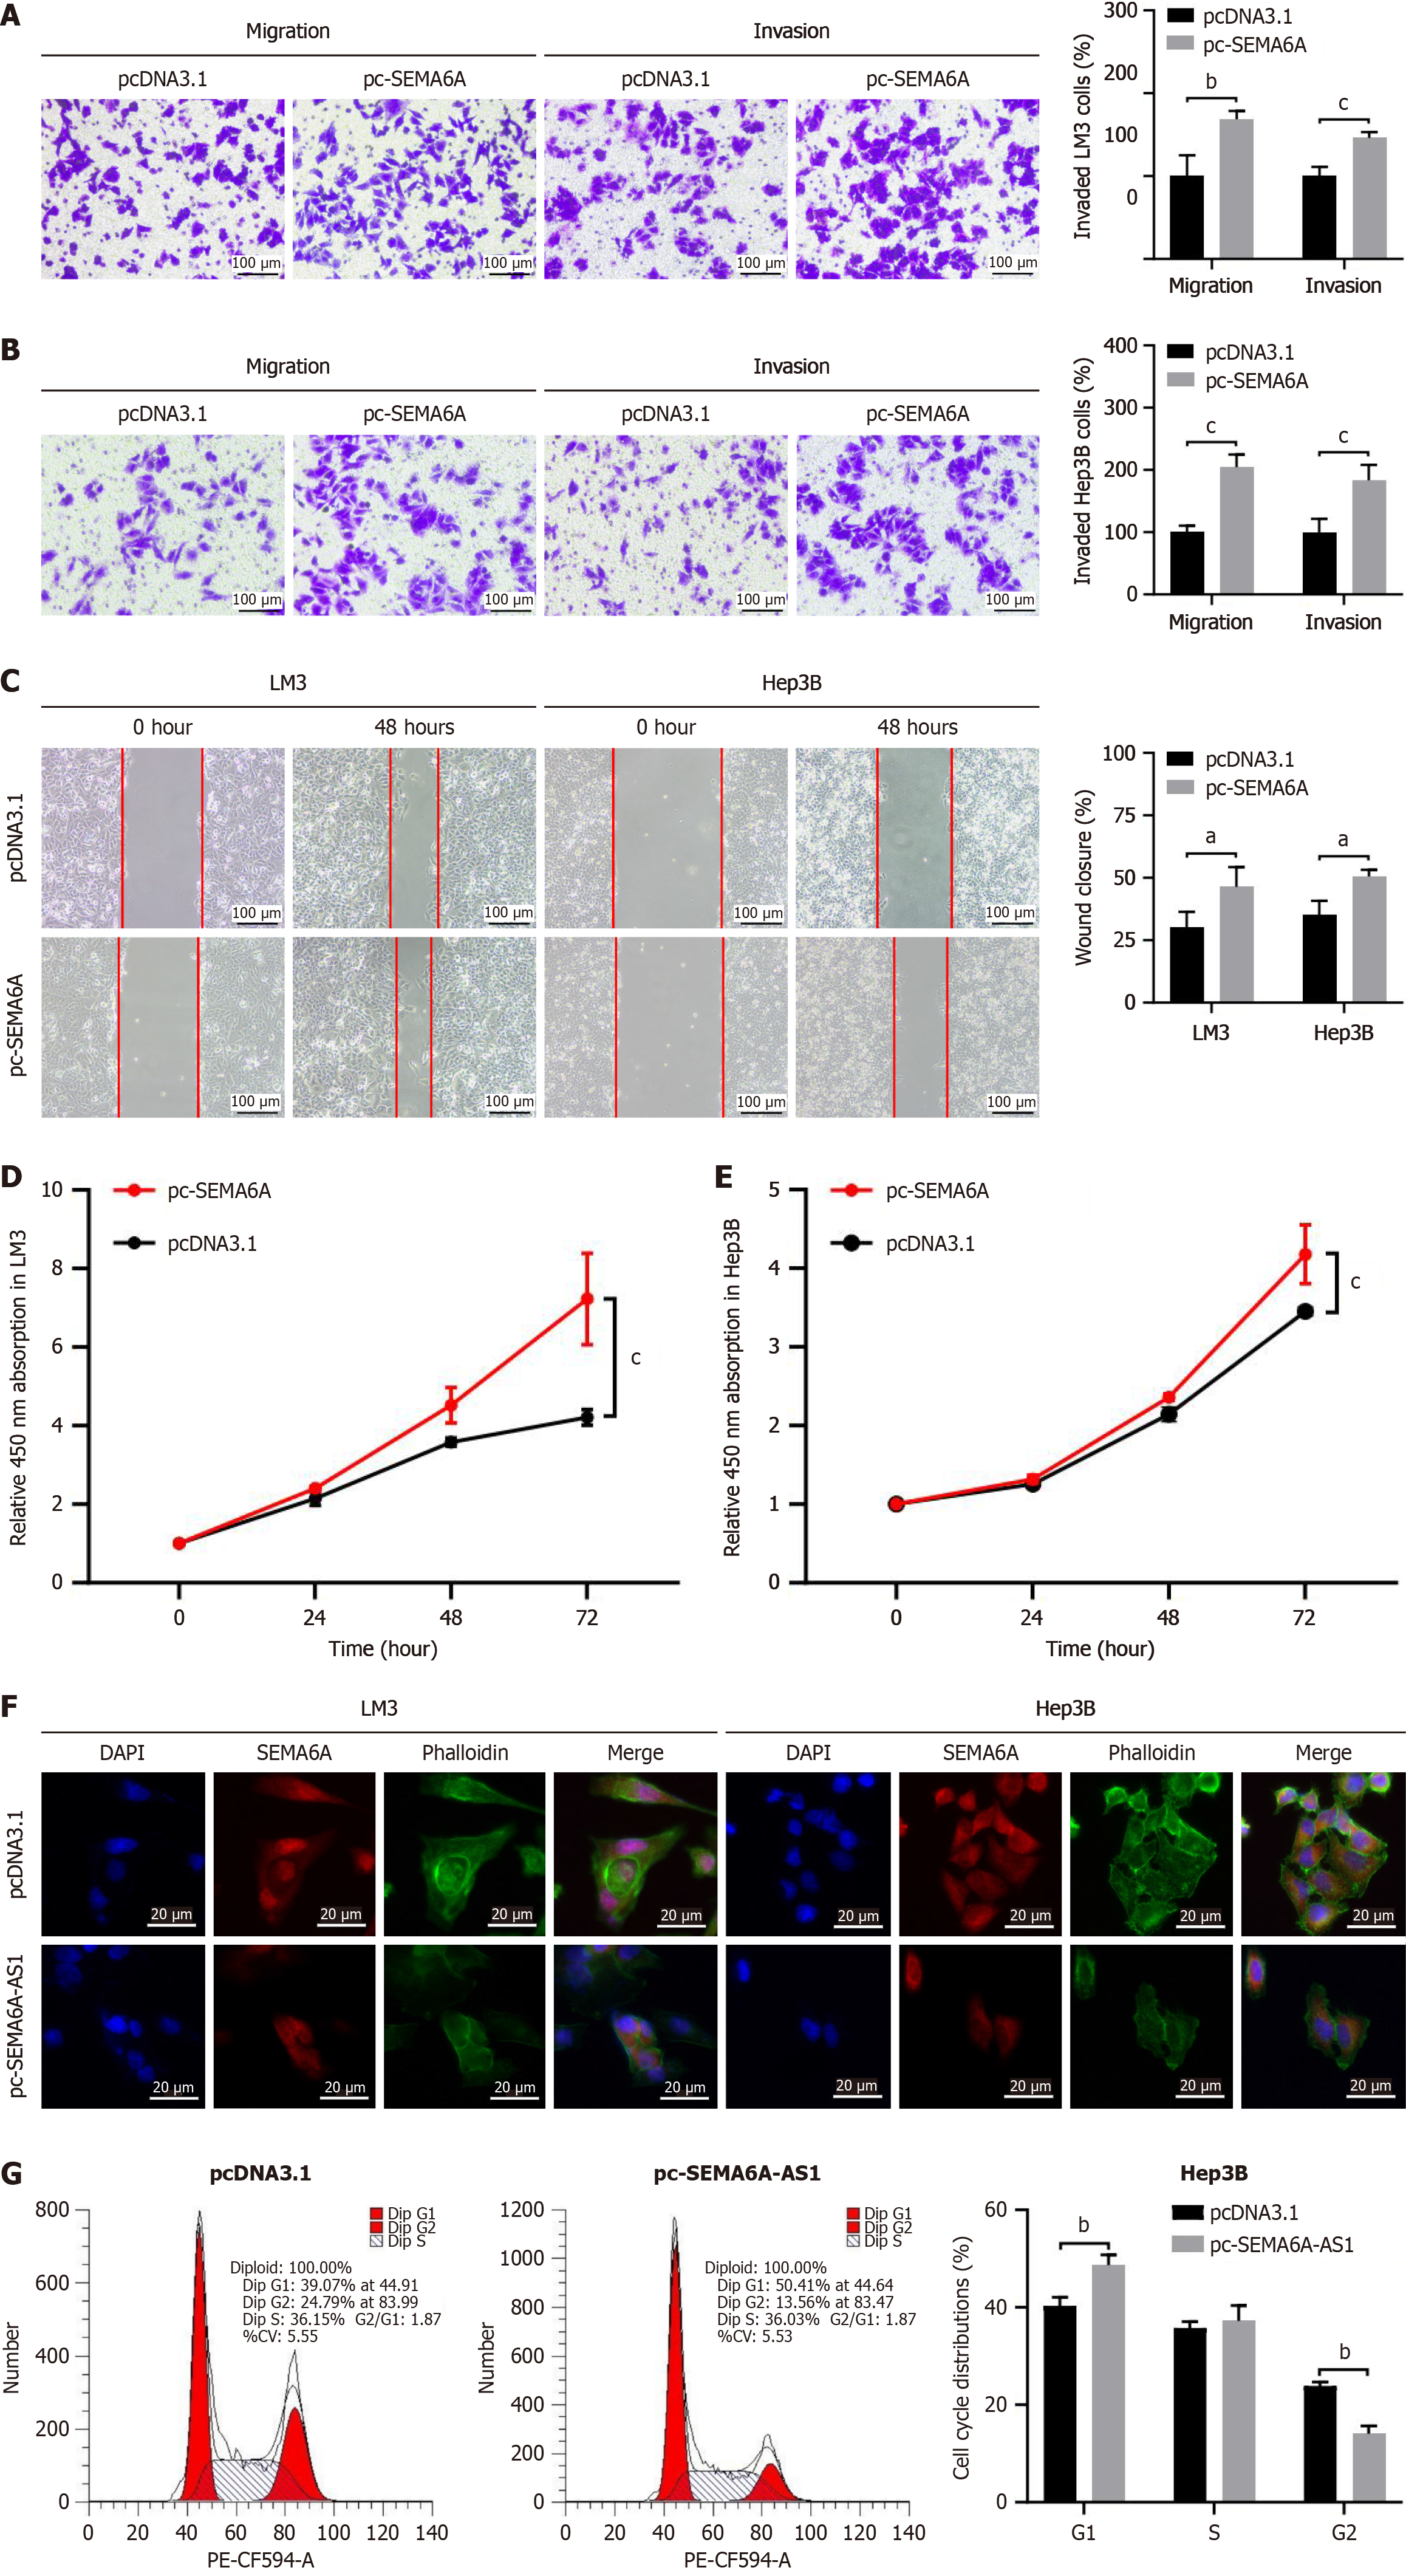
Figure 5 Semaphorin 6A promotes cell proliferation, migration and invasion via regulation of actin cytoskeleton.
A and B: Transwell assay with or without Matrigel were visualized (left panel) and quantified (right panel) in pc-semaphorin 6A (pc-SEMA6A) or pcDNA3.1 plasmid stably transfected LM3 (A) and Hep3B (B) cell lines to analyze cell invasion or migration capability; C: Wound healing assays in pc-SEMA6A or pcDNA3.1 plasmid stably transfected LM3 and Hep3B cell lines were visualized (left panel) and quantified (right panel) to assess cell migration ability; D: Cell proliferation in Hep3B cells stably transfected with pc-SEMA6A or pcDNA3.1 plasmid were analyzed by Cell Counting Kit-8 assay; E: Cell proliferation in LM3 cells stably transfected with pc-SEMA6A or pcDNA3.1 plasmid were analyzed by Cell Counting Kit-8 assay; F: Fluorescence microscopy imaging of SEMA6A (red), actin filaments stained with phalloidin (green) and nuclei stained with DAPI (blue) in LM3 and Hep3B cell lines (Scale bars: 20 μm); G: Flow cytometry assay was performed to analyze the cell cycle progression of pc-SEMA6A-AS1 or pcDNA3.1 plasmid stably transfected Hep3B cells. aP < 0.05, bP < 0.01, cP < 0.001. SEMA6A: Semaphorin 6A.
- Citation: Yu SM, Zhang M, Li SL, Pei SY, Wu L, Hu XW, Duan YK. Long noncoding RNA semaphorin 6A-antisense RNA 1 reduces hepatocellular carcinoma by promoting semaphorin 6A mRNA degradation. World J Gastroenterol 2025; 31(13): 102527
- URL: https://www.wjgnet.com/1007-9327/full/v31/i13/102527.htm
- DOI: https://dx.doi.org/10.3748/wjg.v31.i13.102527


