Copyright
©The Author(s) 2025.
World J Gastroenterol. Apr 7, 2025; 31(13): 100566
Published online Apr 7, 2025. doi: 10.3748/wjg.v31.i13.100566
Published online Apr 7, 2025. doi: 10.3748/wjg.v31.i13.100566
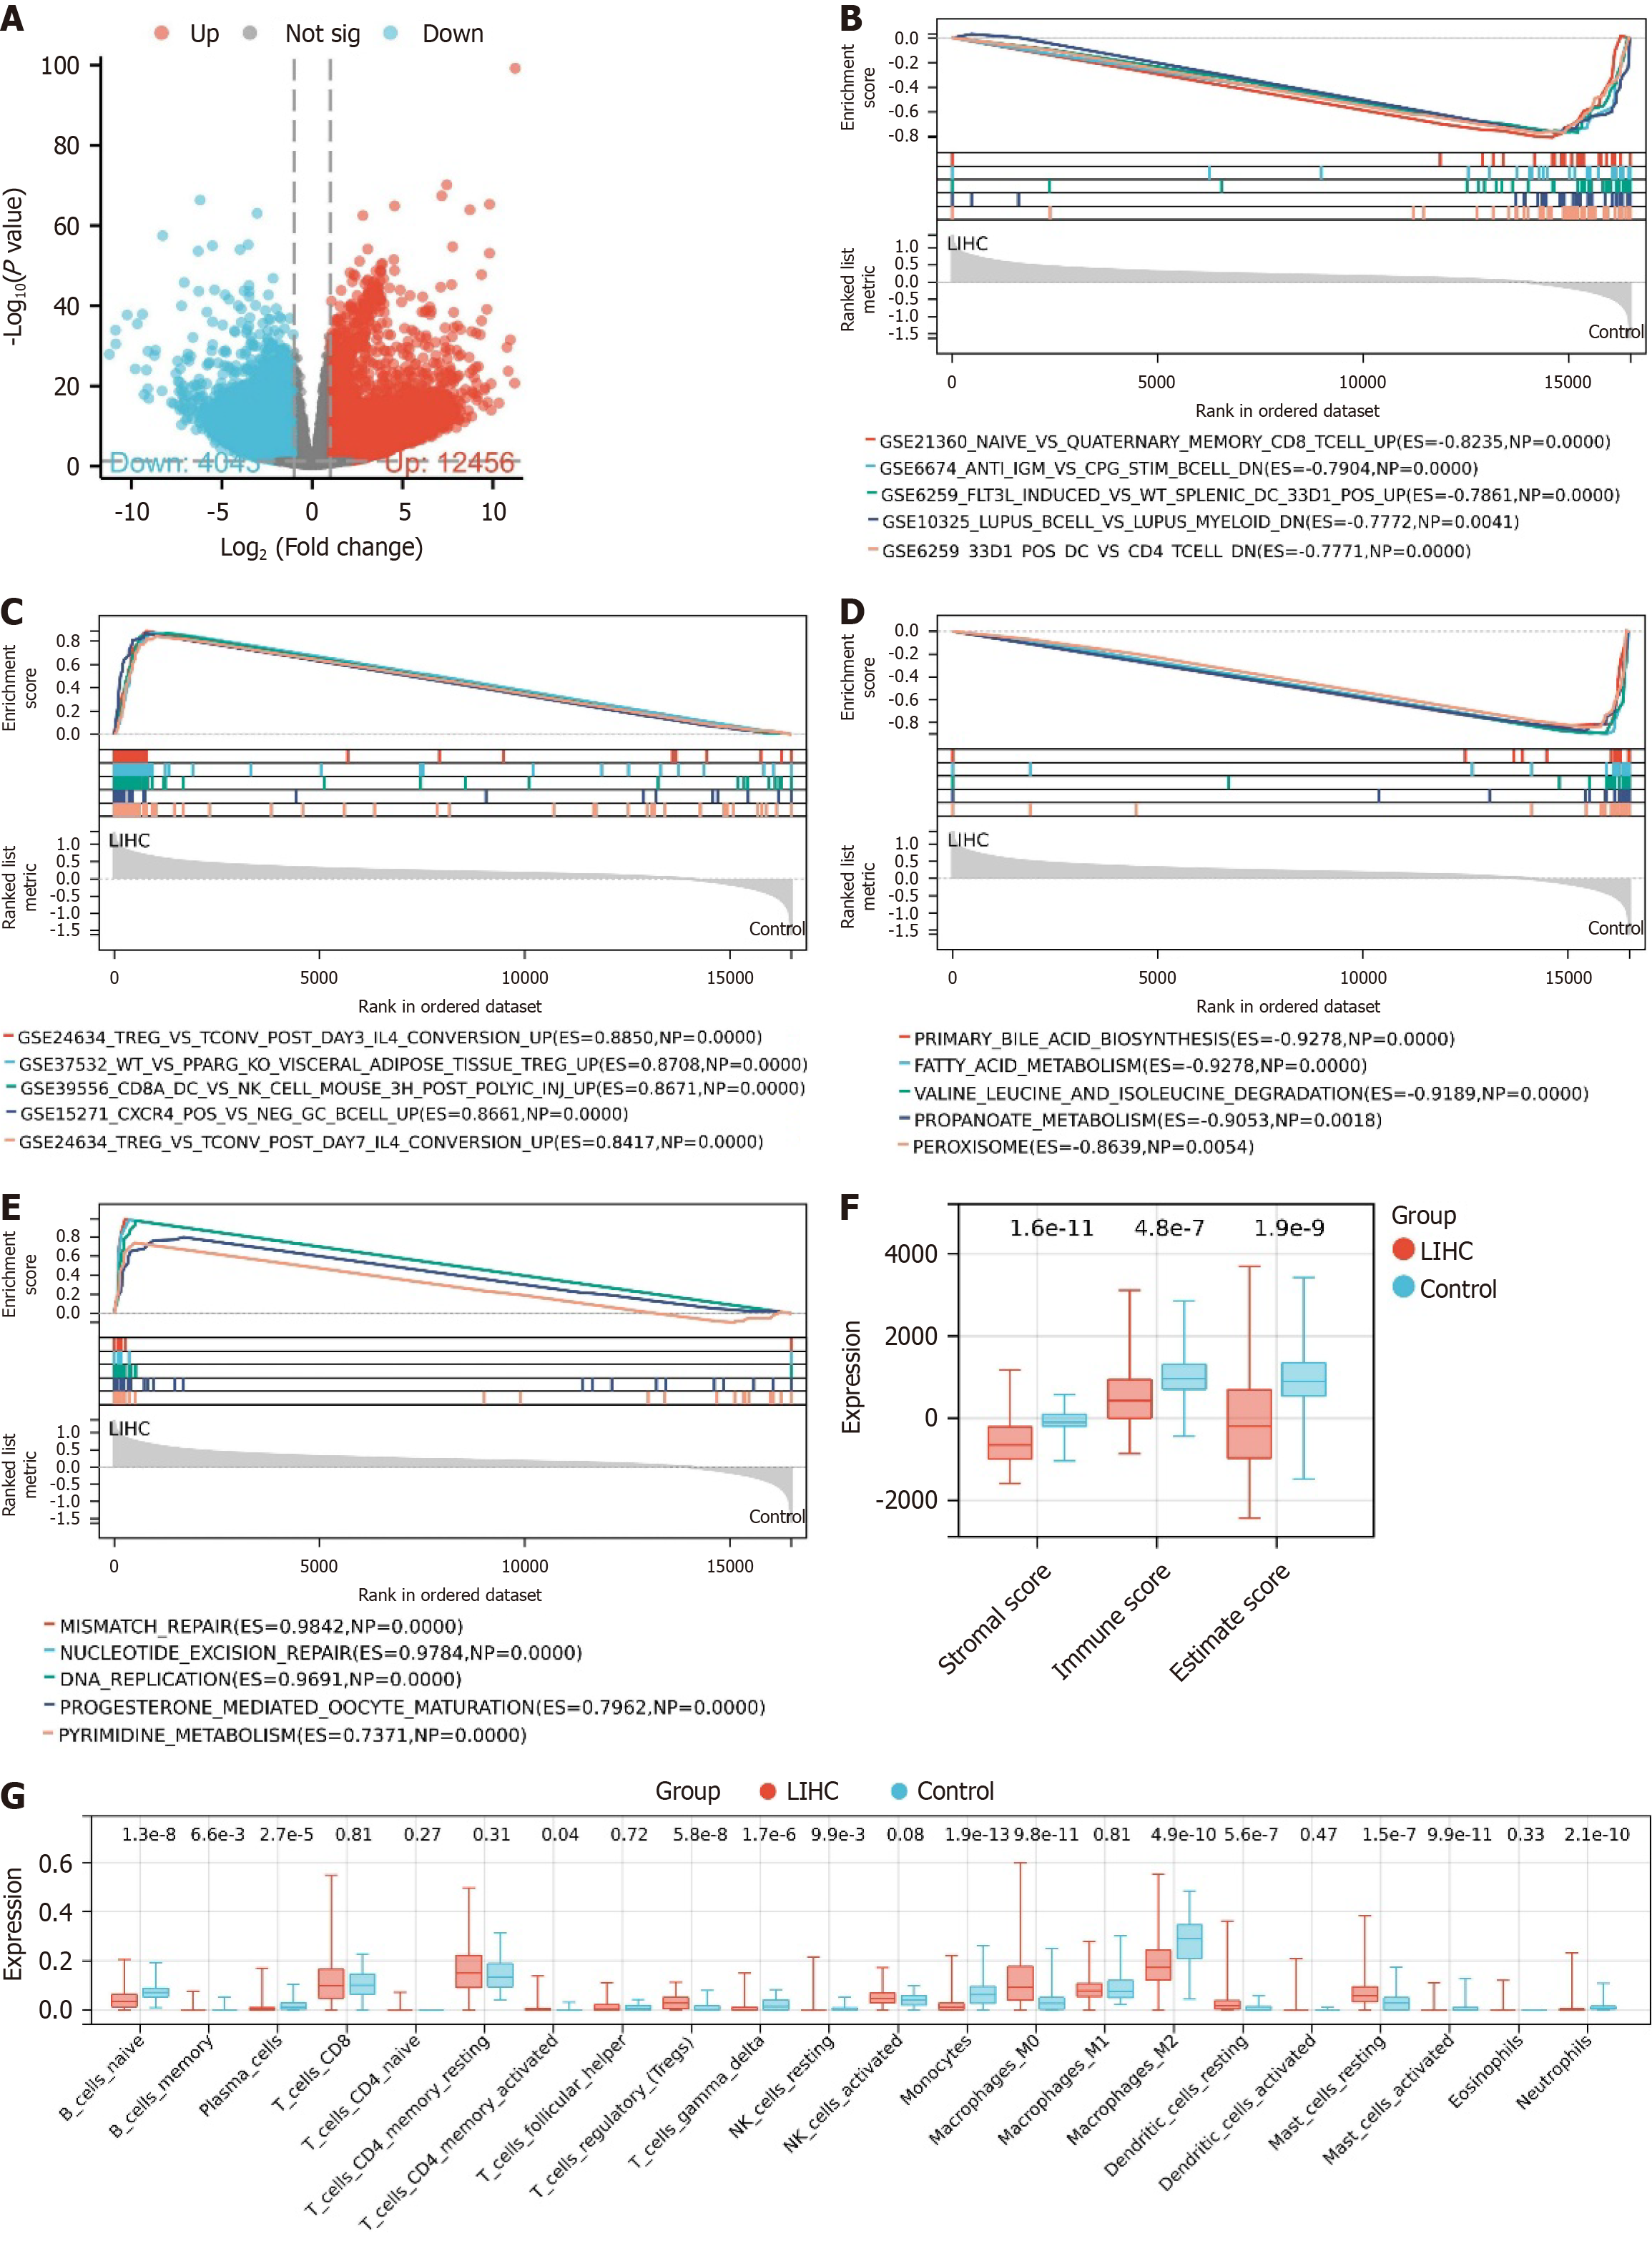
Figure 1 Gene expression and immune infiltration characteristics in liver cancer.
A: Differential analysis volcano plot of The Cancer Genome Atlas-Liver hepatocellular carcinoma (LIHC) dataset, where red represents significantly upregulated genes, blue represents significantly downregulated genes, and grey represents genes with no significant difference; B: Enrichment analysis results of immune gene sets enriched in the control group; C: Enrichment analysis results of immune gene sets enriched in the LIHC group; D: Enrichment analysis results of KEGG gene sets enriched in the control group; E: Enrichment analysis results of KEGG gene sets enriched in the LIHC group; F: Box plot of ESTIMATE immune infiltration results; G: Box plot of Cibersort immune infiltration results. Control, n = 50; LIHC, n = 373.
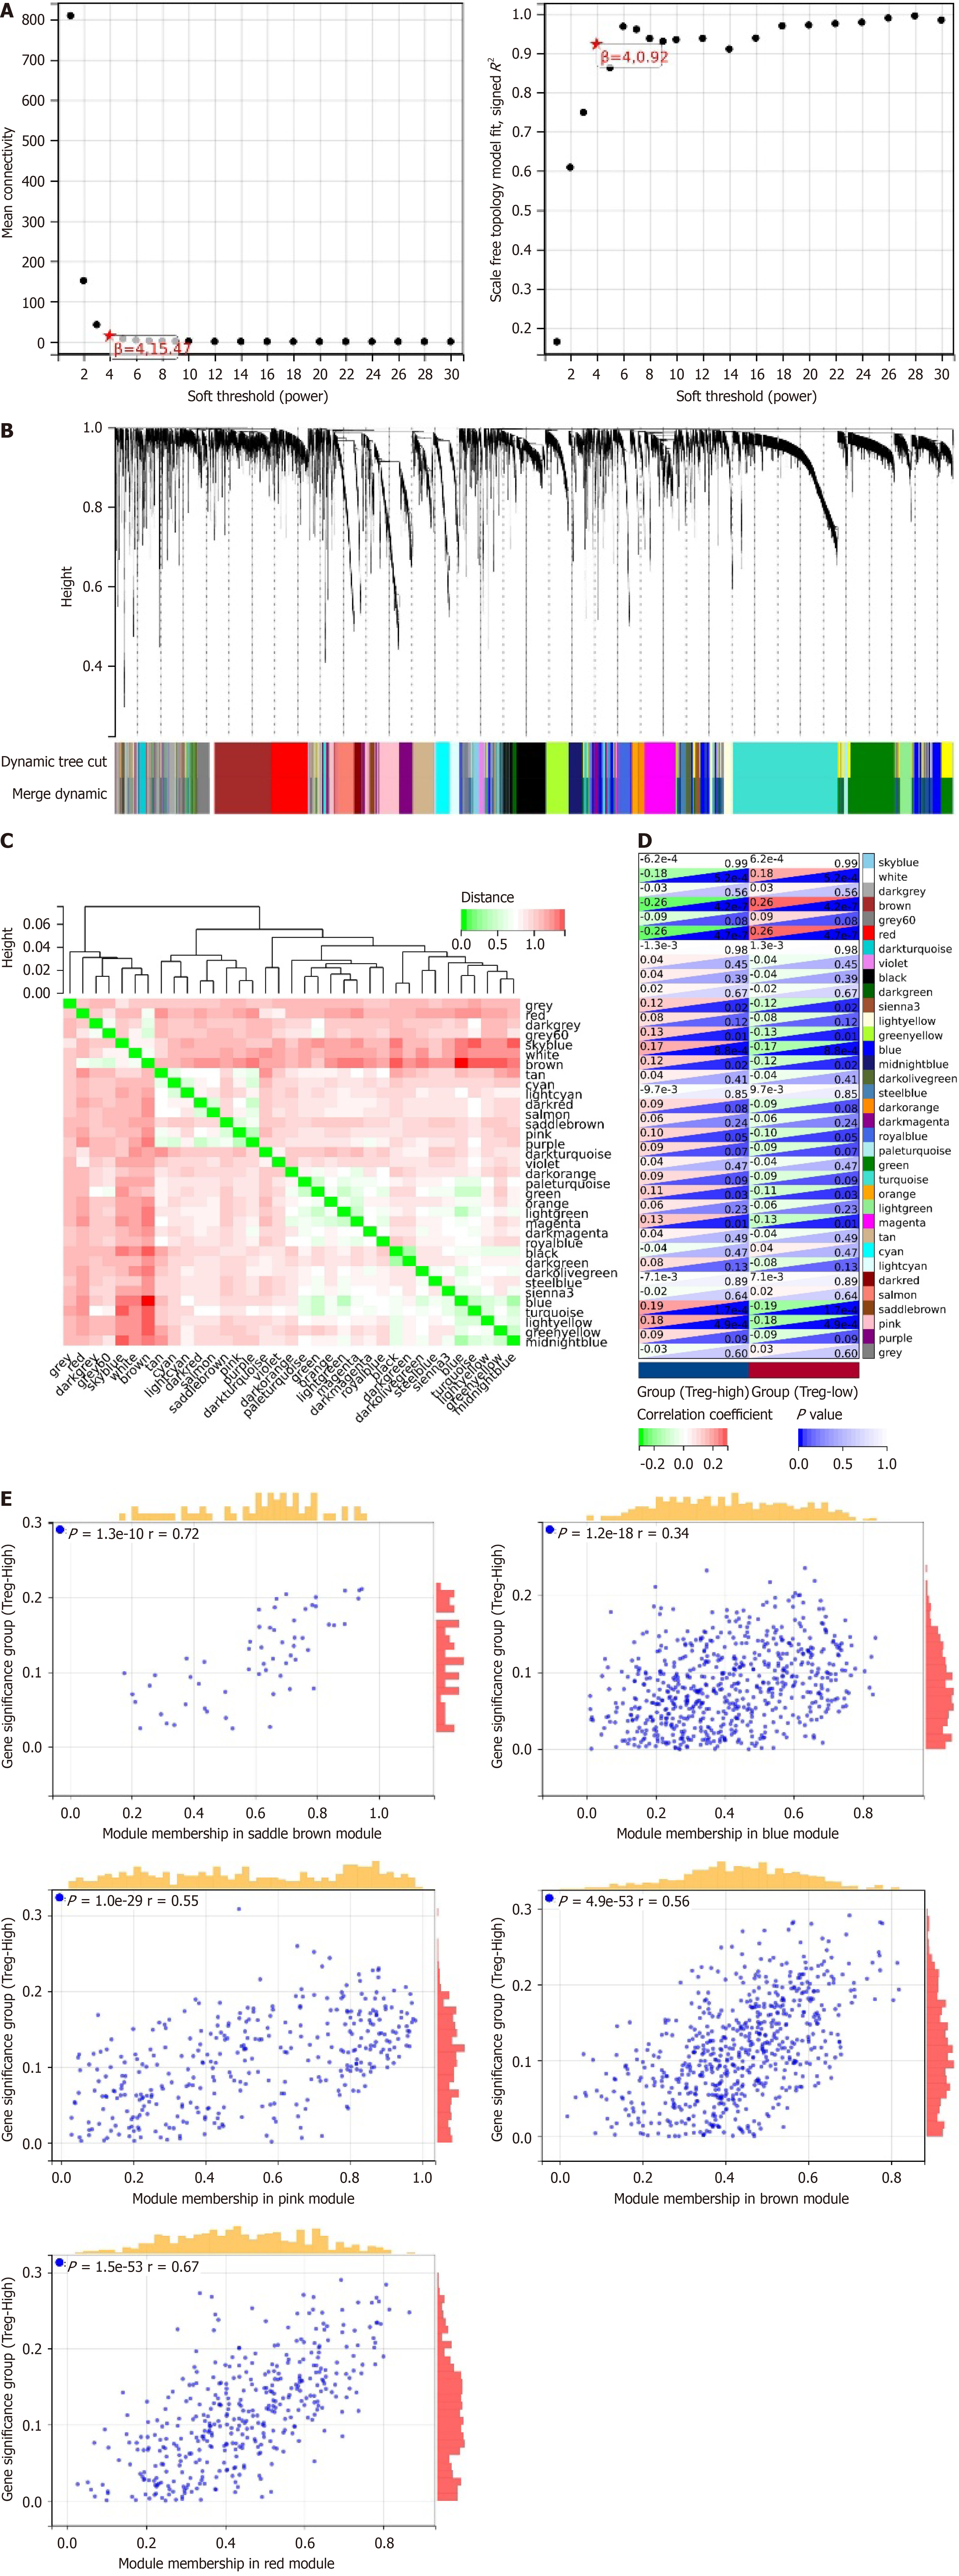
Figure 2 Molecular mechanism of regulatory T-cell infiltration in liver hepatocellular carcinoma.
A: Scale independence (left) and average connectivity (right) to determine the weighted value β = 4 that satisfies the scale-free network law; B: Dendrogram of co-expression network modules; C: Heatmap showing the correlation between 35 modules; D: Correlation analysis between modules and high or low regulatory T-cell (Treg) cell infiltration; E: Scatter plots analyzing the relationship between the brown, red, blue, saddle brown, and pink modules and Treg-High infiltration. Liver hepatocellular carcinoma, n = 373.
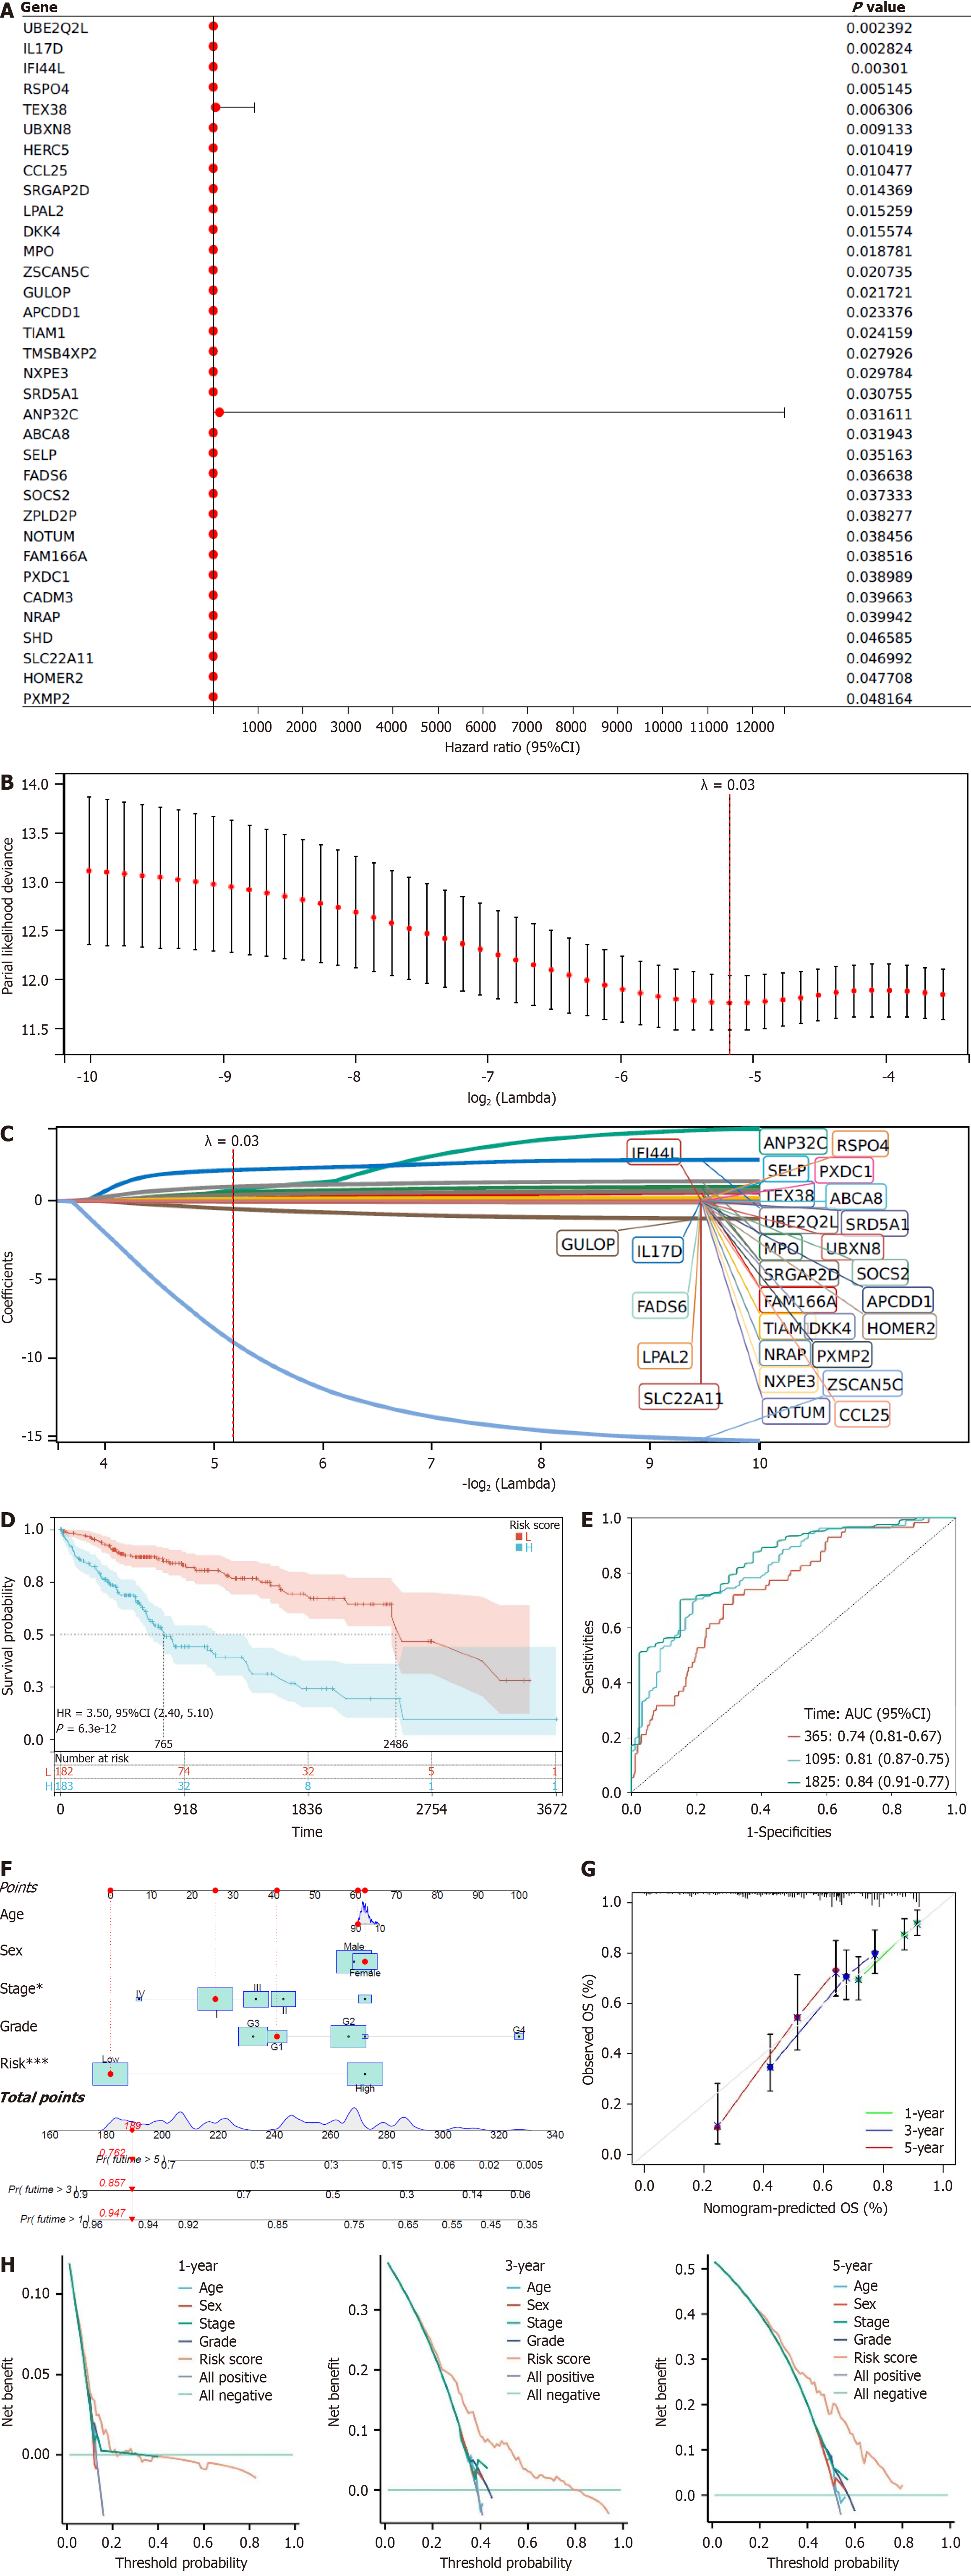
Figure 3 Key genes associated with liver hepatocellular carcinoma and their prognostic evaluation.
A: Forest plot showing 34 significant genes identified by univariate COX regression; B: Partial likelihood deviance of least absolute shrinkage and selection operator (LASSO) coefficient distribution, with Lambda = 0.03; C: Identification of 29 candidate genes through LASSO analysis, with Lambda = 0.03; D: Kaplan-Meier curves comparing the prognosis differences between high-risk and low-risk groups based on the RSs from LASSO analysis; E: Receiver operating characteristic analysis at 1, 3, and 5 years based on the RSs from LASSO analysis; F: Nomogram predicting the 1-year, 3-year, and 5-year survival probabilities of breast cancer patients in a line chart format; G: Calibration plots of the line chart for predicting the overall survival at 1, 3, and 5 years (green: 1 year; blue: 3 years; red: 5 years); H: Decision curve analysis curve for the total survival rates at 1, 3, and 5 years (the x-axis represents the threshold probability, the y-axis represents the net benefit, where the net benefit is the relative benefit obtained by subtracting the weighted false positive rate from the true positive rate based on the threshold probability; "None" and "ALL" are two reference lines, and the closer other model curves are to these reference lines, the less practical value they have; a higher y-axis value under the same x-axis condition indicates a better model performance; if the y-axis values are consistently higher than other models over a large range of threshold values on the x-axis, it indicates superior model performance). Liver hepatocellular carcinoma, n = 367. aP < 0.05; bP < 0.001; SOCS2: Suppressor of cytokine signaling 2; Treg: Regulatory T-cell.
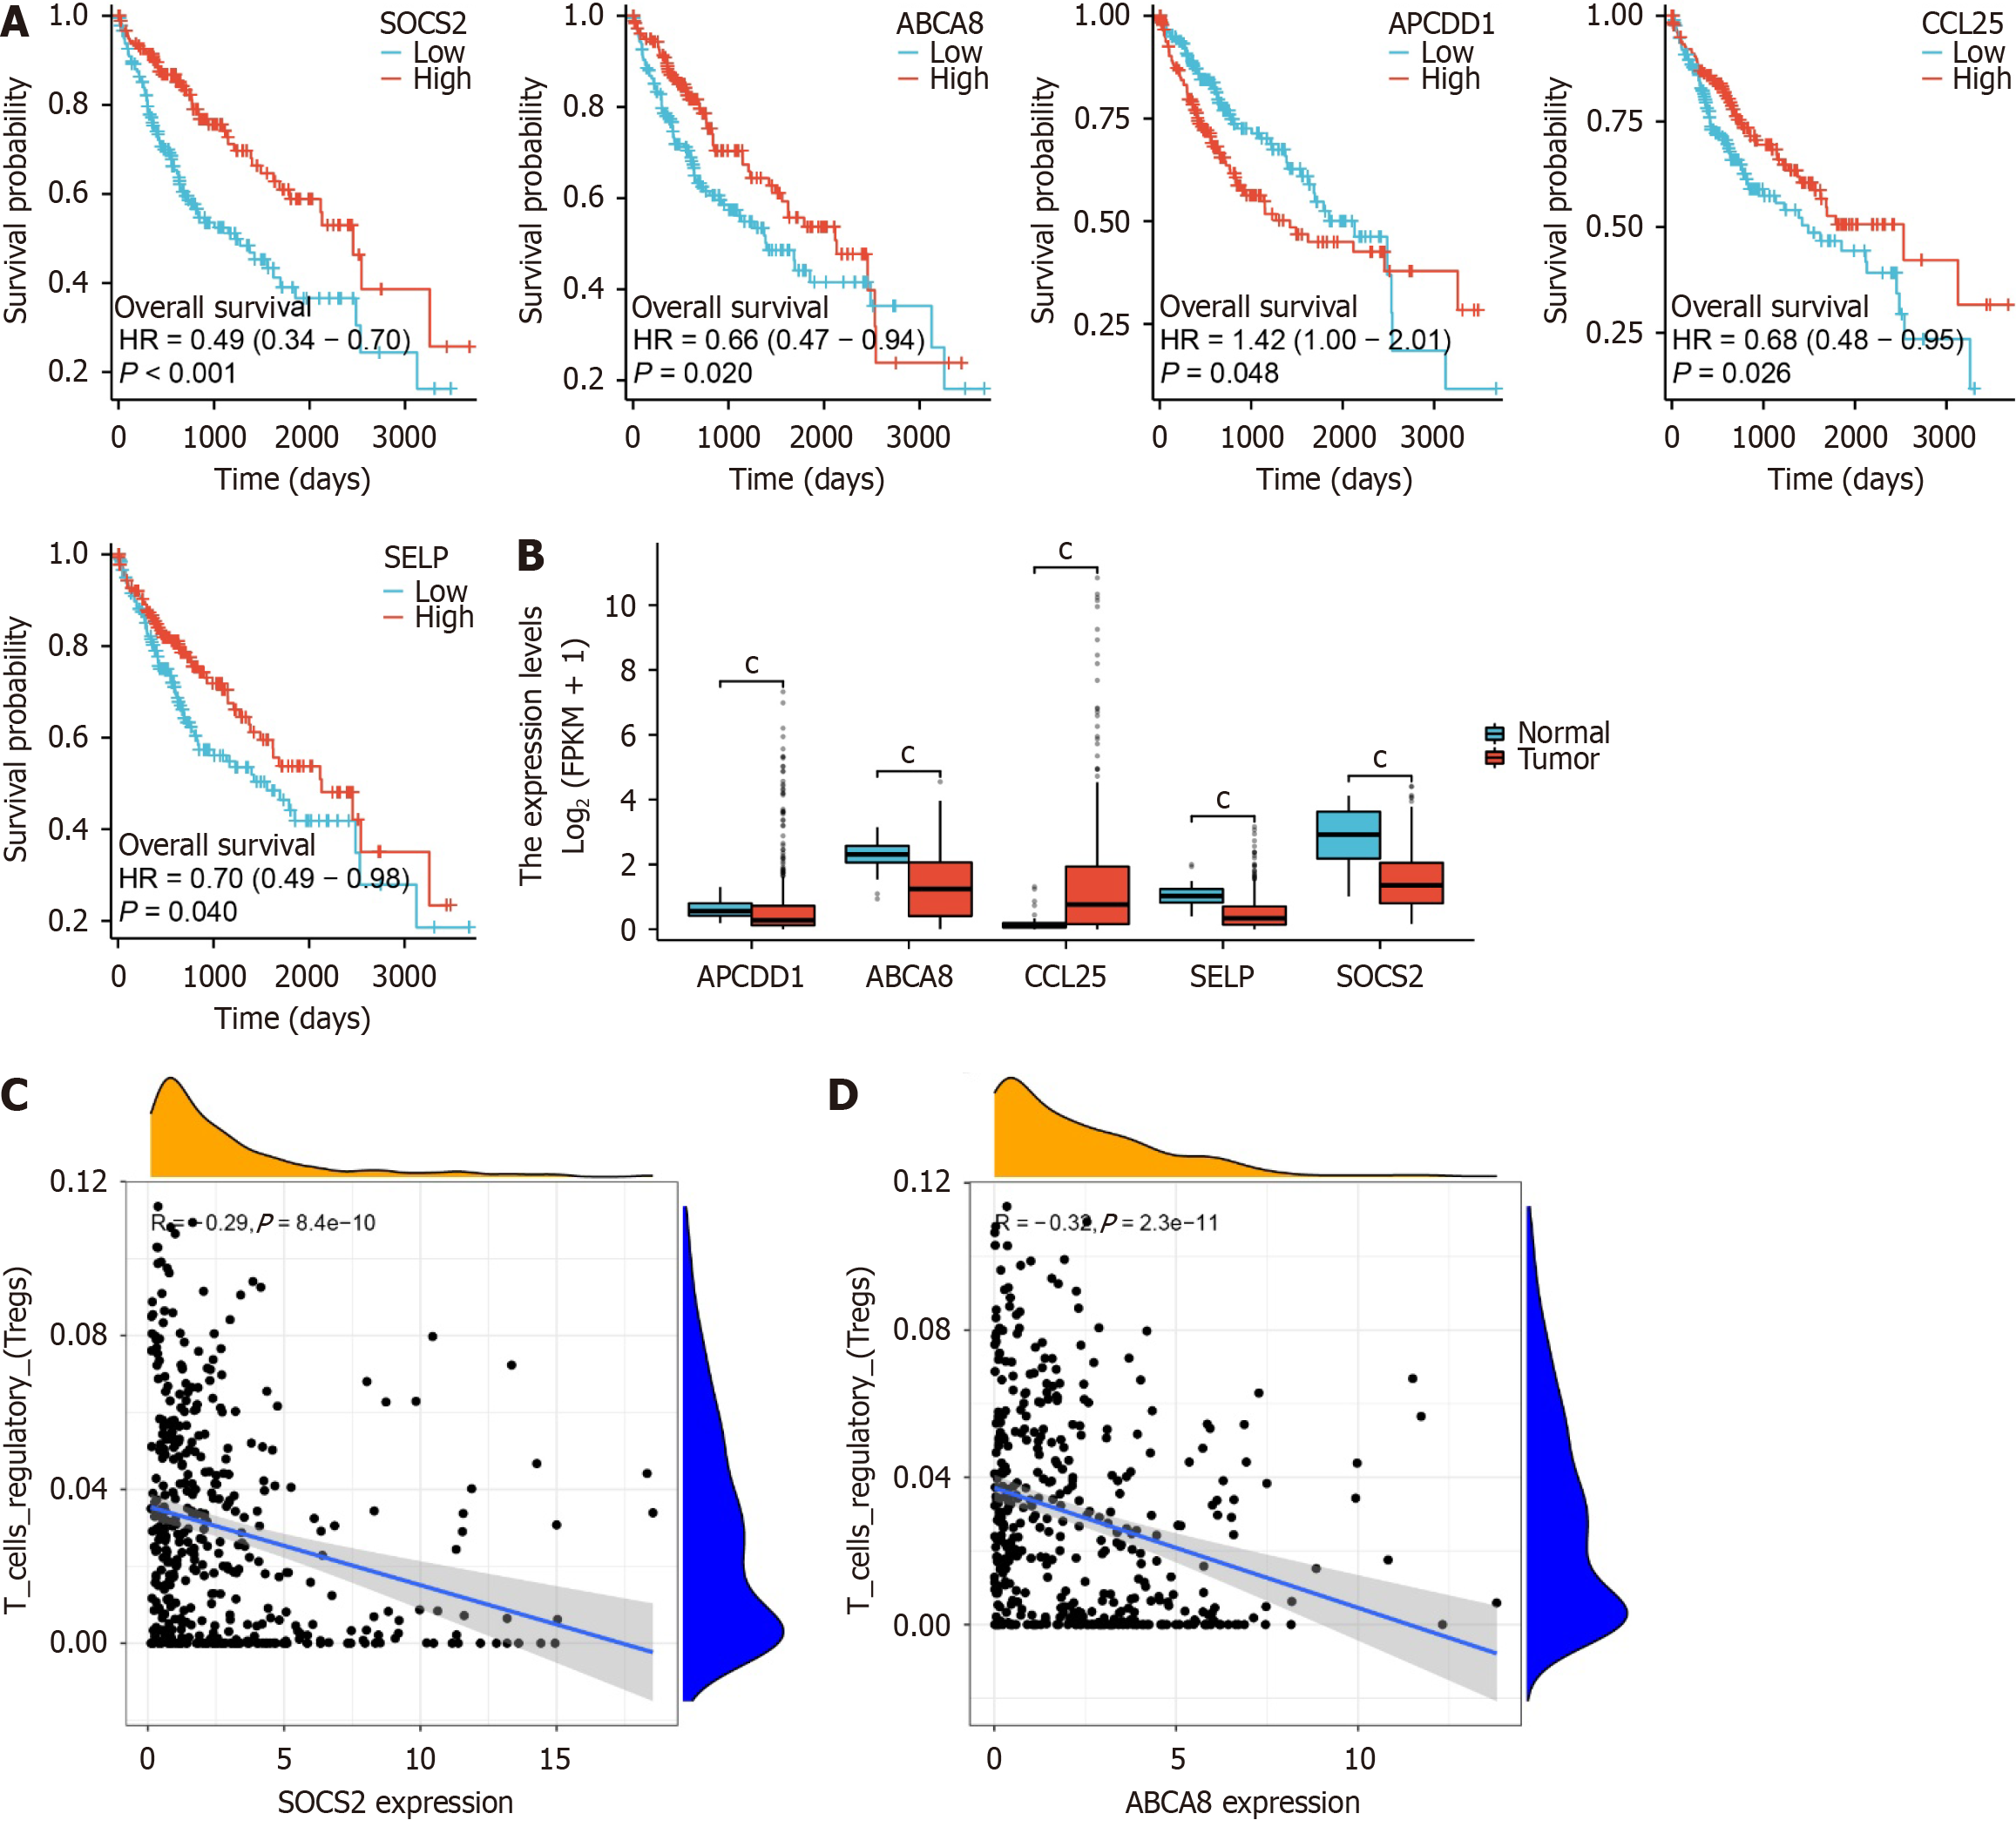
Figure 4 Molecular characteristics revealing prognostic genes of liver hepatocellular carcinoma.
A: Survival curves of ABCA8, CCL25, APCDD1, SELP, and suppressor of cytokine signaling 2 (SOCS2) in The Cancer Genome Atlas (TCGA)-Liver hepatocellular carcinoma (LIHC) dataset; B: Expression boxplots of ABCA8, CCL25, SELP, and SOCS2 in the TCGA-LIHC dataset, with cP < 0.001; C: Correlation analysis between ABCA8 and regulatory T-cell (Treg) cells; D: Correlation analysis between SOCS2 and Treg cells. Control, n = 50; LIHC, n = 373. SOCS2: Suppressor of cytokine signaling 2; Treg: Regulatory T-cell; HR: Hazard ratio.
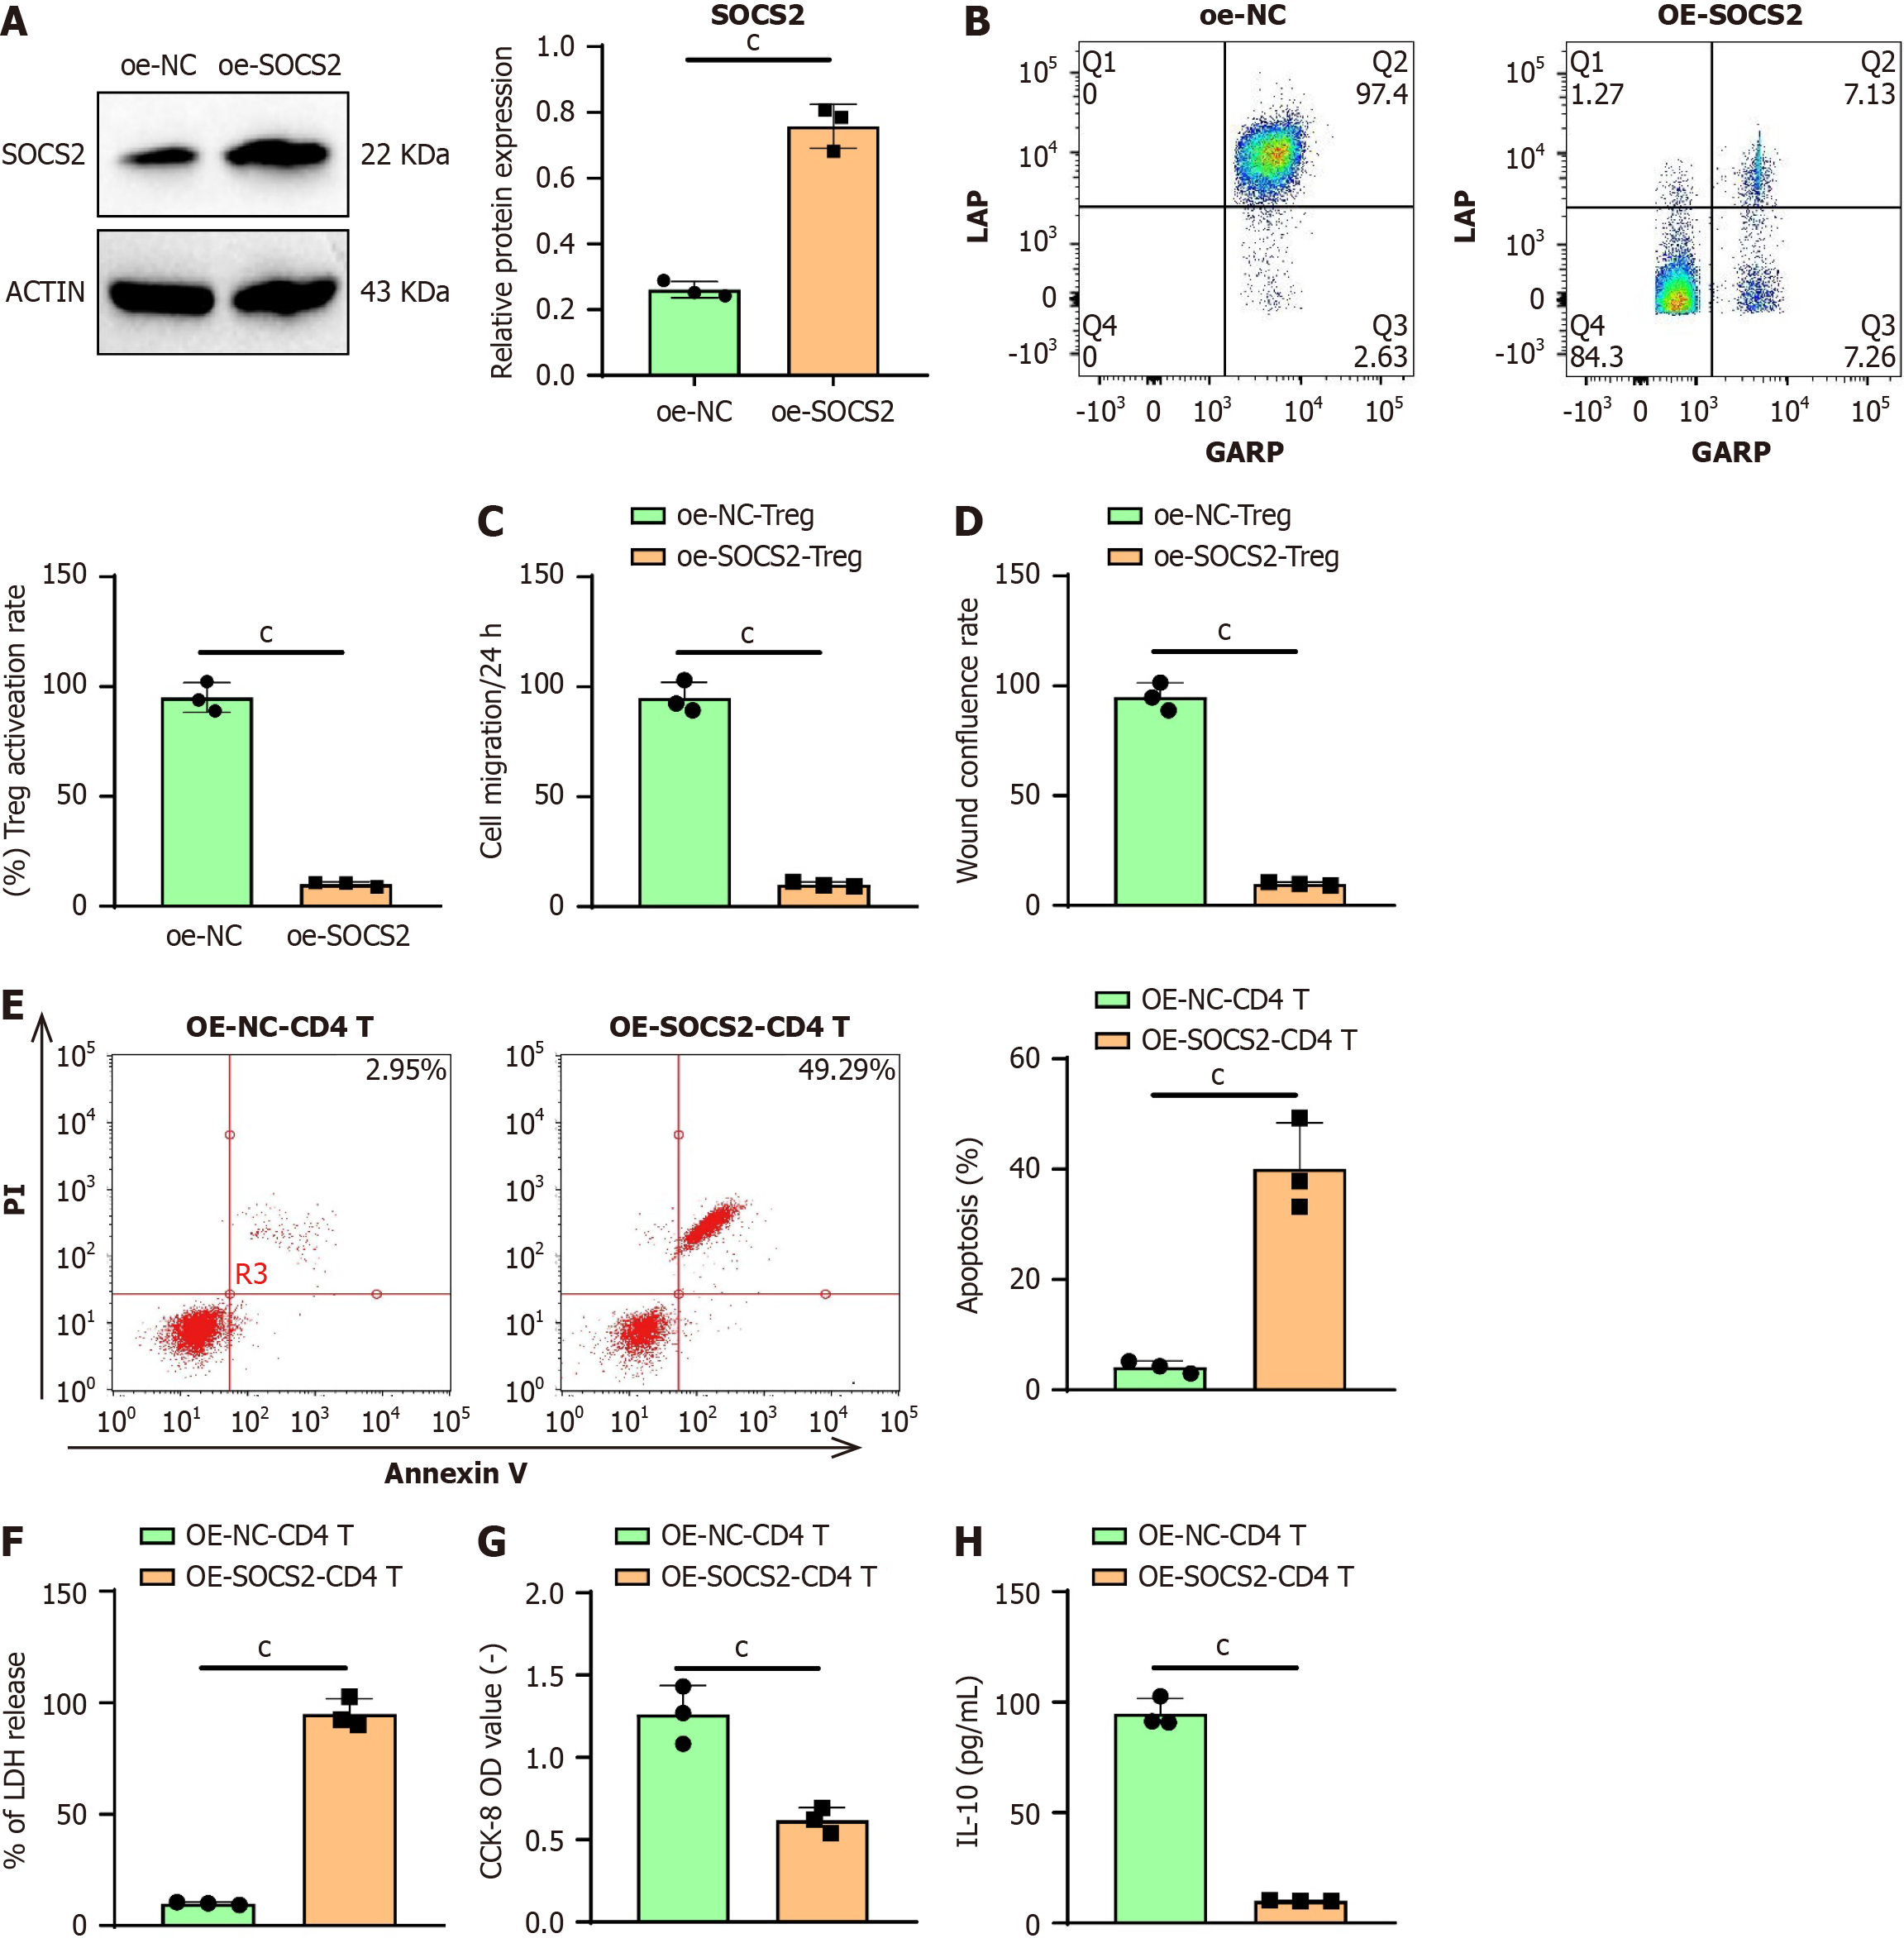
Figure 5 Suppression of regulatory T-cell cell activity by suppressor of cytokine signaling 2 inhibits the growth of liver hepatocellular carcinoma cells.
A: Quantification of suppressor of cytokine signaling 2 protein expression in CD4 T cells by Western blotting; B: Flow cytometry analysis of the activation of CD4 T cells; C: Representative images and cell numbers of Huh-7 migration assessed by Transwell assay; D: Scratch assay to detect representative images of Huh-7 and wound closure rate, where the wound closure rate% = (a - b) × 100%; E: Flow cytometry measuring apoptosis rate of Huh-7 cells after co-culture treatment; F: Measurement of LDH release in Huh-7 cells after co-culture treatment; G: Assessment of Huh-7 cell viability after co-culture treatment using CCK-8 assay; H: Enzyme-linked immunosorbent assay quantifying the expression level of anti-inflammatory cytokine IL-10 in Huh-7 cells after co-culture treatment. Data are presented as mean ± SD (with cell experiments repeated thrice, cP < 0.001, analyzed using t-test). SOCS2: Suppressor of cytokine signaling 2; Treg: Regulatory T-cell; IFN: Interferon; IL: Interleukin; PI: Propidium iodide.
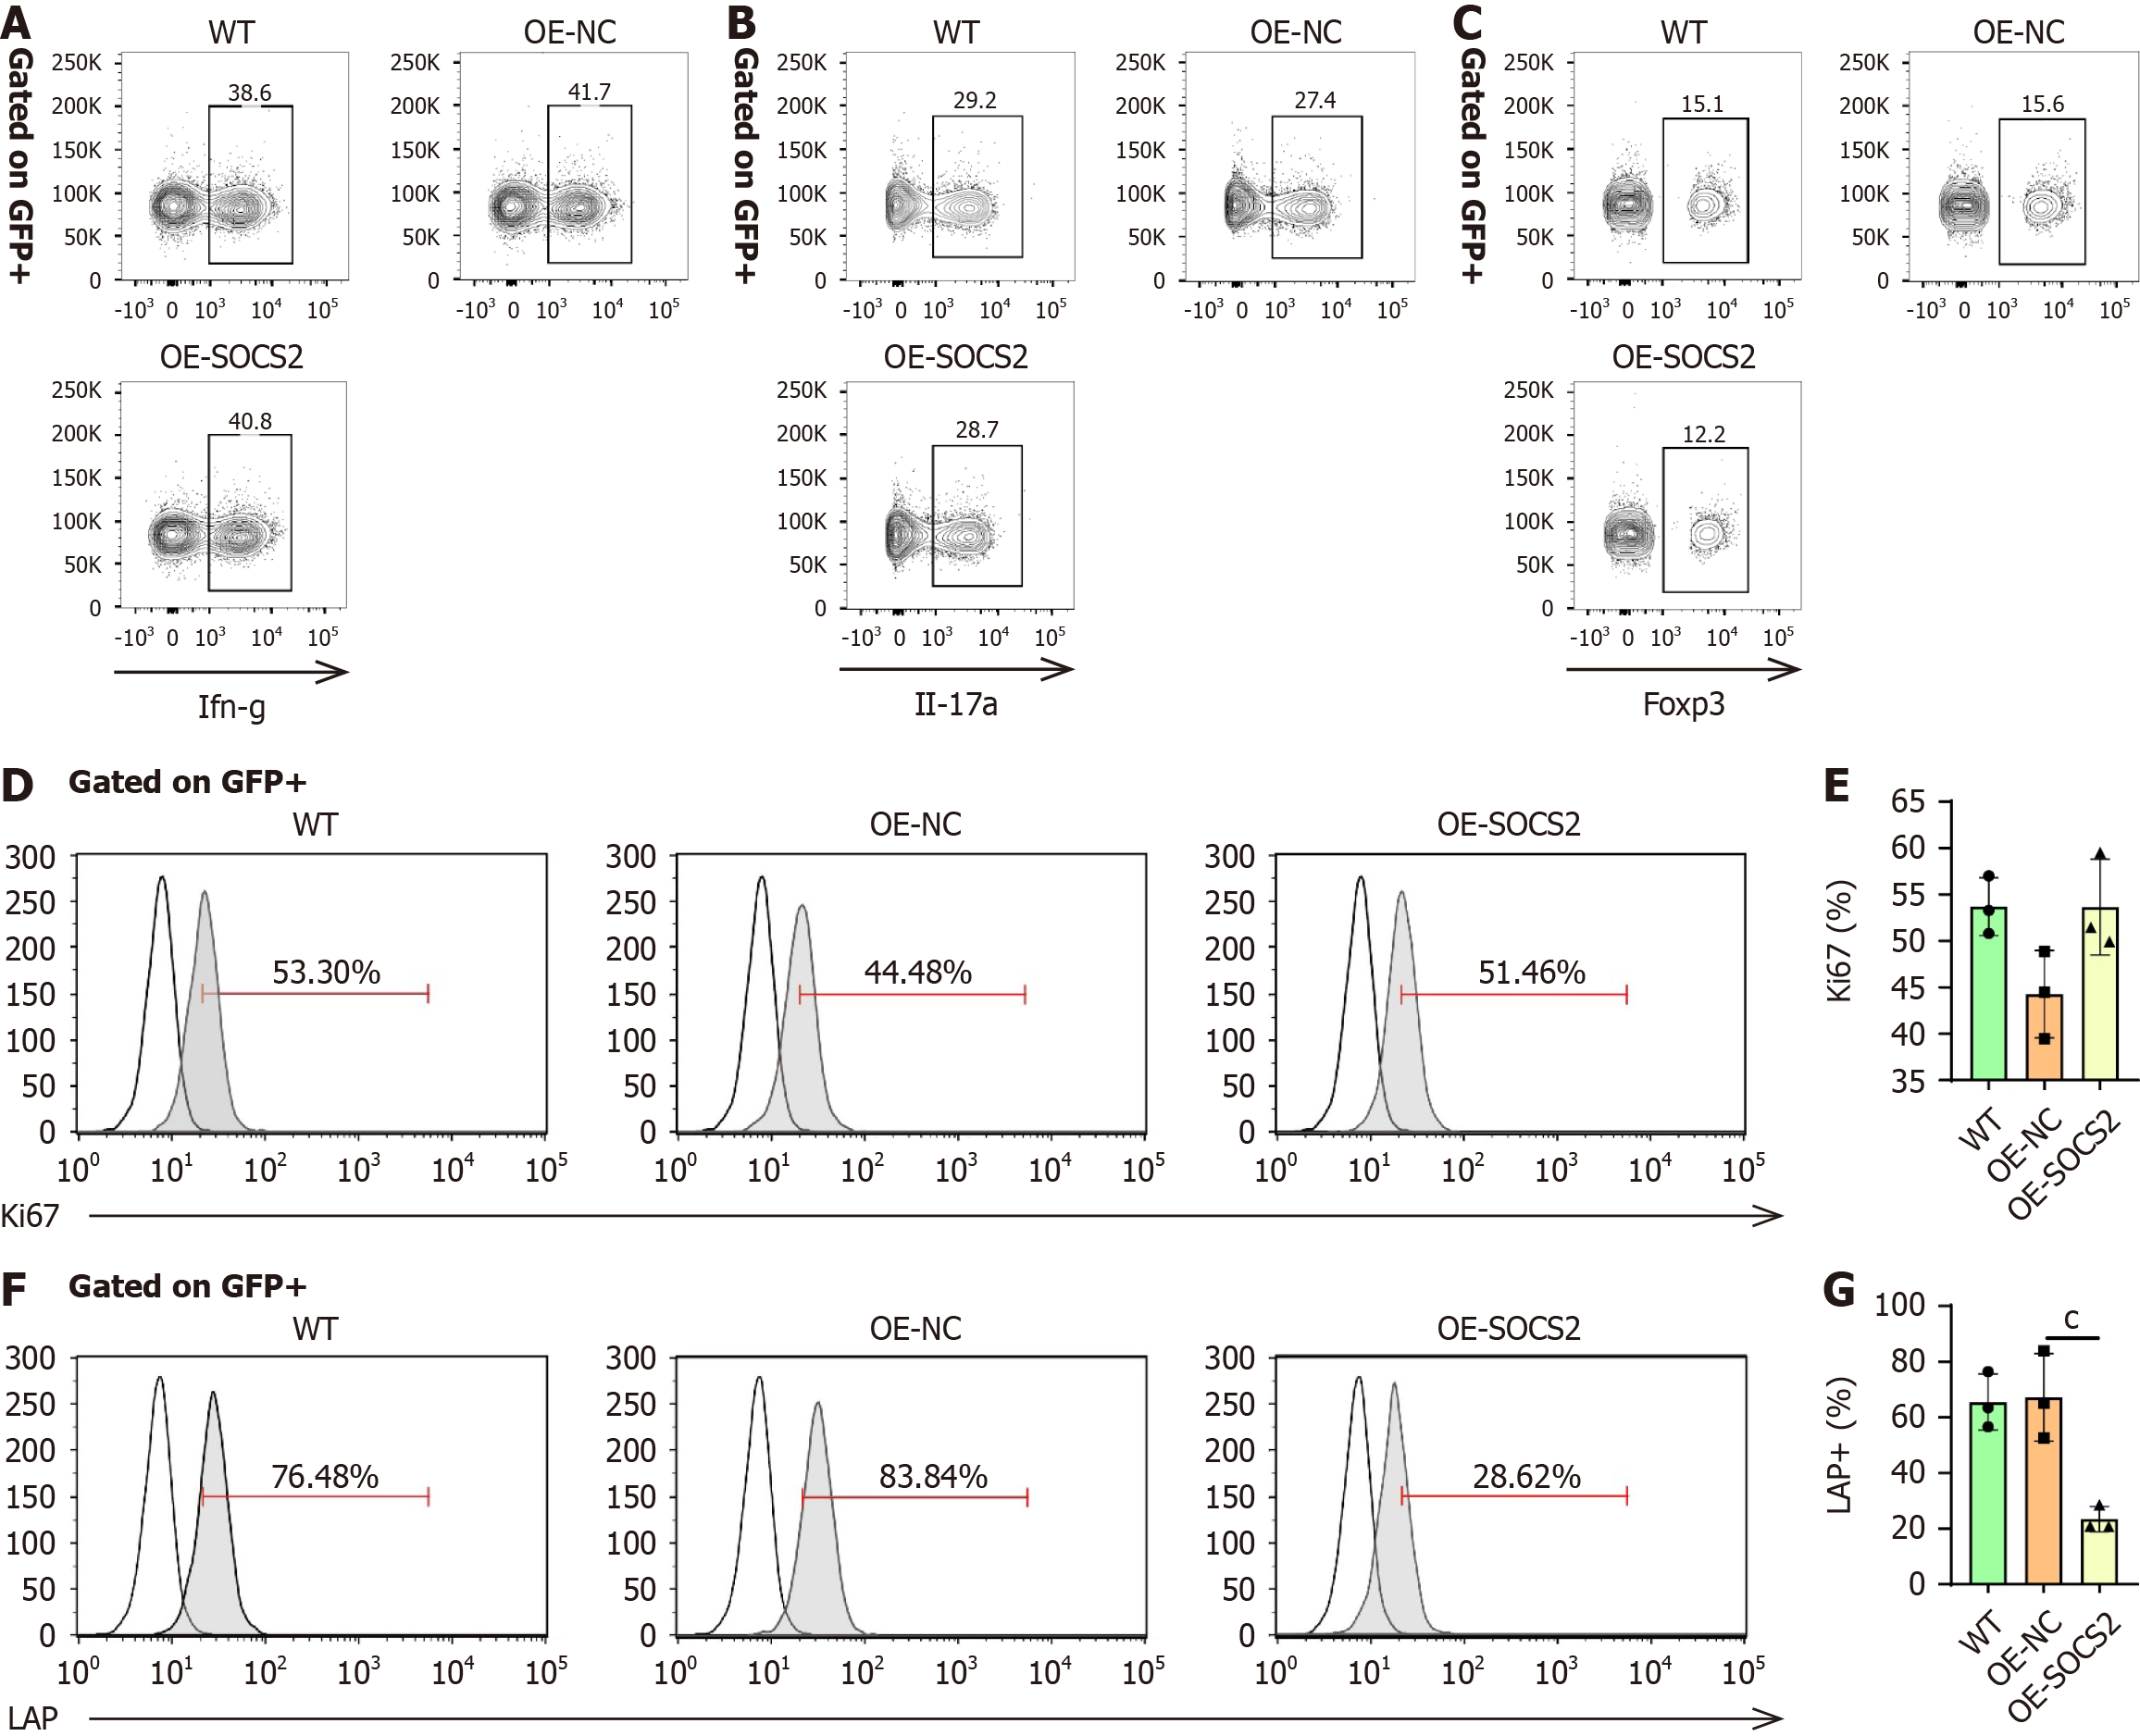
Figure 6 Suppressor of cytokine signaling 2 inhibits regulatory T-cell activity.
A-C: In vitro induction of naïve T cells into Th1 A:, Th17 (B), and Th17 (C) subsets, with flow cytometry used to detect markers and quantify differentiation efficiency; D and E: Flow cytometry detection of Ki67 expression to evaluate the effect of suppressor of cytokine signaling 2 (SOCS2) overexpression on regulatory T-cell (Treg) cell proliferation; F and G: Flow cytometry detection of LAP expression to assess the impact of SOCS2 on Treg cell activity. cP < 0.001; SOCS2: Suppressor of cytokine signaling 2; Treg: Regulatory T-cell; IFN: Interferon; IL: Interleukin.
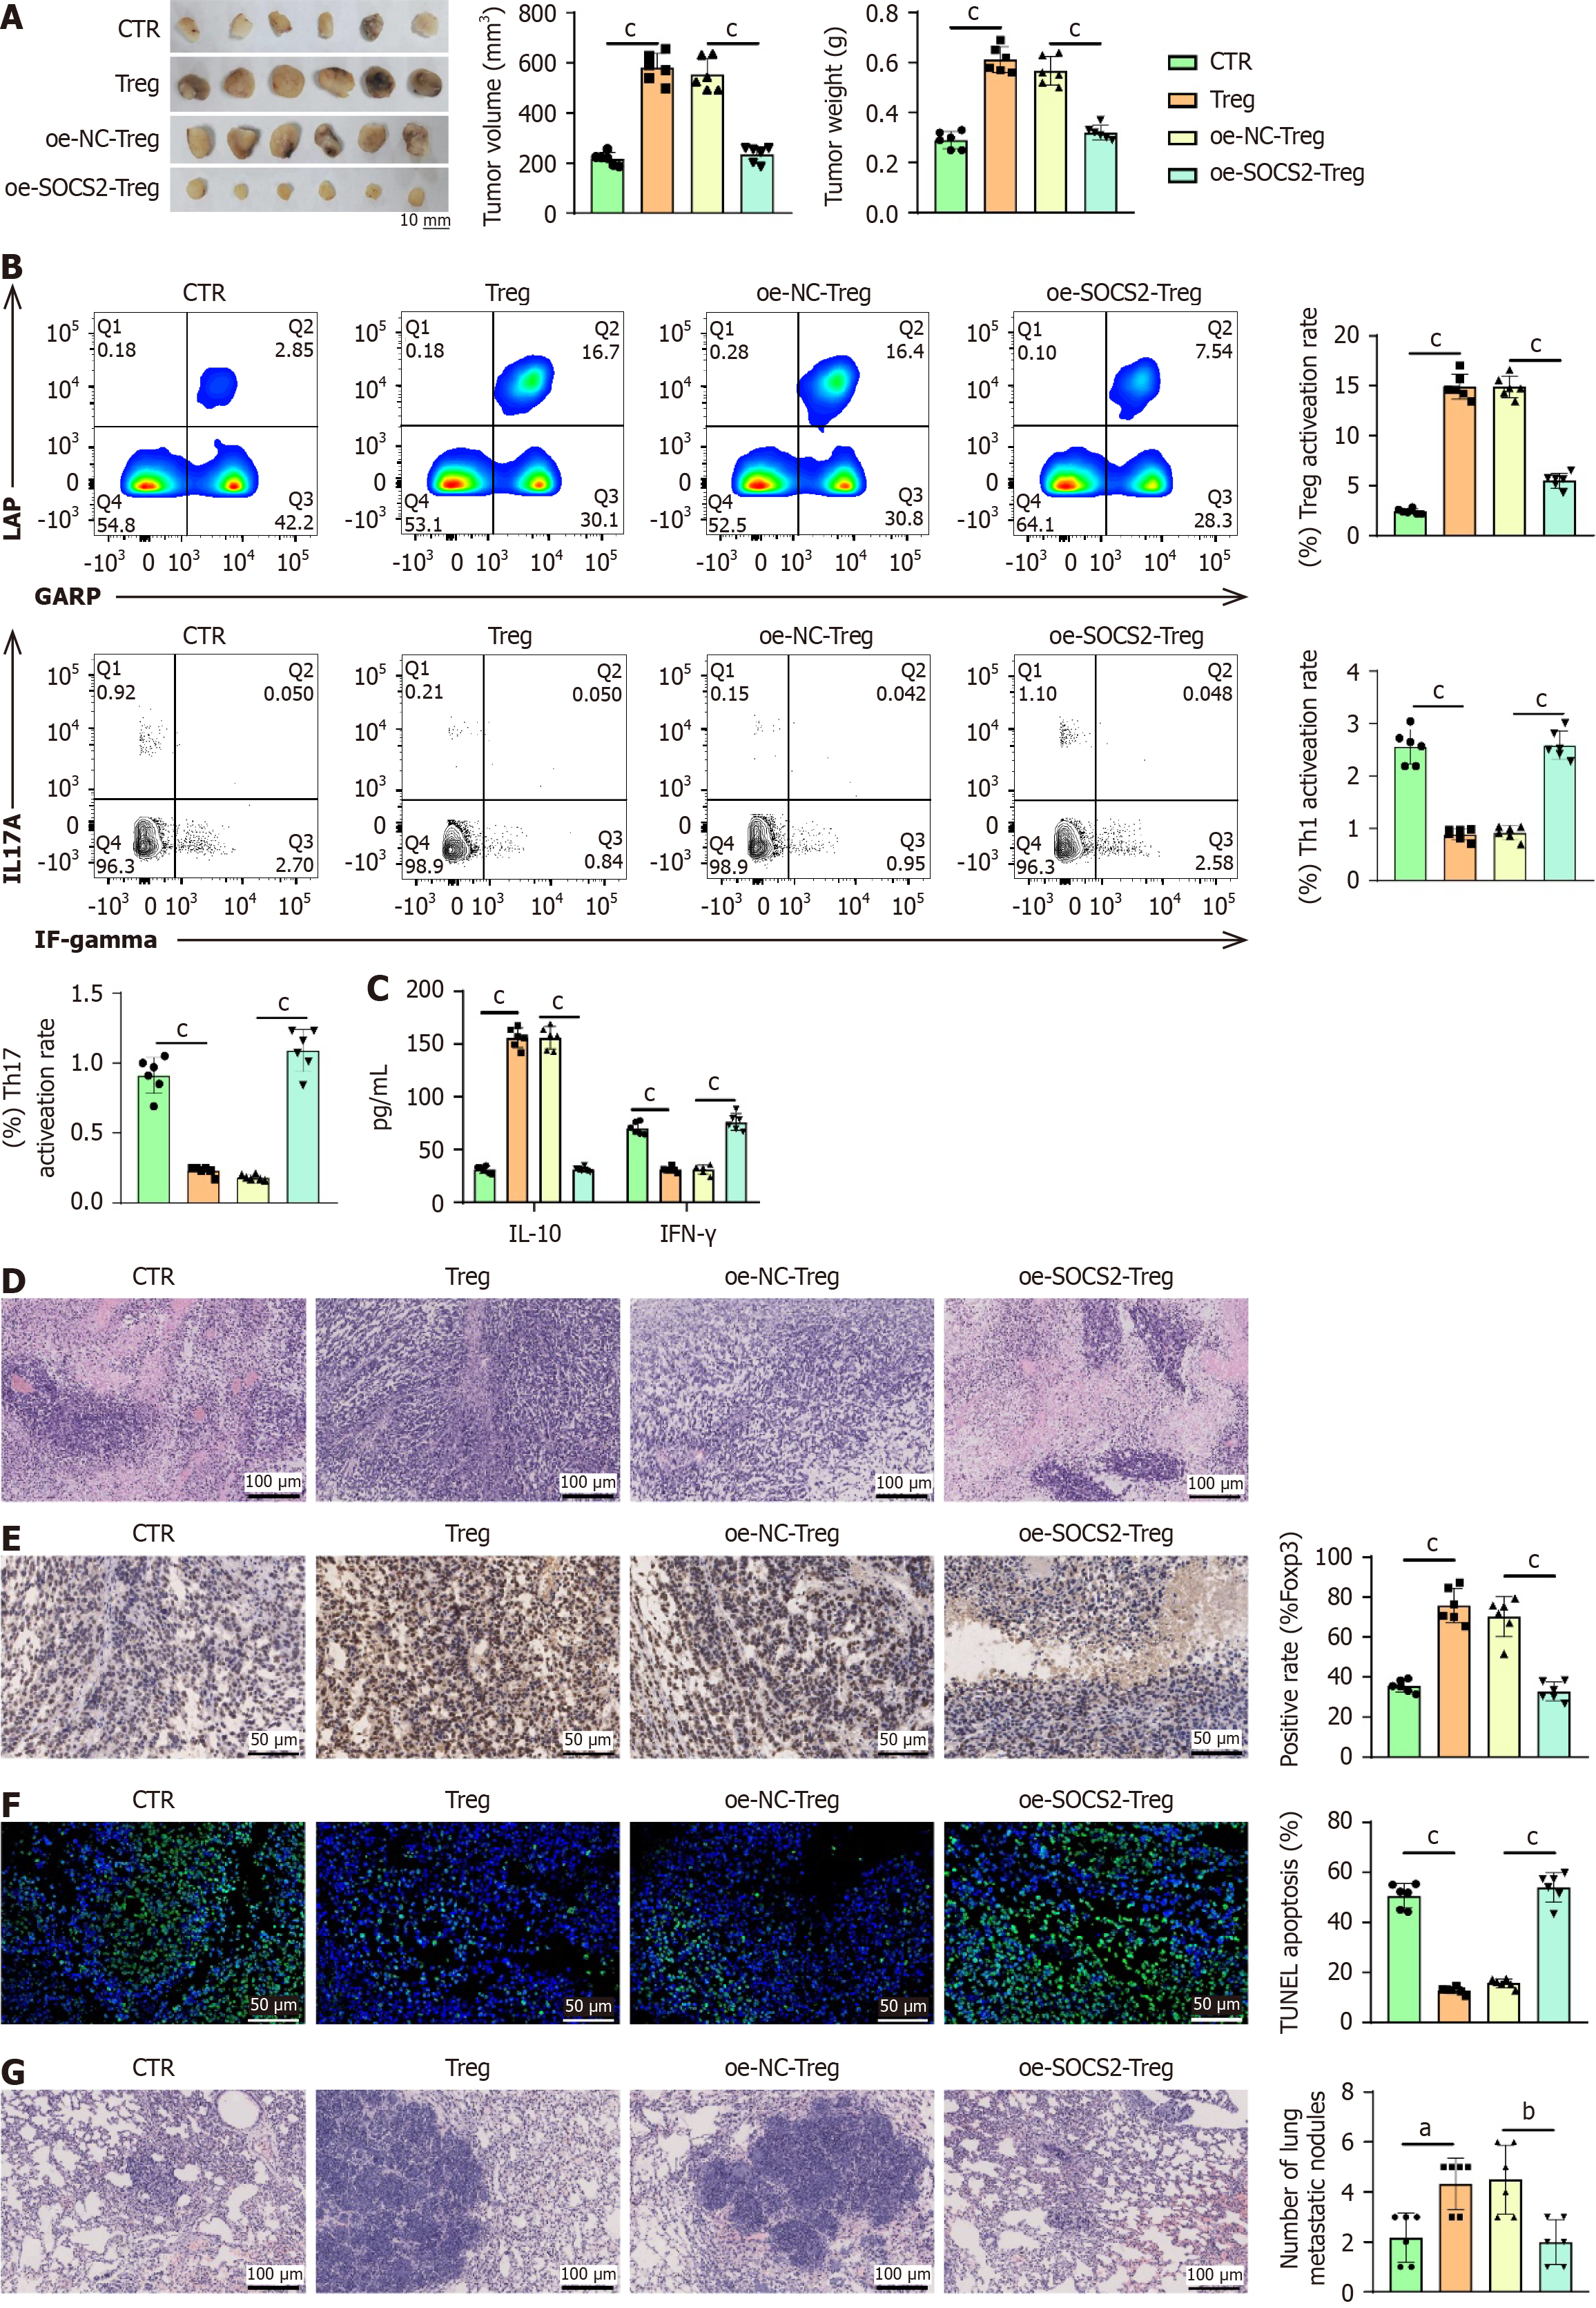
Figure 7 Suppressor of cytokine signaling 2 suppressing regulatory T-cell cell activity restrains the growth and metastasis of liver hepa
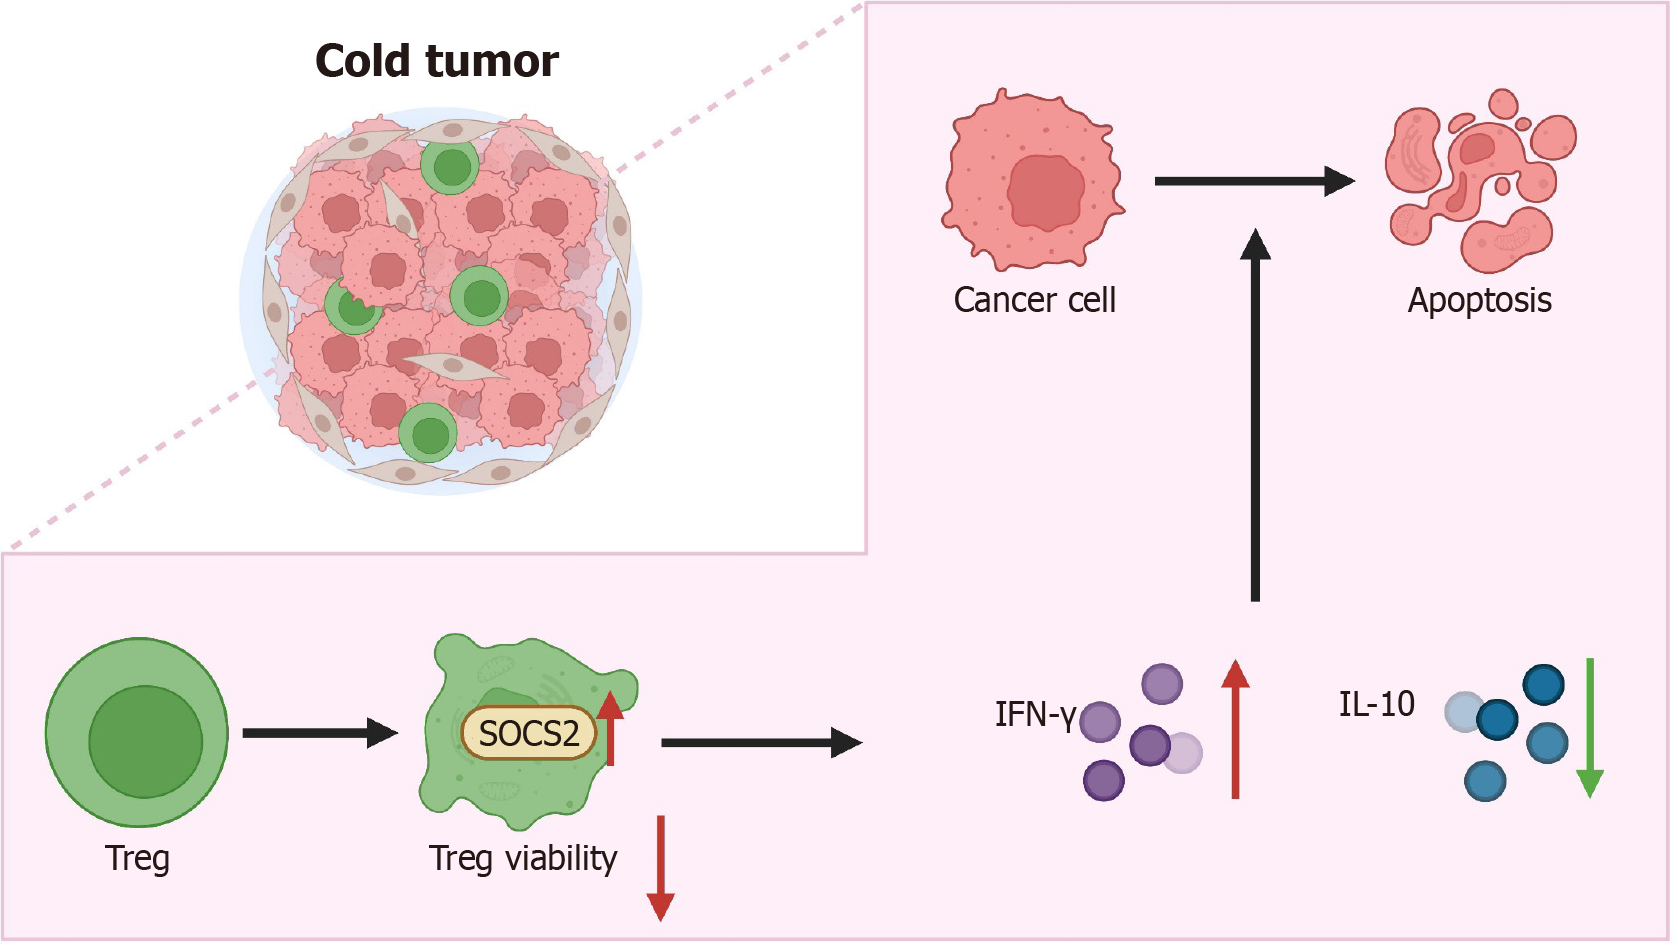
Figure 8 Molecular mechanisms of suppressor of cytokine signaling 2 in inhibiting the growth and metastasis of liver hepatocellular carcinoma by regulating regulatory T-cell cell activity.
SOCS2: Suppressor of cytokine signaling 2; Treg: Regulatory T-cell; IFN: Interferon; IL: Interleukin.
- Citation: Lan X, Zhang H, Chen ZY, Wang J, Zhang SC, Li Q, Ke JY, Wei W, Huang R, Tang X, Chen SP, Huang TT, Zhou YW. Suppressor of cytokine signaling 2 modulates regulatory T cell activity to suppress liver hepatocellular carcinoma growth and metastasis. World J Gastroenterol 2025; 31(13): 100566
- URL: https://www.wjgnet.com/1007-9327/full/v31/i13/100566.htm
- DOI: https://dx.doi.org/10.3748/wjg.v31.i13.100566


