Copyright
©The Author(s) 2025.
World J Gastroenterol. Mar 28, 2025; 31(12): 97120
Published online Mar 28, 2025. doi: 10.3748/wjg.v31.i12.97120
Published online Mar 28, 2025. doi: 10.3748/wjg.v31.i12.97120
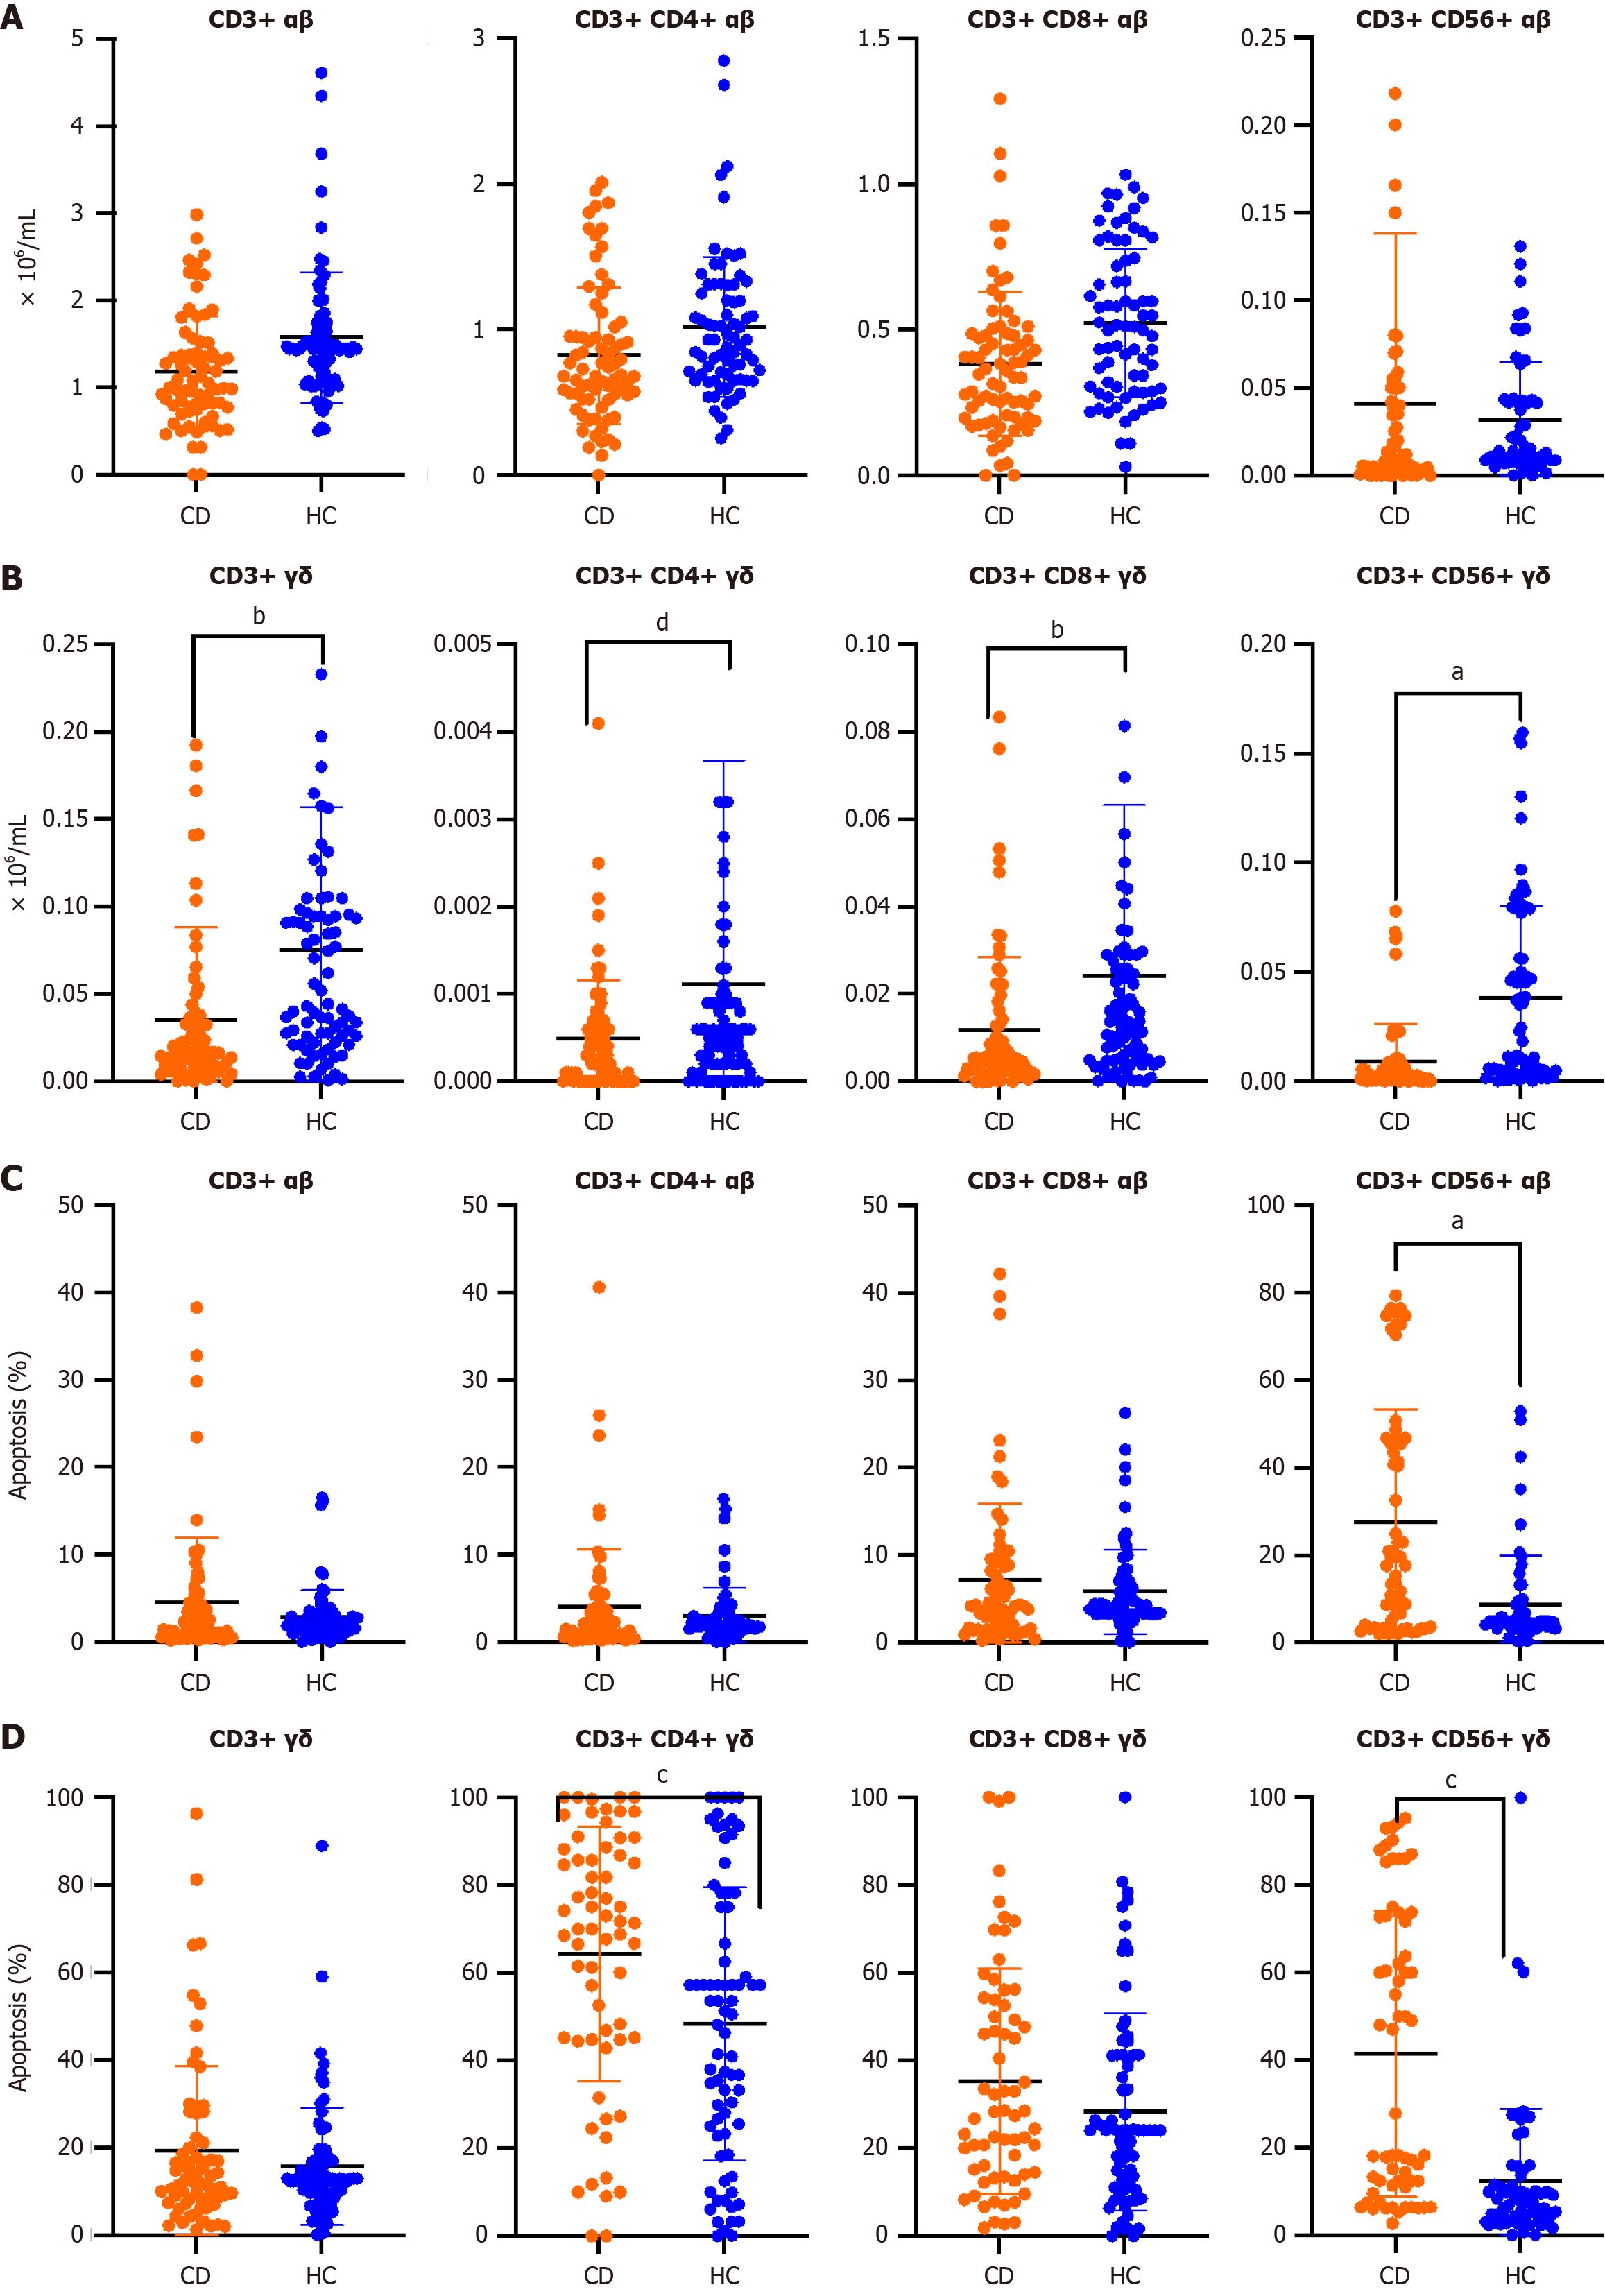
Figure 1 Numbers and apoptosis percentages of αβ and γδ T cell subsets in peripheral blood of patients with Crohn's disease (n = 80) vs control healthy controls (n = 80).
A and B: Numbers (means); C and D: Apoptosis percentages. Values are expressed as means (106/mL ×) and double T bars denote standard deviation. Mann-Whitney U test was used. aP < 0.05, bP < 0.01, cP < 0.001 and dP < 0.0001; IL: Interleukin.
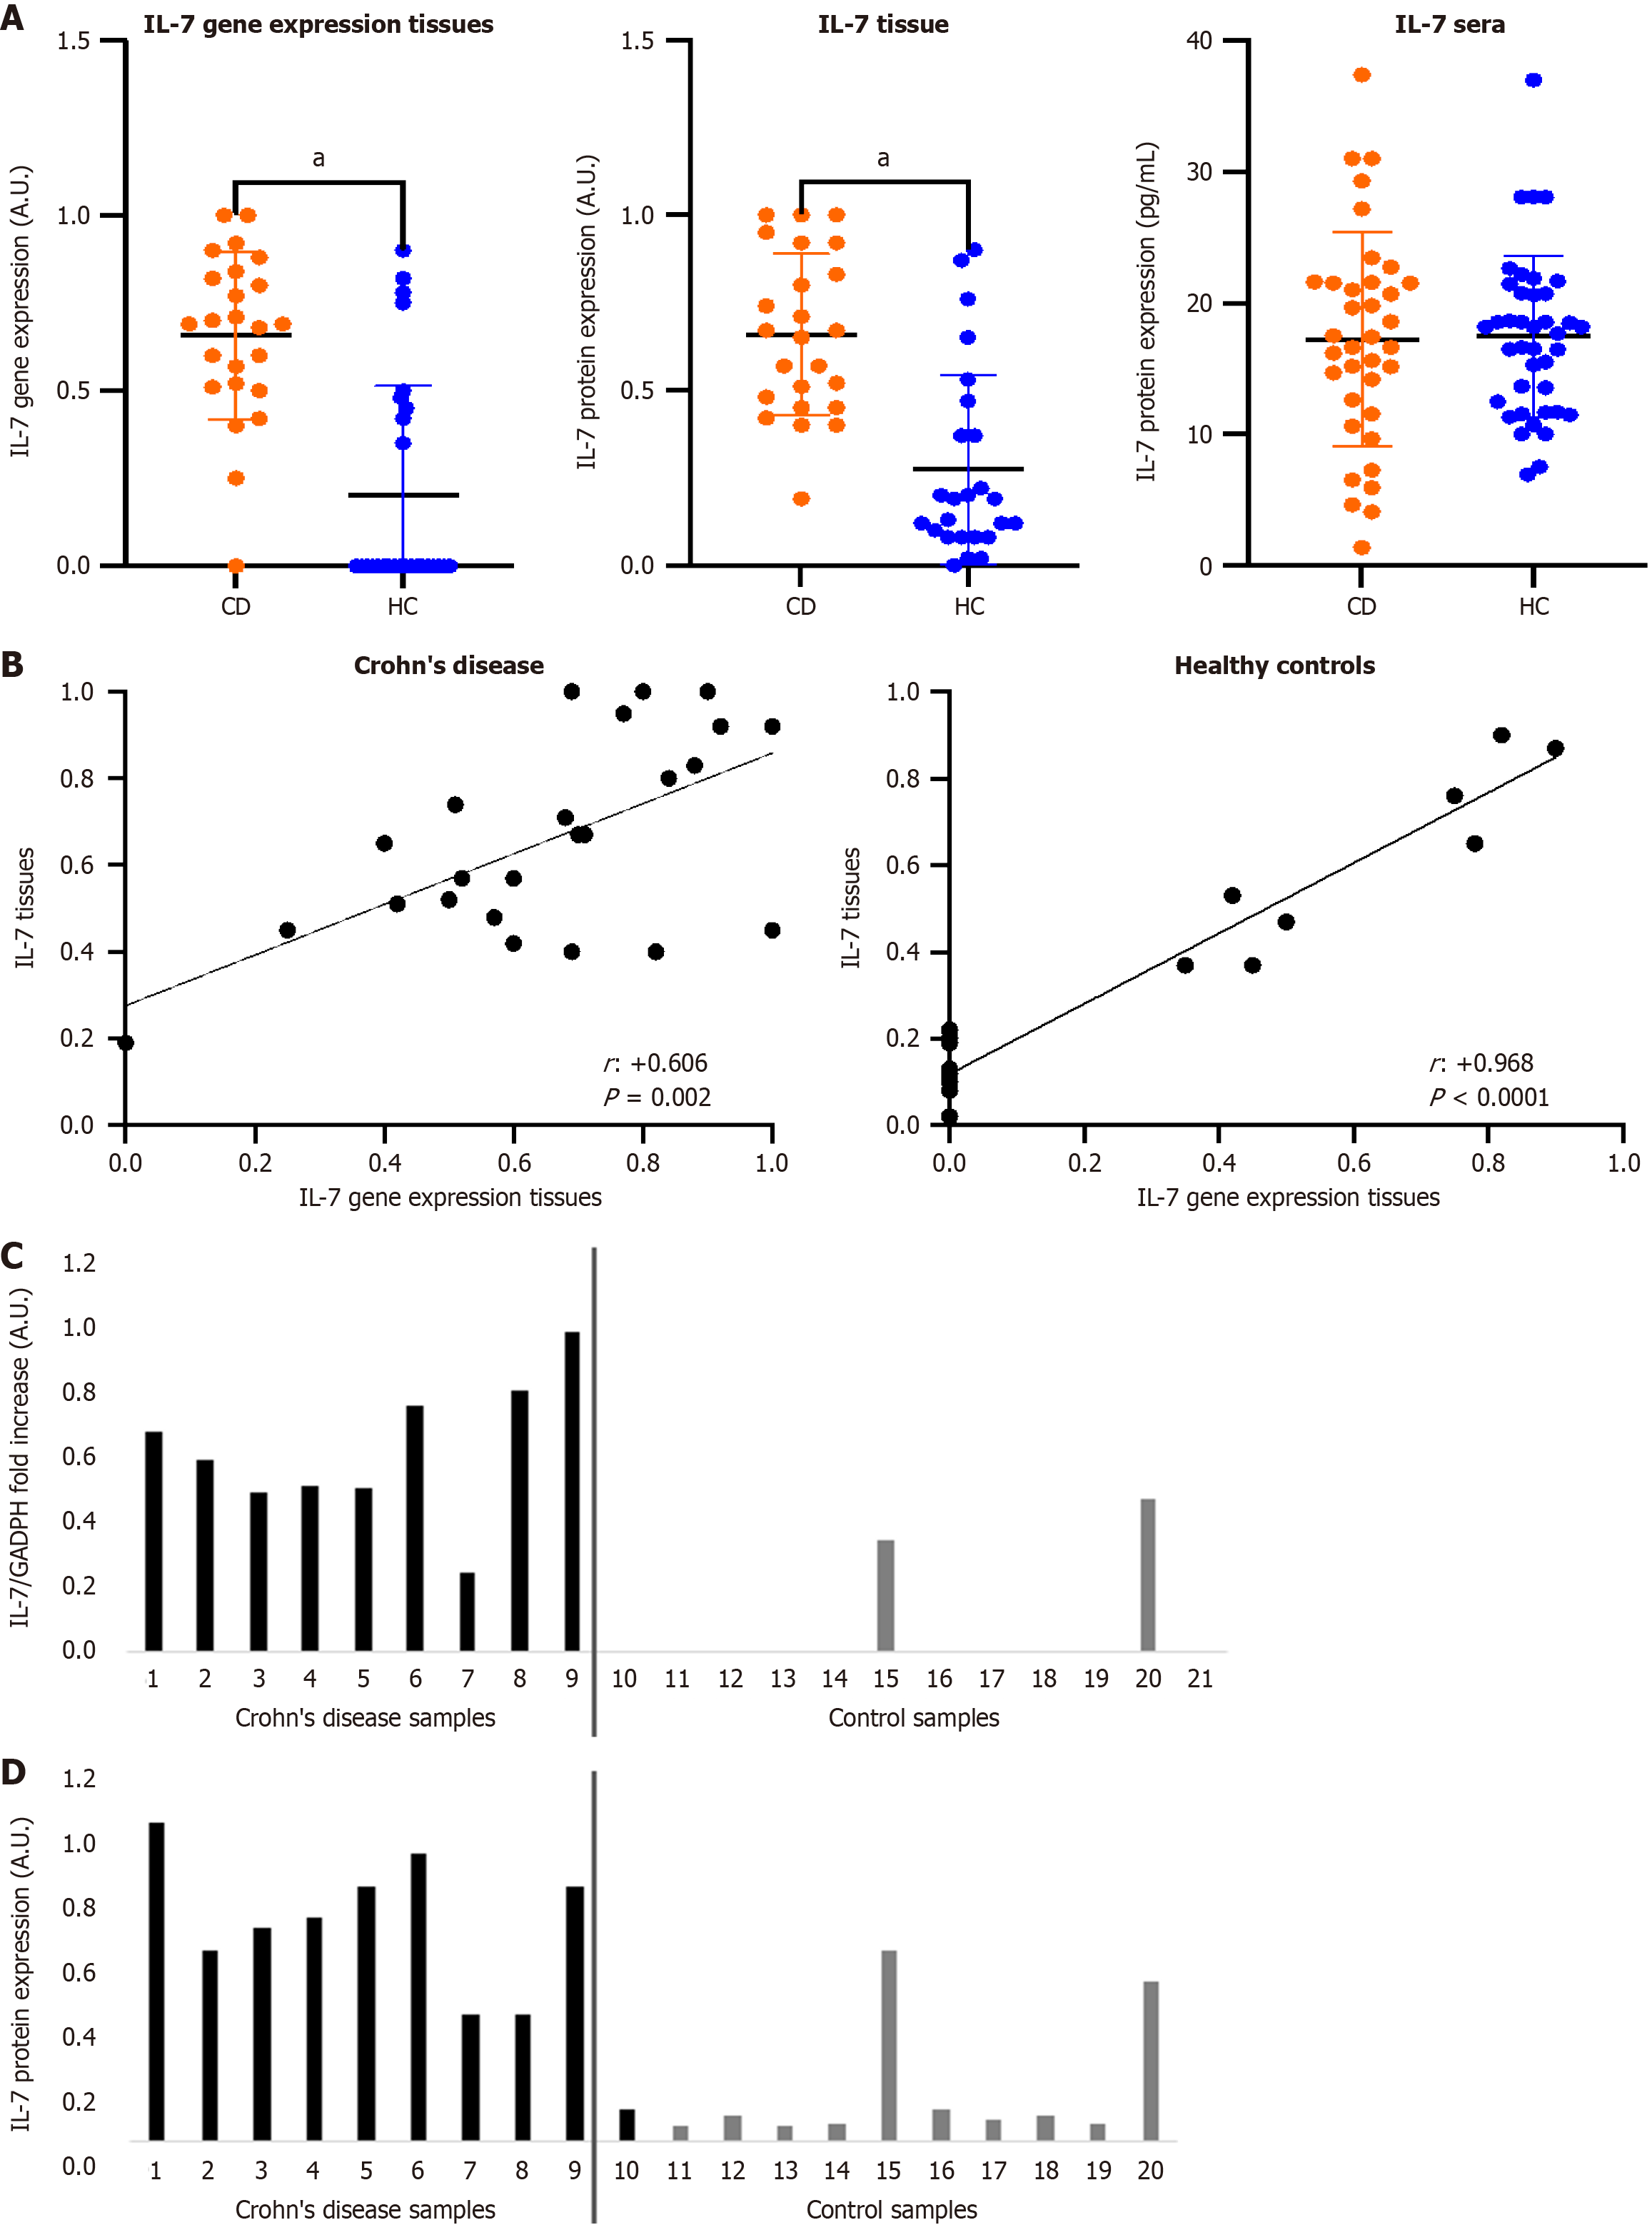
Figure 2 Interleukin 7 (IL-7) gene expression (retrotranscription-quantitative PCR) and IL-7 protein in tissues (Western blot analysis) and serum (enzyme-linked immunosorbent assay).
A: Differences in interleukin 7 (IL-7) gene expression and IL-7 protein levels in tissues [arbitrary units (AU)] of patients with Crohn's disease (CD) (n = 25) vs healthy controls (HCs) (n = 25), and IL-7 in serum (pg/mL). Values are expressed as means, and double T bars denote standard deviation (aP < 0.05). Mann-Whitney U test was used; B: Relationship of IL-7 gene expression and its levels in CD and HC tissues. Spearman’s r test was used; C: IL-7 gene expression to perform retrotranscription-qPCR. The relative expression of each gene was normalized against glyceraldehyde-3-phosphate dehydrogenase (GADPH) expression, used as reference standards; D: IL-7 protein expression. Western blot analysis was performed with protein extracts from intestinal biopsies. The loading control was done with anti-actin, 1:1000) (not shown). The visualized fragments were quantified by densitometry using the ImageJ software (National Institutes of Health, Bethesda, MD, United States).
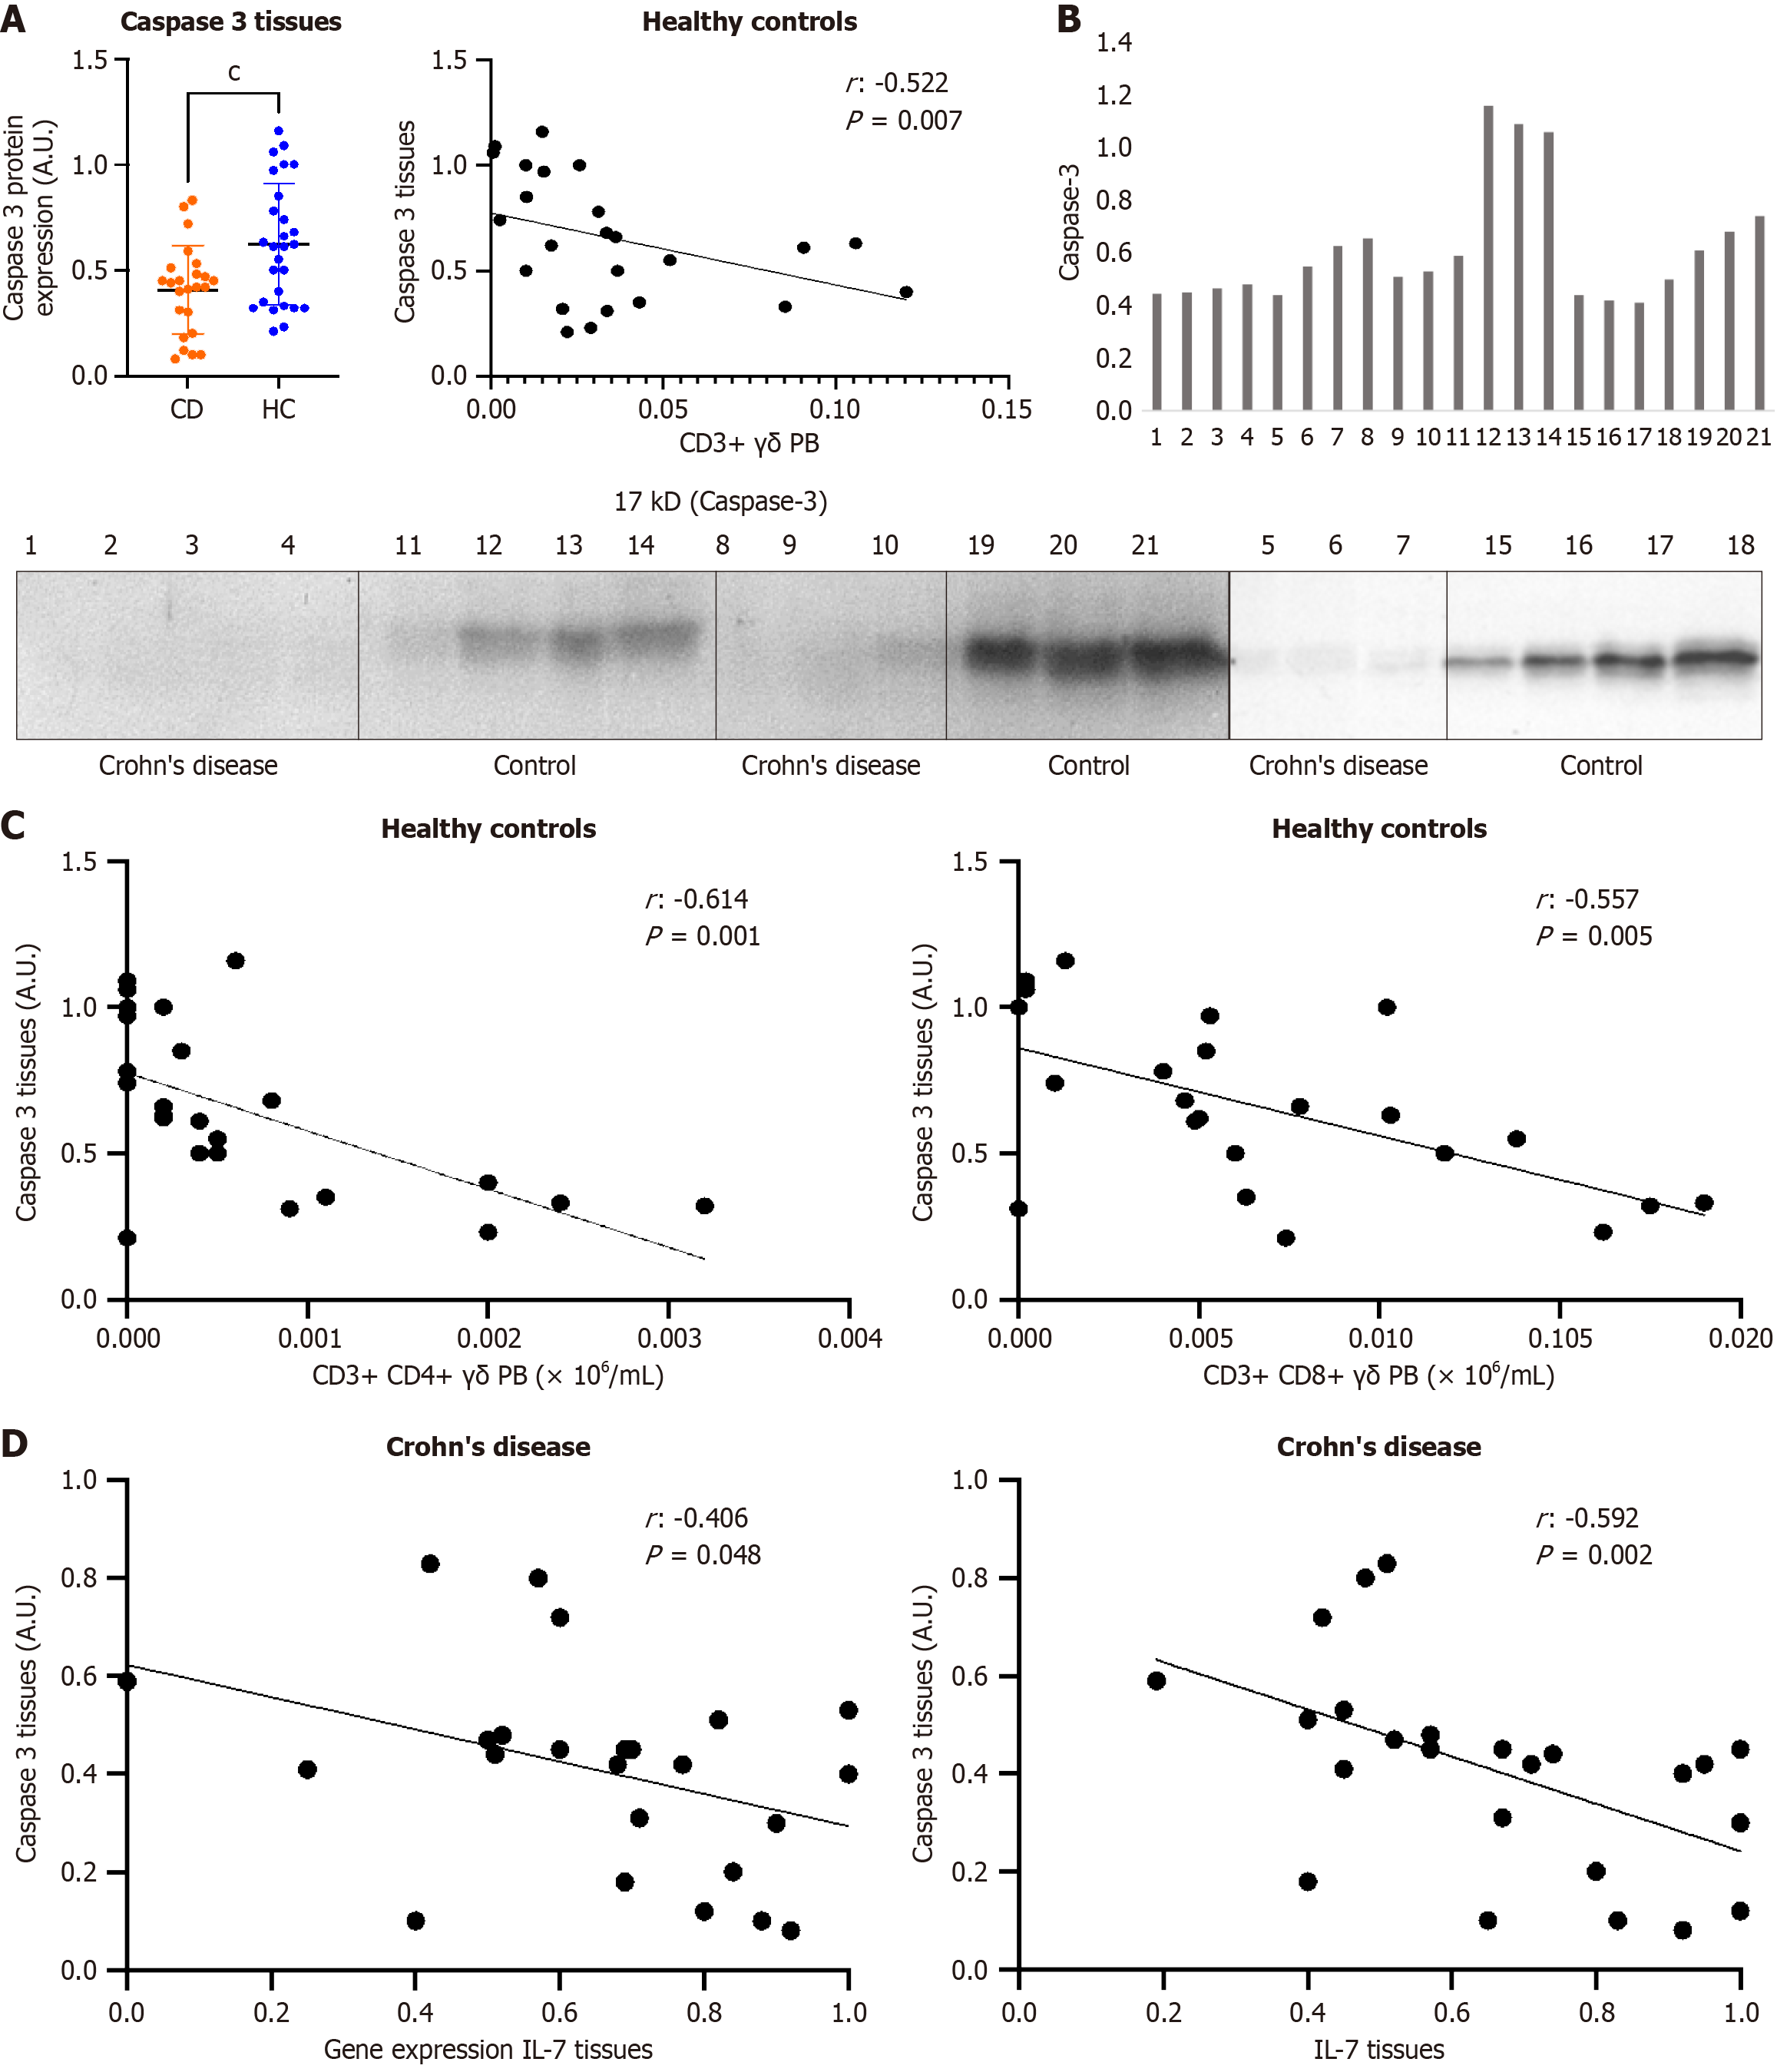
Figure 3 Caspase-3 protein in tissues (Western blot analysis).
A: Differences of caspase 3 protein [arbitrary units (AU)] in tissues of patients with Crohn's disease (CD) (n = 24) vs healthy controls (n = 24). Values are expressed as means (× 106/mL), and double T bars denote standard deviation (cP < 0.001). Mann-Whitney U test was used; B: Interleukin 7 (IL-7) protein expression. Western blot analysis was performed with protein extracts from intestinal biopsies. Loading control was done with anti-actin, 1:1000) (not shown). The visualized fragments were quantified by densitometry using ImageJ software (National Institutes of Health, Bethesda, MD, United States). Quantification of the expression band performed by ImageJ software; C: Significant relationship between γδ T cells subsets in peripheral blood and caspase-3 in tissues of healthy subjects. Spearman’s r test was used; D: Relationship between caspase-3 protein in tissue and IL-7 gene expression and Il-7 protein in tissues of patients with CD (n = 25). Spearman’s r test was used.
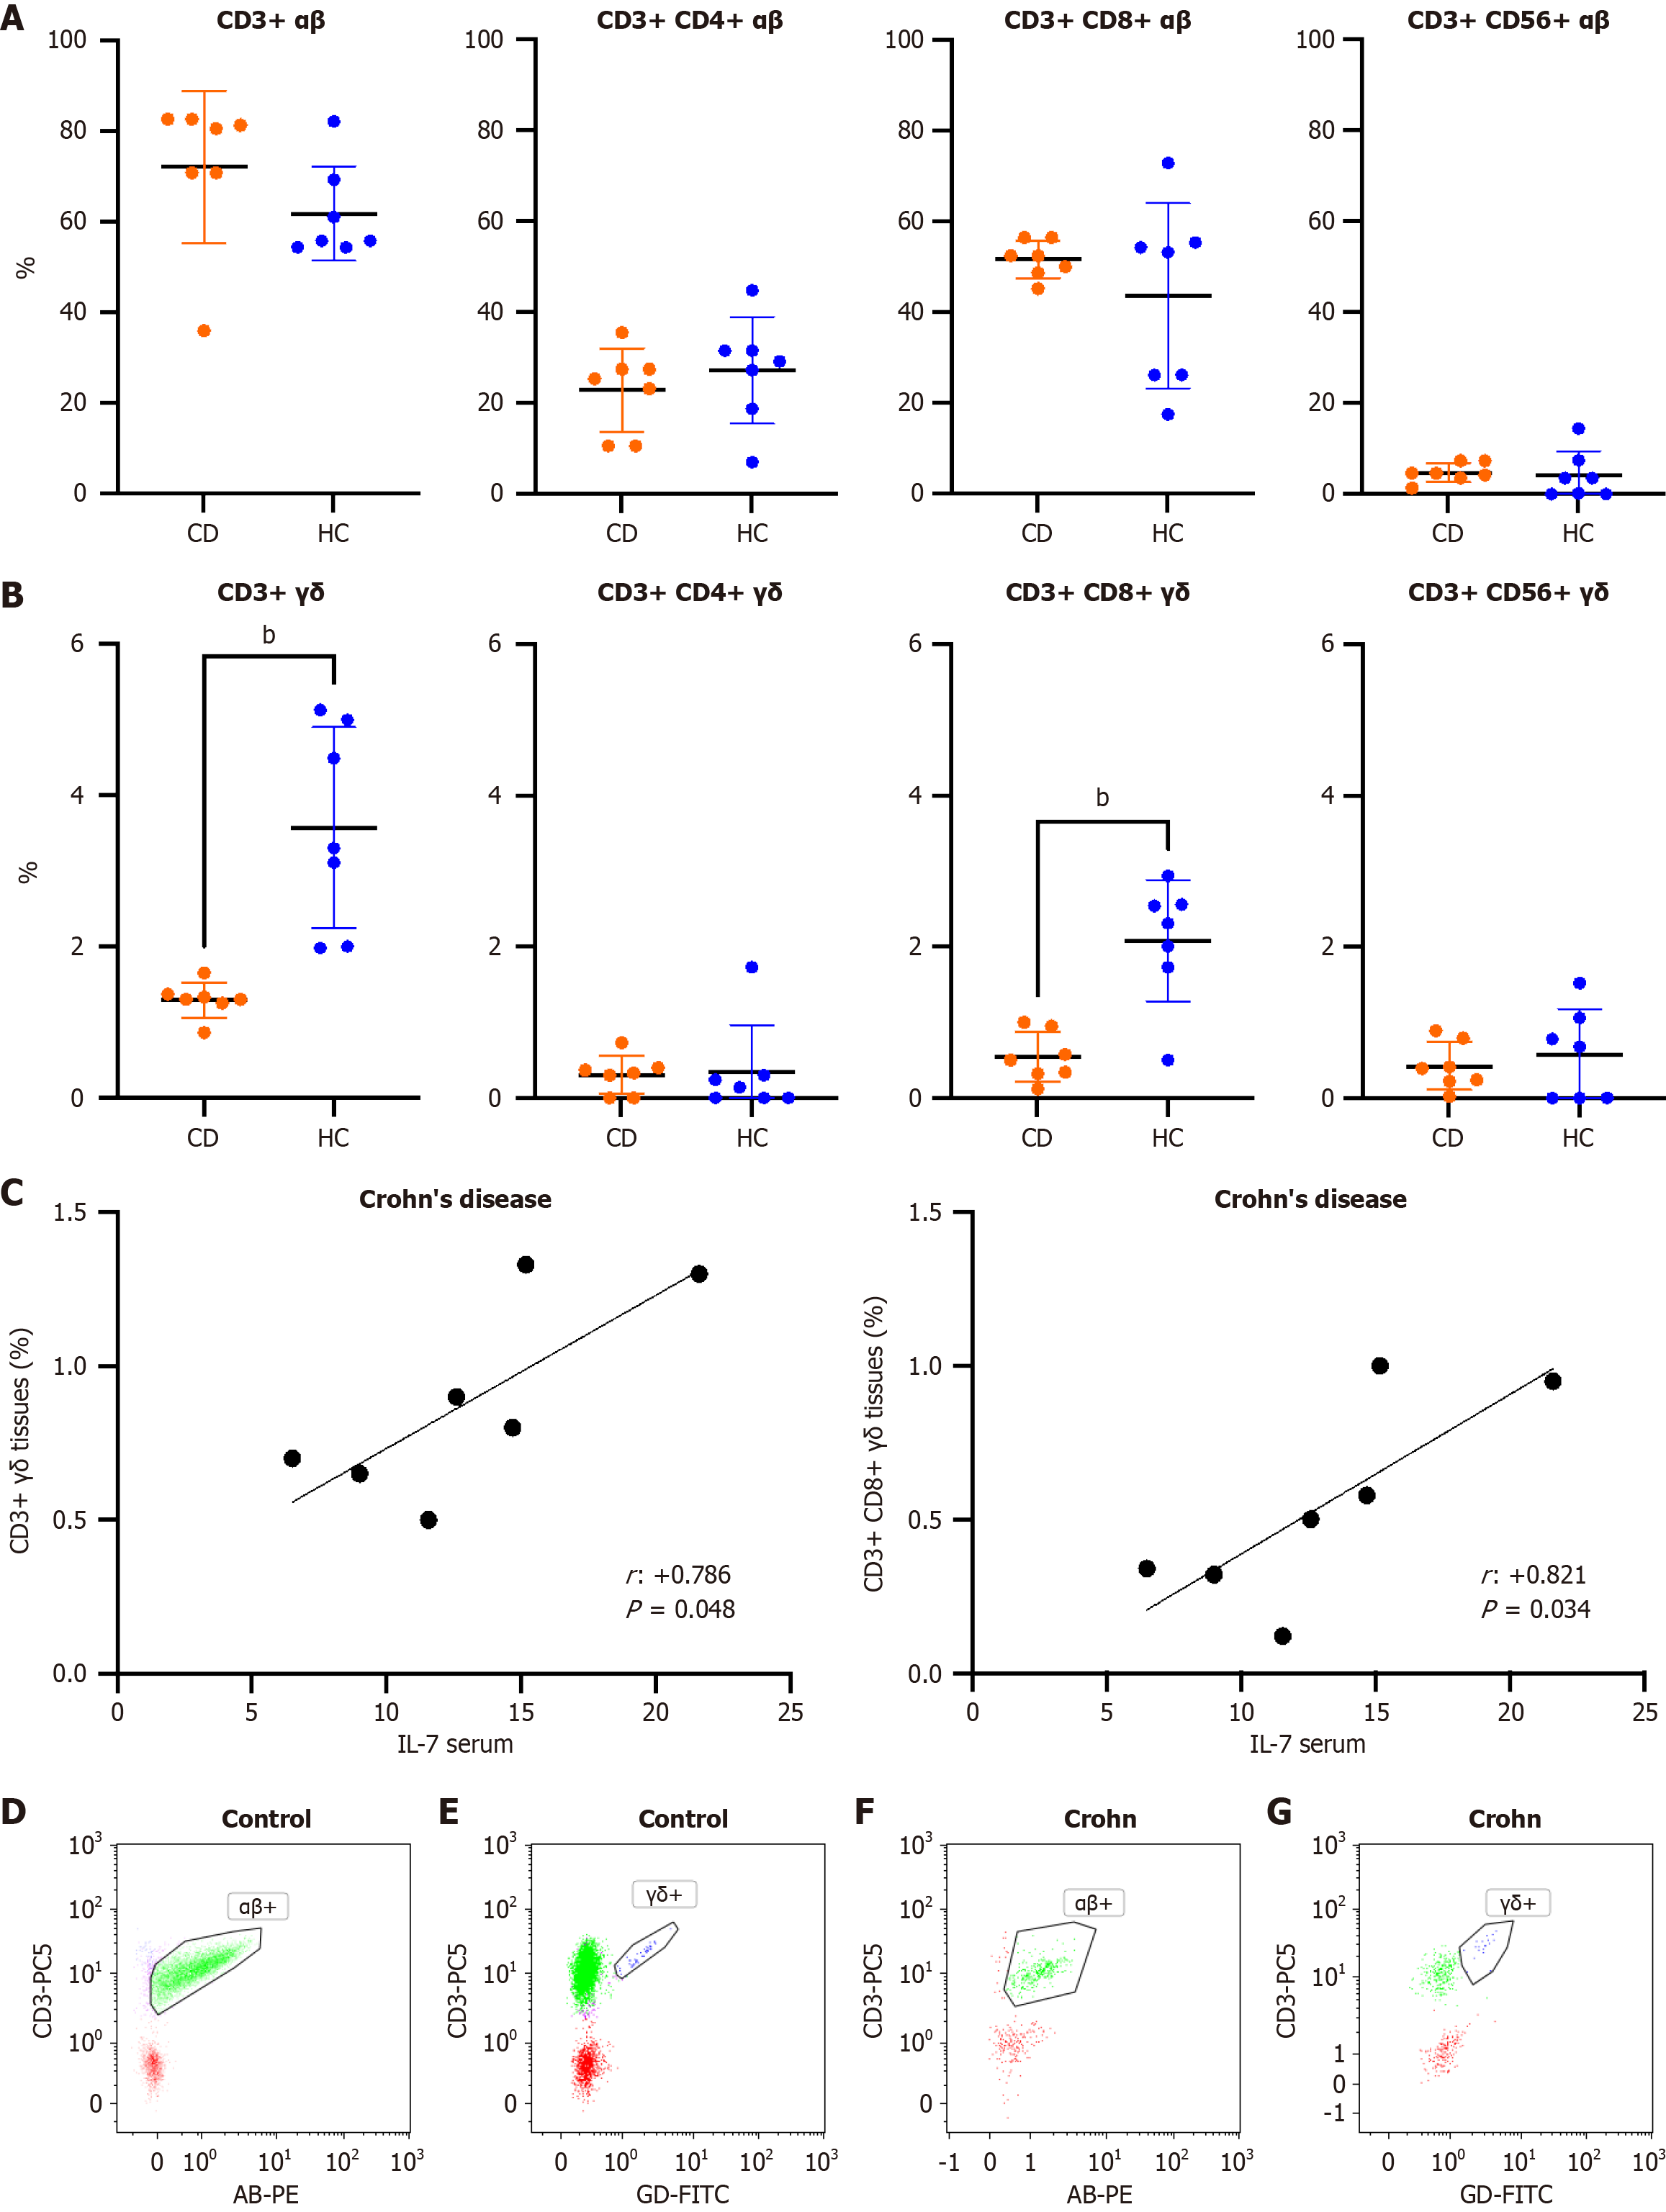
Figure 4 Frequency of T cells subset in tissues (flow cytometry).
A and B: Comparison of αβ T cells (A) and γδT cells (B) in tissues from patients with Crohn's disease (CD) (n = 7) and healthy controls (n = 7). Values are expressed as percentages, and double T bars indicate standard deviation (bP < 0.01). The Mann-Whitney U test was used; C: Relationship of interleukin 7 (IL-7) titers in peripheral blood with γδ T cells in tissues of patients with CD; D-G: Spearman's r test was used. Representative figures of αβ and γδ T cell subsets in tissues from healthy controls (D and E) and patients with CD (F and G) vs T cells were gated based on their low side scatter and high cluster of differentiation 45 (CD45) expression. After selection, we differentiated αβ+ (Panel D and F) and γδ+ (Panel E and G) T cell subsets in CD3 vs αβ/γδ dot plot.
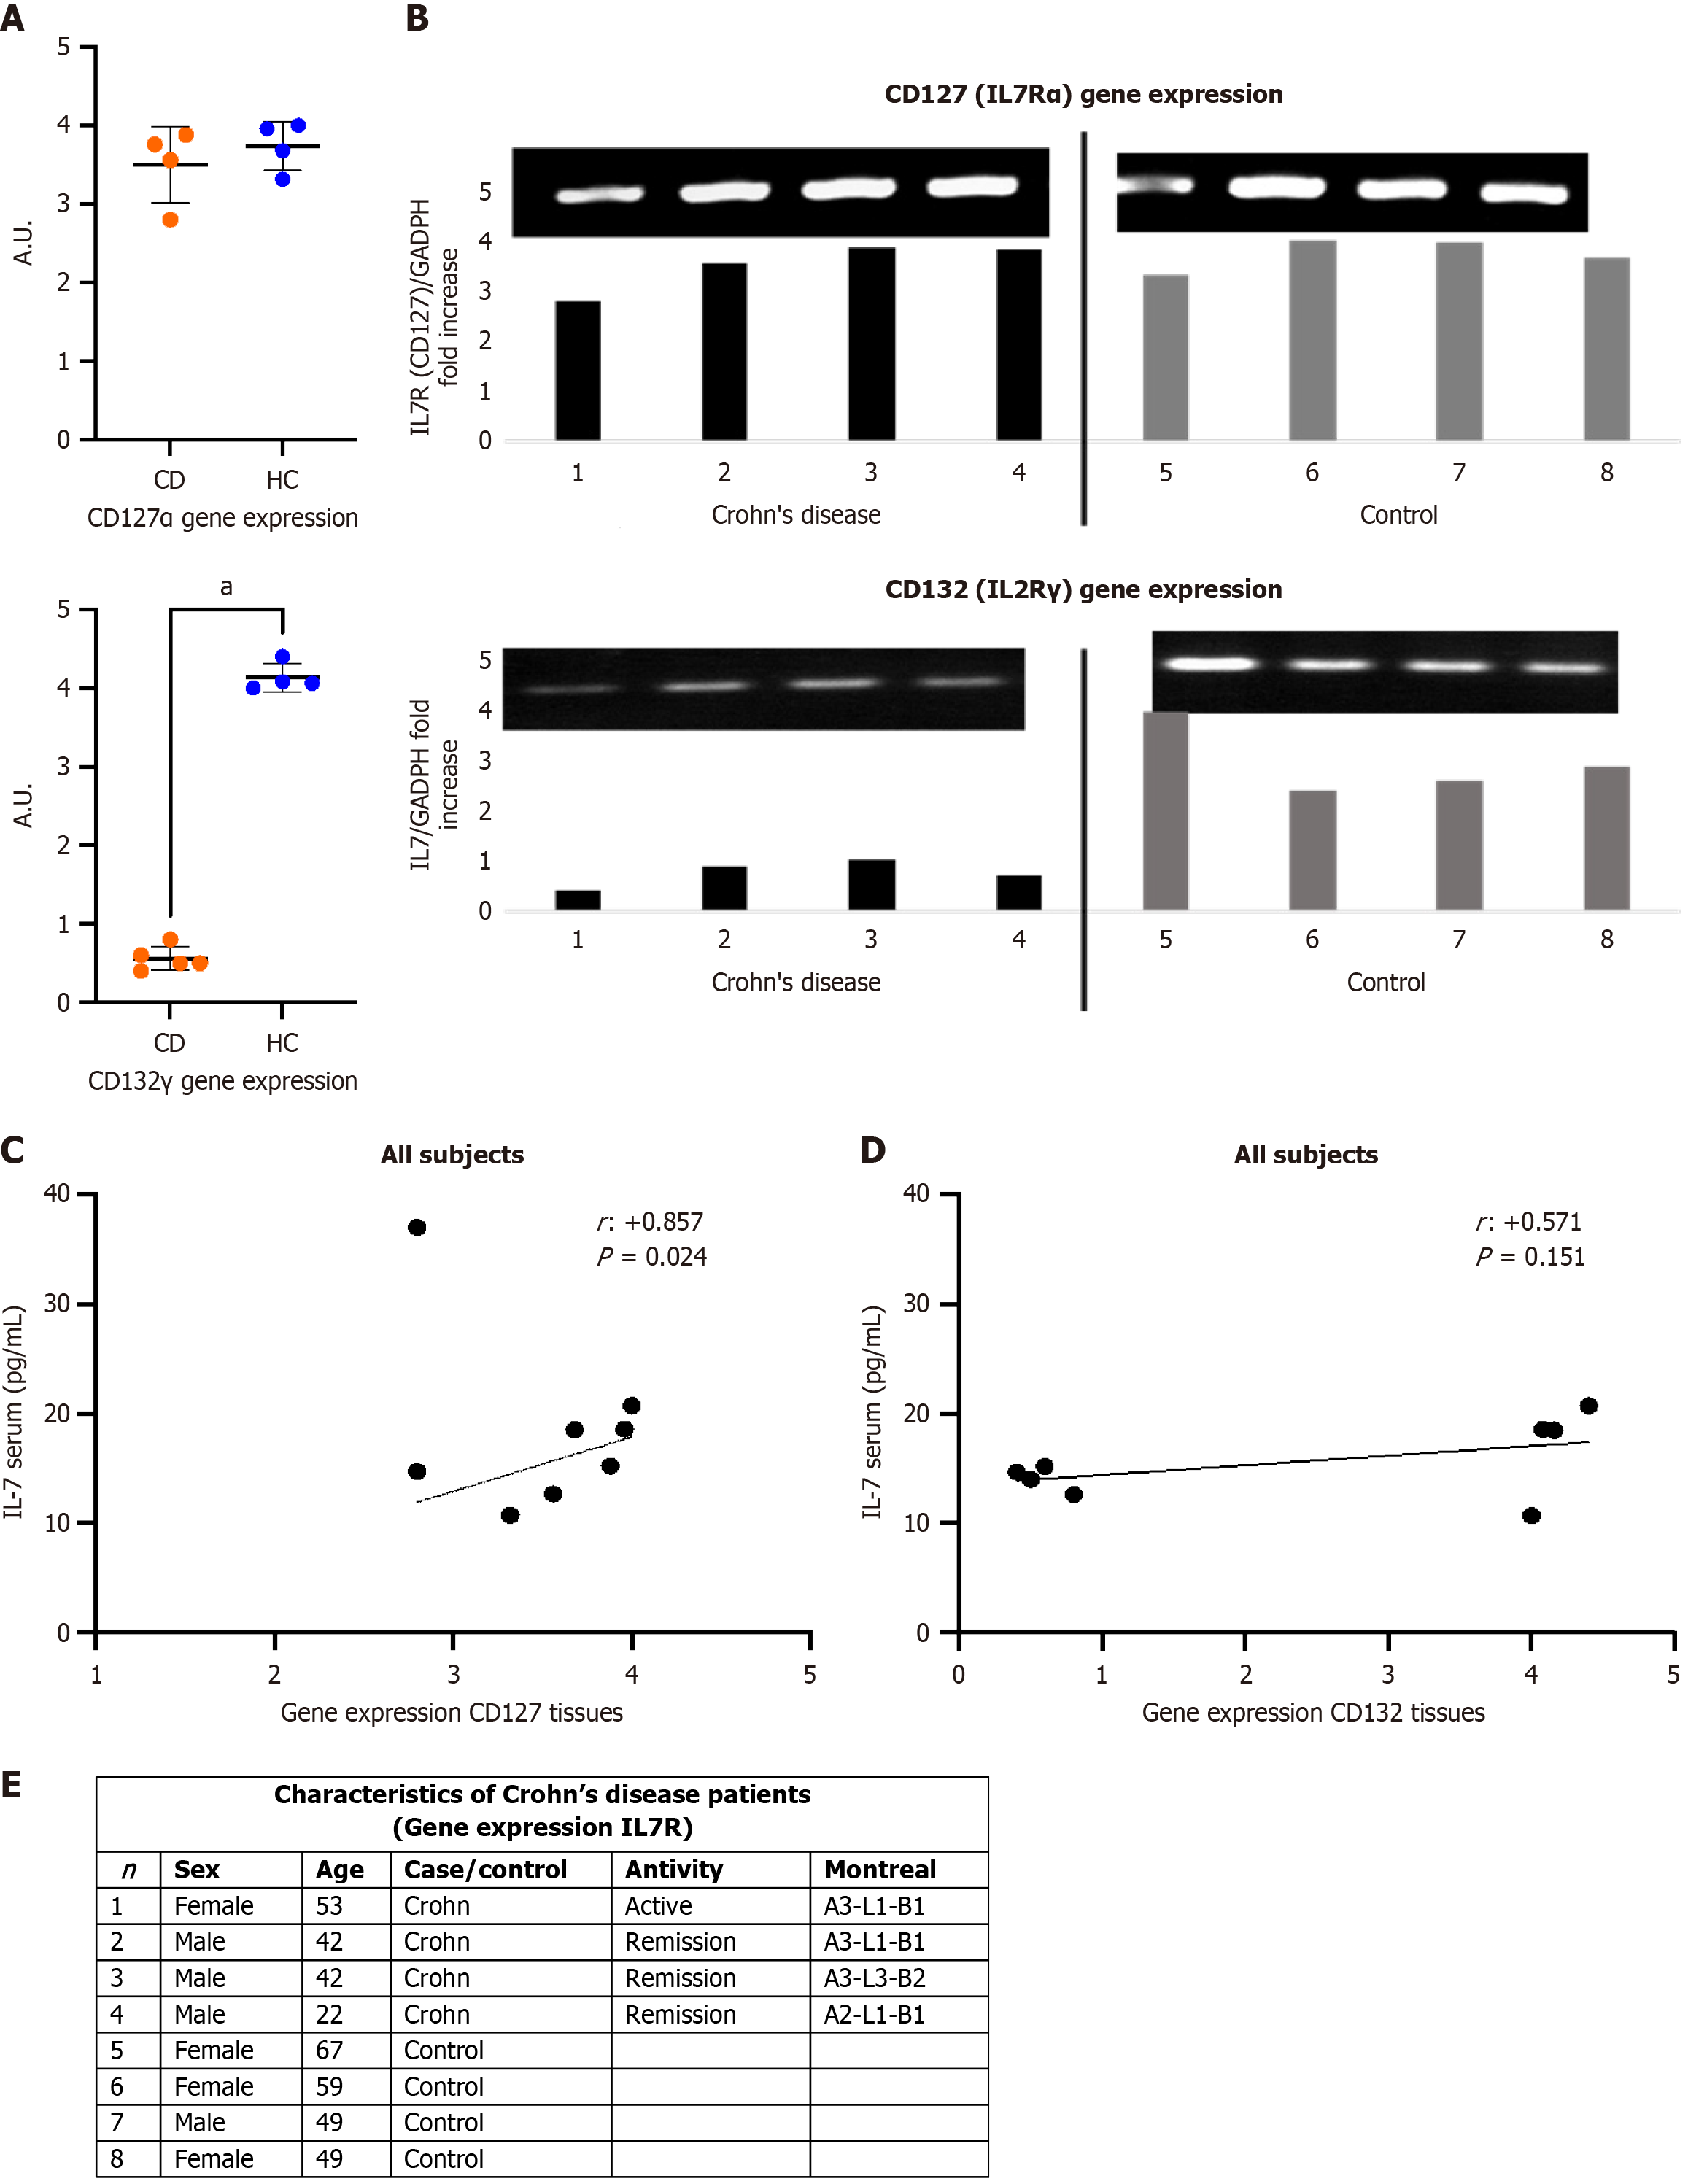
Figure 5 Interleukin 7 receptor gene expression (retrotranscription-quantitative PCR).
A: Comparation of interleukin 2 (IL-2) receptor subunit γ [cluster of differentiation (CD132)] gene expression of patients with Crohn's disease (CD) (n = 4) vs healthy controls (HCs) (n = 4); B: Gene expression of CD127 and CD132 to perform RT-PCR. The relative expression of each gene was normalized against glyceraldehyde-3-phosphate dehydrogenase (GADPH) expression, used as reference standards; C and D: Show the relationship of gene expression in tissues of CD127 and CD132 subunit with IL-7 serum titers of all subjects; E: Shows the characteristics of the subjects in whom the gene expression of IL-7 receptor has been analyzed. Values of CD127 and CD132 are expressed as arbitrary units (AU), and double T bars denote standard deviation. Mann-Whitney U test was used (aP < 0.05). Correlations: Spearman’s r test was used.
- Citation: Andreu-Ballester JC, Hurtado-Marcos C, García-Ballesteros C, Pérez-Griera J, Izquierdo F, Ollero D, Jiménez A, Gil-Borrás R, Llombart-Cussac A, López-Chuliá F, Cuéllar C. Decreased gene expression of interleukin 2 receptor subunit γ (CD132) in tissues of patients with Crohn’s disease. World J Gastroenterol 2025; 31(12): 97120
- URL: https://www.wjgnet.com/1007-9327/full/v31/i12/97120.htm
- DOI: https://dx.doi.org/10.3748/wjg.v31.i12.97120


