Copyright
©The Author(s) 2025.
World J Gastroenterol. Mar 28, 2025; 31(12): 104952
Published online Mar 28, 2025. doi: 10.3748/wjg.v31.i12.104952
Published online Mar 28, 2025. doi: 10.3748/wjg.v31.i12.104952
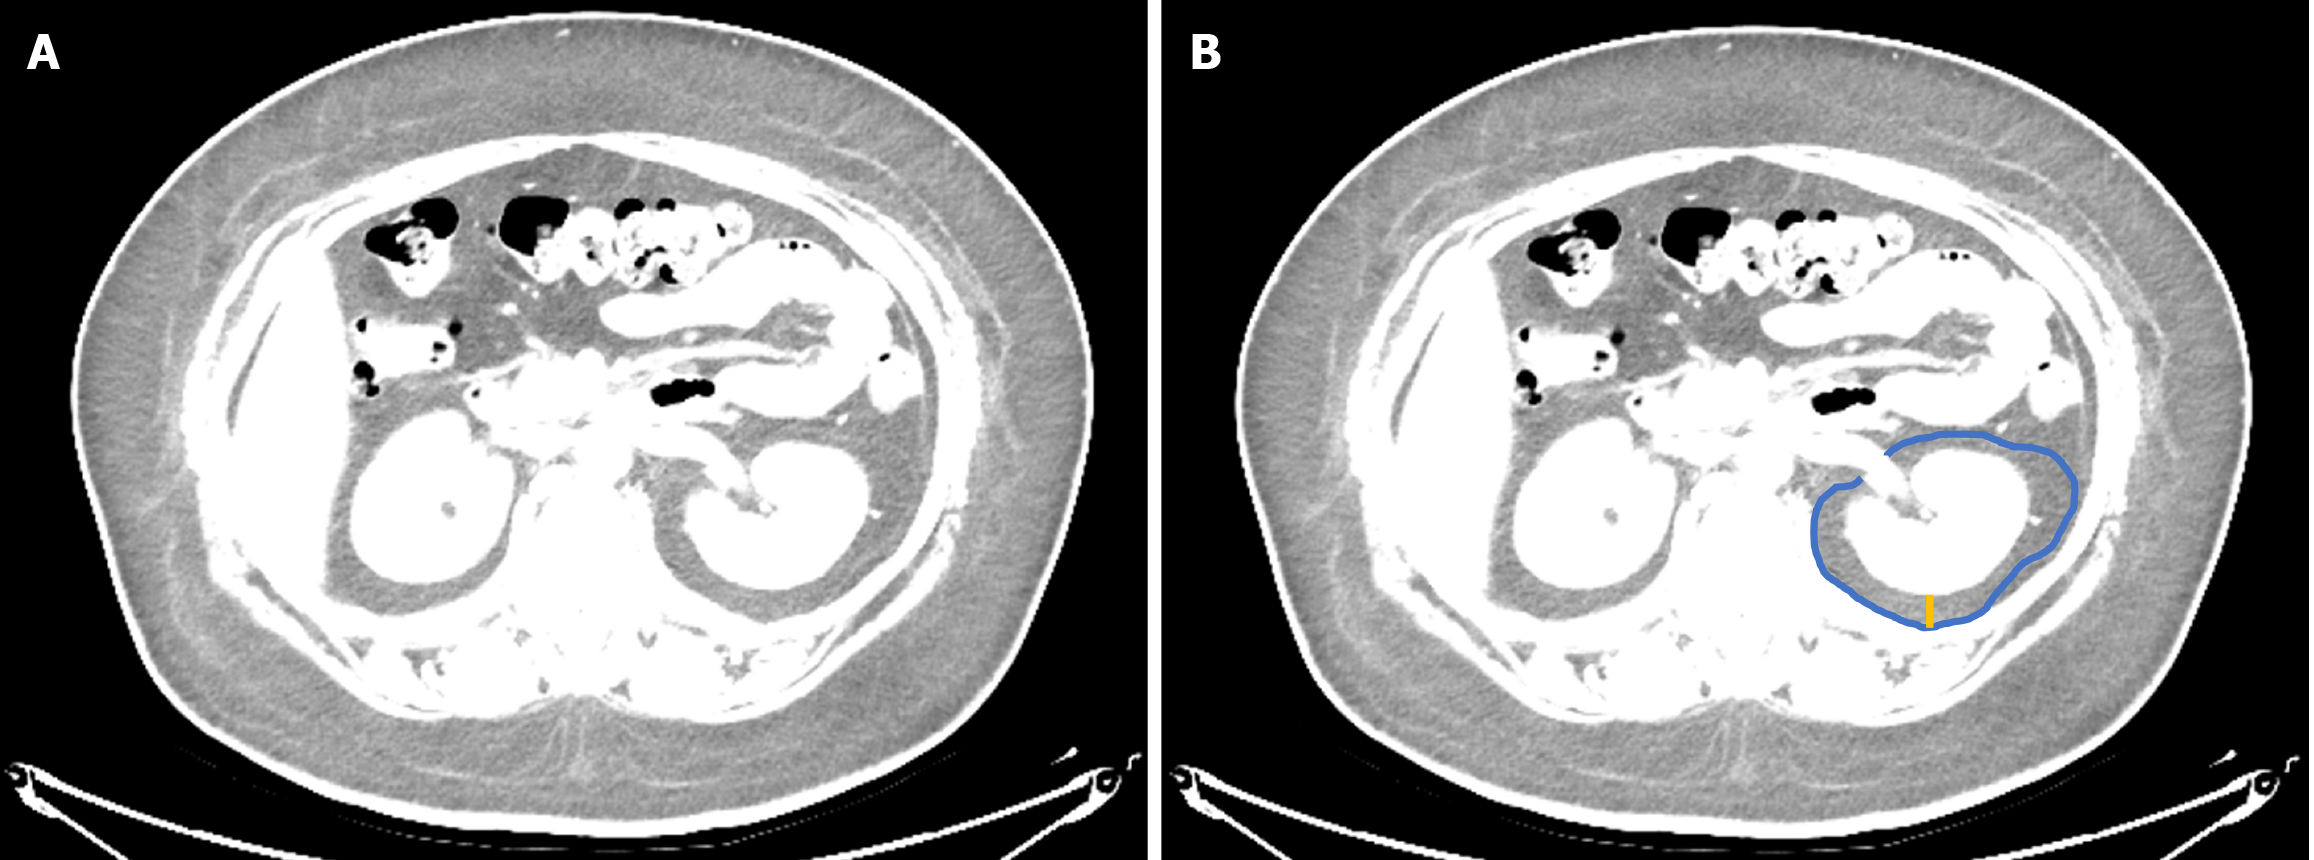
Figure 1 The schematic diagram for measuring the perirenal fat area and perirenal fat thickness.
A: At the level of the left renal vein, the computed tomography window width was adjusted to 150 HU, and the window level was adjusted to -120 HU; B: The blue line represents the boundary line of perirenal fat area, and the yellow line represents the length of perirenal fat thickness.
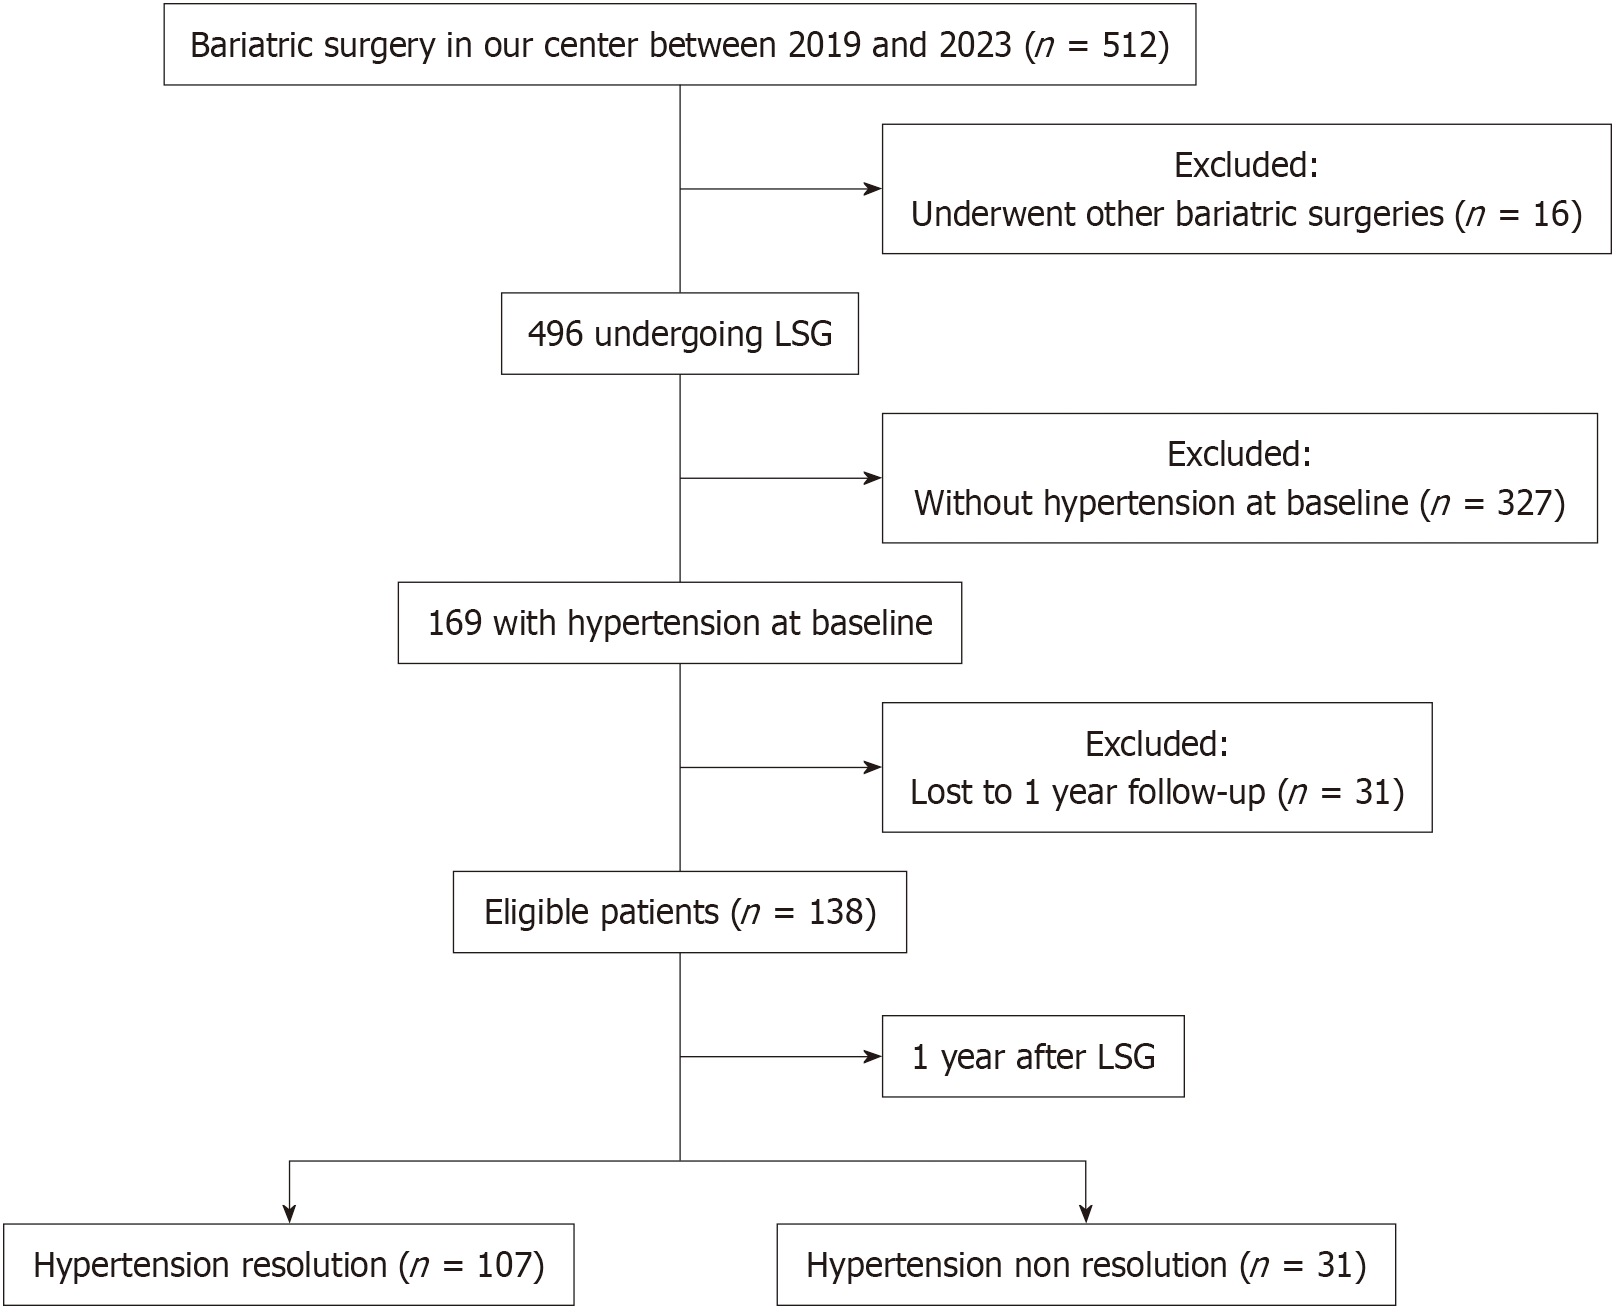
Figure 2 Flowchart of study participants.
LSG: Laparoscopic sleeve gastrectomy.
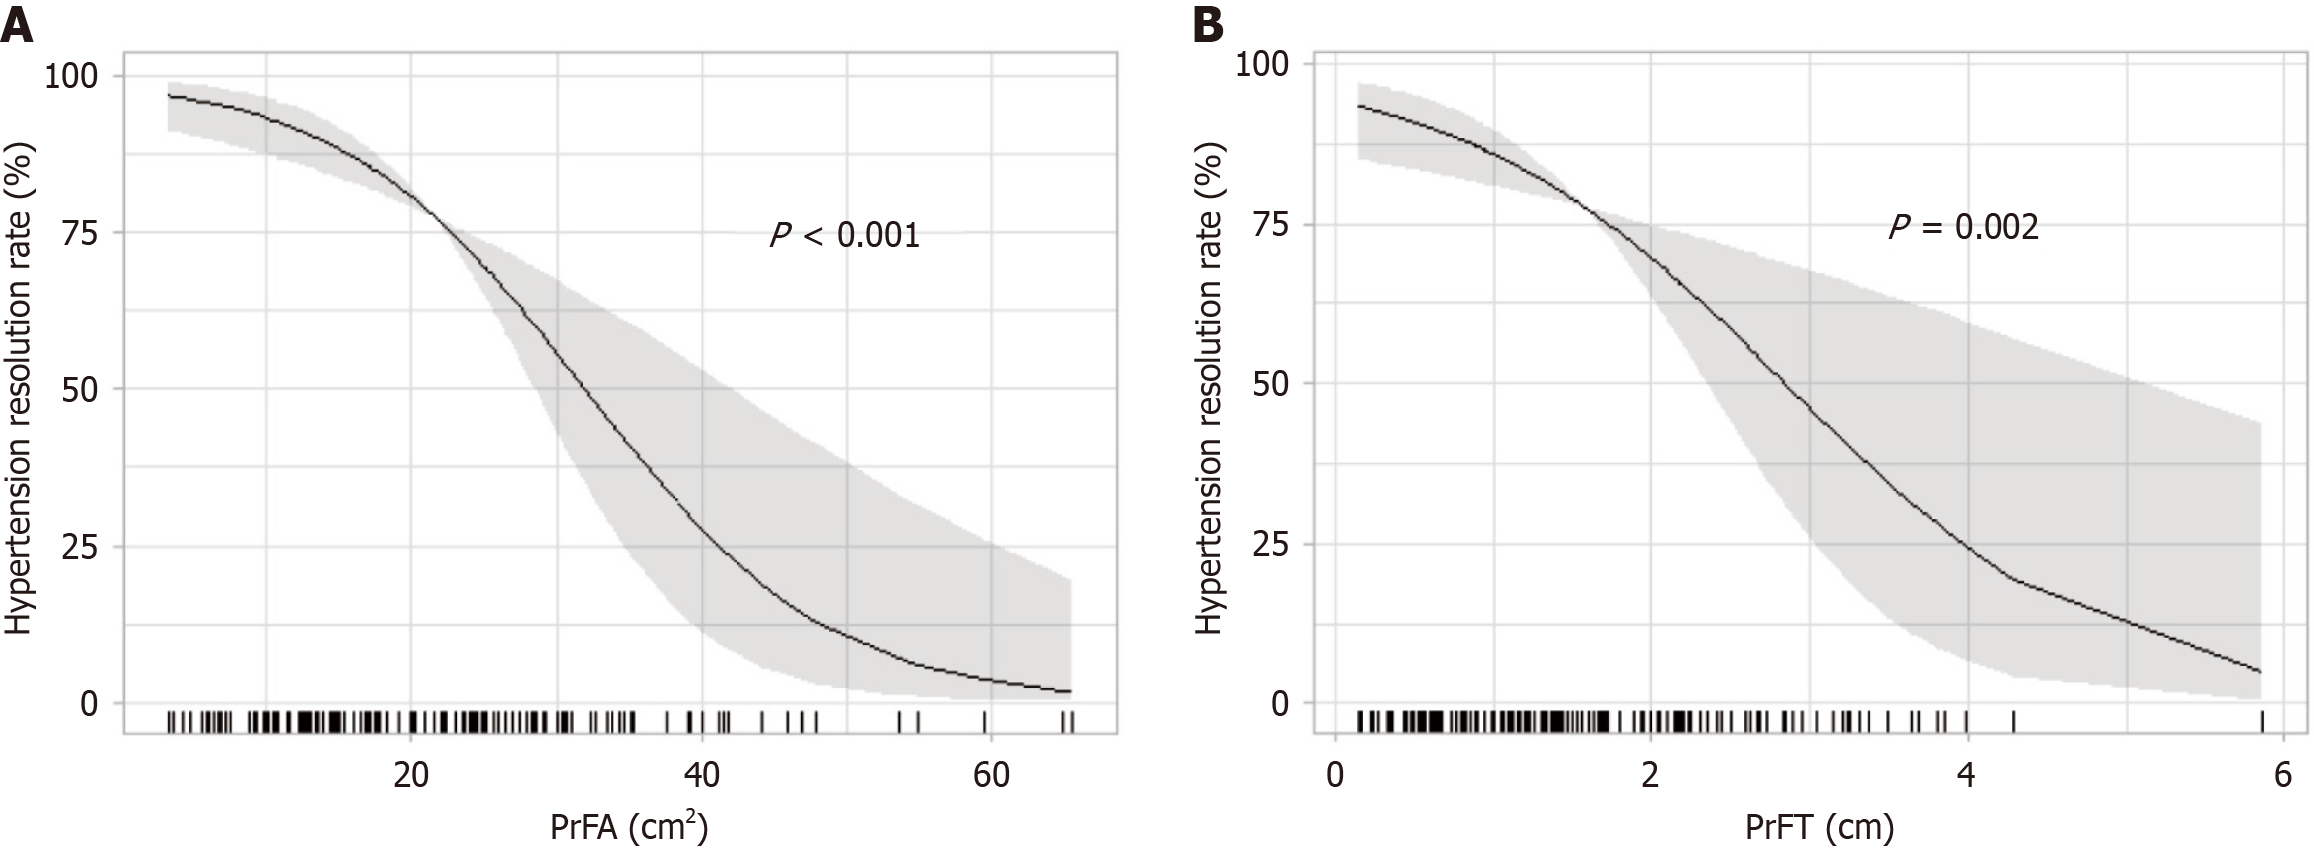
Figure 3 Perirenal fat area and perirenal fat thickness were correlated with the curve of postoperative hypertension resolution rates.
Preoperative blood pressure and other factors were used as covariates, with perirenal fat area or perirenal fat thickness as independent variables and resolution rate as the outcome variable to construct a generalized additive model. The solid line represents the fitted values, and the shaded area indicates the 95% confidence interval. A: Using perirenal fat area as the independent variable; B: Using perirenal fat thickness as the independent variable. PrFA: Perirenal fat area; PrFT: Perirenal fat thickness.
- Citation: Li Y, Zheng KY, Liu ZL, Yu TM, Zhang WJ, Zhong MW, Hu SY. Perirenal fat area is a preoperative predictor of hypertension resolution after laparoscopic sleeve gastrectomy: Generalized additive models. World J Gastroenterol 2025; 31(12): 104952
- URL: https://www.wjgnet.com/1007-9327/full/v31/i12/104952.htm
- DOI: https://dx.doi.org/10.3748/wjg.v31.i12.104952


