Copyright
©The Author(s) 2025.
World J Gastroenterol. Mar 28, 2025; 31(12): 103991
Published online Mar 28, 2025. doi: 10.3748/wjg.v31.i12.103991
Published online Mar 28, 2025. doi: 10.3748/wjg.v31.i12.103991
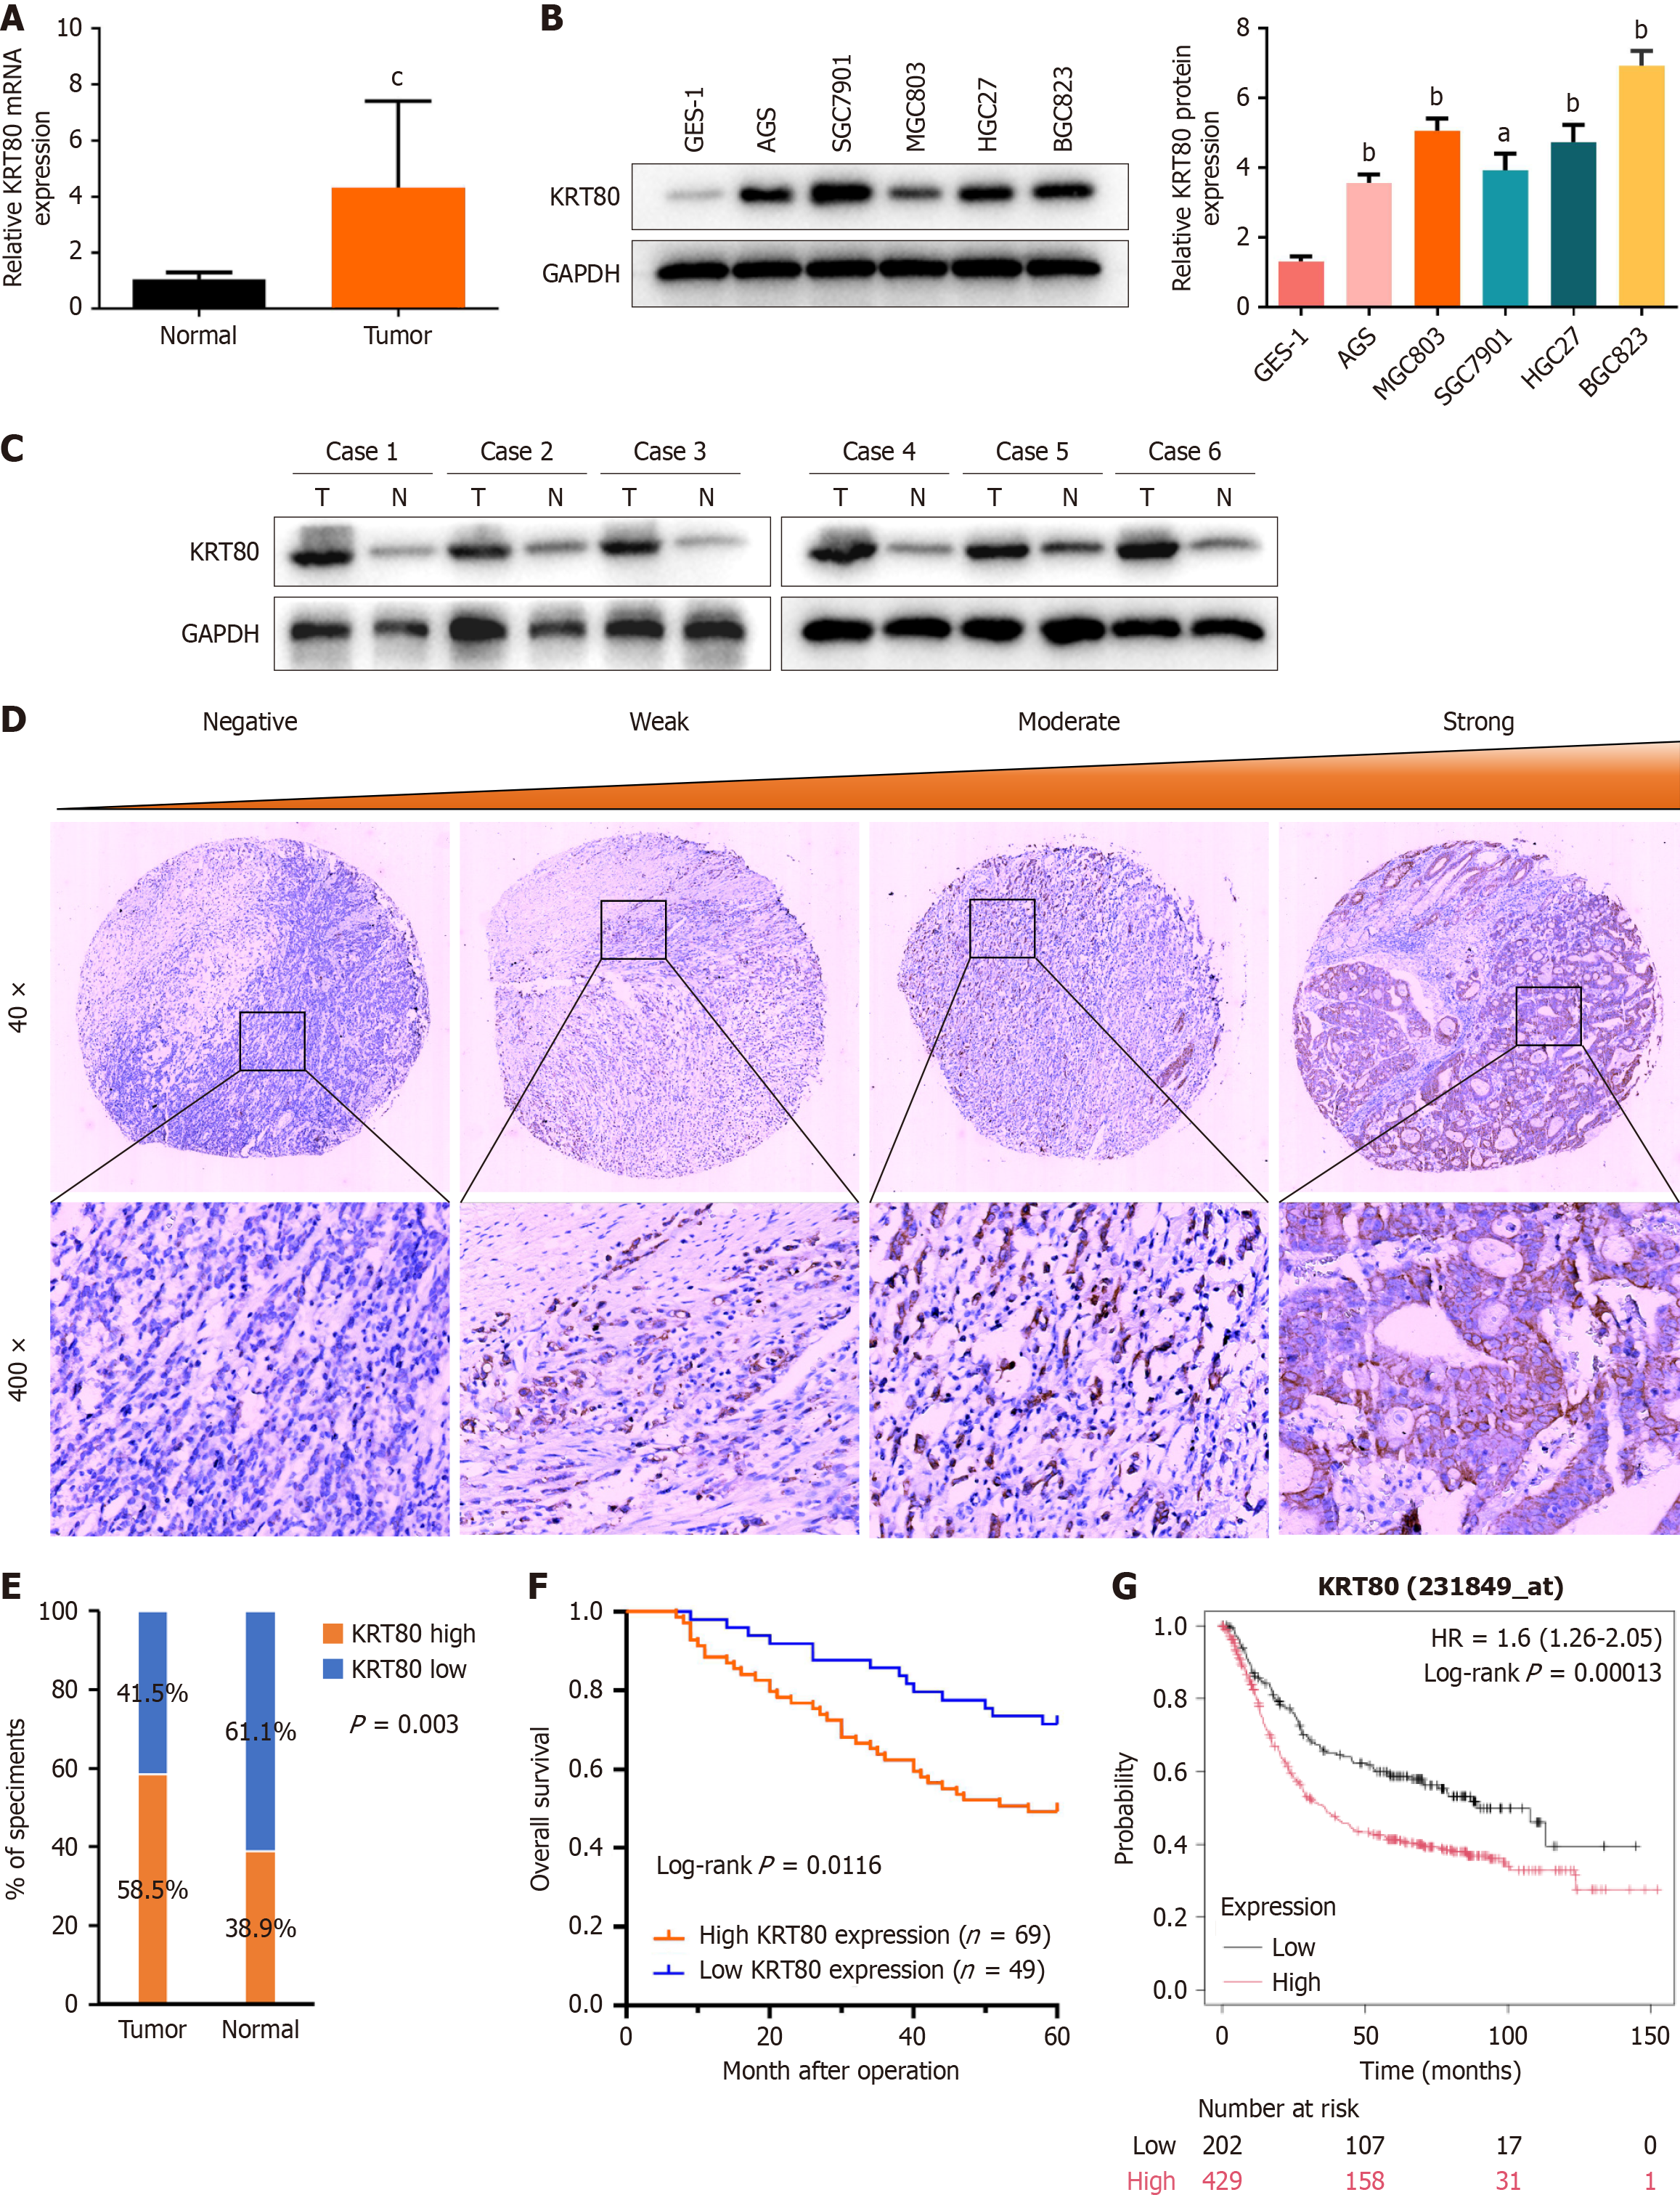
Figure 1 Keratin 80 expression is upregulated in gastric cancer and predicts an unfavorable prognosis.
A-C: The mRNA expression level and protein expression of keratin 80 (KRT80) was quantified by quantitative real-time PCR and Western blot, the results show that KRT80 is upregulated in both gastric cancer (GC) cells and tumor tissues; D: Representative immunohistochemical staining images showing KRT80 expression in a GC tissue microarray; E: Statistical analysis of KRT80 expression in GC and adjacent normal tissues, where the final score represents the product of the staining area and intensity. High expression was classified as a final score of ≥ 5, while low expression was defined by a score of 0-4; F: Kaplan-Meier survival analysis comparing survival rates of GC patients with high and low KRT80 expression from our study; G: Kaplan-Meier survival curve of KRT80 expression data retrieved from the Kaplan-Meier Plotter database. Data are shown as the mean ± SD (n = 3). aP < 0.05; bP < 0.05; cP < 0.001; KRT80: Keratin 80; HR: Hazard ratio.
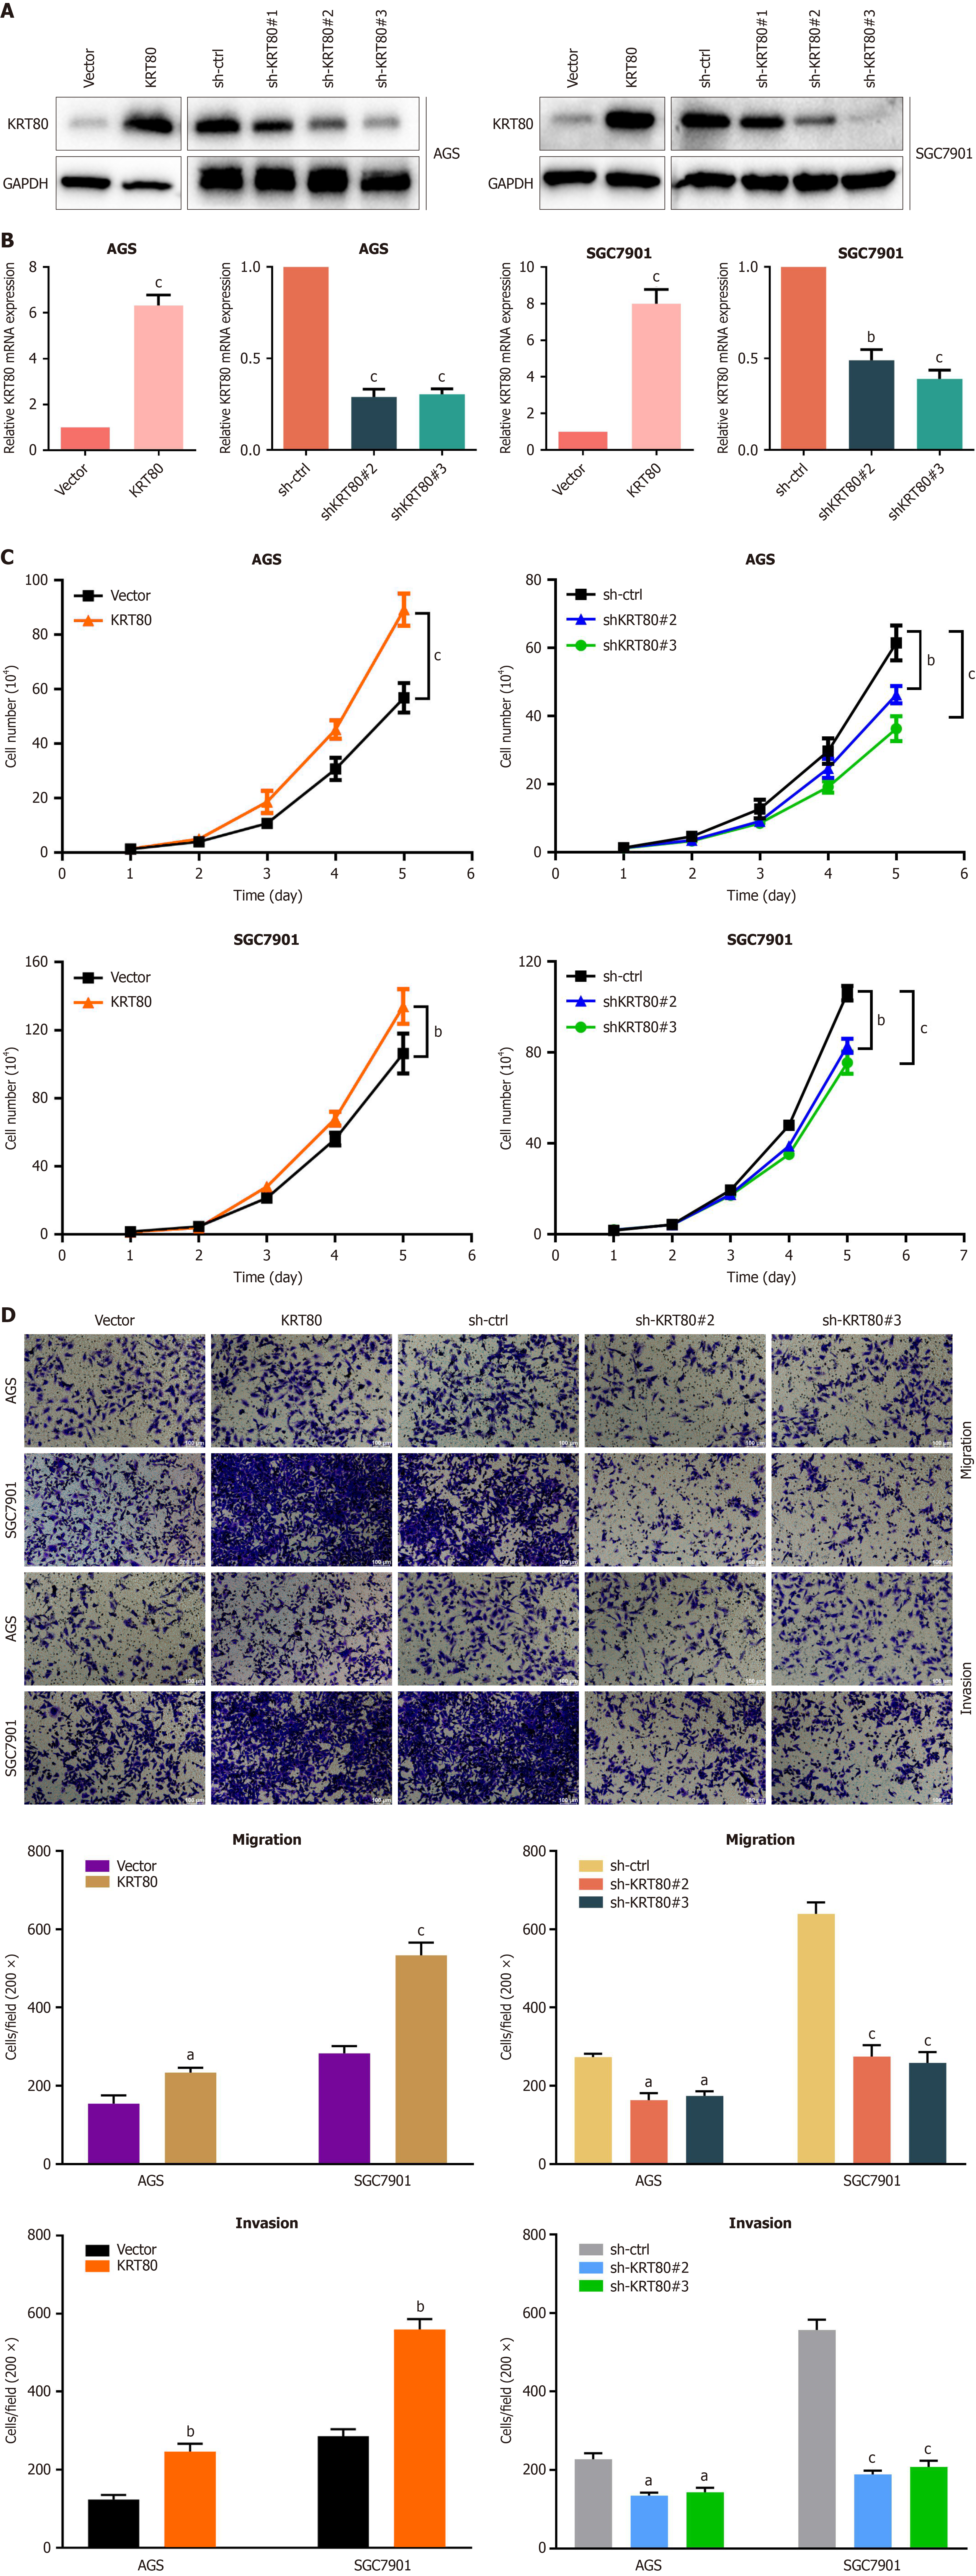
Figure 2 The expression level of keratin 80 affects the gastric cancer cells malignant phenotypes.
A and B: Western blot analysis and quantitative real-time PCR were employed to confirm the overexpression and knockdown efficiency of keratin 80 (KRT80) in the gastric cancer (GC) cells; C: The effect of KRT80 overexpression or knockdown on GC cell proliferation was assessed using cell growth curve analysis; D: Transwell assays were performed to evaluate the migratory and invasive capabilities of GC cells with stable overexpression or knockdown of KRT80. Data are shown as the mean ± SD (n = 3). aP < 0.05; bP < 0.05; cP < 0.001; KRT80: Keratin 80.
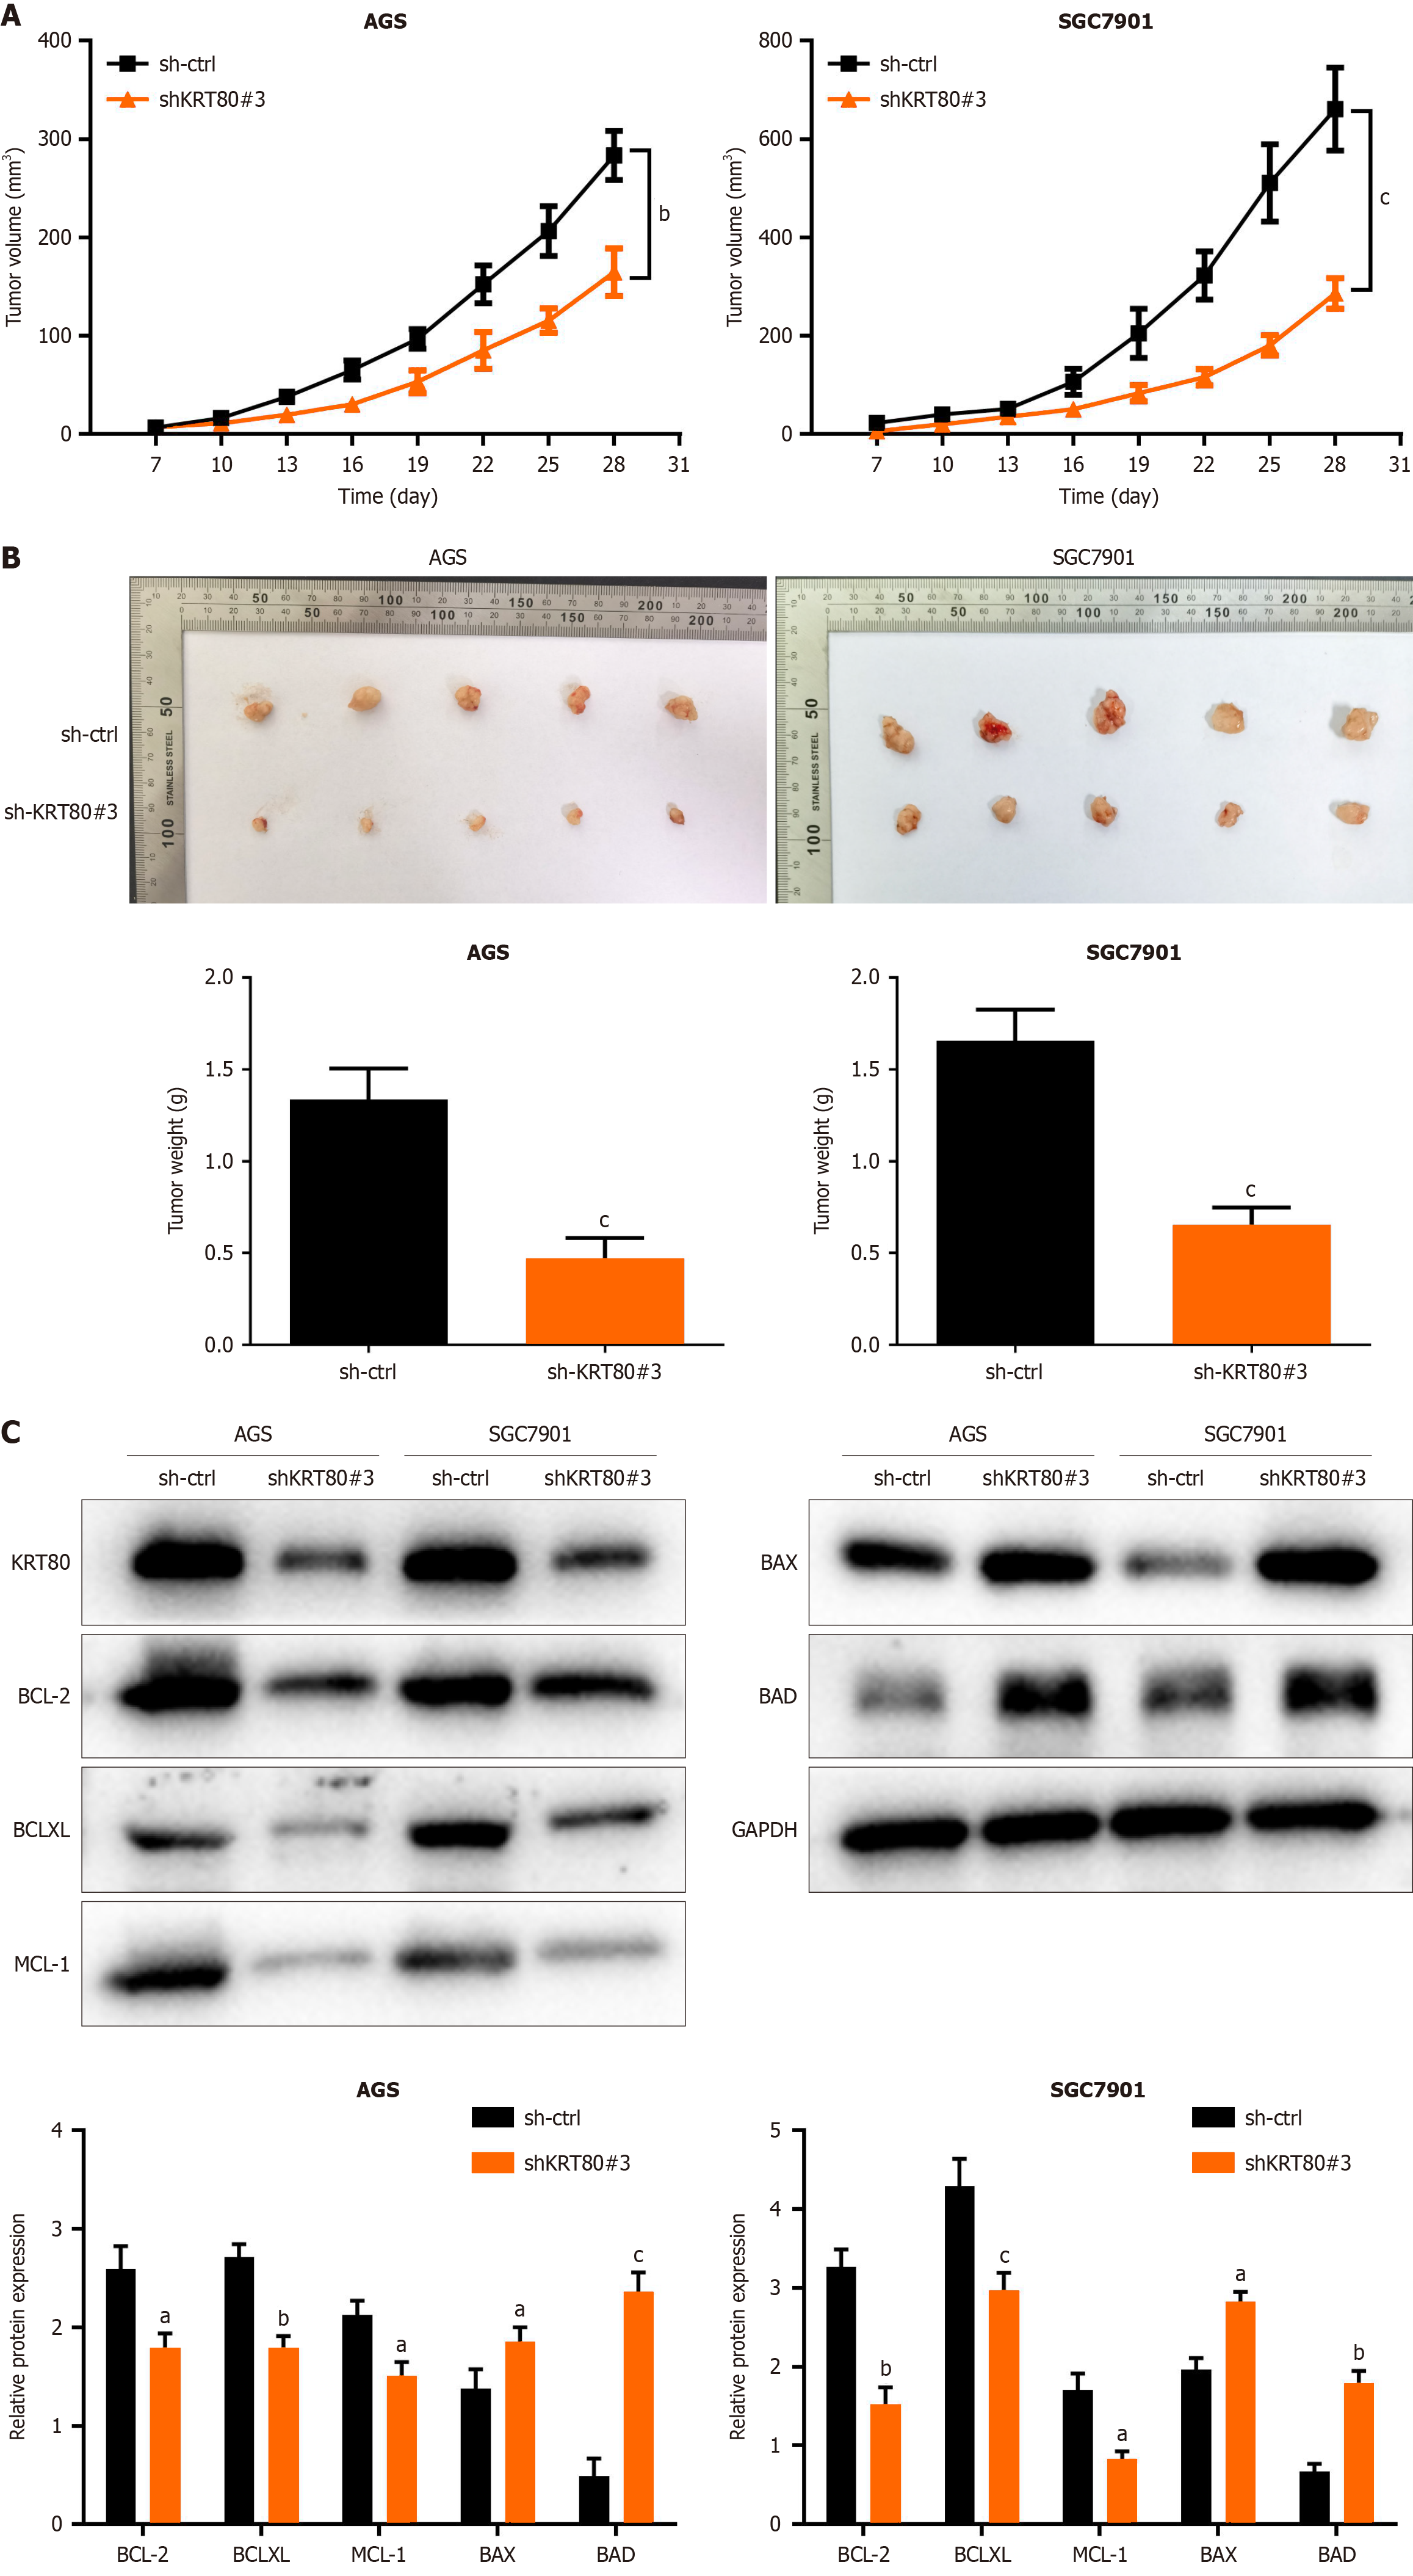
Figure 3 Knockdown of keratin 80 expression suppresses tumor growth in mouse xenograft model.
A: Tumor volumes were measured at the indicated time points for each experimental group; B: After euthanasia, tumors were excised from the mice, and the weight of each tumor was recorded; C: Western blot analysis was performed to evaluate the expression levels of keratin 80, B-cell lymphoma-2 (Bcl-2), BCL-XL, MCL-1, Bcl-2-associated X protein, and BAD in subcutaneous tumor samples from AGS and SGC7901 cells in each treatment group. Data are shown as the mean ± SD (n = 3). aP < 0.05; bP < 0.05; cP < 0.001; KRT80: Keratin 80; Bcl-2: B-cell lymphoma-2.
Figure 4 Keratin 80 upregulation contributes to oxaliplatin resistance.
A: The IC50 values for oxaliplatin were determined in AGS and SGC7901 cell lines using cell viability assays; B: Immunofluorescence staining with phalloidin was performed to visualize alterations in microfilament structures in gastric cancer (GC) cells following oxaliplatin treatment; C: Flow cytometry was used to assess the effect of keratin 80 on apoptosis in GC cells after oxaliplatin treatment, by measuring the percentage of apoptotic cells in each group. Data are shown as the mean ± SD (n = 3). Data are shown as the mean ± SD (n = 3). aP < 0.05; bP < 0.05; cP < 0.001; KRT80: Keratin 80.
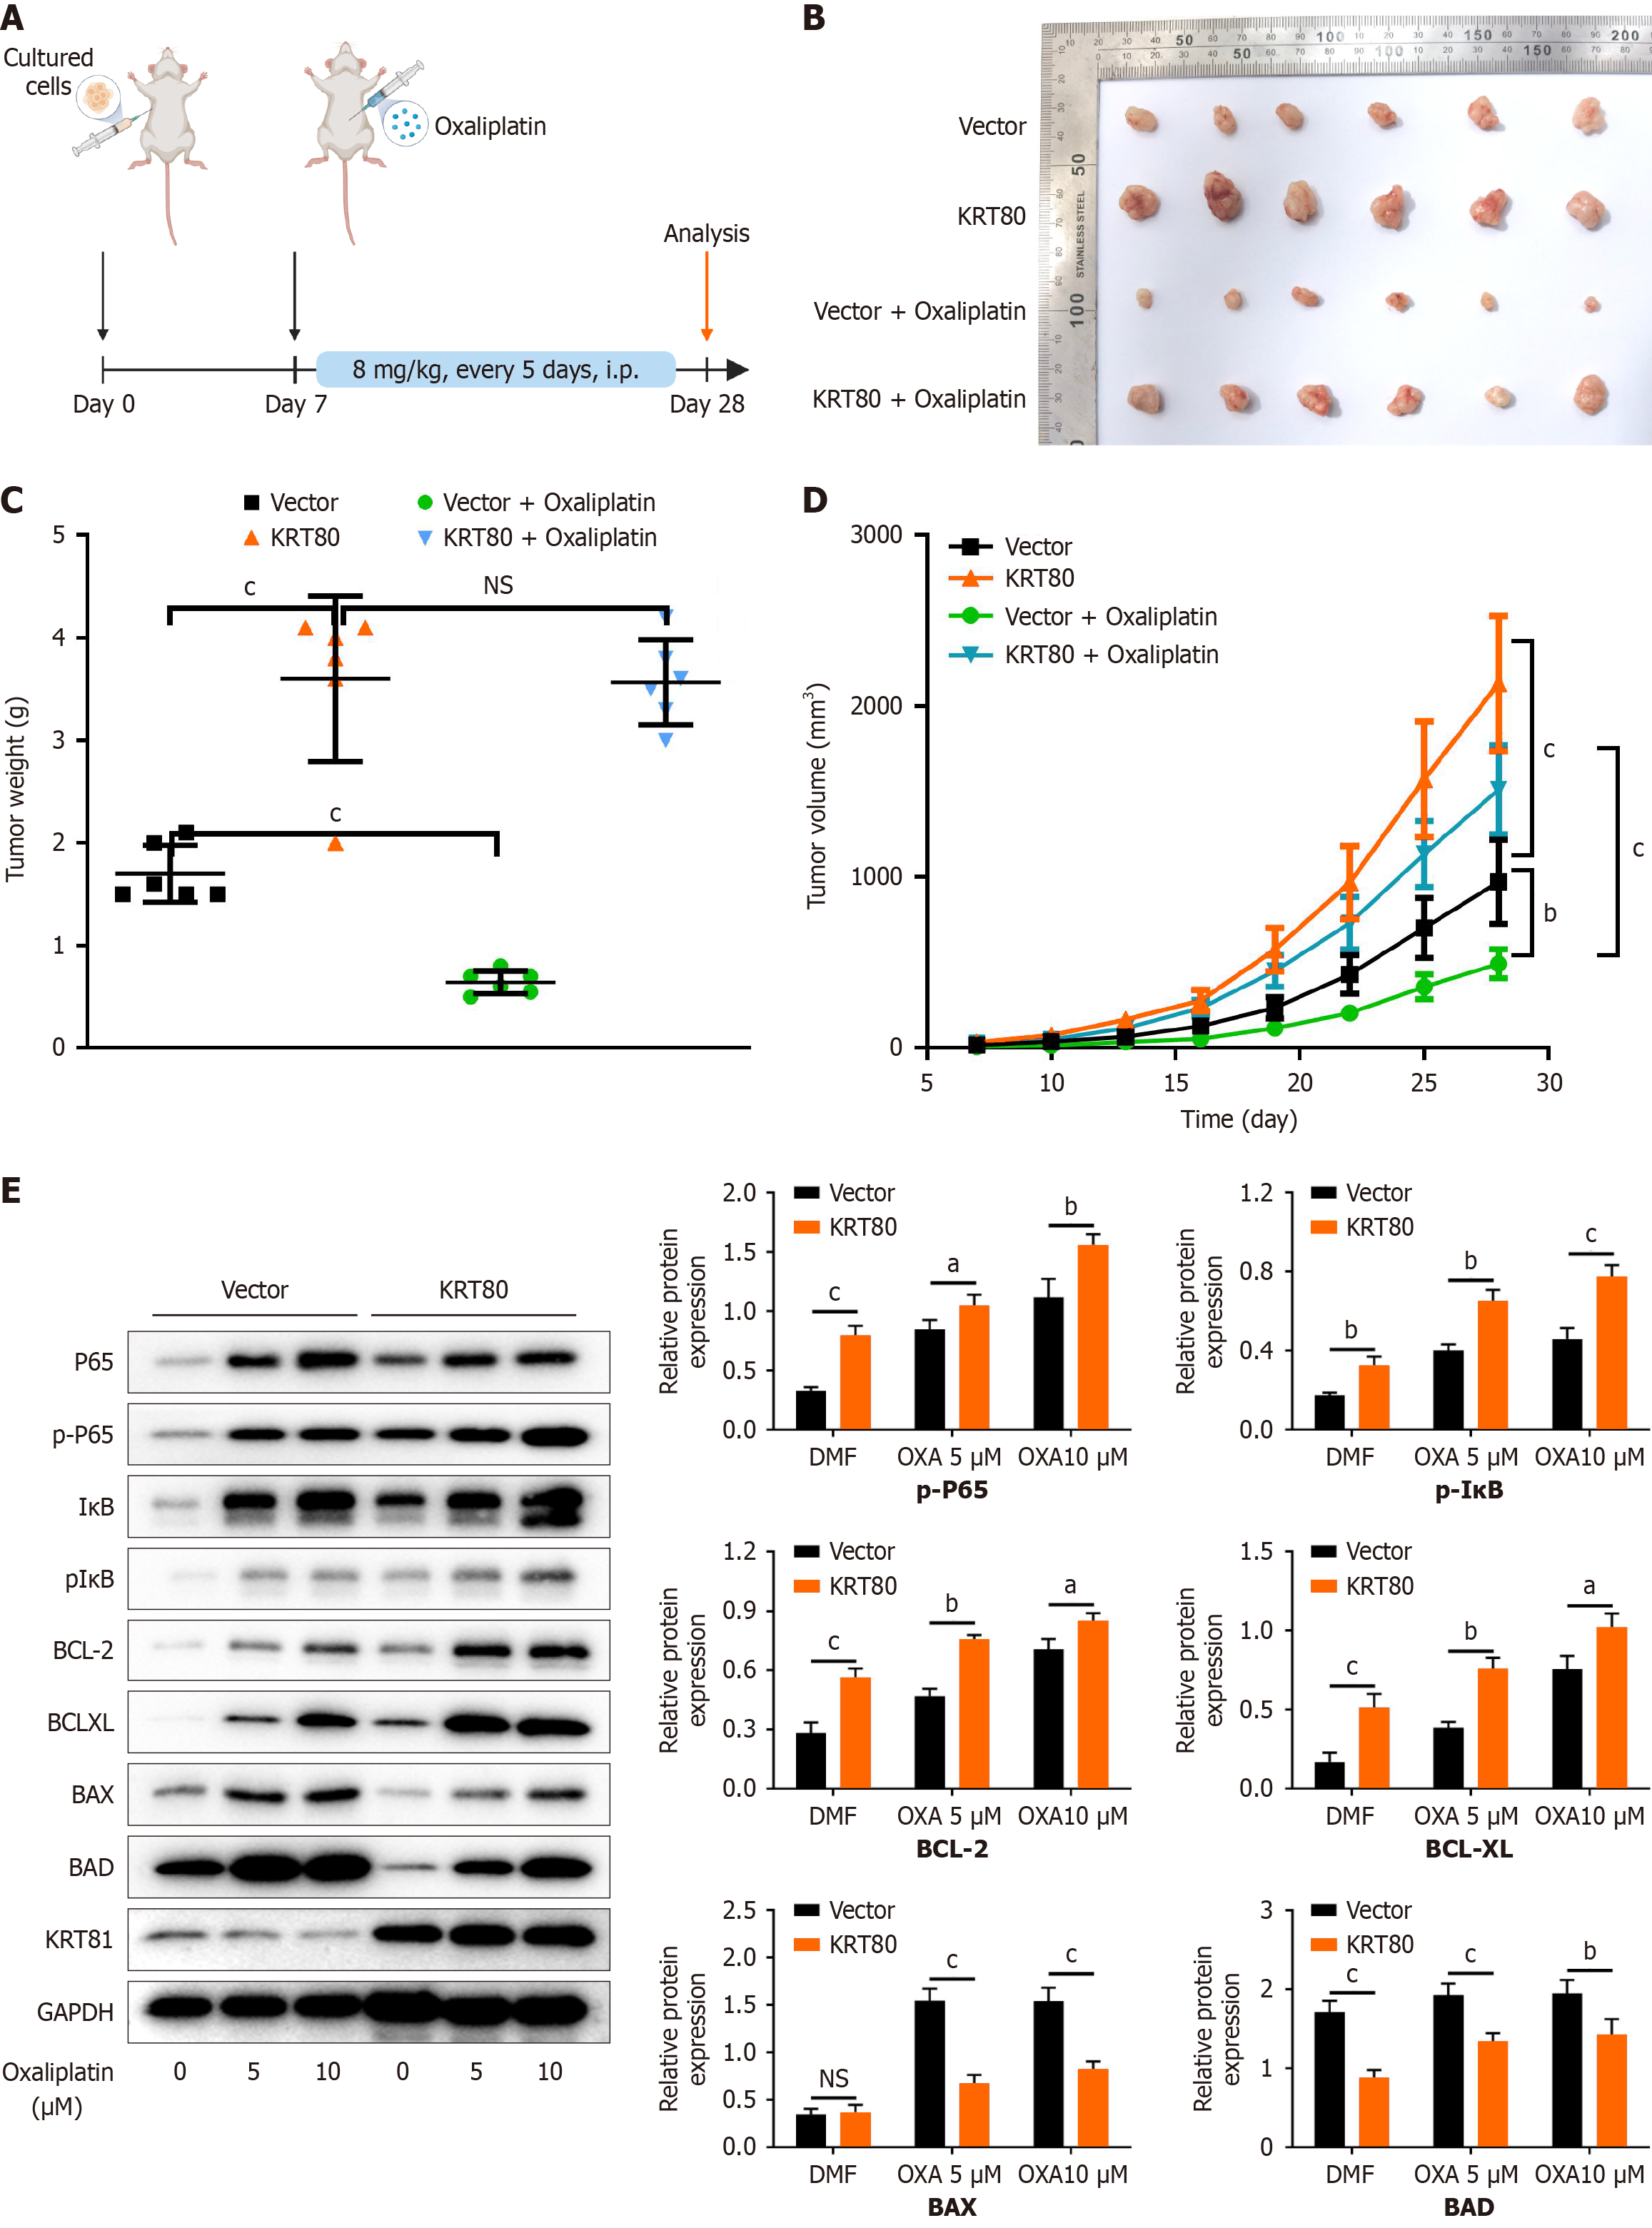
Figure 5 Keratin 80 promotes oxaliplatin resistance in gastric cancer cells by activating NF-κB signaling pathway.
A: Schematic diagram illustrating the experimental design for the animal studies; B: Representative images of dissected xenografts from the indicated groups at the conclusion of the experiment; C and D: Tumor weights and growth curves of subcutaneous xenografts from the indicated experimental groups; E: Western blot analysis was performed to evaluate the expression of key proteins involved in the NF-κB signaling pathway and apoptosis regulation. Data are shown as the mean ± SD (n = 3). aP < 0.05; bP < 0.05; cP < 0.001; KRT80: Keratin 80; Bcl-2: B-cell lymphoma-2.
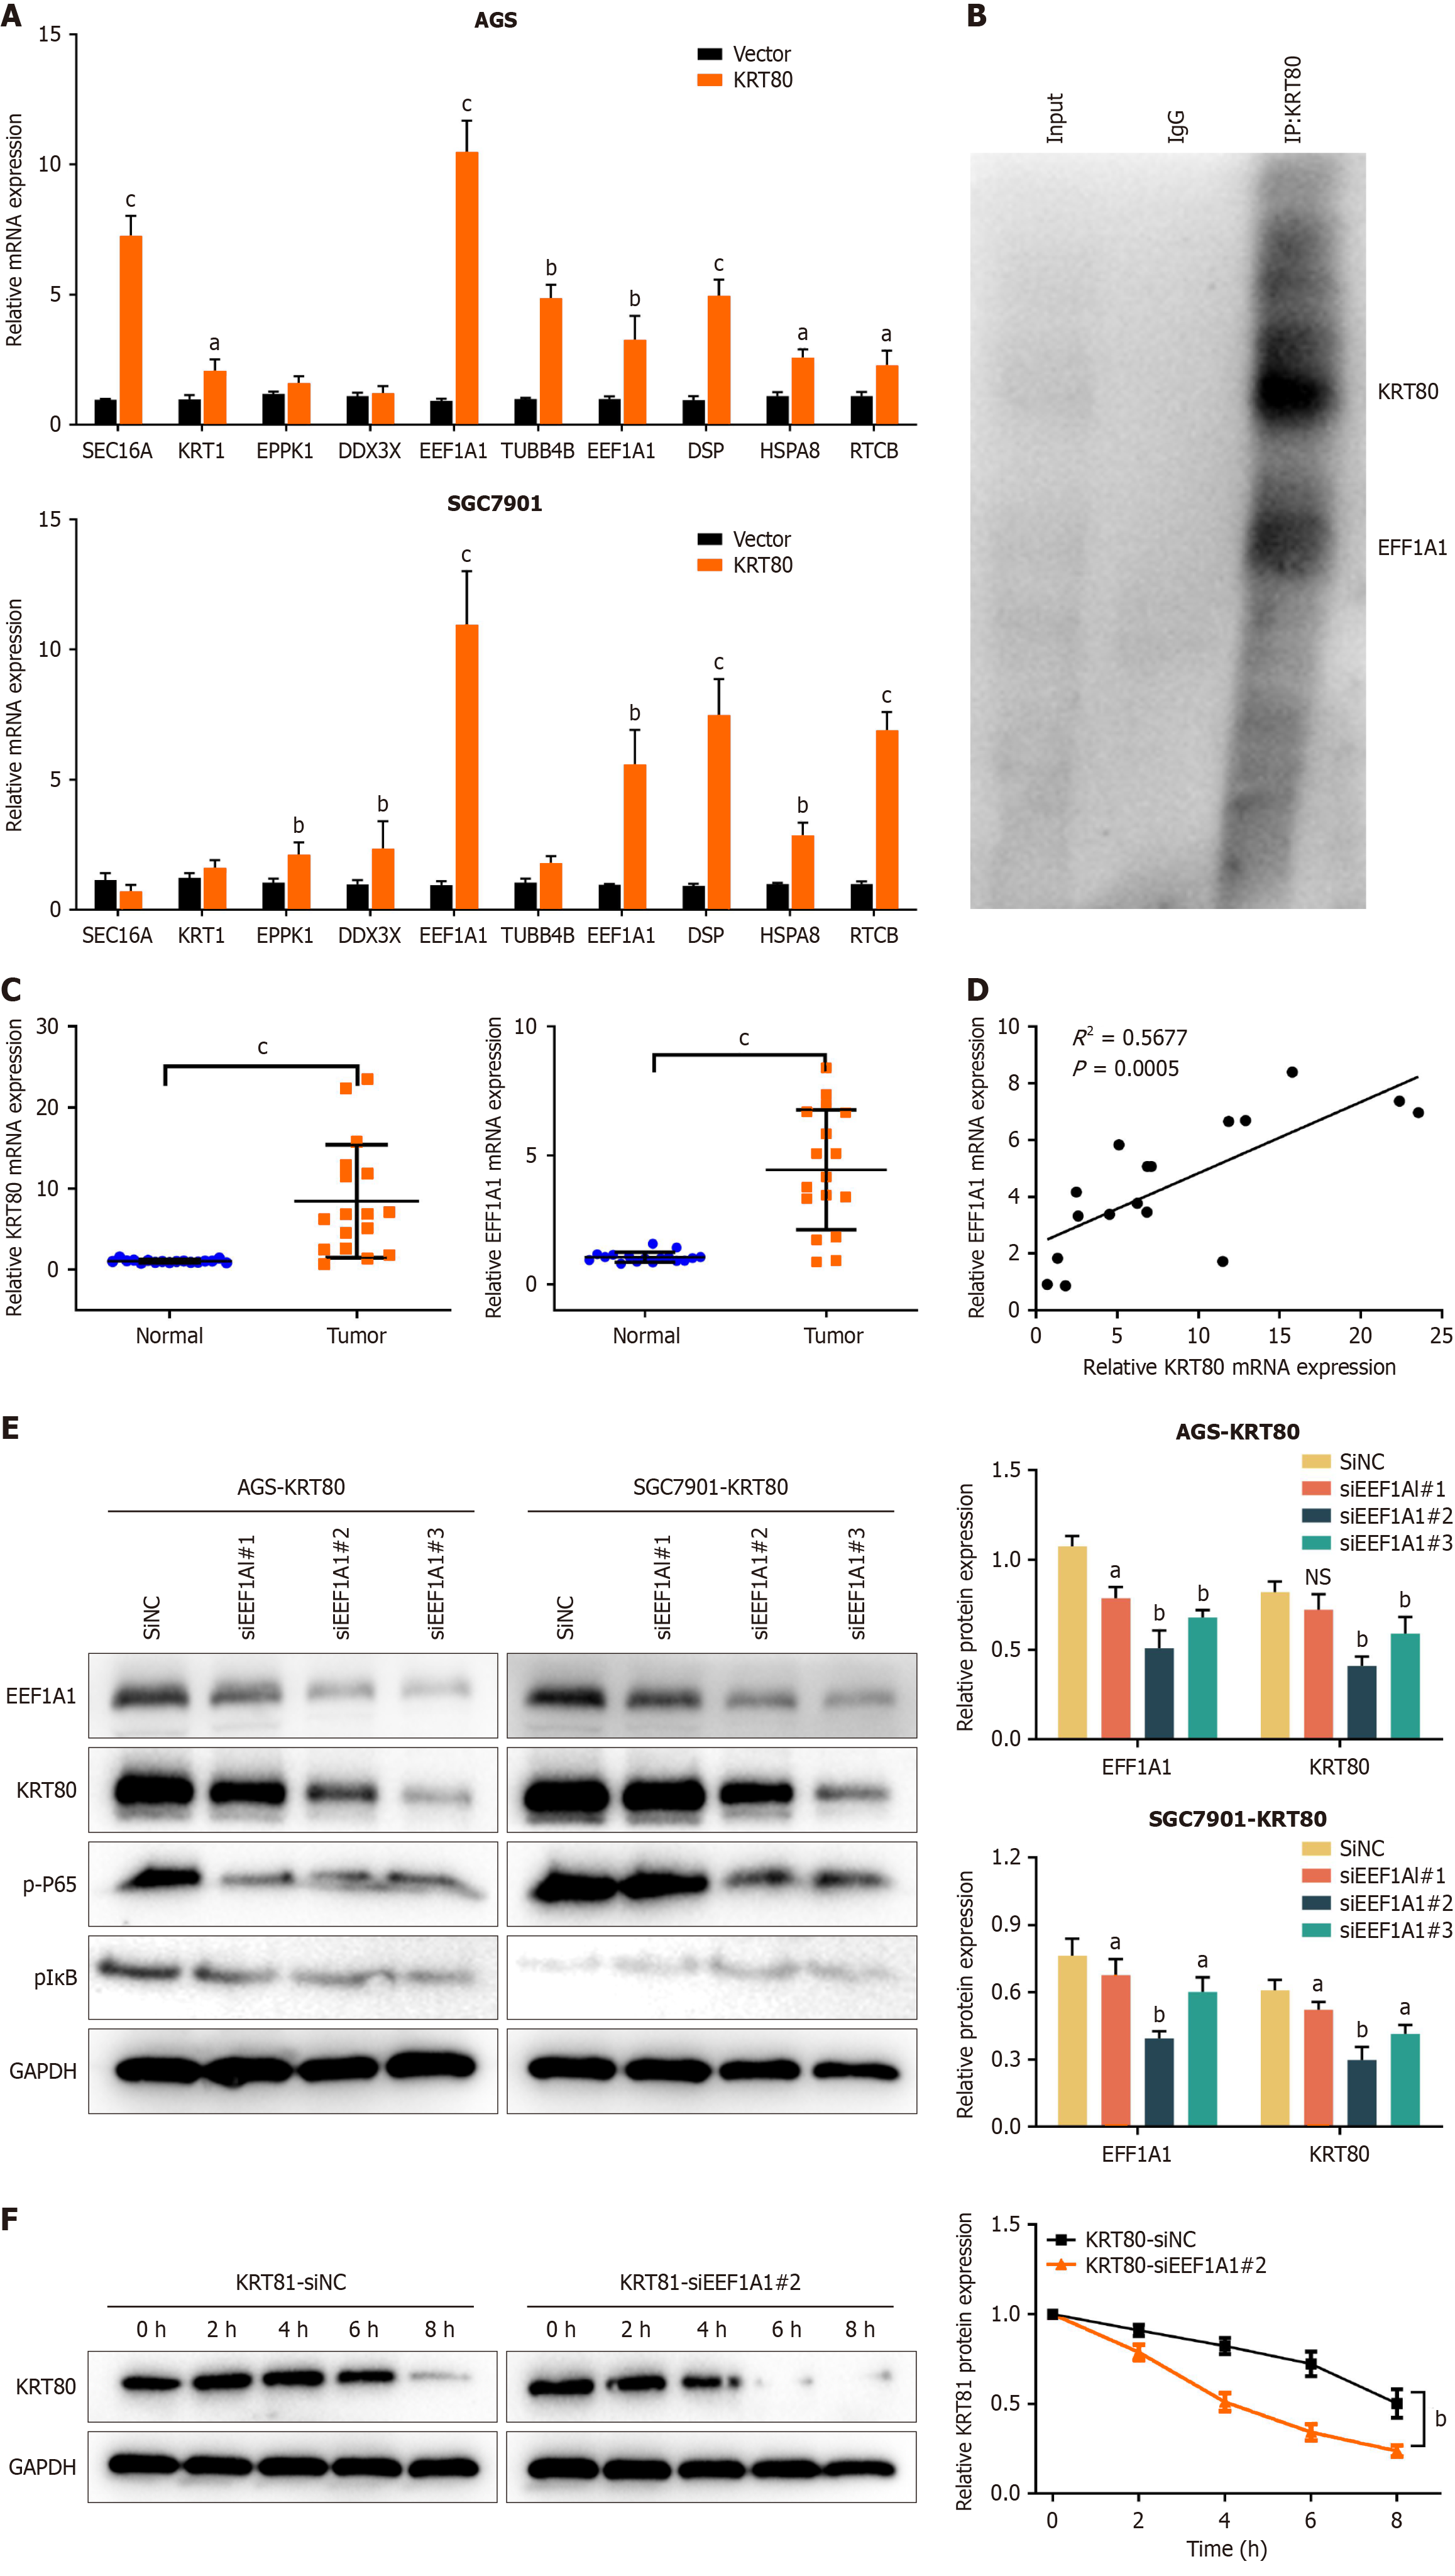
Figure 6 Elongation factor 1-alpha 1 interacts with and increases keratin 80 stability in gastric cancer cells.
A: The mRNA expression levels of selected genes were quantified by quantitative real-time PCR (qRT-PCR); B: Western blot analysis of the interaction between keratin 80 (KRT80) and elongation factor 1-alpha 1 (EEF1A1) by co-immunoprecipitation; C: The expression of KRT80 and EEF1A1 was analyzed by qRT-PCR in gastric cancer tissues and adjacent normal tissues; D: Correlation analysis revealed a positive relationship between the expression levels of KRT80 and EEF1A1 in tumor samples; E: Western blot analysis of KRT80, EEF1A1, p-P65 and pIκB expression in KRT80-overexpressing cells, with or without EEF1A1 knockdown by siRNA transfection; F: KRT80-overexpressing SGC7901 cells, with or without EEF1A1 knockdown, were treated with 10 μM oxaliplatin and 20 μg/mL cycloheximide (CHX) for the indicated time points. KRT80 protein levels were then assessed by Western blot. Data are shown as the mean ± SD (n = 3). aP < 0.05; bP < 0.05; cP < 0.001; KRT80: Keratin 80; EEF1A1: Elongation factor 1-alpha 1.
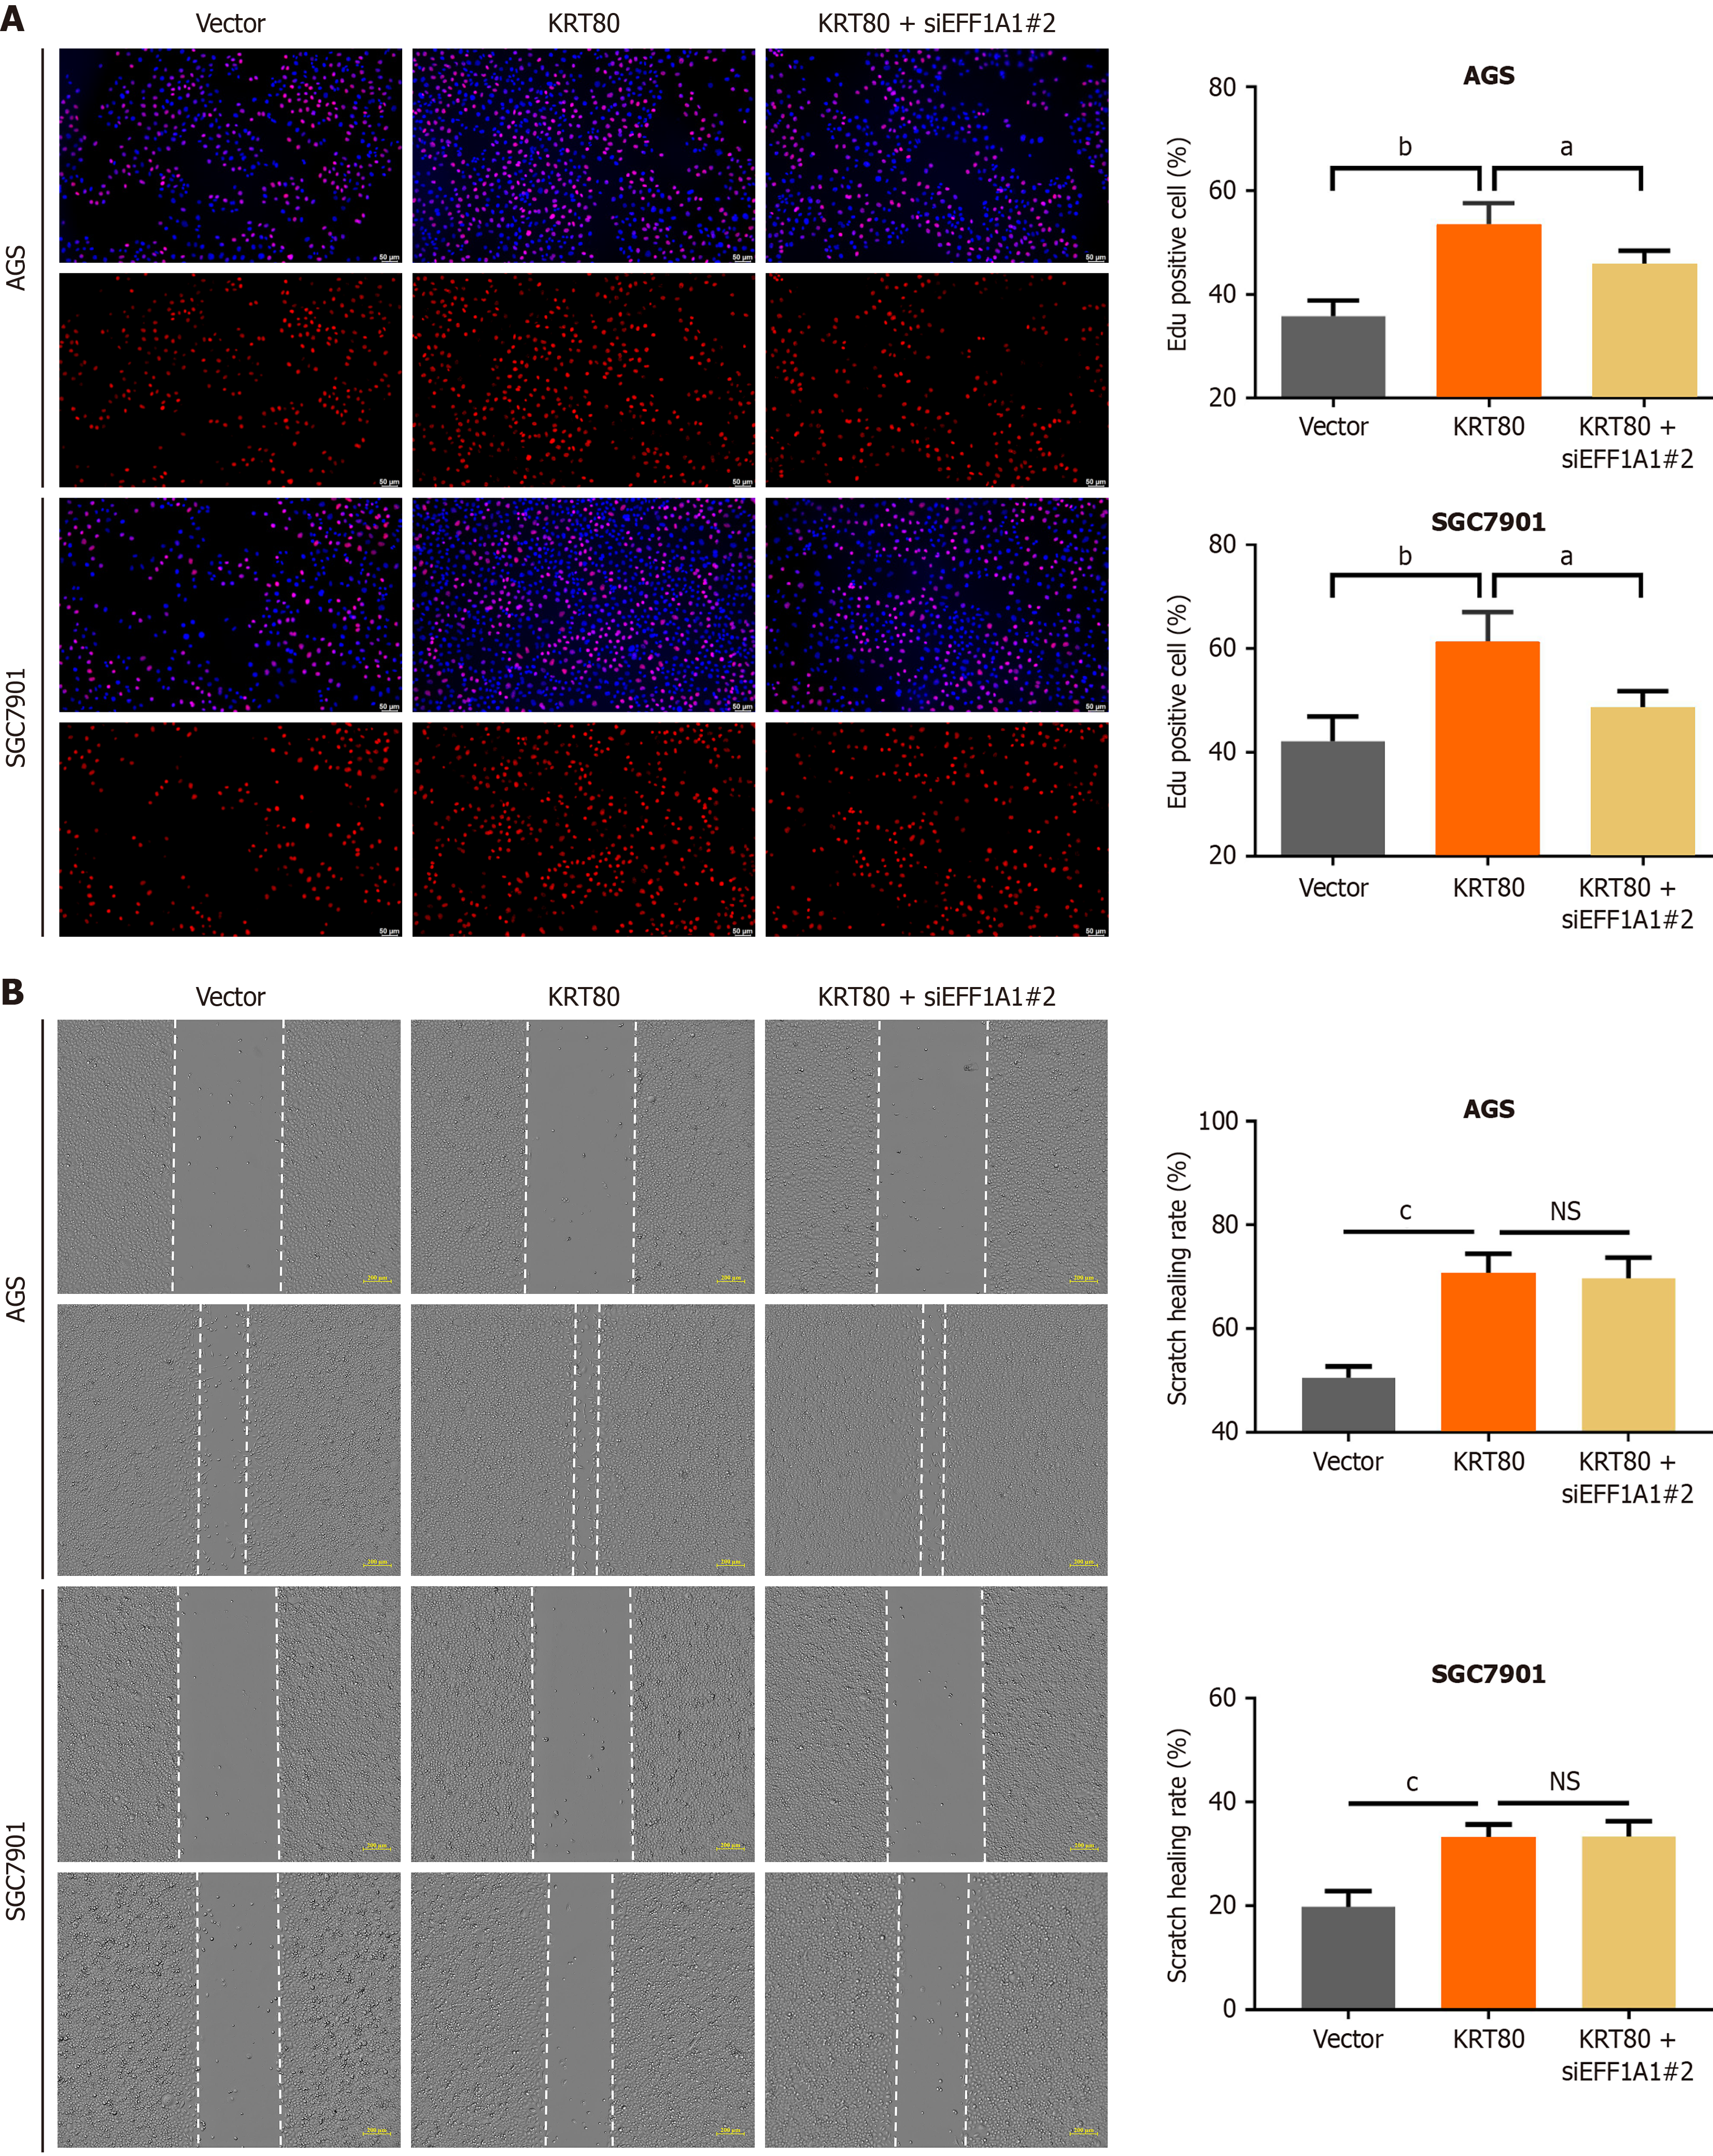
Figure 7 Knockdown of elongation factor 1-alpha 1 expression can partially reverse the effect of keratin 80 overexpression on the phenotypes in gastric cancer cells.
A: The EdU assay demonstrated that knockdown of elongation factor 1-alpha 1 (EEF1A1) significantly inhibited gastric cancer cell proliferation; B: Cell migration capacity was not significantly altered by EEF1A1 knockdown. Data are shown as the mean ± SD (n = 3). aP < 0.05; bP < 0.05; cP < 0.001; NS: Not significant; KRT80: Keratin 80; EEF1A1: Elongation factor 1-alpha 1.
- Citation: Yang B, Cao HX, He YW, Ouyang JJ, Lv M, Li YX, Lu YD. Increased keratin 80 expression predicts poor prognosis and promotes oxaliplatin resistance in gastric cancer. World J Gastroenterol 2025; 31(12): 103991
- URL: https://www.wjgnet.com/1007-9327/full/v31/i12/103991.htm
- DOI: https://dx.doi.org/10.3748/wjg.v31.i12.103991


