Copyright
©The Author(s) 2025.
World J Gastroenterol. Mar 28, 2025; 31(12): 103952
Published online Mar 28, 2025. doi: 10.3748/wjg.v31.i12.103952
Published online Mar 28, 2025. doi: 10.3748/wjg.v31.i12.103952
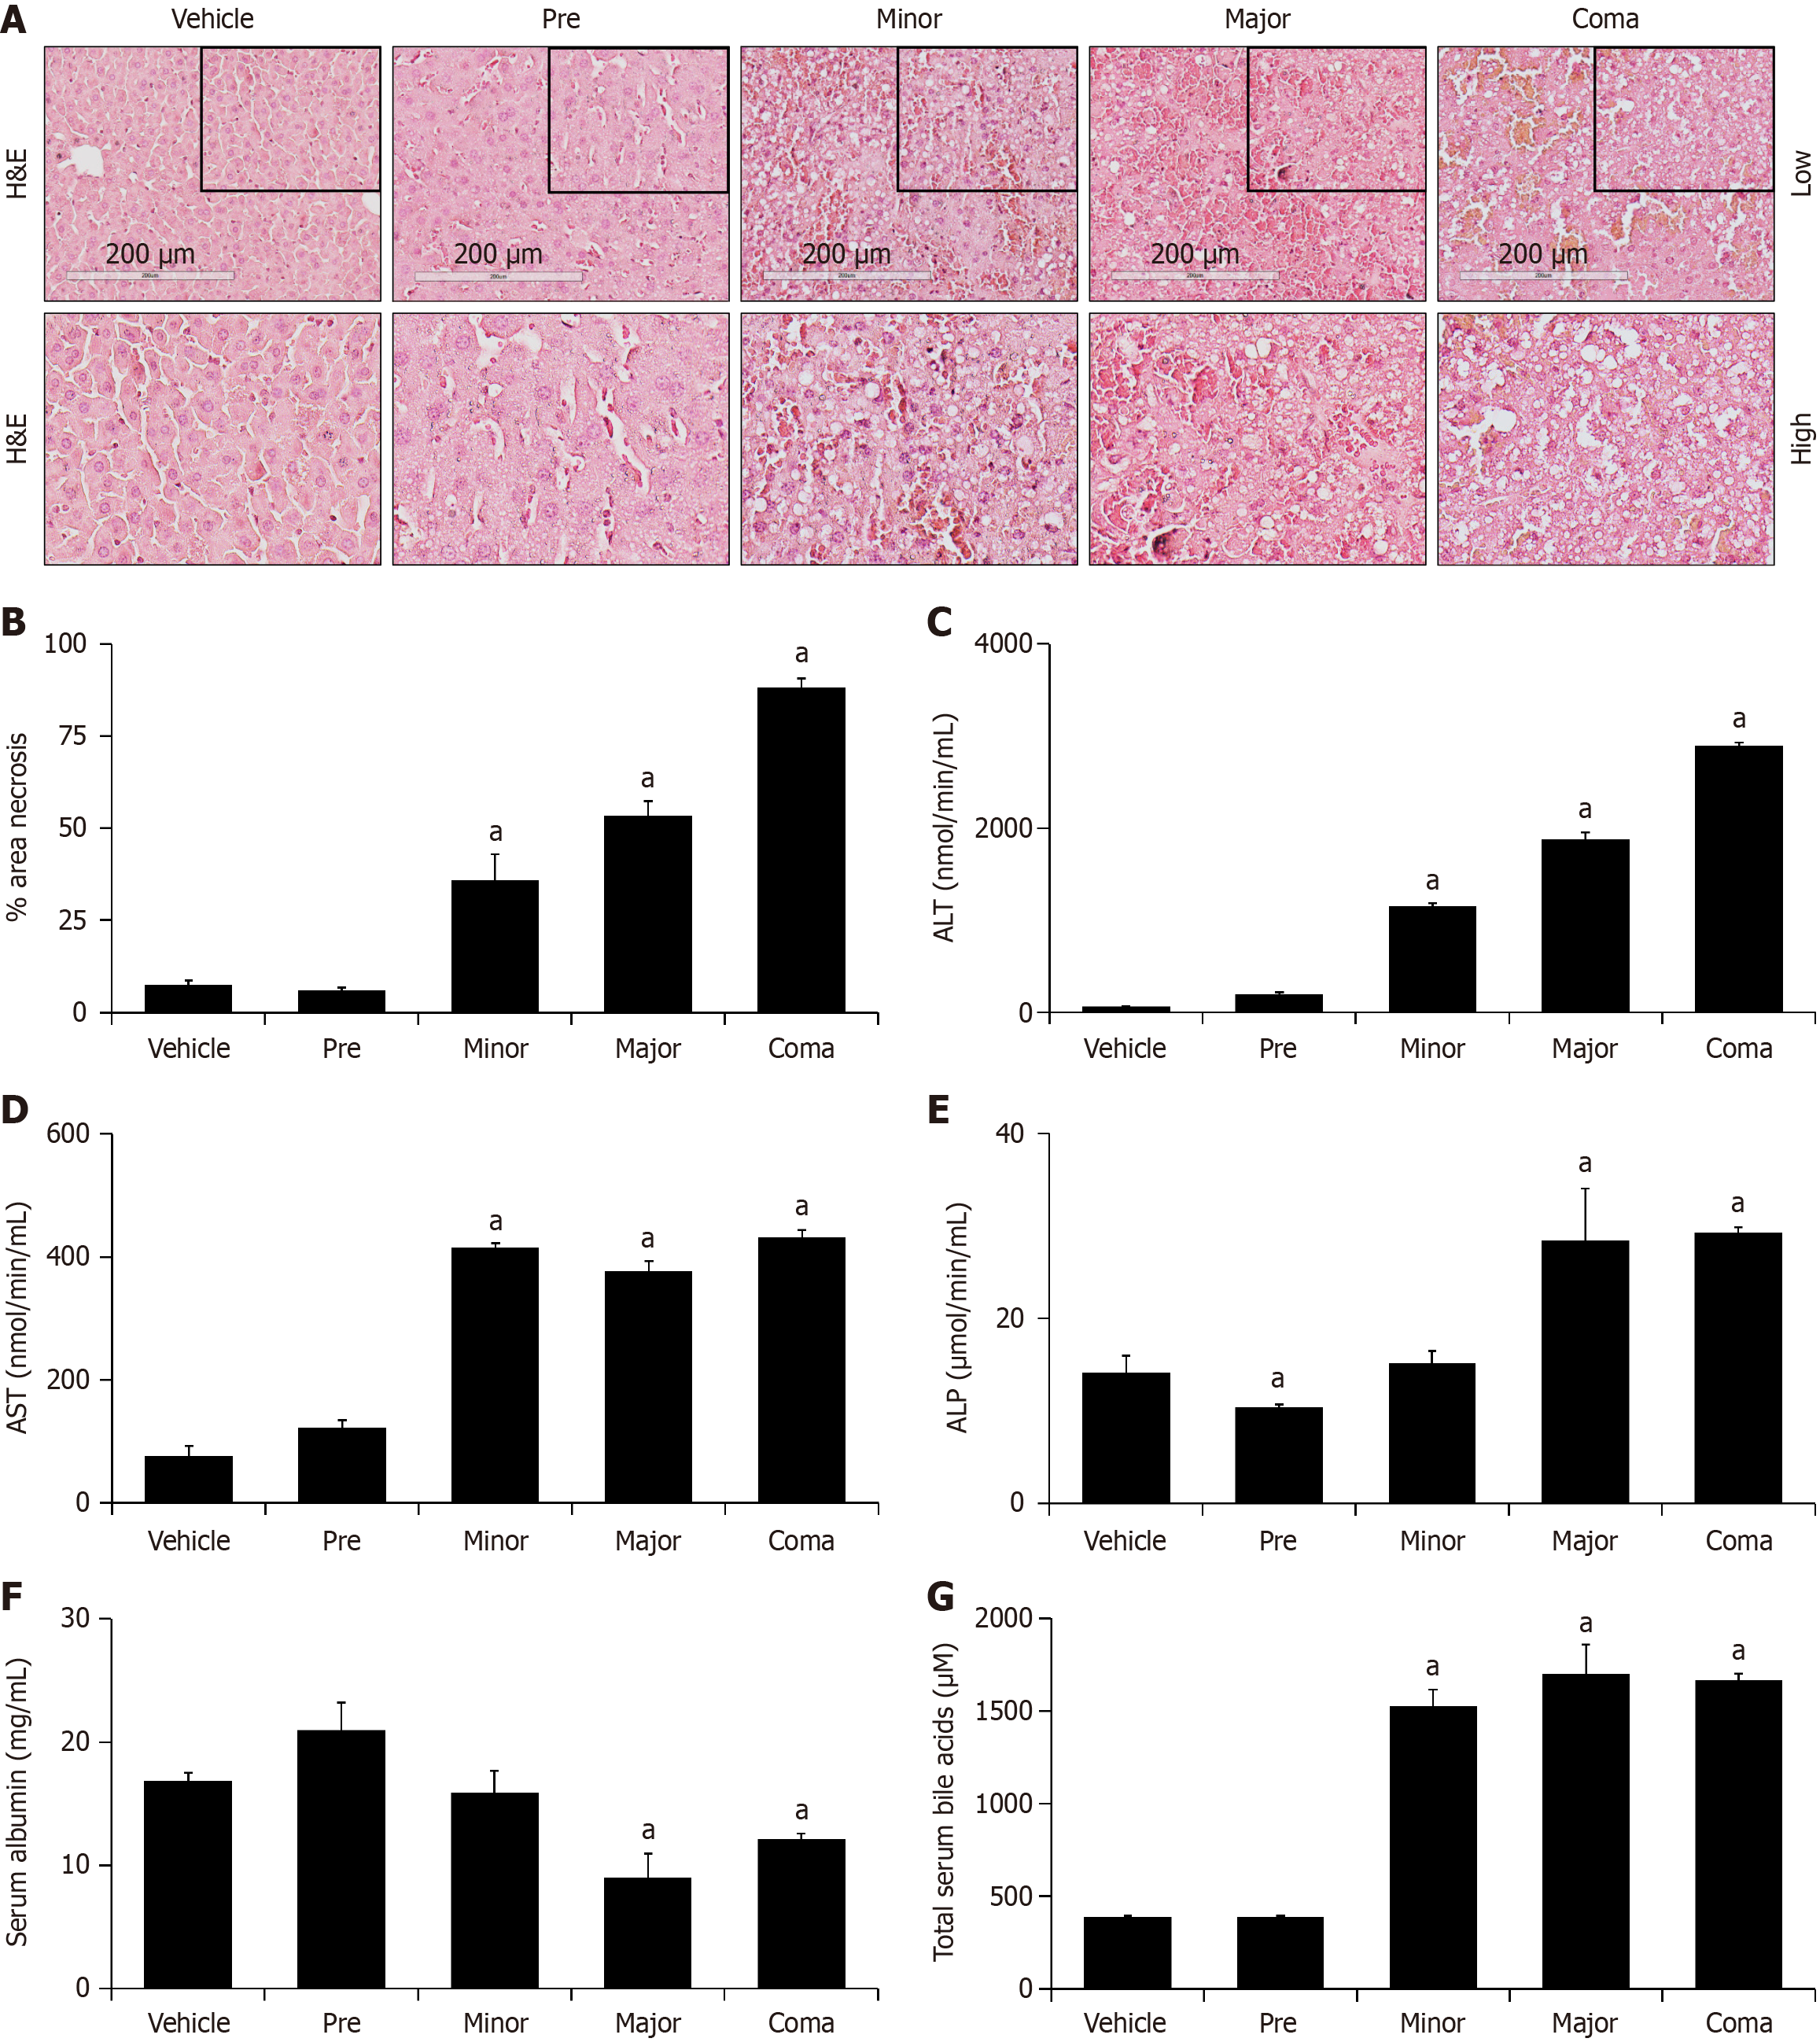
Figure 1 Azoxymethane generates progressive liver necrosis and hepatic injury.
A: Representative hematoxylin & eosin (H&E)-stained images from vehicle- and azoxymethane (AOM)-treated livers at pre, minor, major and coma time points; B: Percent area of hepatic necrosis of H&E liver-stained sections from mice administered vehicle or AOM at pre, minor, major and coma time points; C and D: Serum alanine aminotransferase (ALT) and aspartate aminotransferase (AST) activity in vehicle or AOM-treated mice reported as nmol of ALT/AST activity per minute per ml of serum; E: Serum alkaline phosphatase (ALP) concentration in mice treated with vehicle or AOM shown as µmol of ALP activity per minute per mL of serum; F: Serum albumin concentration in mice treated with vehicle or AOM reported as mg of albumin per mL of serum; G: Concentration of total bile acids in serum from vehicle and AOM-treated mice at the pre, minor, major and coma time points. n ≥ 3 for each group for all analyses. aP < 0.05 compared to vehicle-treated mice; H&E: Hematoxylin & eosin; ALT: Alanine aminotransferase.
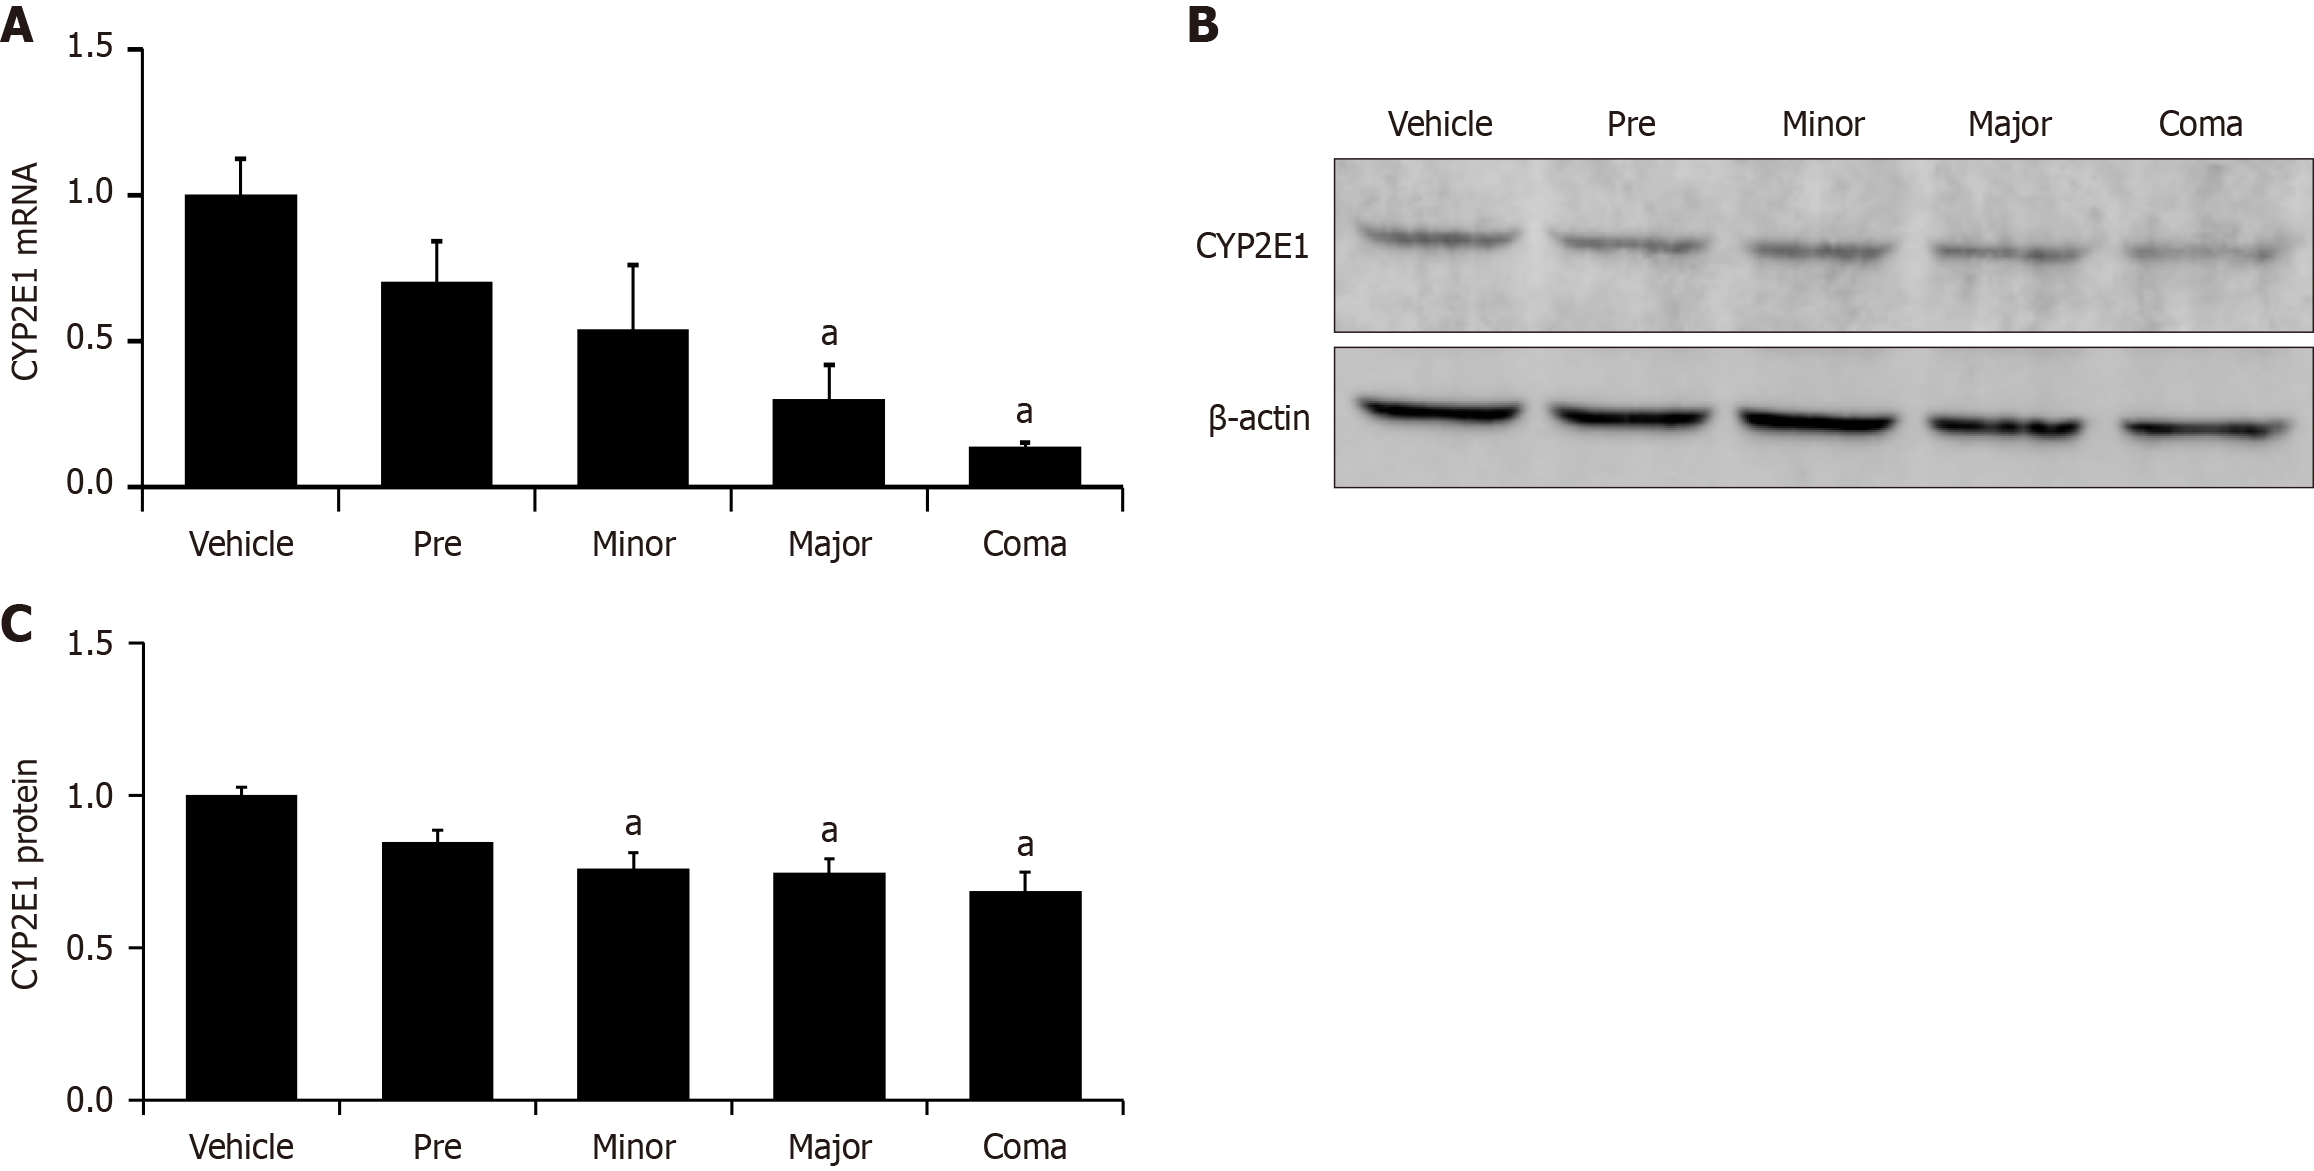
Figure 2 Hepatic CYP2E1 expression is decreased during azoxymethane-induced liver injury.
A: Relative CYP2E1 mRNA expression in liver homogenates from mice injected with vehicle or azoxymethane (AOM) at indicated time points; B: Representative immunoblot for CYP2E1 in vehicle and AOM-treated mice at the pre, minor, major and coma time points. β-Actin is used as a protein loading control; C: Quantification of relative CYP2E1 protein from immunoblots in liver homogenates from vehicle and AOM-treated mice at the pre, minor, major and time points. n ≥ 3 for each group for all analyses. aP < 0.05 compared to vehicle-treated mice.
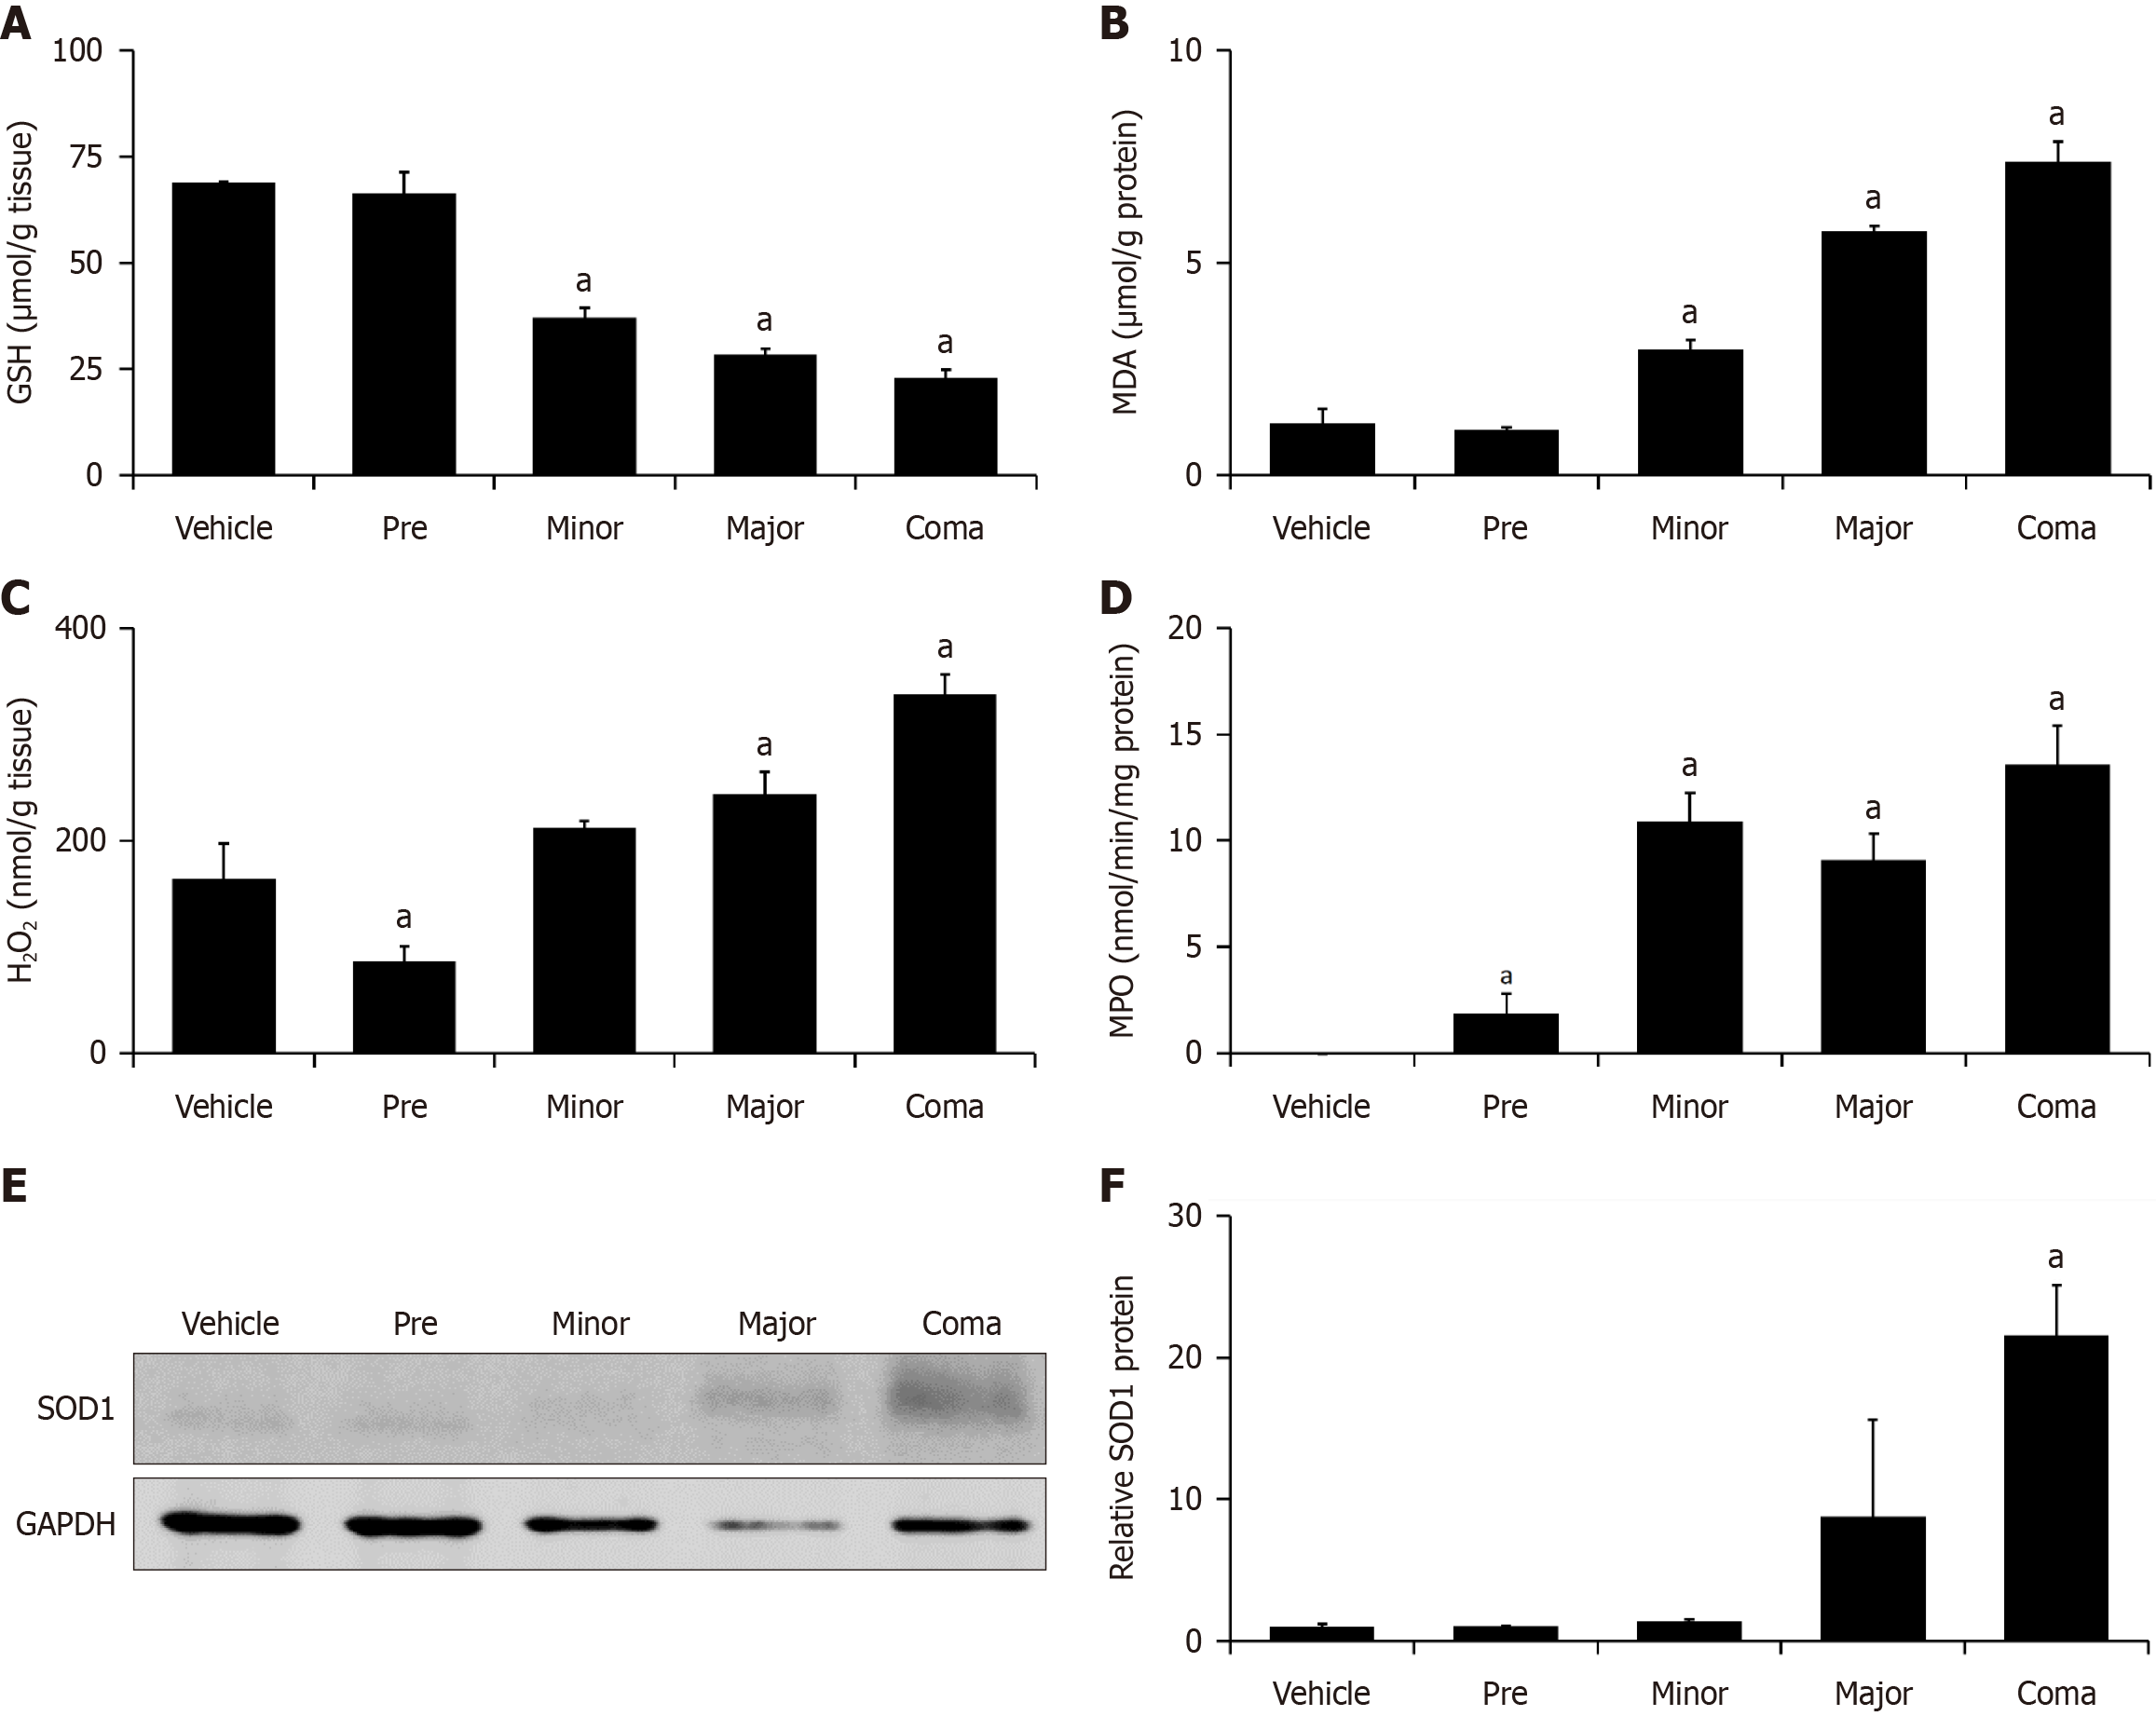
Figure 3 Azoxymethane-induced liver injury is associated with increased oxidative stress.
A: Hepatic GSH concentration expressed as µmol per gram of liver tissue in mice treated with vehicle or azoxymethane (AOM) at the pre, minor, major and coma time points; B: Liver MDA concentration in µmol normalized to total protein concentrations in mice treated with vehicle or AOM at the pre, minor, major and coma time points; C: H2O2 concentration in nmol per gram of liver tissue in mice treated with vehicle or AOM at the pre, minor, major and coma time points; D: Hepatic MPO activity reported as nmol of MPO per minute per mg of protein in mice treated with vehicle or AOM at the pre, minor, major and coma time points; E and F: Representative immunoblot and quantification of immunoblots for SOD1 in liver homogenates from mice administered vehicle or AOM at the pre, minor, major and coma time points. GAPDH is used as a protein loading control. n ≥ 3 for each group for all analyses. aP < 0.05 compared to vehicle-treated mice.
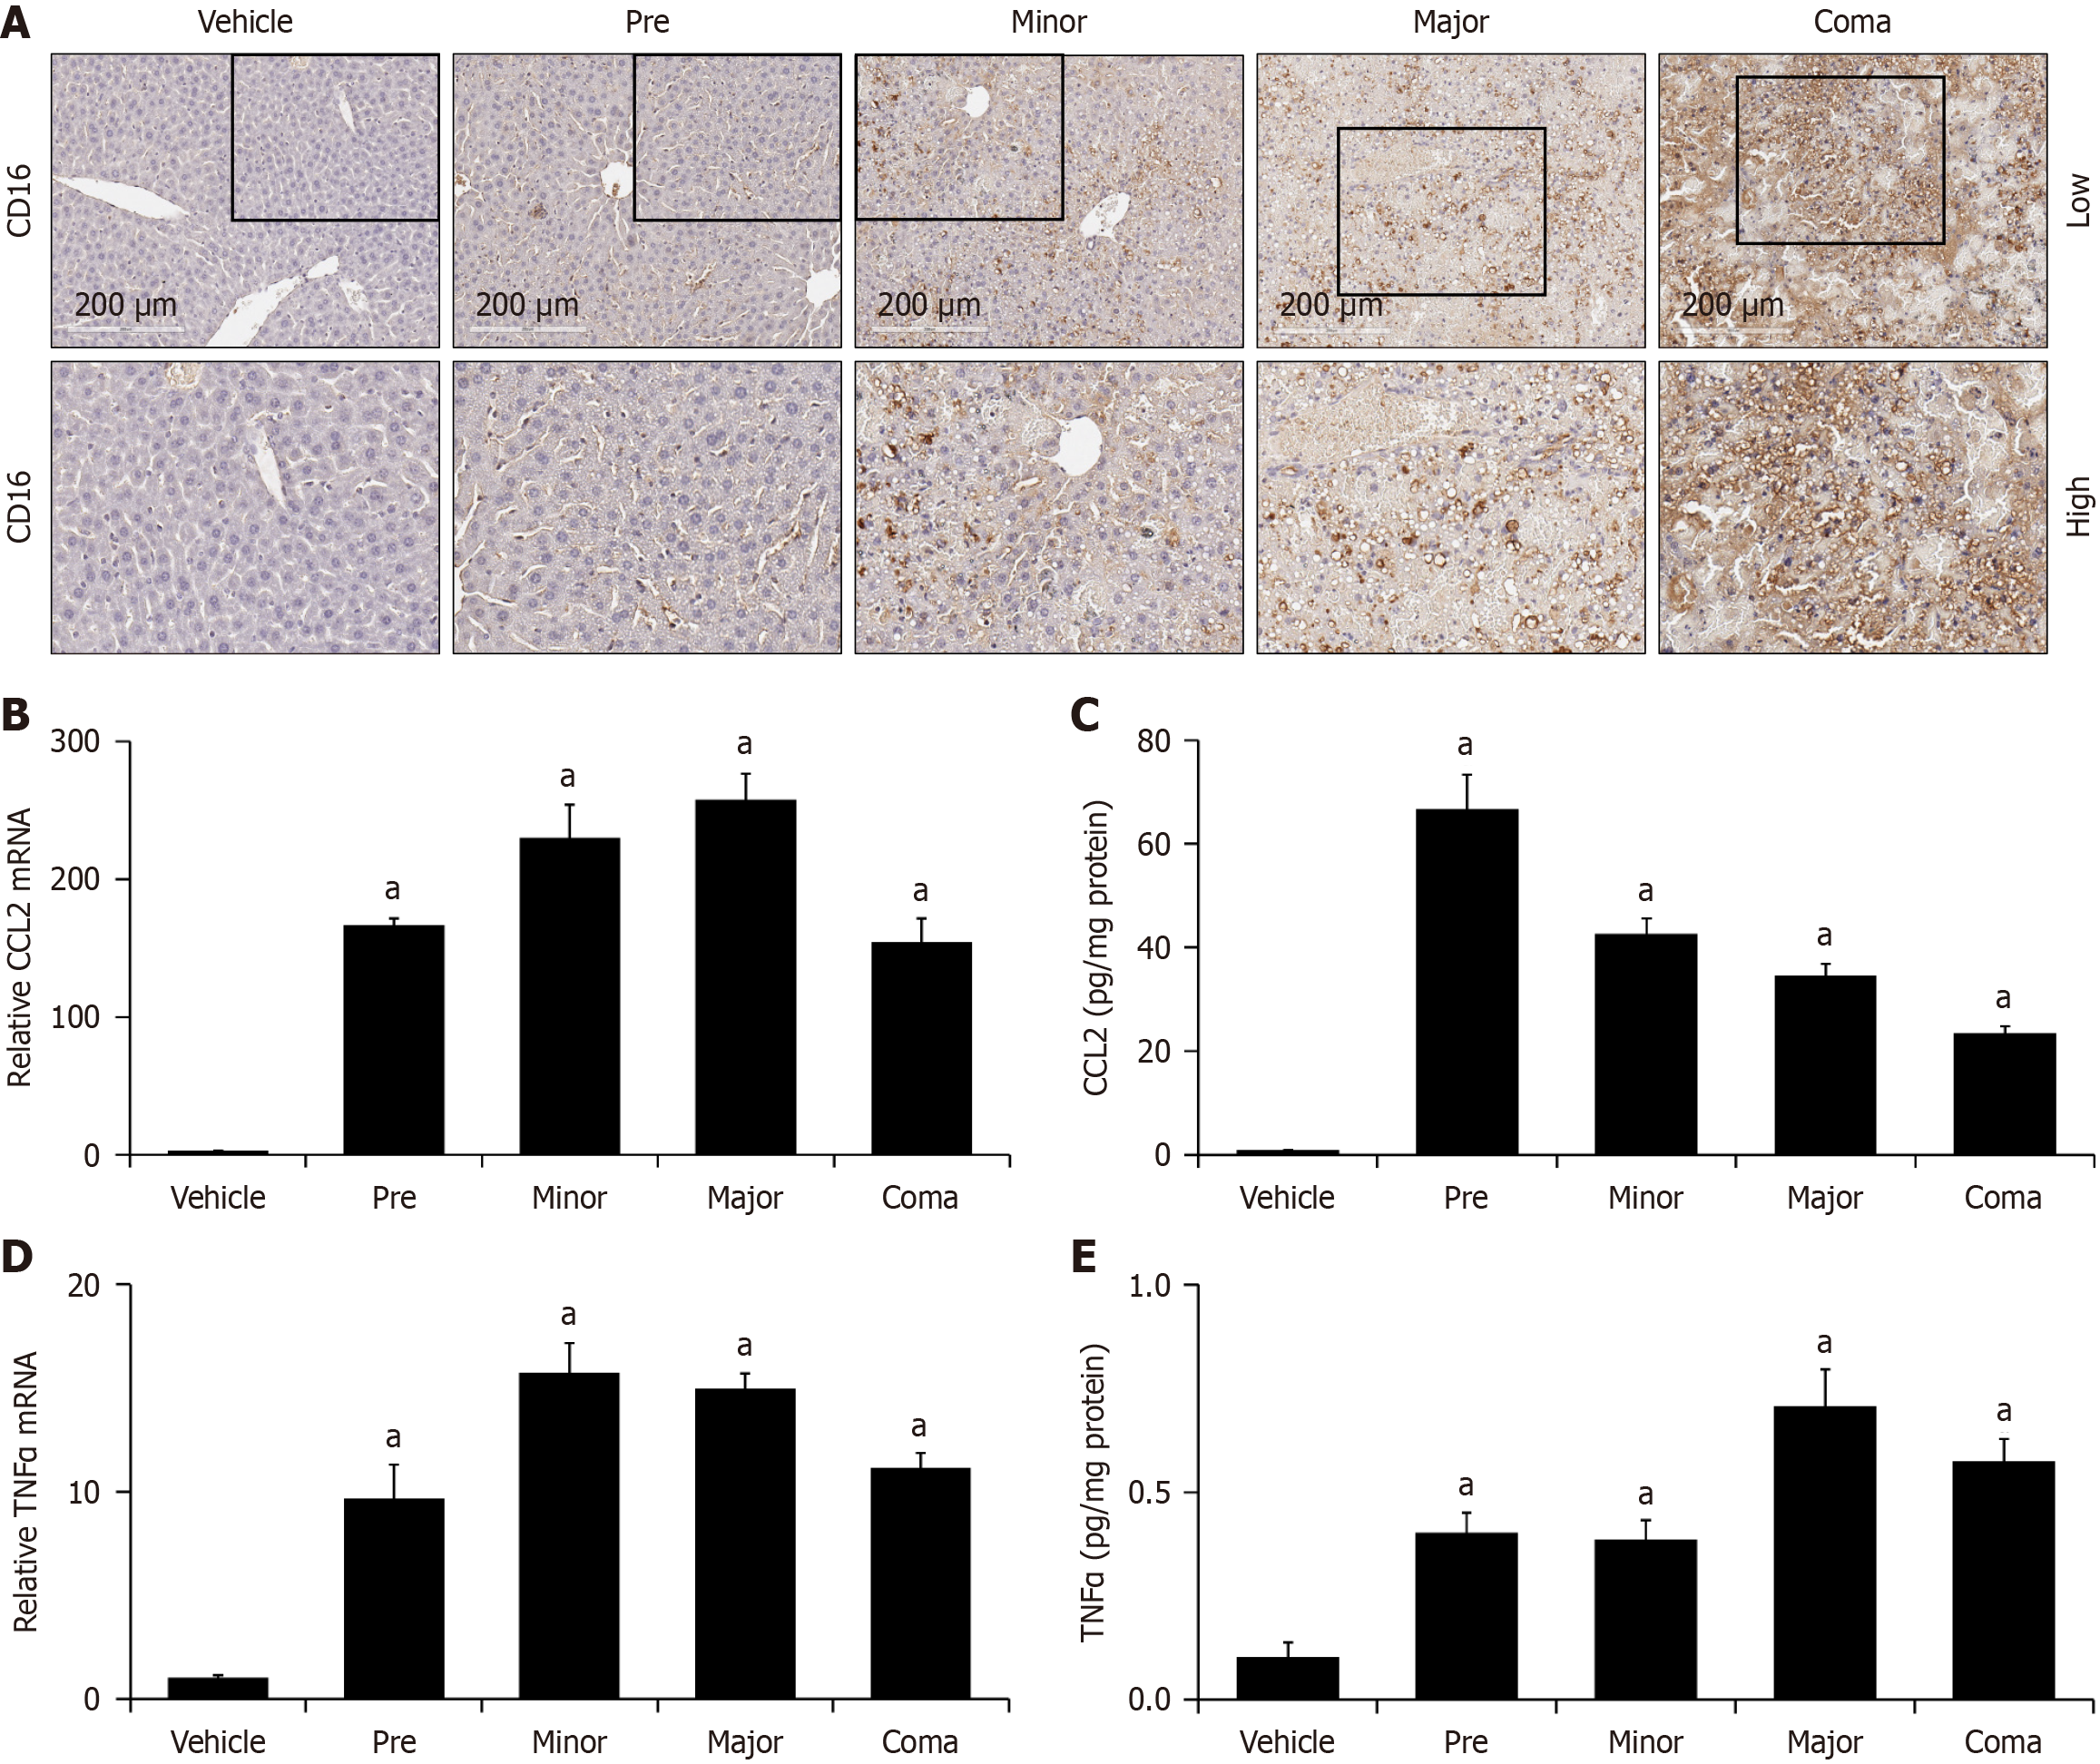
Figure 4 Measures of hepatic inflammation are increased in azoxymethane-treated mice.
A: Immunohistochemistry images for CD16 in livers from vehicle- and azoxymethane (AOM)-treated mice at pre, minor, major and coma time points; B and C: Relative CCL2 mRNA and protein expressed in pg of CCL2 per mg of protein in liver homogenates from mice treated with vehicle or AOM at pre, minor, major and coma time points; D and E: Tumor necrosis factor α (TNFα) mRNA and protein reported as pg of TNFα per mg of protein from liver homogenates of vehicle or AOM-treated mice at indicated time points. n ≥ 3 for each group for all analyses. aP < 0.05 compared to vehicle-treated mice.
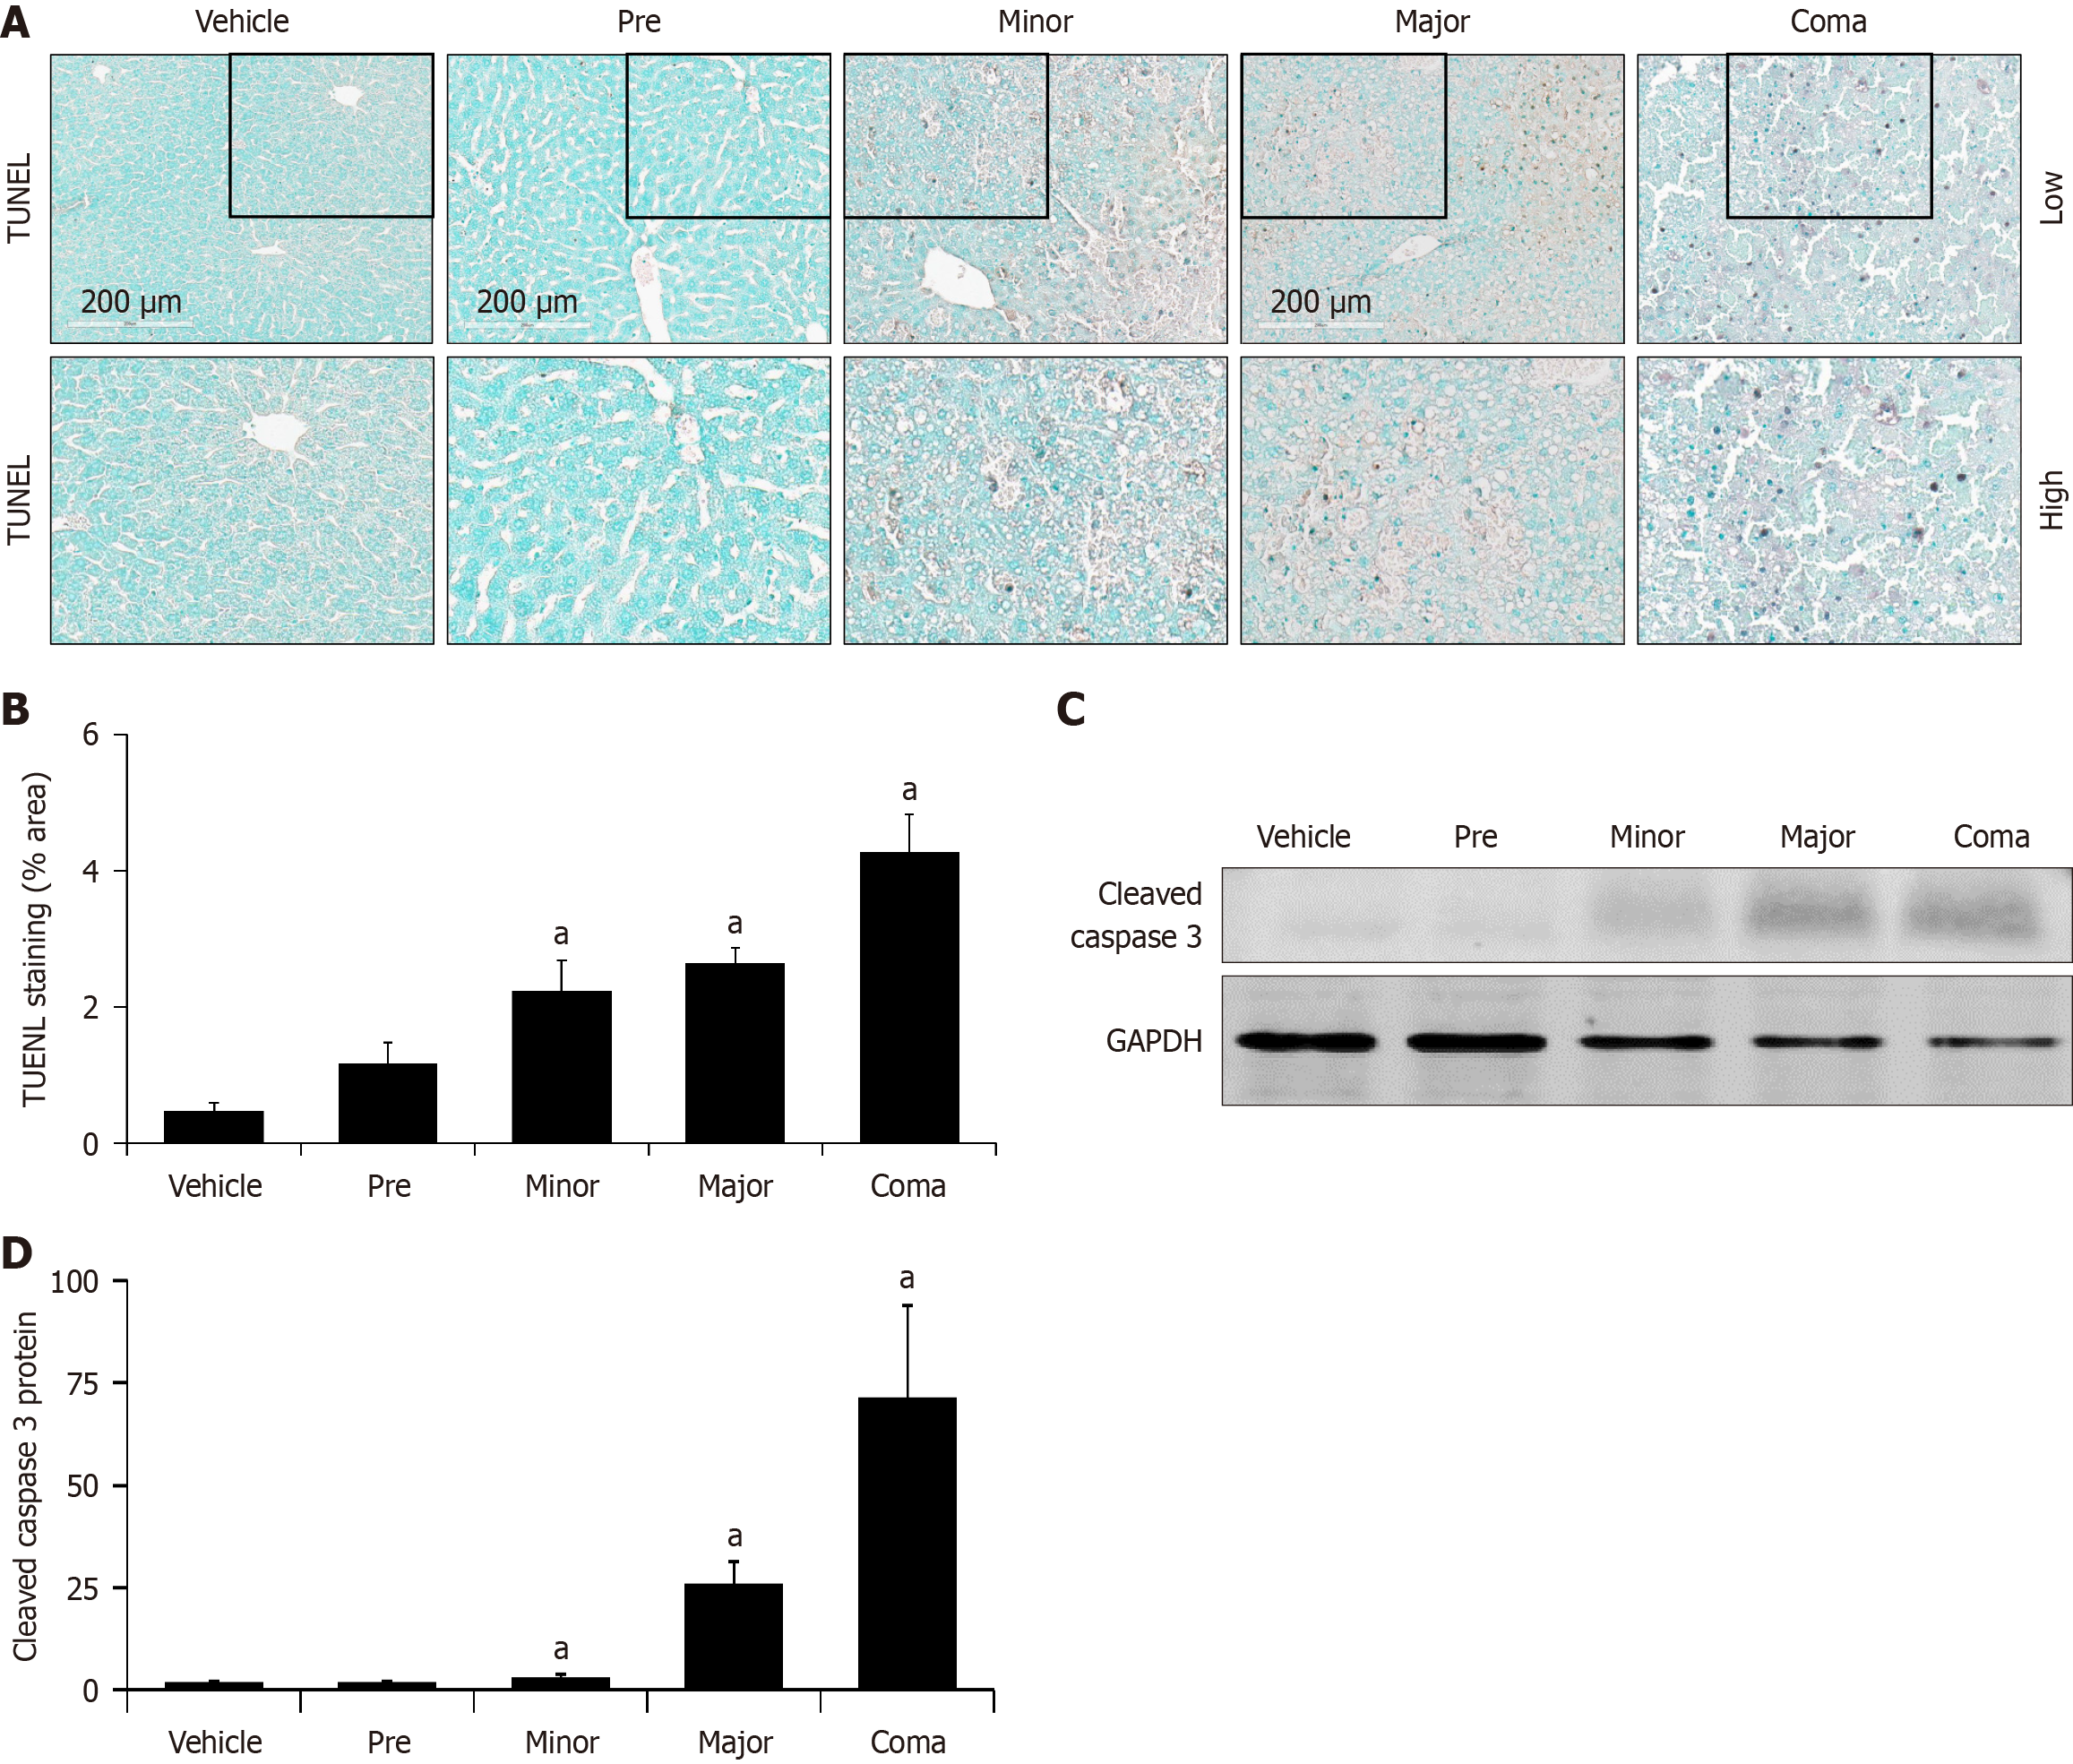
Figure 5 Hepatic cell death is associated with azoxymethane toxicity.
A: TUNEL staining images of livers from vehicle and azoxymethane (AOM)-treated mice at the pre, minor, major and coma time points; B: Percent area of TUNEL staining from vehicle and AOM-treated mice liver sections at the pre, minor, major and coma time points; C and D: Representative immunoblot and quantification of cleaved caspase 3 in liver homogenates from vehicle and AOM-treated liver sections at the pre, minor, major and coma time points. GAPDH was used as a protein loading control. n ≥ 3 for each group for all analyses. aP < 0.05 compared to vehicle-treated mice.
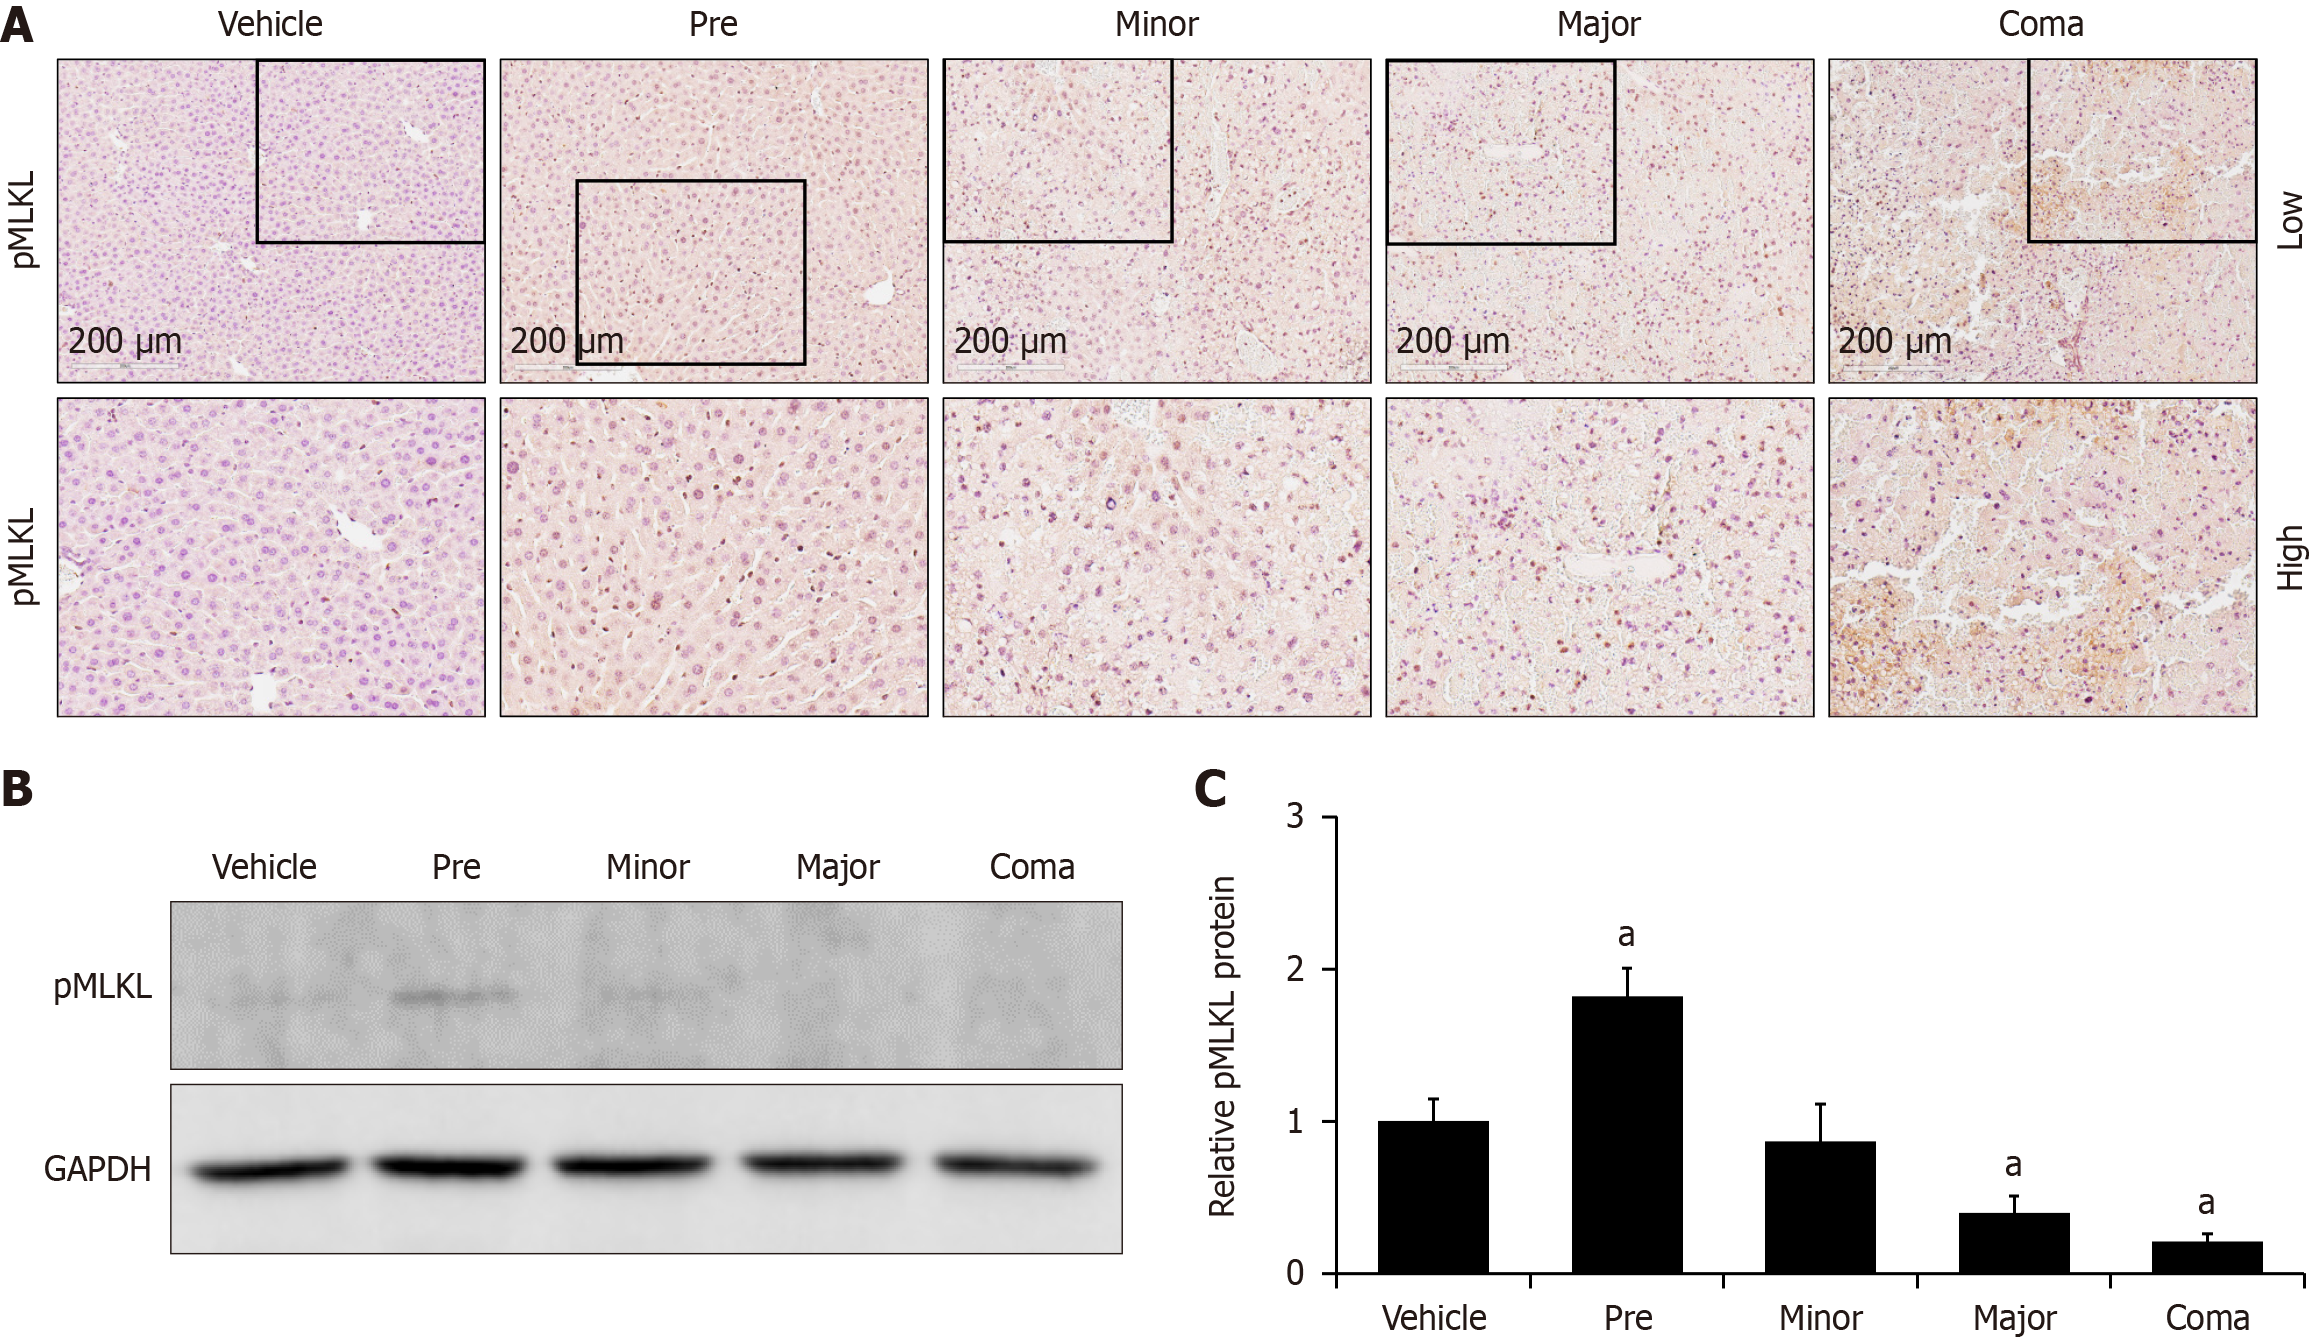
Figure 6 Azoxymethane induces changes to liver necroptosis signaling.
A: Immunohistochemistry images for pMLKL in livers from vehicle- and azoxymethane (AOM)-treated mice at pre, minor, major and coma time points; B and C: Representative immunoblot and quantification of pMLKL protein immunoblots in liver homogenates from mice administered vehicle or AOM at the pre, minor, major and coma time points. GAPDH was used as a protein loading control. n ≥ 3 for each group for all analyses. aP < 0.05 compared to vehicle-treated mice.
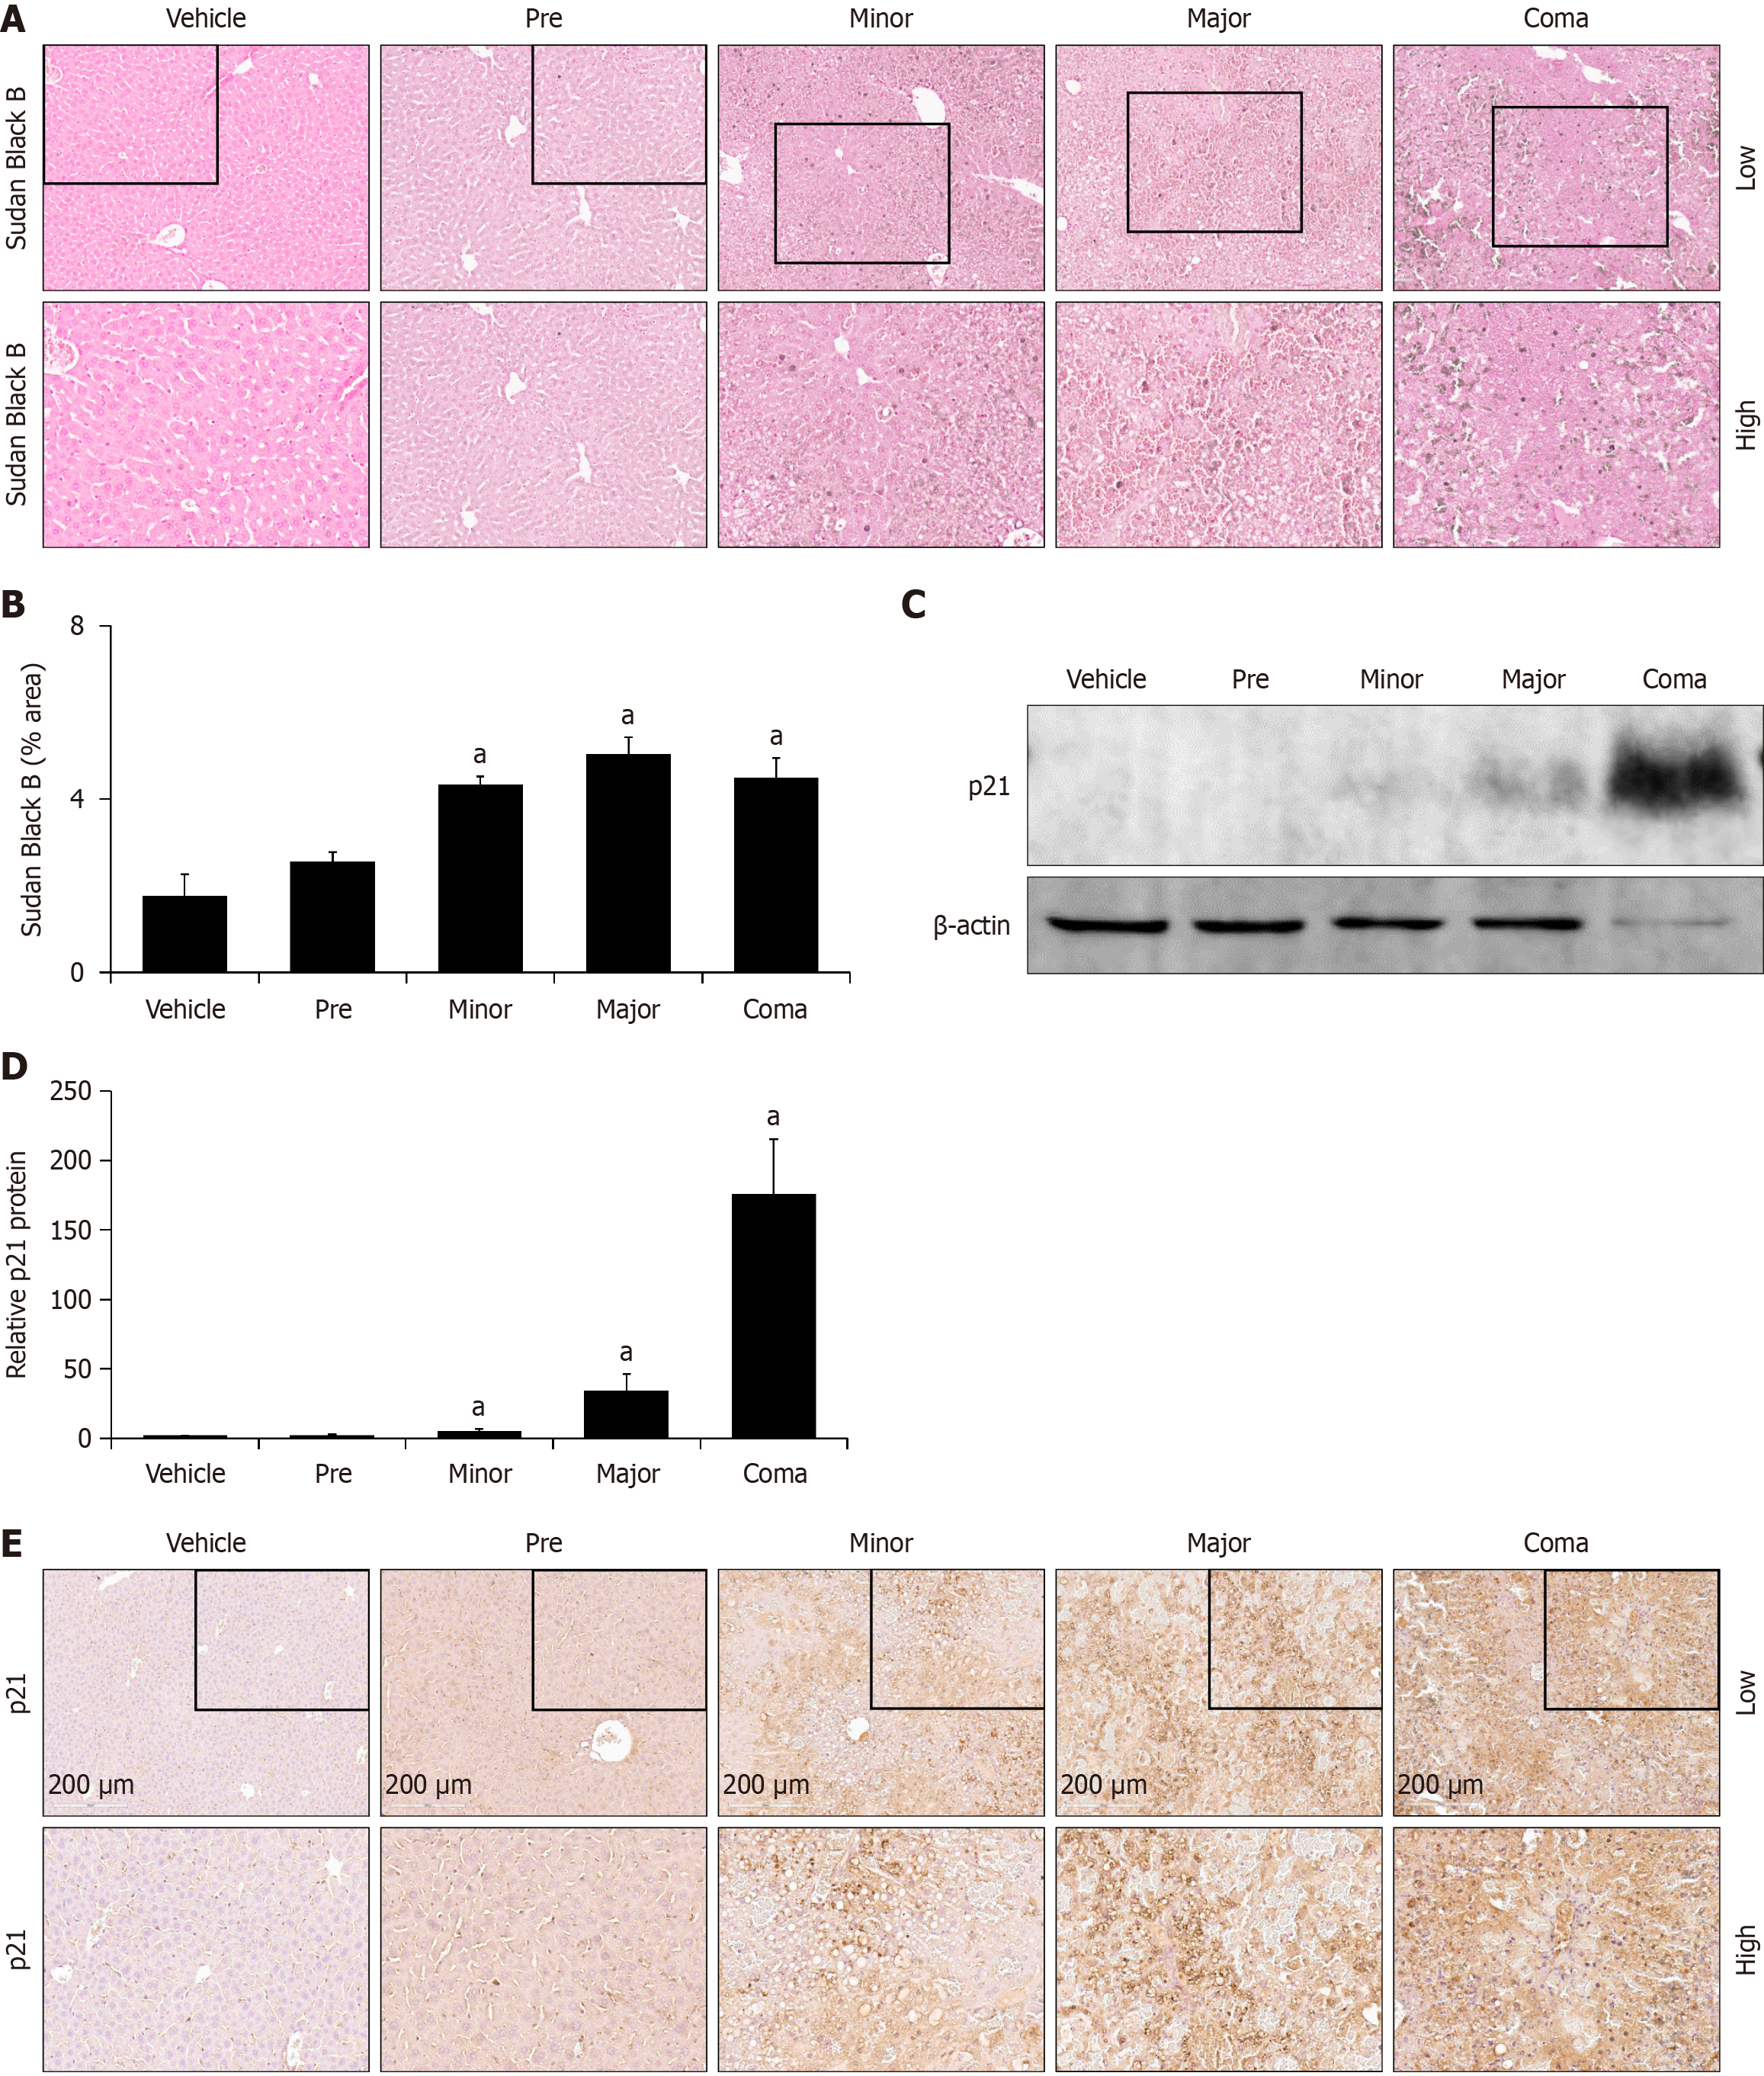
Figure 7 Hepatocellular senescence is increased in response to azoxymethane toxicity.
A: Representative Sudan Black B histochemistry images in liver from vehicle and azoxymethane (AOM)- treated mice at the pre, minor, major and coma time points; B: Liver Sudan Black B staining in mice treated with vehicle or AOM at pre, minor, major and coma time points reported in percent area; C and D: Representative immunoblot and quantification of relative p21 protein from liver homogenates of vehicle- and AOM-treated mice at the pre, minor, major and coma time points. β-actin was used as a protein loading control; E: Representative immunohistochemistry images stained for p21 in livers from vehicle- and AOM-treated mice at the pre, minor, major and coma time points. n ≥ 3 for each group for all analyses. aP < 0.05 compared to vehicle-treated mice.
- Citation: Bhattarai SM, Jhawer A, Frampton G, Troyanovskaya E, DeMorrow S, McMillin M. Characterization of hepatic pathology during azoxymethane-induced acute liver failure. World J Gastroenterol 2025; 31(12): 103952
- URL: https://www.wjgnet.com/1007-9327/full/v31/i12/103952.htm
- DOI: https://dx.doi.org/10.3748/wjg.v31.i12.103952


