Copyright
©The Author(s) 2025.
World J Gastroenterol. Mar 28, 2025; 31(12): 103094
Published online Mar 28, 2025. doi: 10.3748/wjg.v31.i12.103094
Published online Mar 28, 2025. doi: 10.3748/wjg.v31.i12.103094
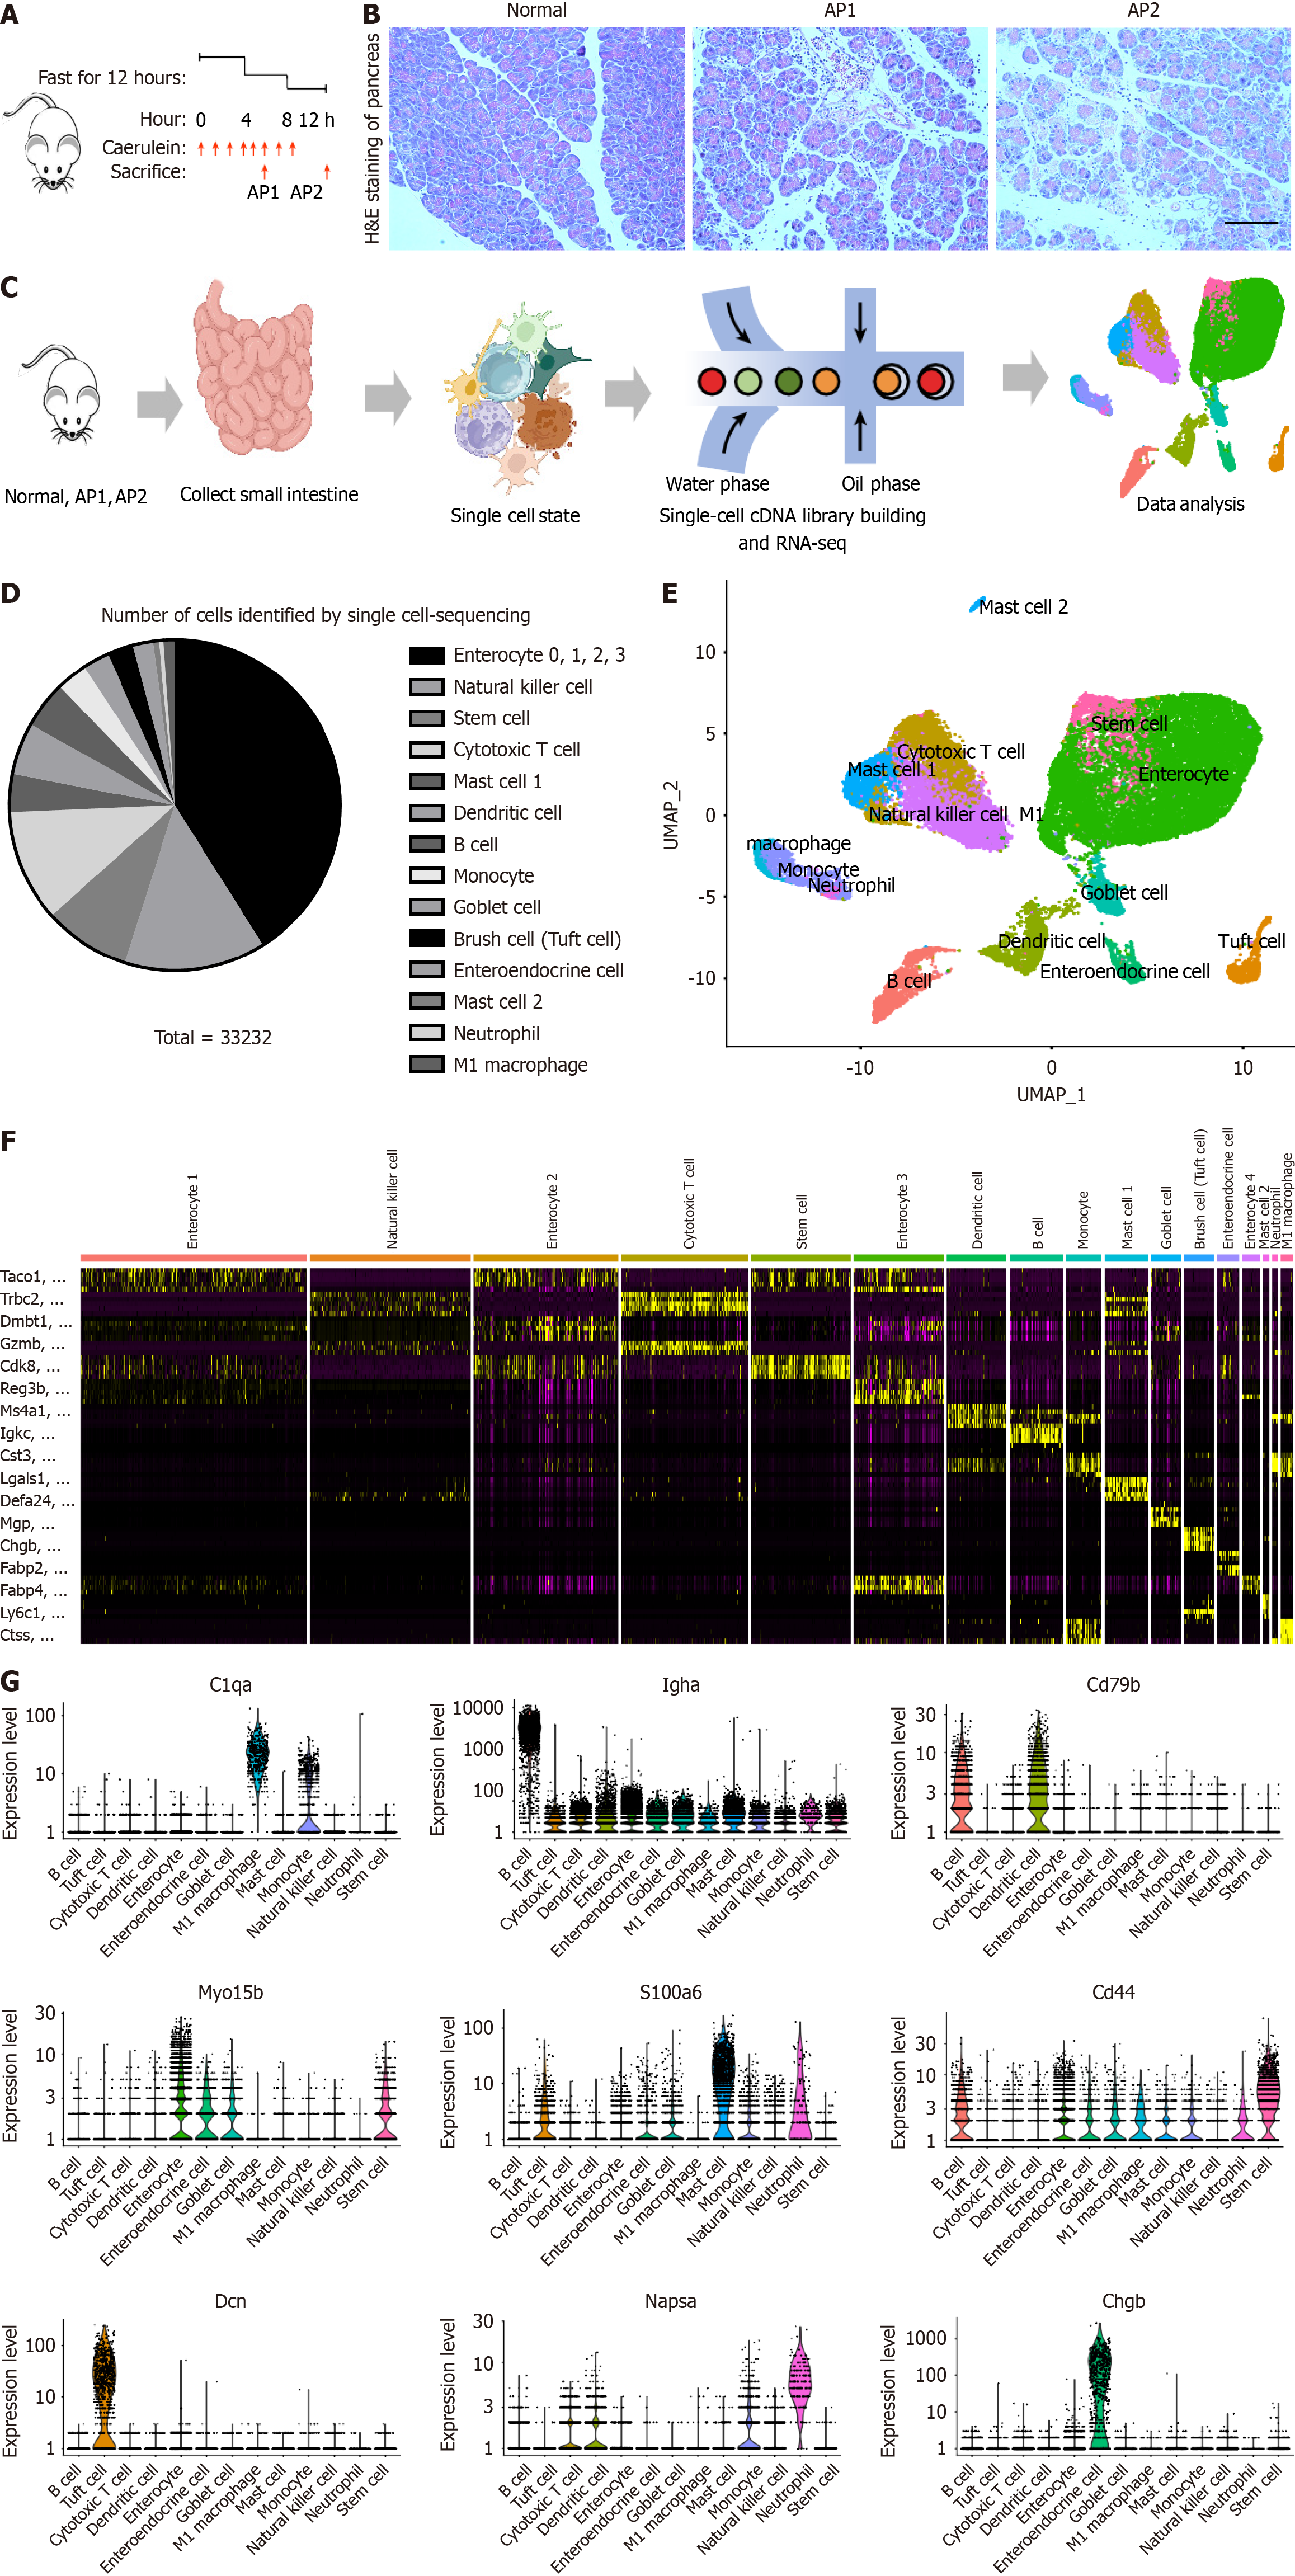
Figure 1 Single-cell expression atlas of the small intestine in mice with acute pancreatitis.
A: Modeling procedure for AP1 and AP2 in mice; B: HE staining of the pancreas in the AP1, AP2 and normal group; C: Workflow for the collection and processing of specimens from AP1, AP2, and control small intestine samples for scRNA-seq; D: Cell type and number ratio identified by single-cell sequencing; E: UMAP plot illustrating major cell types in the small intestine of mice; F: Heatmap showing the expression levels of specific markers in each cell type of the small intestine; G: Violin plots displaying the expression of representative well-known markers across identified cell types in the small intestine.
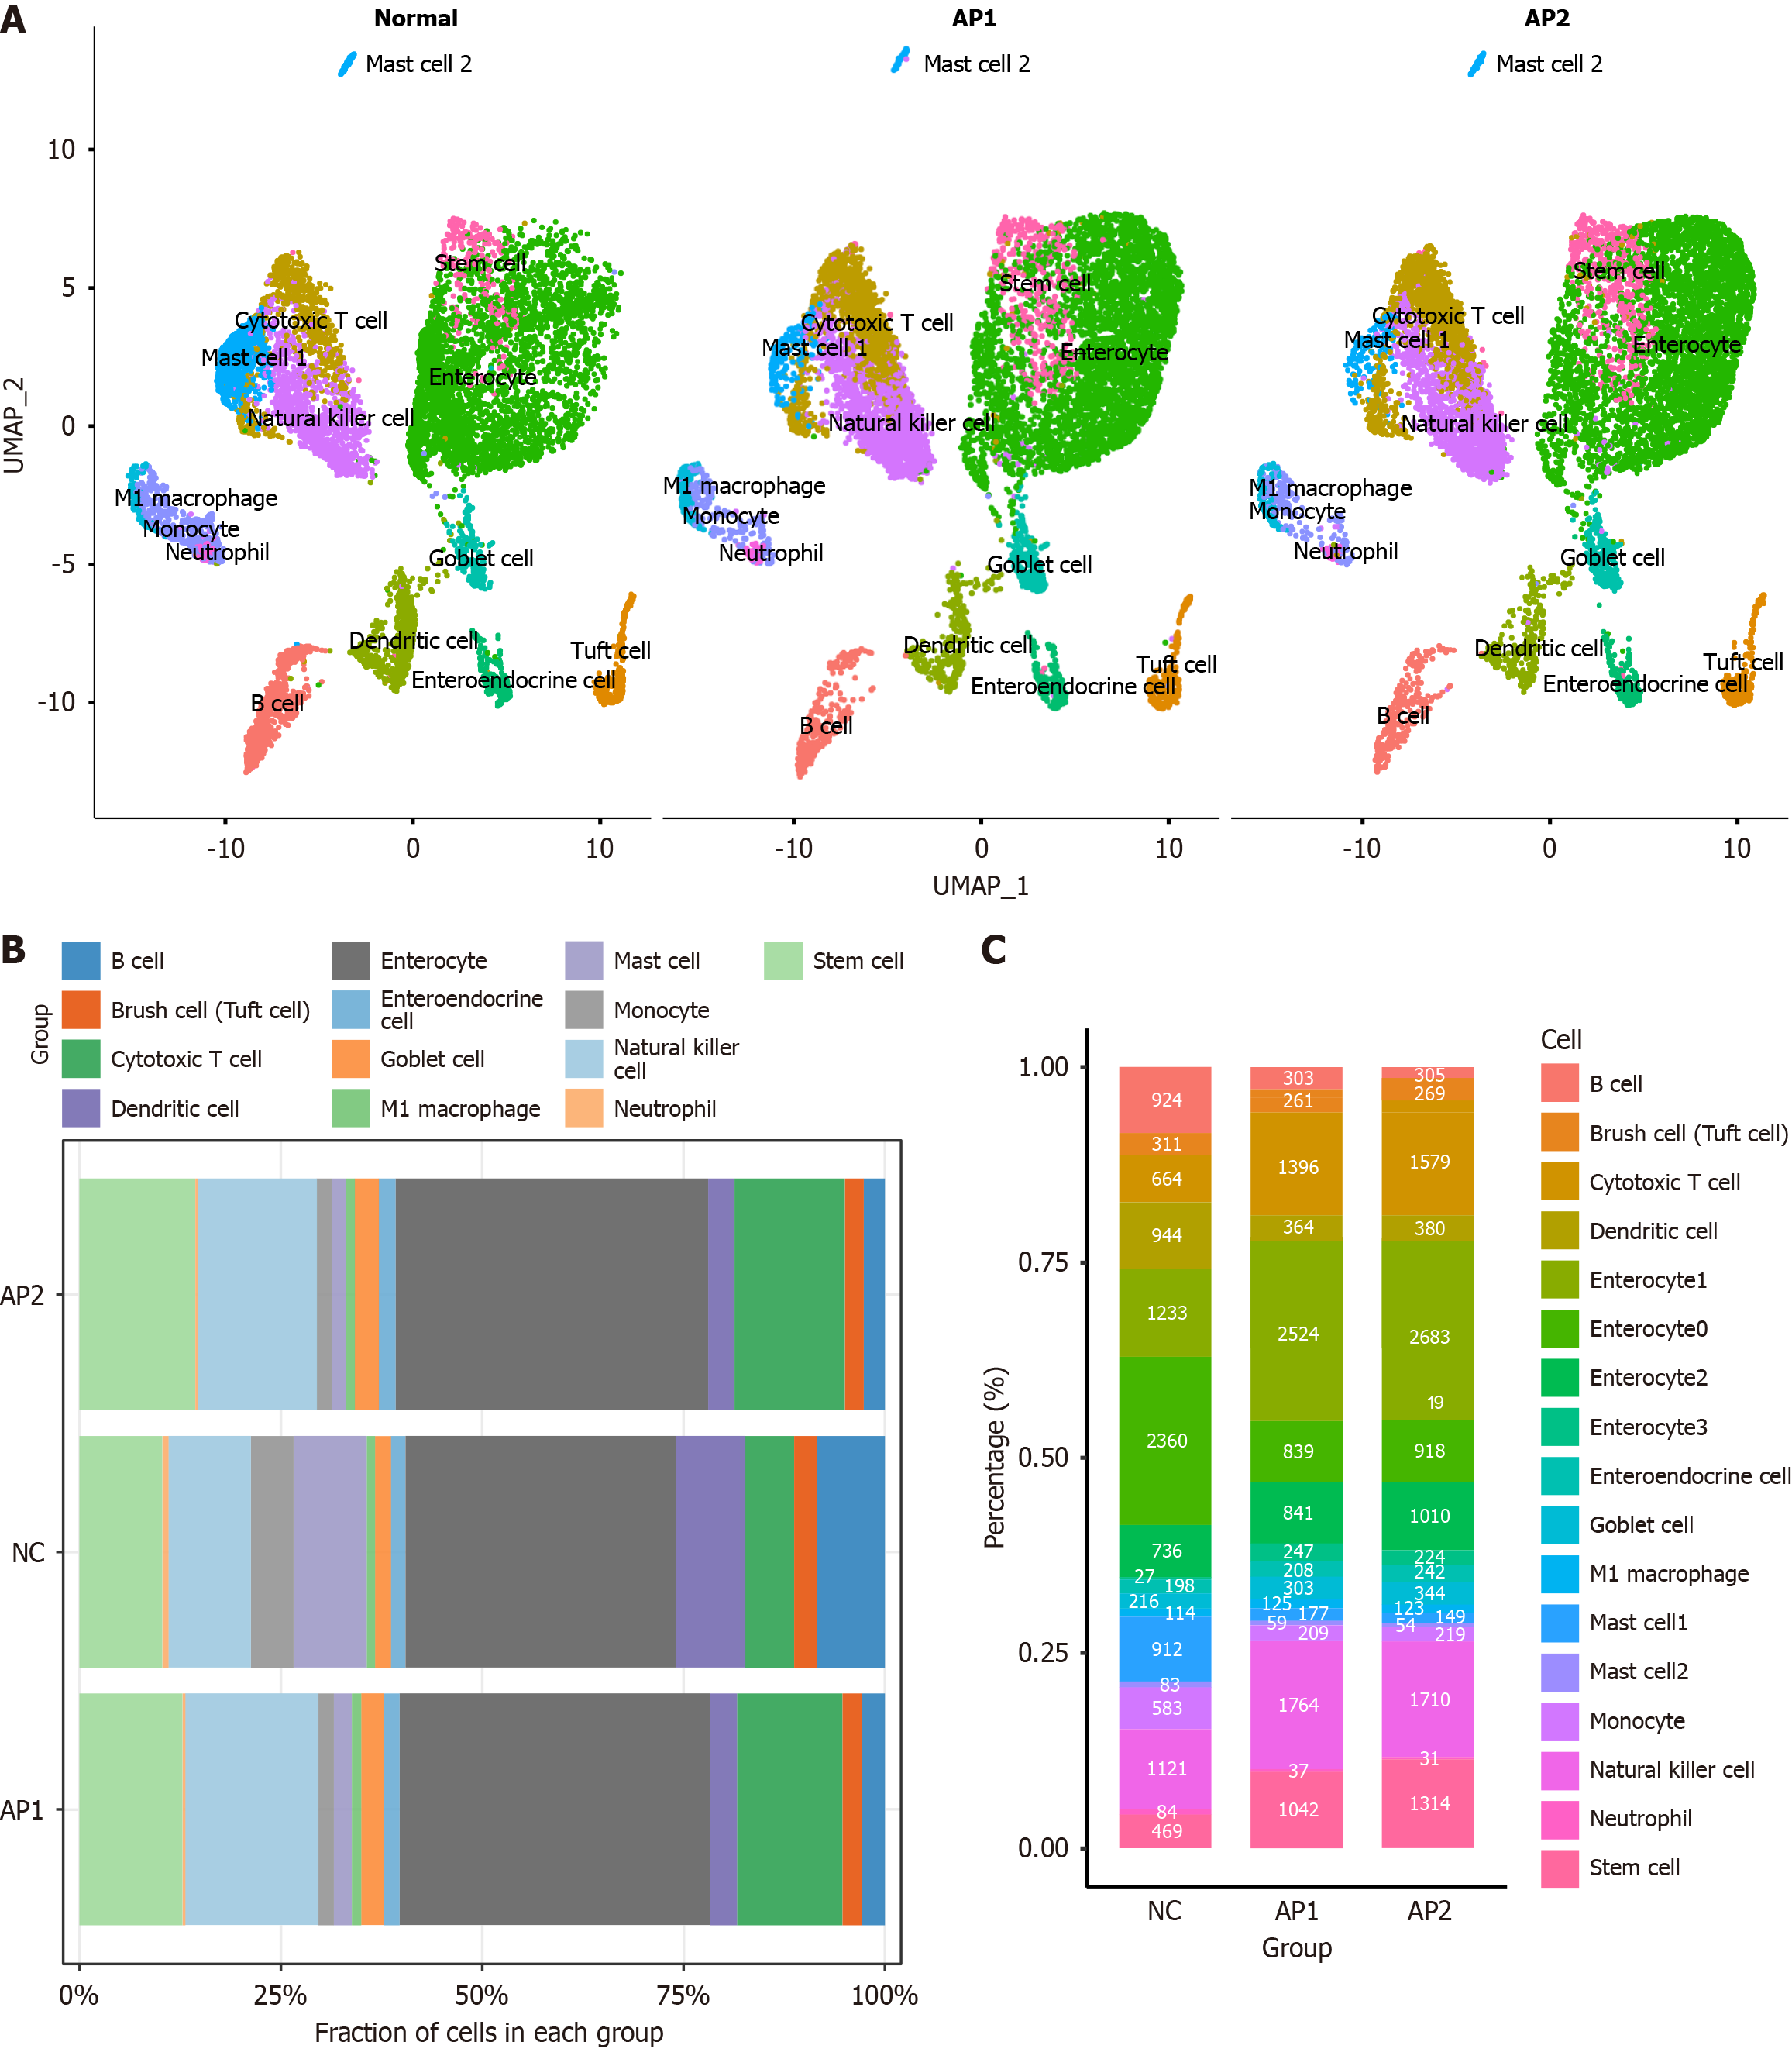
Figure 2 Proportions of these 17 clusters of cells in each group.
A: UMAP plot illustrating major cell types in the small intestine of each group; B: The cell proportions of each cluster in each group; C: The cell count for each cluster in each group.
Figure 3 Enterocytes exhibit increased programmed cell death while maintaining function in the early stages of acute pancreatitis.
A: Protein expression of ZO-1 in the AP1, AP, and normal small intestine; B: Representative enriched gene ontology (GO) terms for differentially expressed genes (DEGs) in enterocytes from the AP1 and normal groups on the basis of scRNA-seq data; C: Selected dysregulated genes associated with cell stress, mitochondrial function, and catabolism (P < 0.05). "Percent expressed" indicates the percentage of cells among groups, whereas "average expression" reflects changes in mean expression; D: Representative enriched GO terms for DEGs in enterocytes from the AP2 and normal groups on the basis of scRNA-seq data; E: Representative enriched GO terms for DEGs in enterocytes from the AP2 and AP1 groups on the basis of scRNA-seq data; F: Protein expression of cleaved caspase-3, Ki-67, and p-MLKL in the AP1, AP2, and normal groups in the small intestine; G: Selected DEGs associated with SLC family genes, nutrient digestion and absorption, and organic acid metabolism in enterocyte subcluster 2 (P < 0.05). "Percent expressed" indicates the percentage of cells among subclusters in enterocytes, whereas "average expression" reflects changes in mean expression. GO: Gene ontology. aP < 0.001.
Figure 4 Increased number of intestinal stem cells responsible for regeneration of enterocytes in the early stages of acute pancreatitis.
A: Representative genes in intestinal stem cells (ISCs), including Lgr5, Cd44, Cdk8, and Sox9, as demonstrated by the scRNA-seq data; B: Protein expression of CD44 in the AP1, AP2, and normal groups in the small intestine; C: Selected dysregulated genes in ISCs, including Mki67, Cdk1, Cdk4, Cdk2ap2, Cdk16, Ccnd1, and Pcna; D: Cell cycle analysis of ISCs across each group; E: Representative enriched gene ontology (GO) terms for differentially expressed genes (DEGs) in ISCs from the AP1 and normal groups on the basis of scRNA-seq data; F: Representative enriched GO terms for DEGs in ISCs from the AP2 and AP1 groups on the basis of scRNA-seq data; G: UMAP plot showing four ISC subclusters in the intestine; H: Selected genes in ISC subclusters, including Mki67, Cdk1, Cdk4, Cdk16, Ccnd1, Ascl2, Il11ra1, and Slc2a5. GO: Gene ontology; ISC: Intestinal stem cell. aP < 0.001.
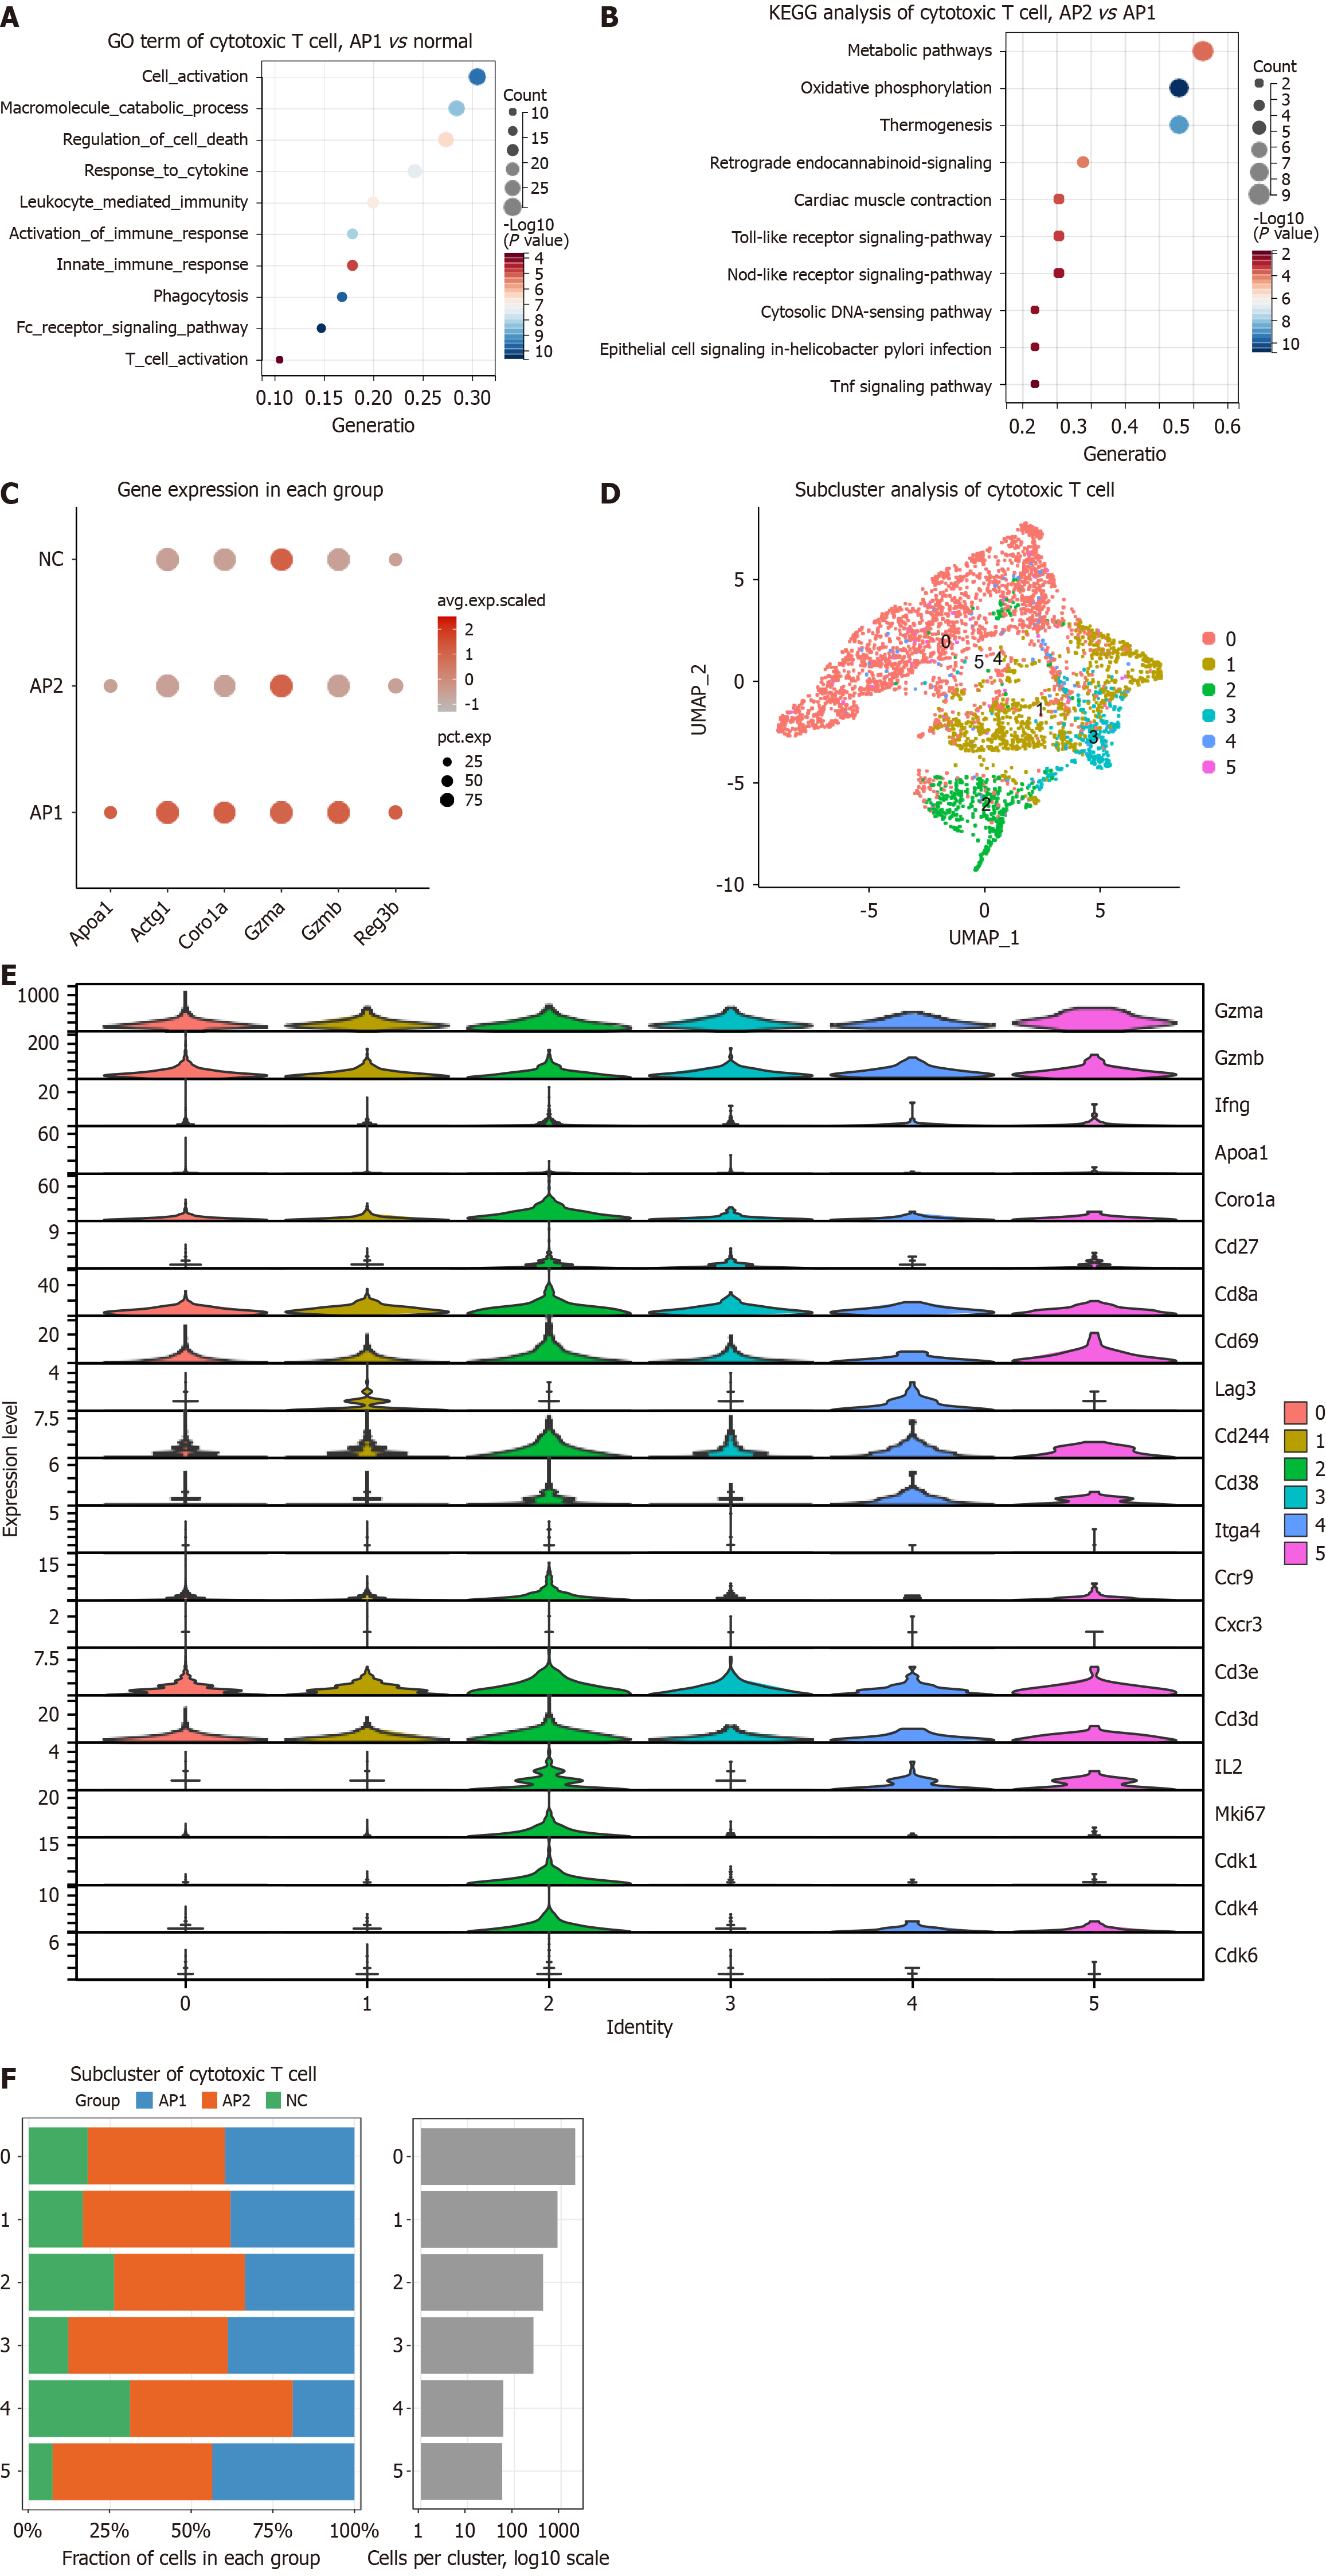
Figure 5 Enhanced antibacterial ability of intestinal cytotoxic T cells in acute pancreatitis.
A: Representative enriched gene ontology terms for differentially expressed genes (DEGs) in cytotoxic T cells from the AP1 and normal groups based on scRNA-seq data; B: Representative enriched Kyoto Encyclopedia of Genes and Genomes pathways for DEGs in cytotoxic T cells from the AP2 and AP1 groups; C: Selected dysregulated genes, including Apoa1, Actg1, Coro1a, Gzma, Gzmb, and Reg3b, in cytotoxic T cells; D: UMAP plot showing 6 cytotoxic T-cell subclusters in the intestine; E: Expression of selected genes in cytotoxic T-cell subclusters, including Gzma, Gzmb, Ifng, Apoa1, Coro1a, Cd27, Cd8a, Cd69, Lag3, Cd244, Cd38, Itga4, Ccr9, Cxcr3, Cd3e, Cd3d, Il2, Mki67, Cdk1, Cdk4, and Cdk6; F: Percentage of cells in each cytotoxic T-cell subcluster. GO: Gene ontology; KEGG: Kyoto Encyclopedia of Genes and Genomes.
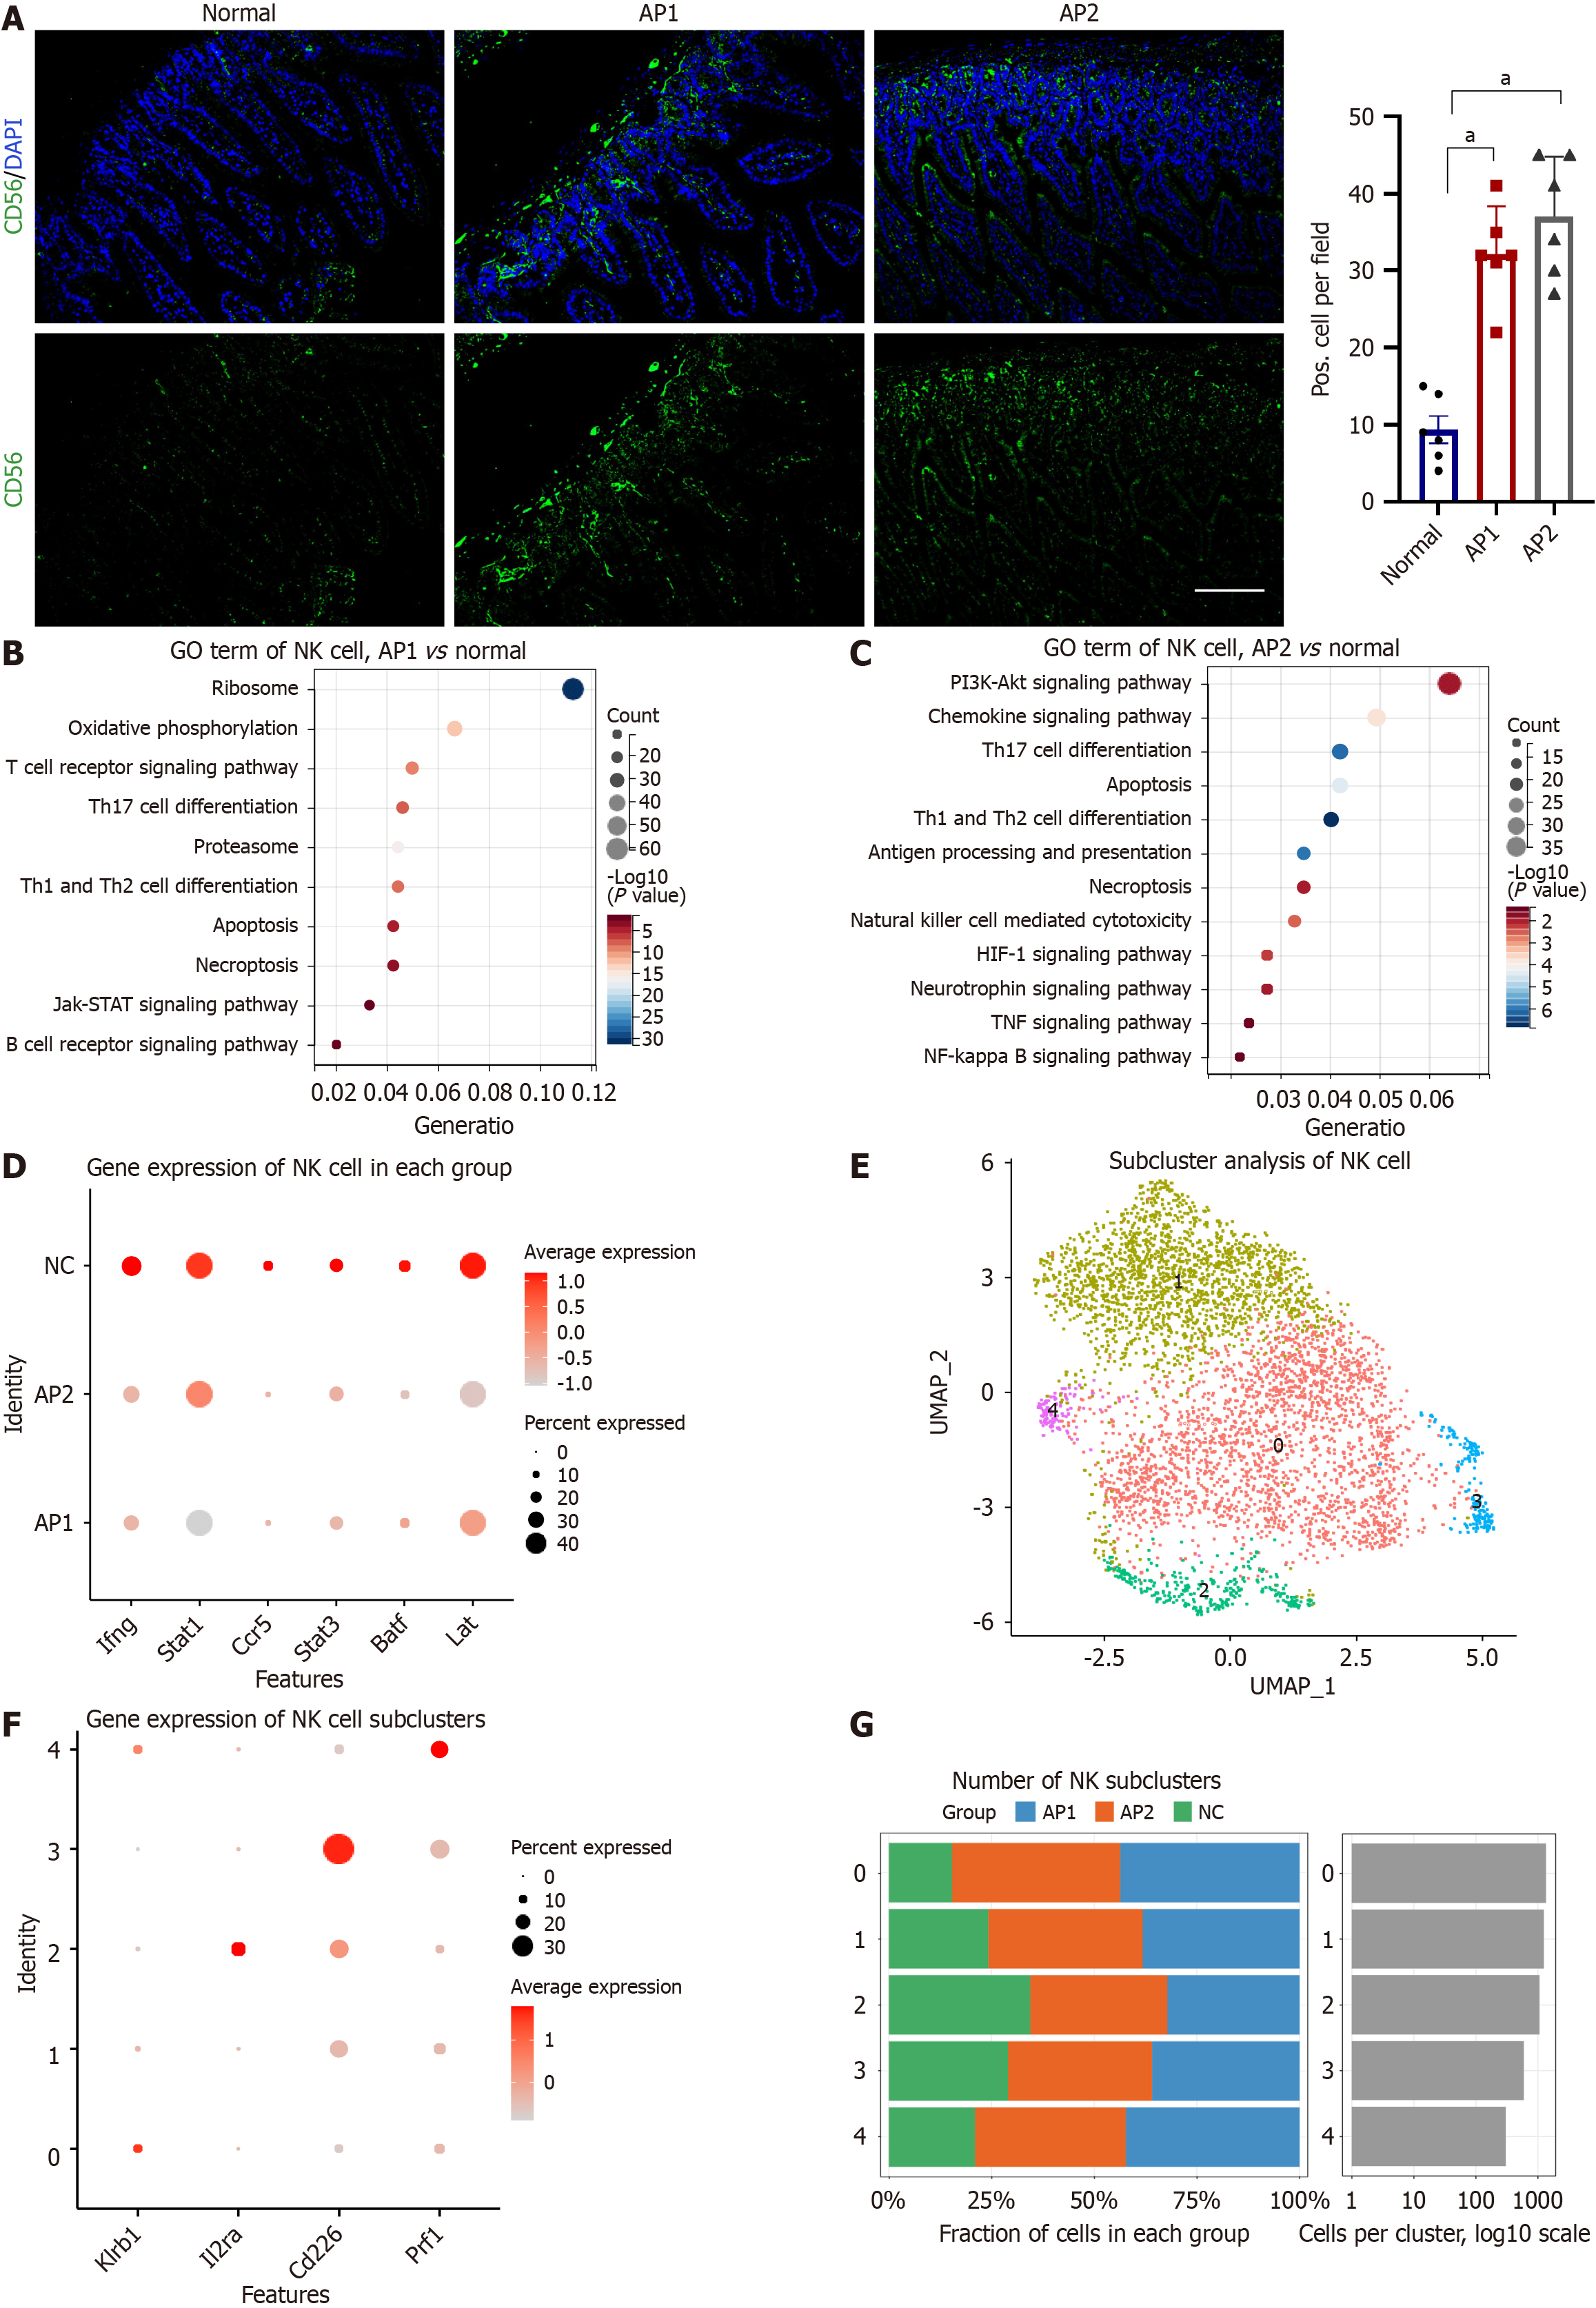
Figure 6 Enhanced ability of natural killer cells to defend against infected cells and pathogens in acute pancreatitis.
A: Protein expression of CD56 in natural killer (NK) cells from the AP1, AP2, and normal groups in the small intestine (left) and semiquantitative analysis (right); B: Representative enriched gene ontology (GO) terms for differentially expressed genes (DEGs) in NK cells from the AP1 and normal groups based on scRNA-seq data; C: Representative enriched GO terms for DEGs in NK cells from the AP2 and normal groups on the basis of scRNA-seq data; D: Expression of selected genes, including Ifng, Stat1, Ccr5, Stat3, Batf, and Lat, in NK cells across each group; E: UMAP plot showing five NK cell subclusters in the intestine; F: Expression of selected genes, including Klrb1, Il2ra, Cd226, and Prf1, in NK cell subclusters; G: Percentage of cells in each NK cell subcluster. GO: Gene ontology; KEGG: Kyoto Encyclopedia of Genes and Genomes; NK: Natural killer. aP < 0.001.
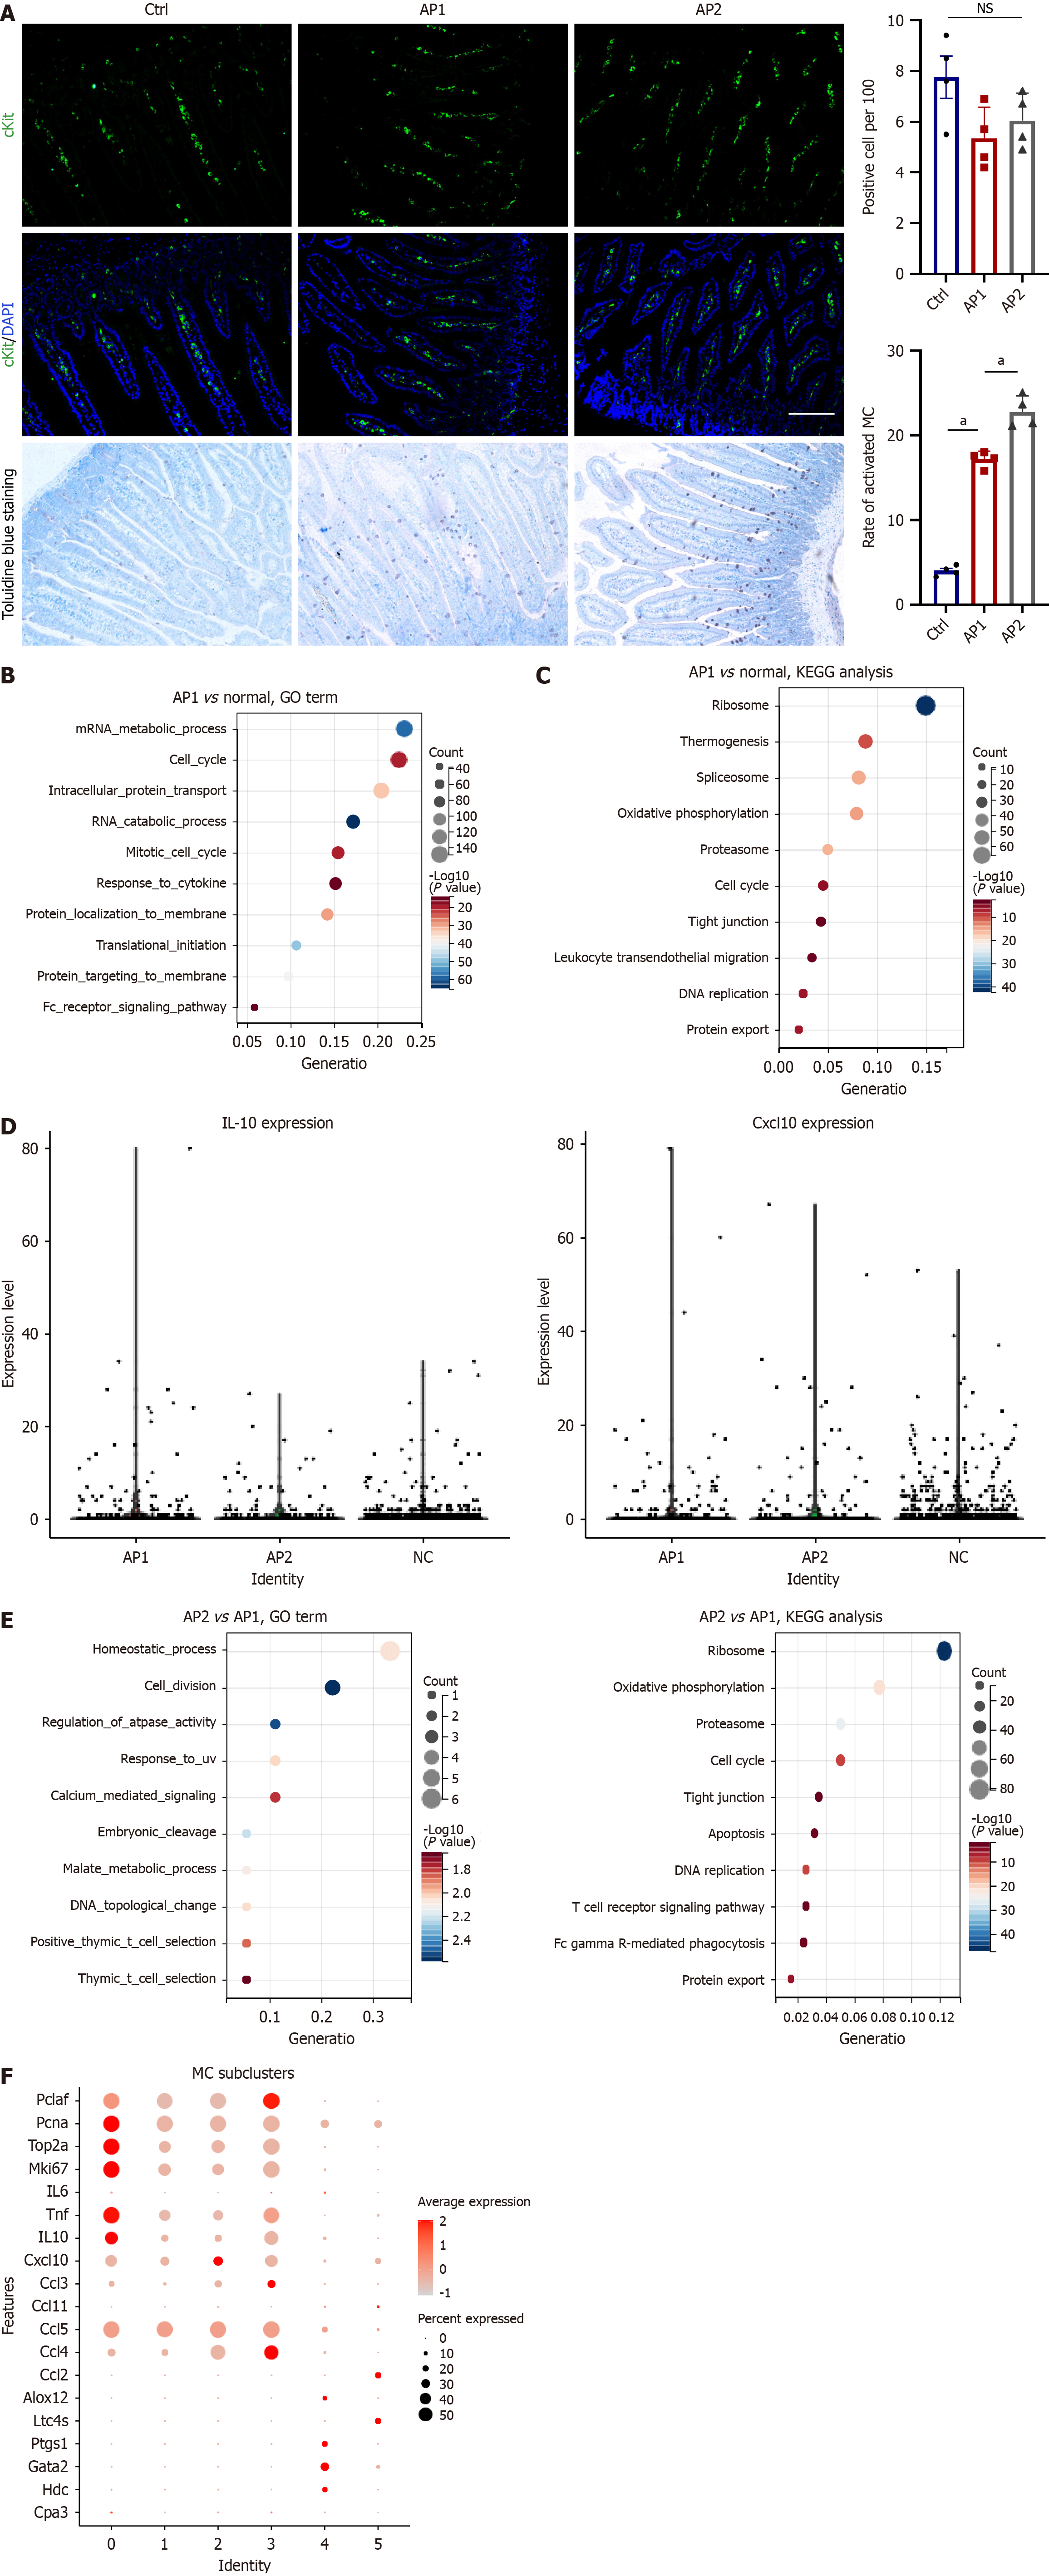
Figure 7 Early activation of mast cells in the intestine of acute pancreatitis.
A: Protein expression of cKit in the small intestine from the AP1, AP2, and normal groups (upper left) and semiquantitative analysis (upper right). Toluidine blue staining of the small intestine (lower left) and semiquantitative analysis of activated mast cells (MCs; lower right); B and C: Representative enriched Gene Ontology (GO) terms and Kyoto Encyclopedia of Genes and Genomes (KEGG) pathways for differentially expressed genes (DEGs) in MCs from the AP1 and normal groups on the basis of scRNA-seq data; D: Violin plots showing the expression of IL-10 and Cxcl10 across each group in the small intestine; E: Representative enriched GO terms and KEGG pathways for DEGs in MCs from the AP2 and AP1 groups on the basis of scRNA-seq data; F: Selected dysregulated genes in MC subclusters, including Pclaf, Pcna, Top2a, Mki67, Il6, Tnf, Il10, Cxcl10, Ccl3, Ccl11, Ccl5, Ccl4, Ccl2, Alox12, Ltc4s, Ptgs1, Gata2, Hdc, and Cpa3. GO: Gene Ontology; KEGG: Kyoto Encyclopedia of Genes and Genomes; MC: Mast cell; NS: No significance. aP < 0.001.
Figure 8 Stabilization of mast cells alleviates intestinal damage and inflammation in the intestine of acute pancreatitis.
A: Workflow schematic for mouse experiments; B: Representative images of toluidine blue staining of small intestine samples from the Cromolyn sodium-treated and control groups (left) and semiquantitative analysis of activated mast cells (right); C: Relative levels of 16S rDNA in plasma from the Cromolyn sodium-treated and control groups; D: HE staining of the small intestine in the Cromolyn sodium-treated and control groups; E: Gene targeting strategy for Rosa26-CAG-LSL-tdTomato mice; F: Genotype identification of Rosa26-CAG-LSL-tdTomato mice; G: Workflow schematic for mouse experiments of Villin-tdT mice; H: Immunofluorescence images of the small intestine in the Cromolyn sodium-treated and control groups; I and J: mRNA expression levels of IL-1β and IL-6 in the small intestine of the Cromolyn sodium-treated and control groups; K: CD68 staining of the small intestine in the Cromolyn sodium-treated and control groups (left) and semiquantitative analysis (right); L: Ly6G staining of the small intestine in the Cromolyn sodium-treated and control groups (left) and semiquantitative analysis (right). aP < 0.001; bP < 0.05; cP < 0.01.
Figure 9 CCL5 derived from mast cells promotes infiltration of neutrophils and macrophages.
A: Violin plots displaying the expression of CCL5 across each group in the small intestine; B: CCL5 mRNA expression levels in the small intestine of the AP1, AP2, and normal groups; C: Flow cytometry analysis of CCL5 expression in CD117-positive cells in the small intestine; D: CCL5 mRNA expression levels in MC/9 cells treated with varying amounts of primary acini; E: Identification of genotypes in c-KitW-sh/W-sh mice; F: Weight comparison between c-KitW-sh/W-sh mice and wild-type mice; G: Workflow schematic for mouse experiments; H: Immunofluorescence staining confirms the successful inoculation of MC/9 cells into the small intestine; I: HE staining of the pancreas in c-KitW-sh/W-sh mice inoculated with MC/9 cells (left) and semiquantitative analysis (right); J: Amylase and lipase activity in plasma from c-KitW-sh/W-sh mice inoculated with MC/9 cells (CCL5 shRNA or control); K: HE staining of the intestine of c-KitW-sh/W-sh mice inoculated with MC/9 cells (CCL5 shRNA or control); L: 16S rDNA expression in plasma from c-KitW-sh/W-sh mice inoculated with MC/9 cells (CCL5 shRNA or control); M: Immunofluorescence staining of CD68 in the small intestine of c-KitW-sh/W-sh mice inoculated with MC/9 cells (CCL5 shRNA or control); N: Immunofluorescence staining of Ly6G in the small intestine of c-KitW-sh/W-sh mice inoculated with MC/9 cells (CCL5 shRNA or control). MC: Mast cell; NS: No significance. aP < 0.001; bP < 0.05; cP < 0.01.
- Citation: Wei ZX, Jiang SH, Qi XY, Cheng YM, Liu Q, Hou XY, He J. scRNA-seq of the intestine reveals the key role of mast cells in early gut dysfunction associated with acute pancreatitis. World J Gastroenterol 2025; 31(12): 103094
- URL: https://www.wjgnet.com/1007-9327/full/v31/i12/103094.htm
- DOI: https://dx.doi.org/10.3748/wjg.v31.i12.103094


