Copyright
©The Author(s) 2025.
World J Gastroenterol. Mar 28, 2025; 31(12): 100855
Published online Mar 28, 2025. doi: 10.3748/wjg.v31.i12.100855
Published online Mar 28, 2025. doi: 10.3748/wjg.v31.i12.100855
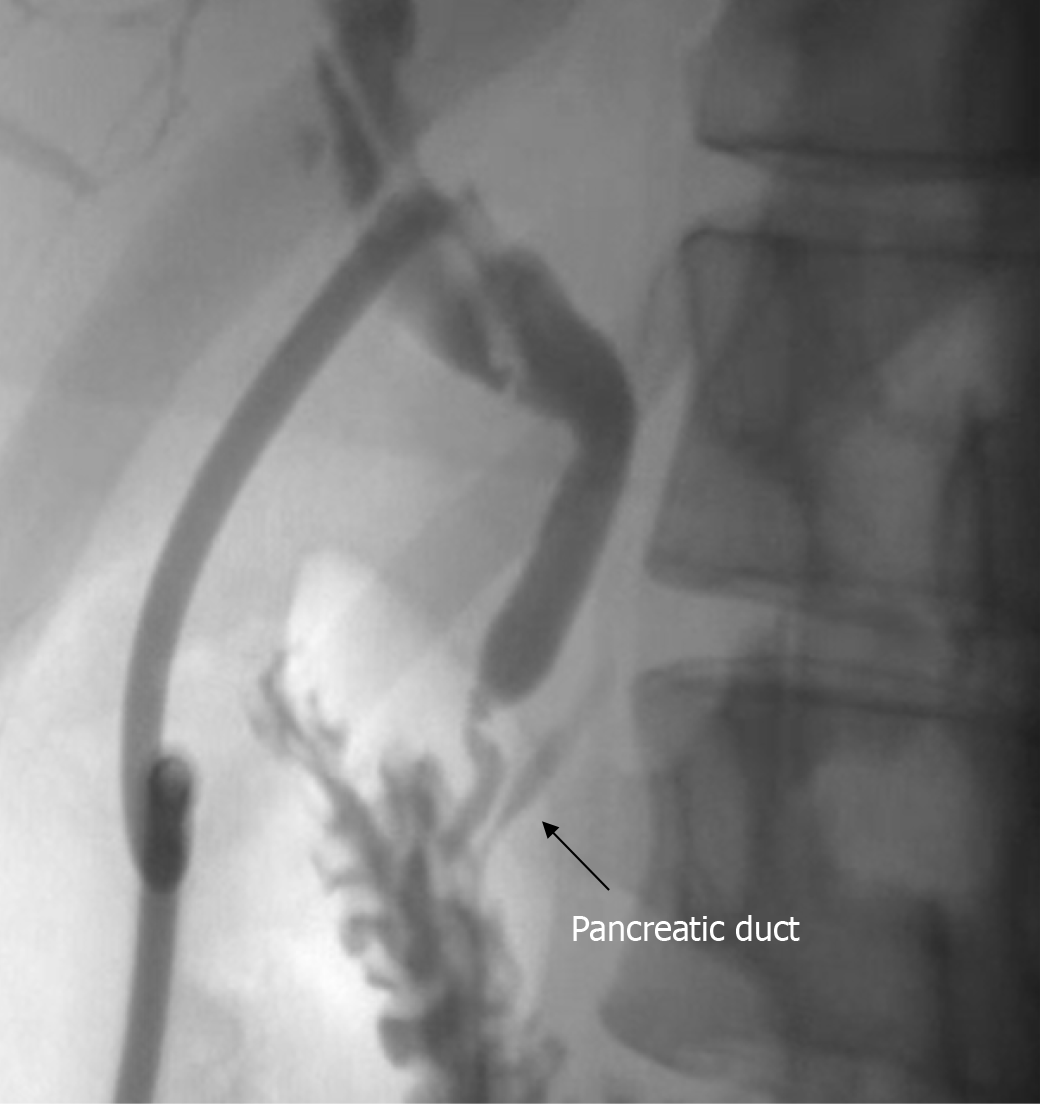
Figure 1 Occult pancreaticobiliary reflux case.
A common bile duct incision was performed to insert a T-shaped tube during biliary tract surgery. The pancreatic duct was visualized on antegrade cholangiography, indicating the presence of dysfunction of the sphincter of Oddi and the bile and pancreatic sphincter.
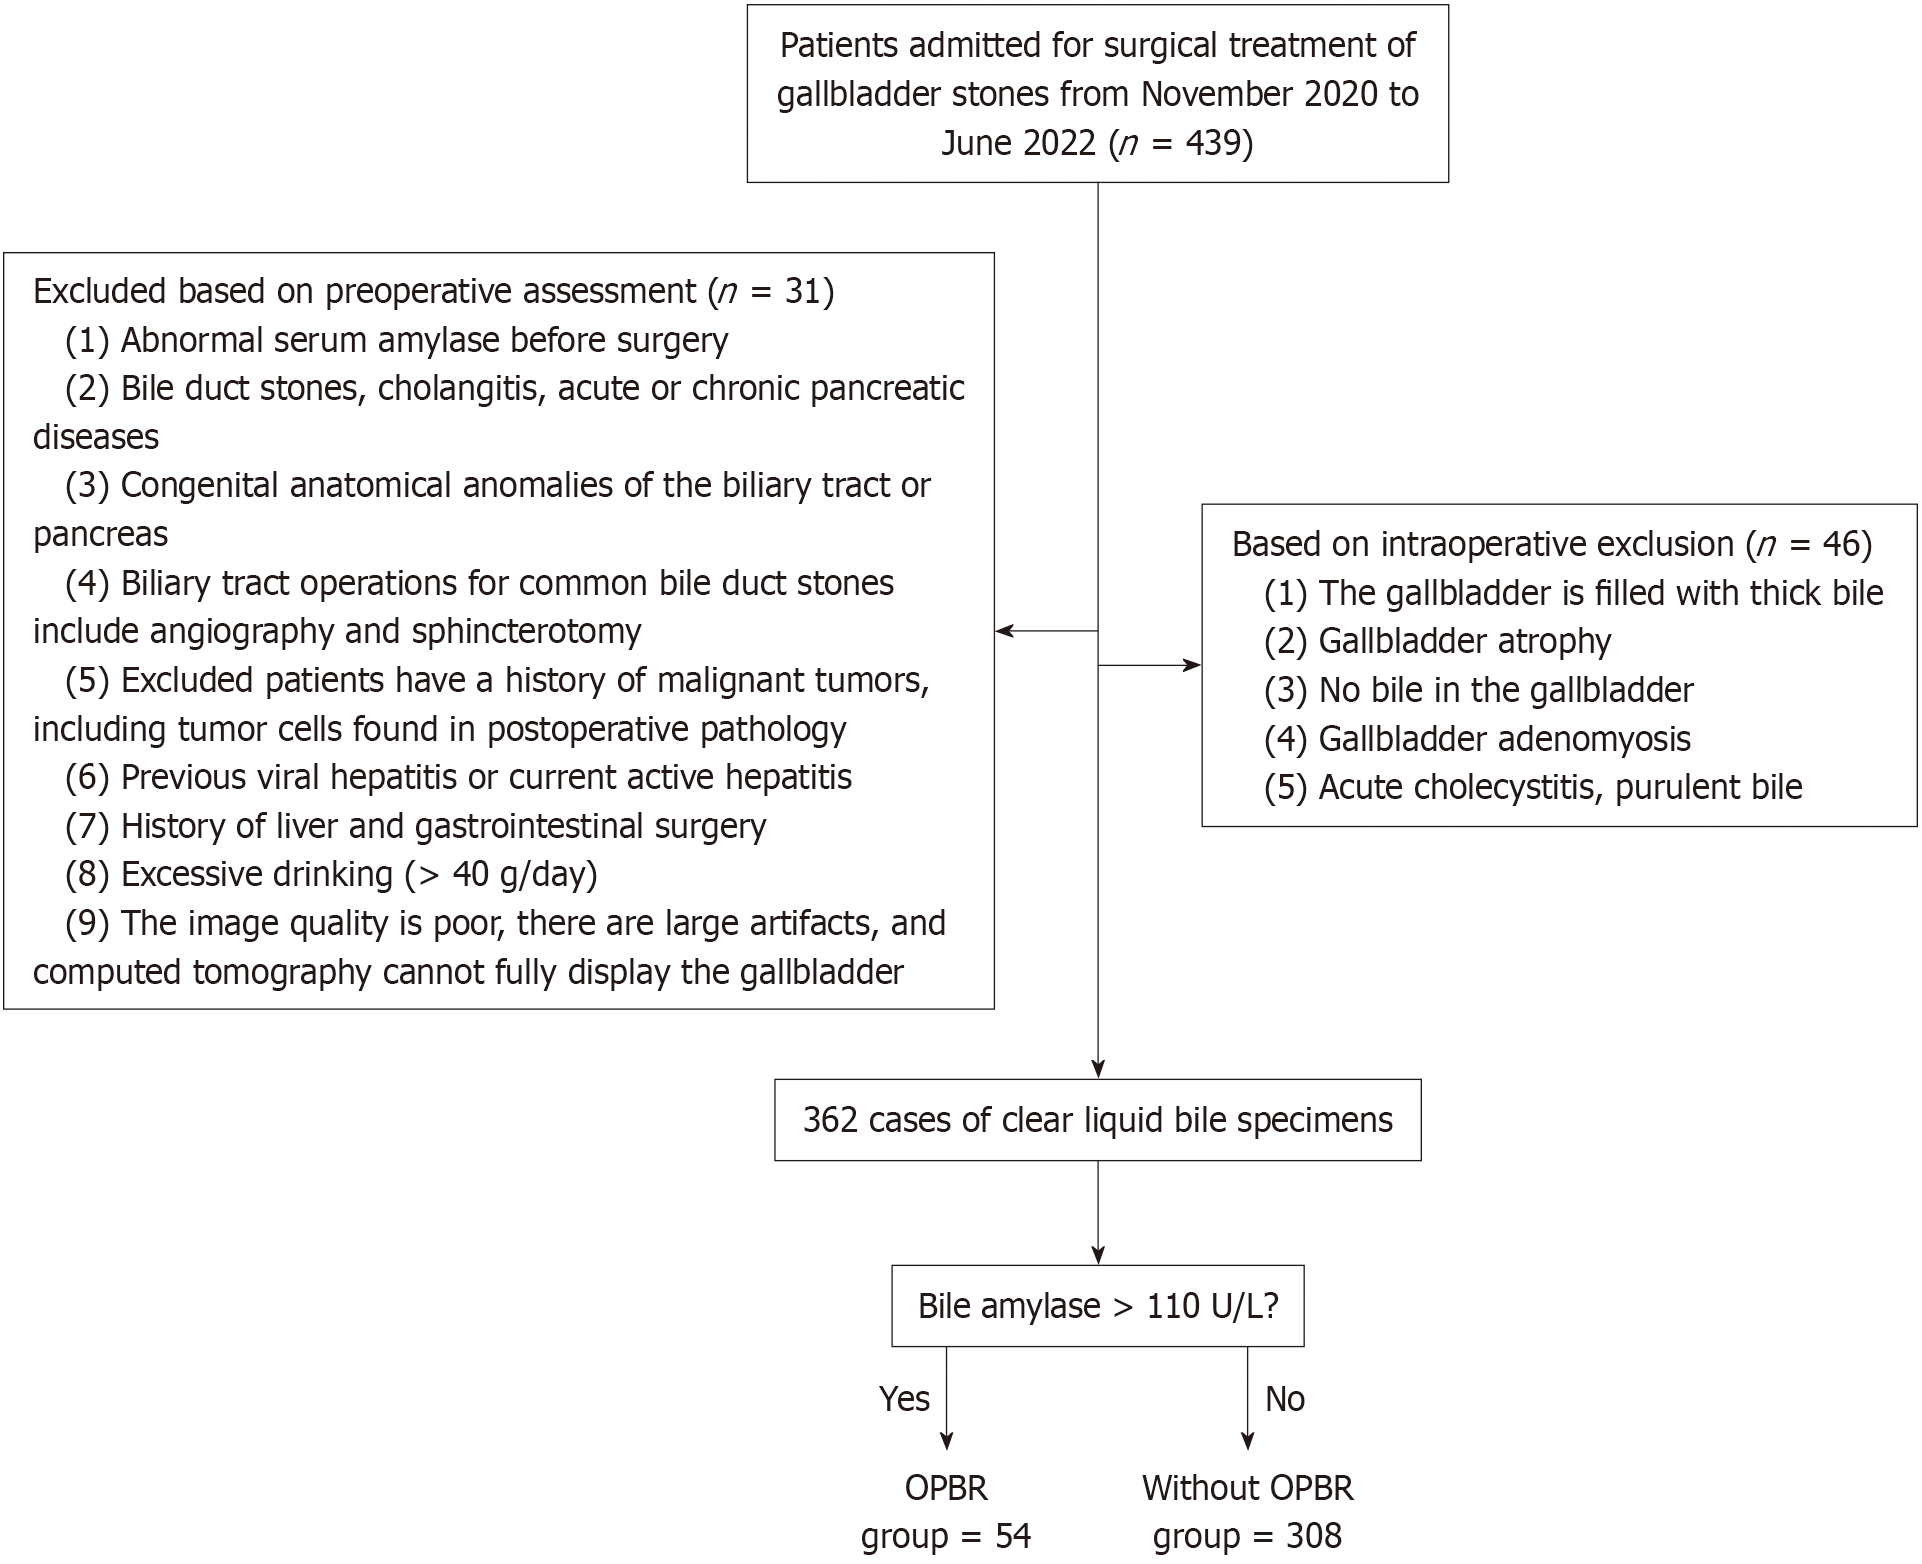
Figure 2 Flow chart of study design.
OPBR: Occult pancreaticobiliary reflux.
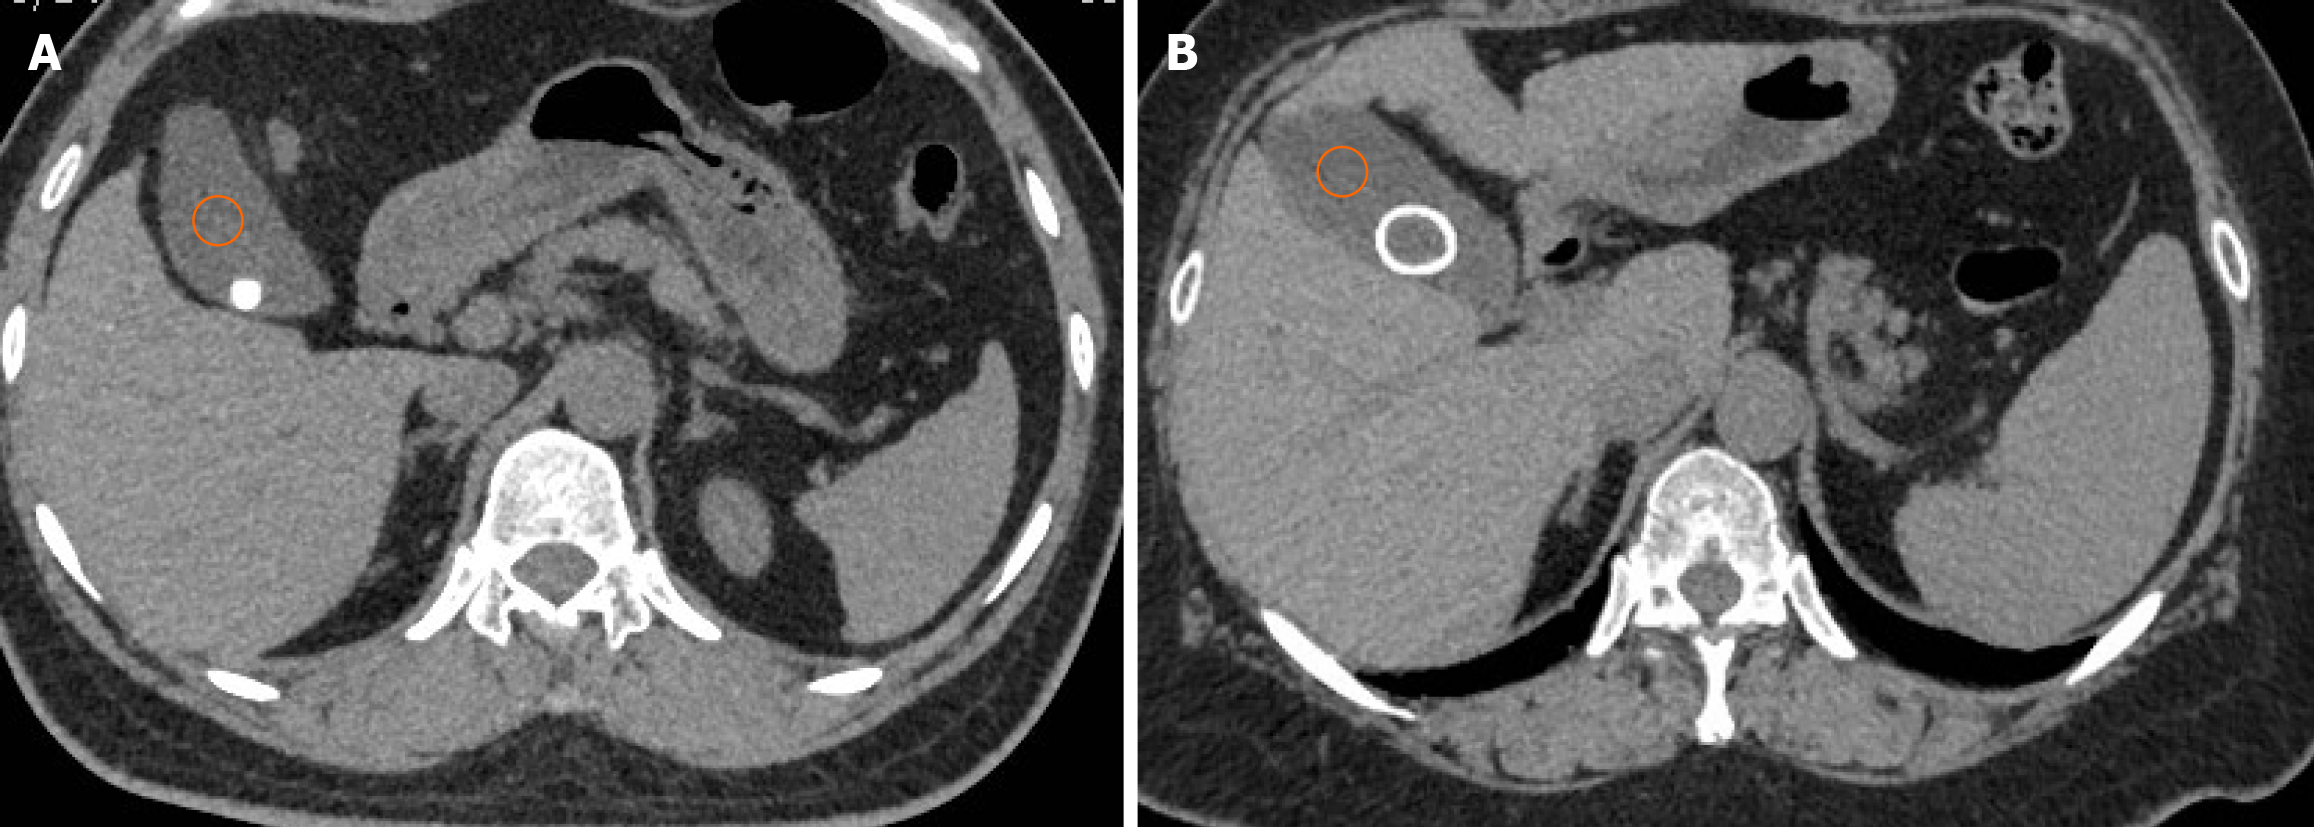
Figure 3 Non-enhanced CT scans.
A: The HU value measurement of homogeneous gallbladder stones; B: The HU value measurement of heterogeneous gallbladder stones. Three 2 cm2 circular regions of interest were manually drawn at three different parts of segments VII and VIII of the right lobe of the liver and the middle third of the spleen. The orange circle is the measured bile gray value.
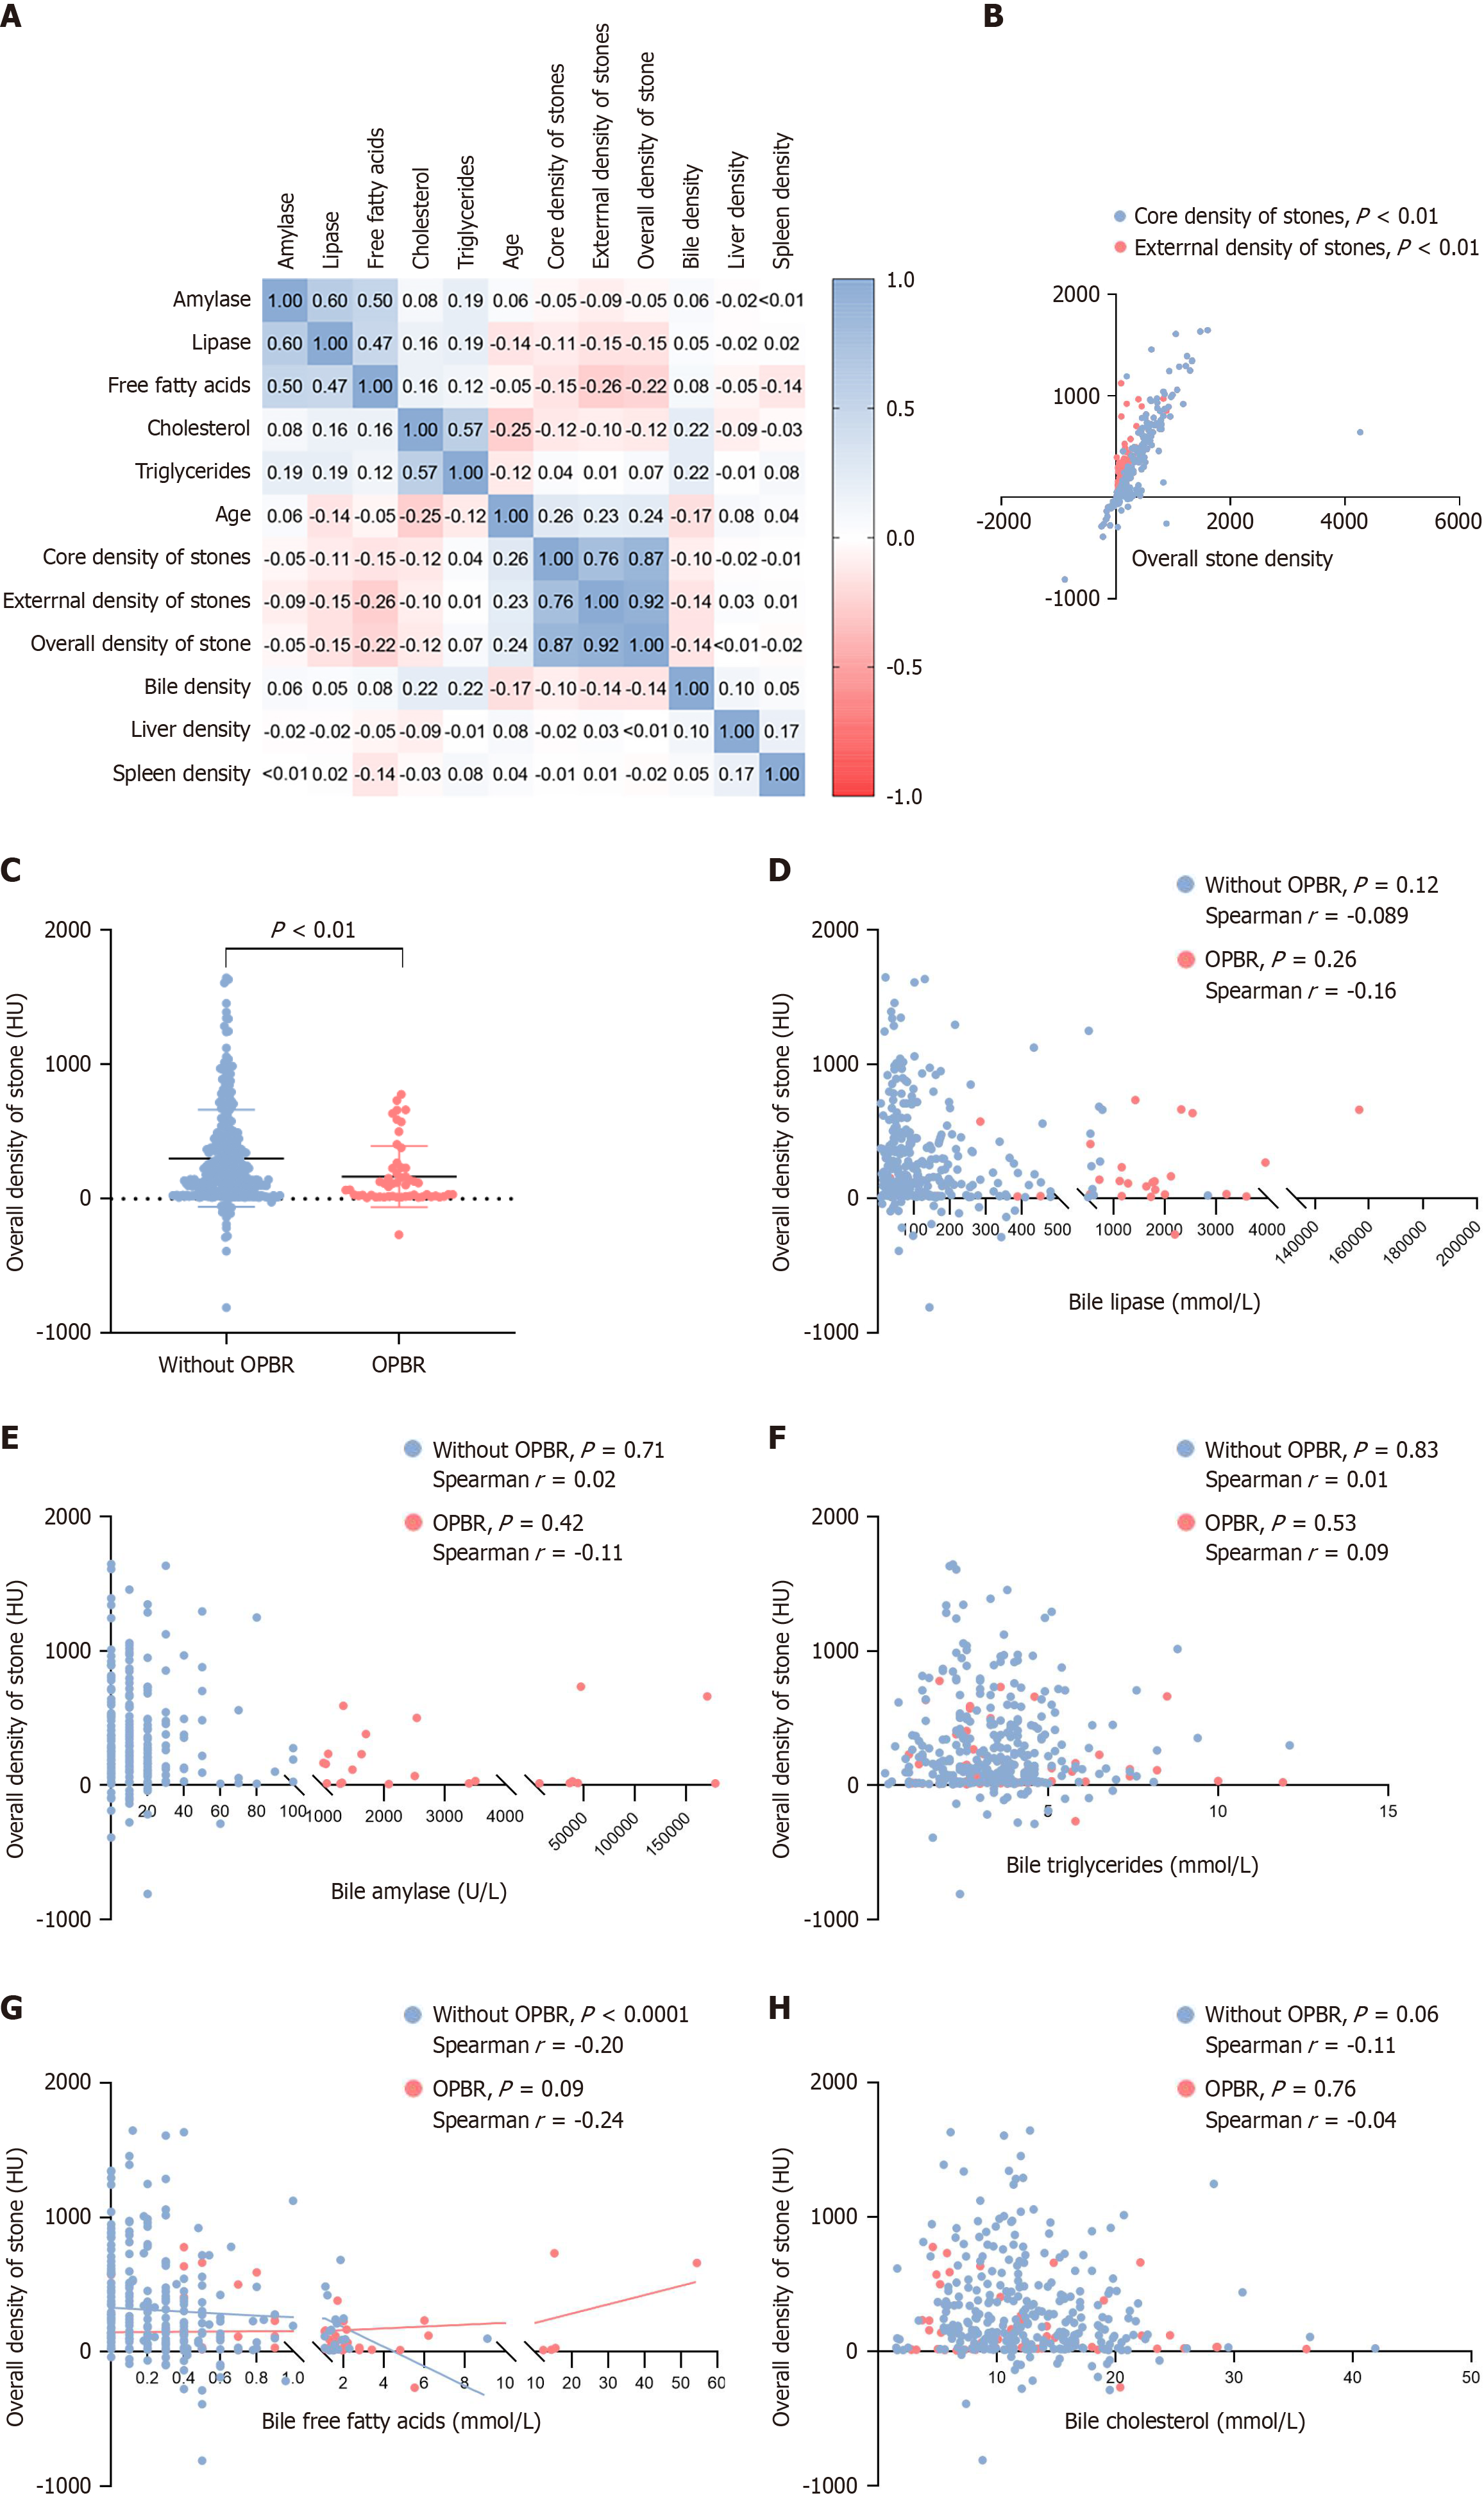
Figure 4 Correlation analysis of bile components and gallbladder stone density.
A: Correlation analysis of bile components and influencing parameters; B: Correlation between stone peripheral and core HU values and the overall stone HU value; C: Comparison of differences between groups in the overall stone HU value; D-H: Overall stone HU value and bile analysis of intragroup differences in ingredients. OPBR: Occult pancreaticobiliary reflux.
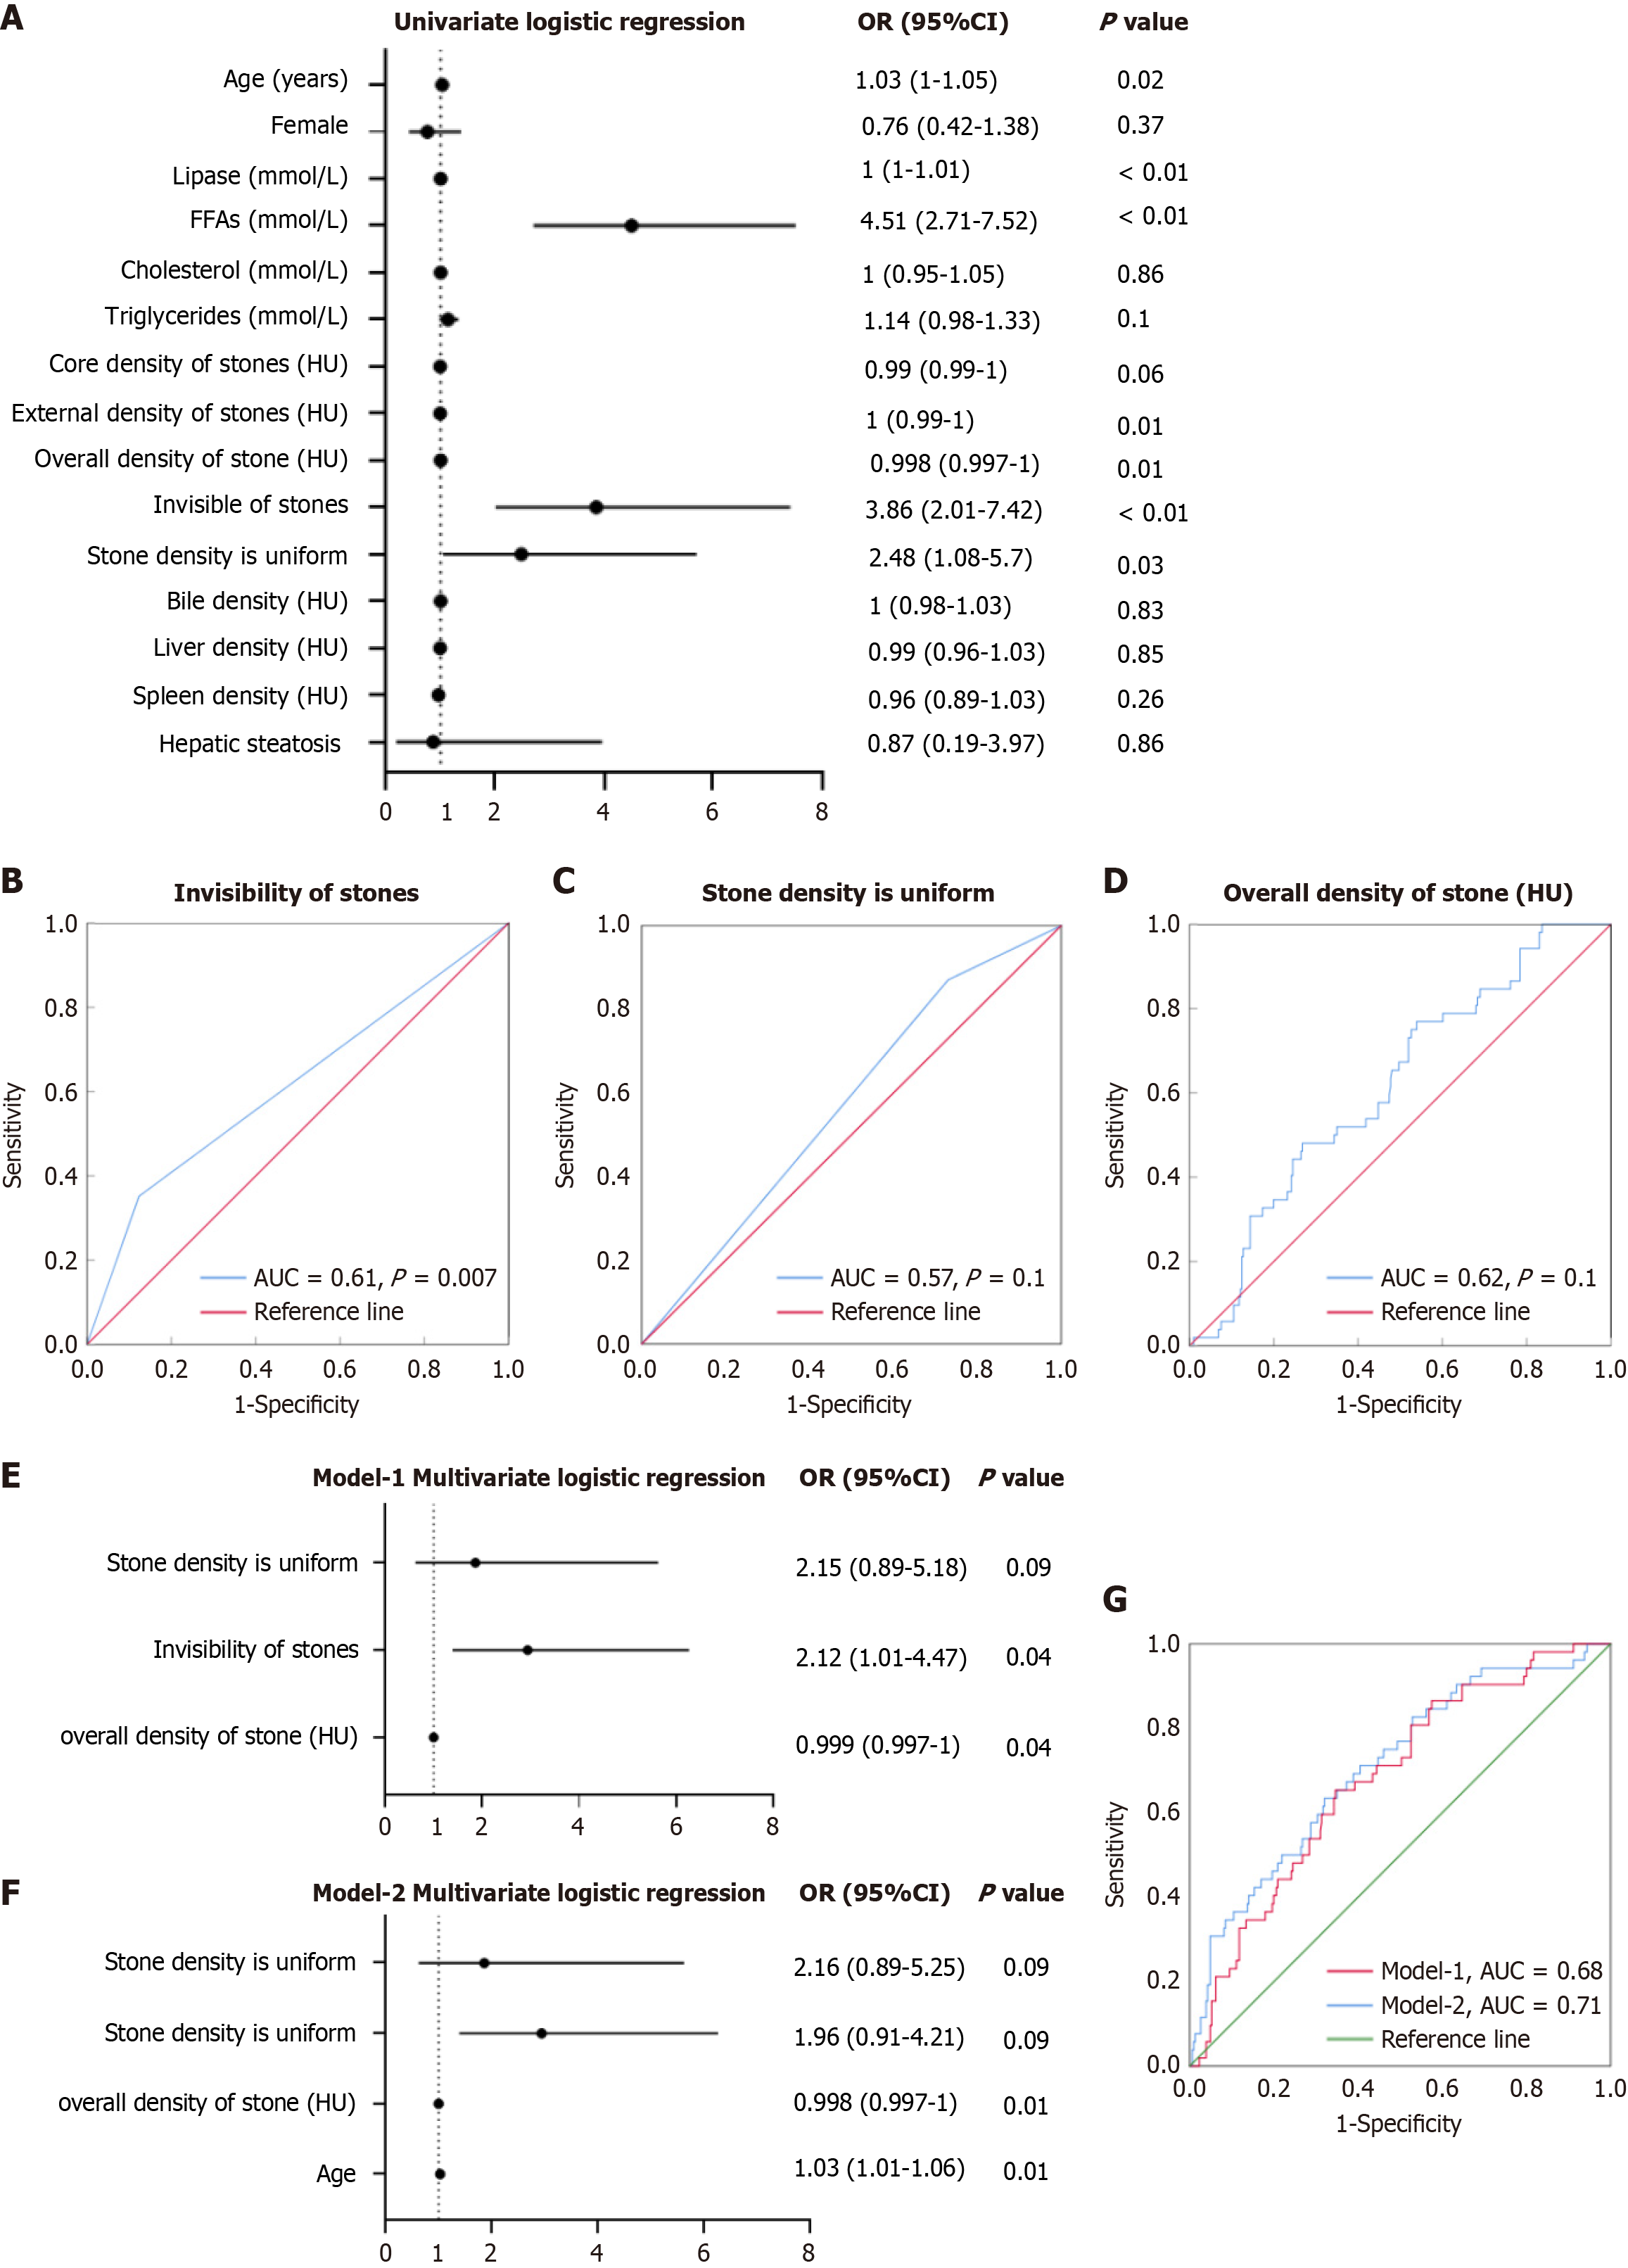
Figure 5 Predictive value of computed tomography imaging parameters for diagnosing occult pancreaticobiliary reflux.
A: Forest plot of univariate logistic regression analysis for occult pancreaticobiliary reflux (OPBR), showing the odds ratio (OR) and 95% confidence interval (CI) for various clinical and imaging parameters; B: Receiver operating characteristic (ROC) curve evaluating the diagnostic performance of CT invisible stones for OPBR; C: ROC curve assessing the predictive ability of uniform stones in diagnosing OPBR; D: ROC curve illustrating the predictive value of overall stone density for OPBR detection; E: Multivariate logistic regression (Model-1) incorporating stone invisibility, stone density uniformity and overall stone density; F: Multivariate logistic regression (Model-2) including age as an additional factor. The overall predictive accuracy improved; G: ROC curves comparing the diagnostic performance of Model-1 and Model-2, demonstrating the enhanced predictive value when age was included. AUC: Area under the curve; FFA: Free fatty acid.
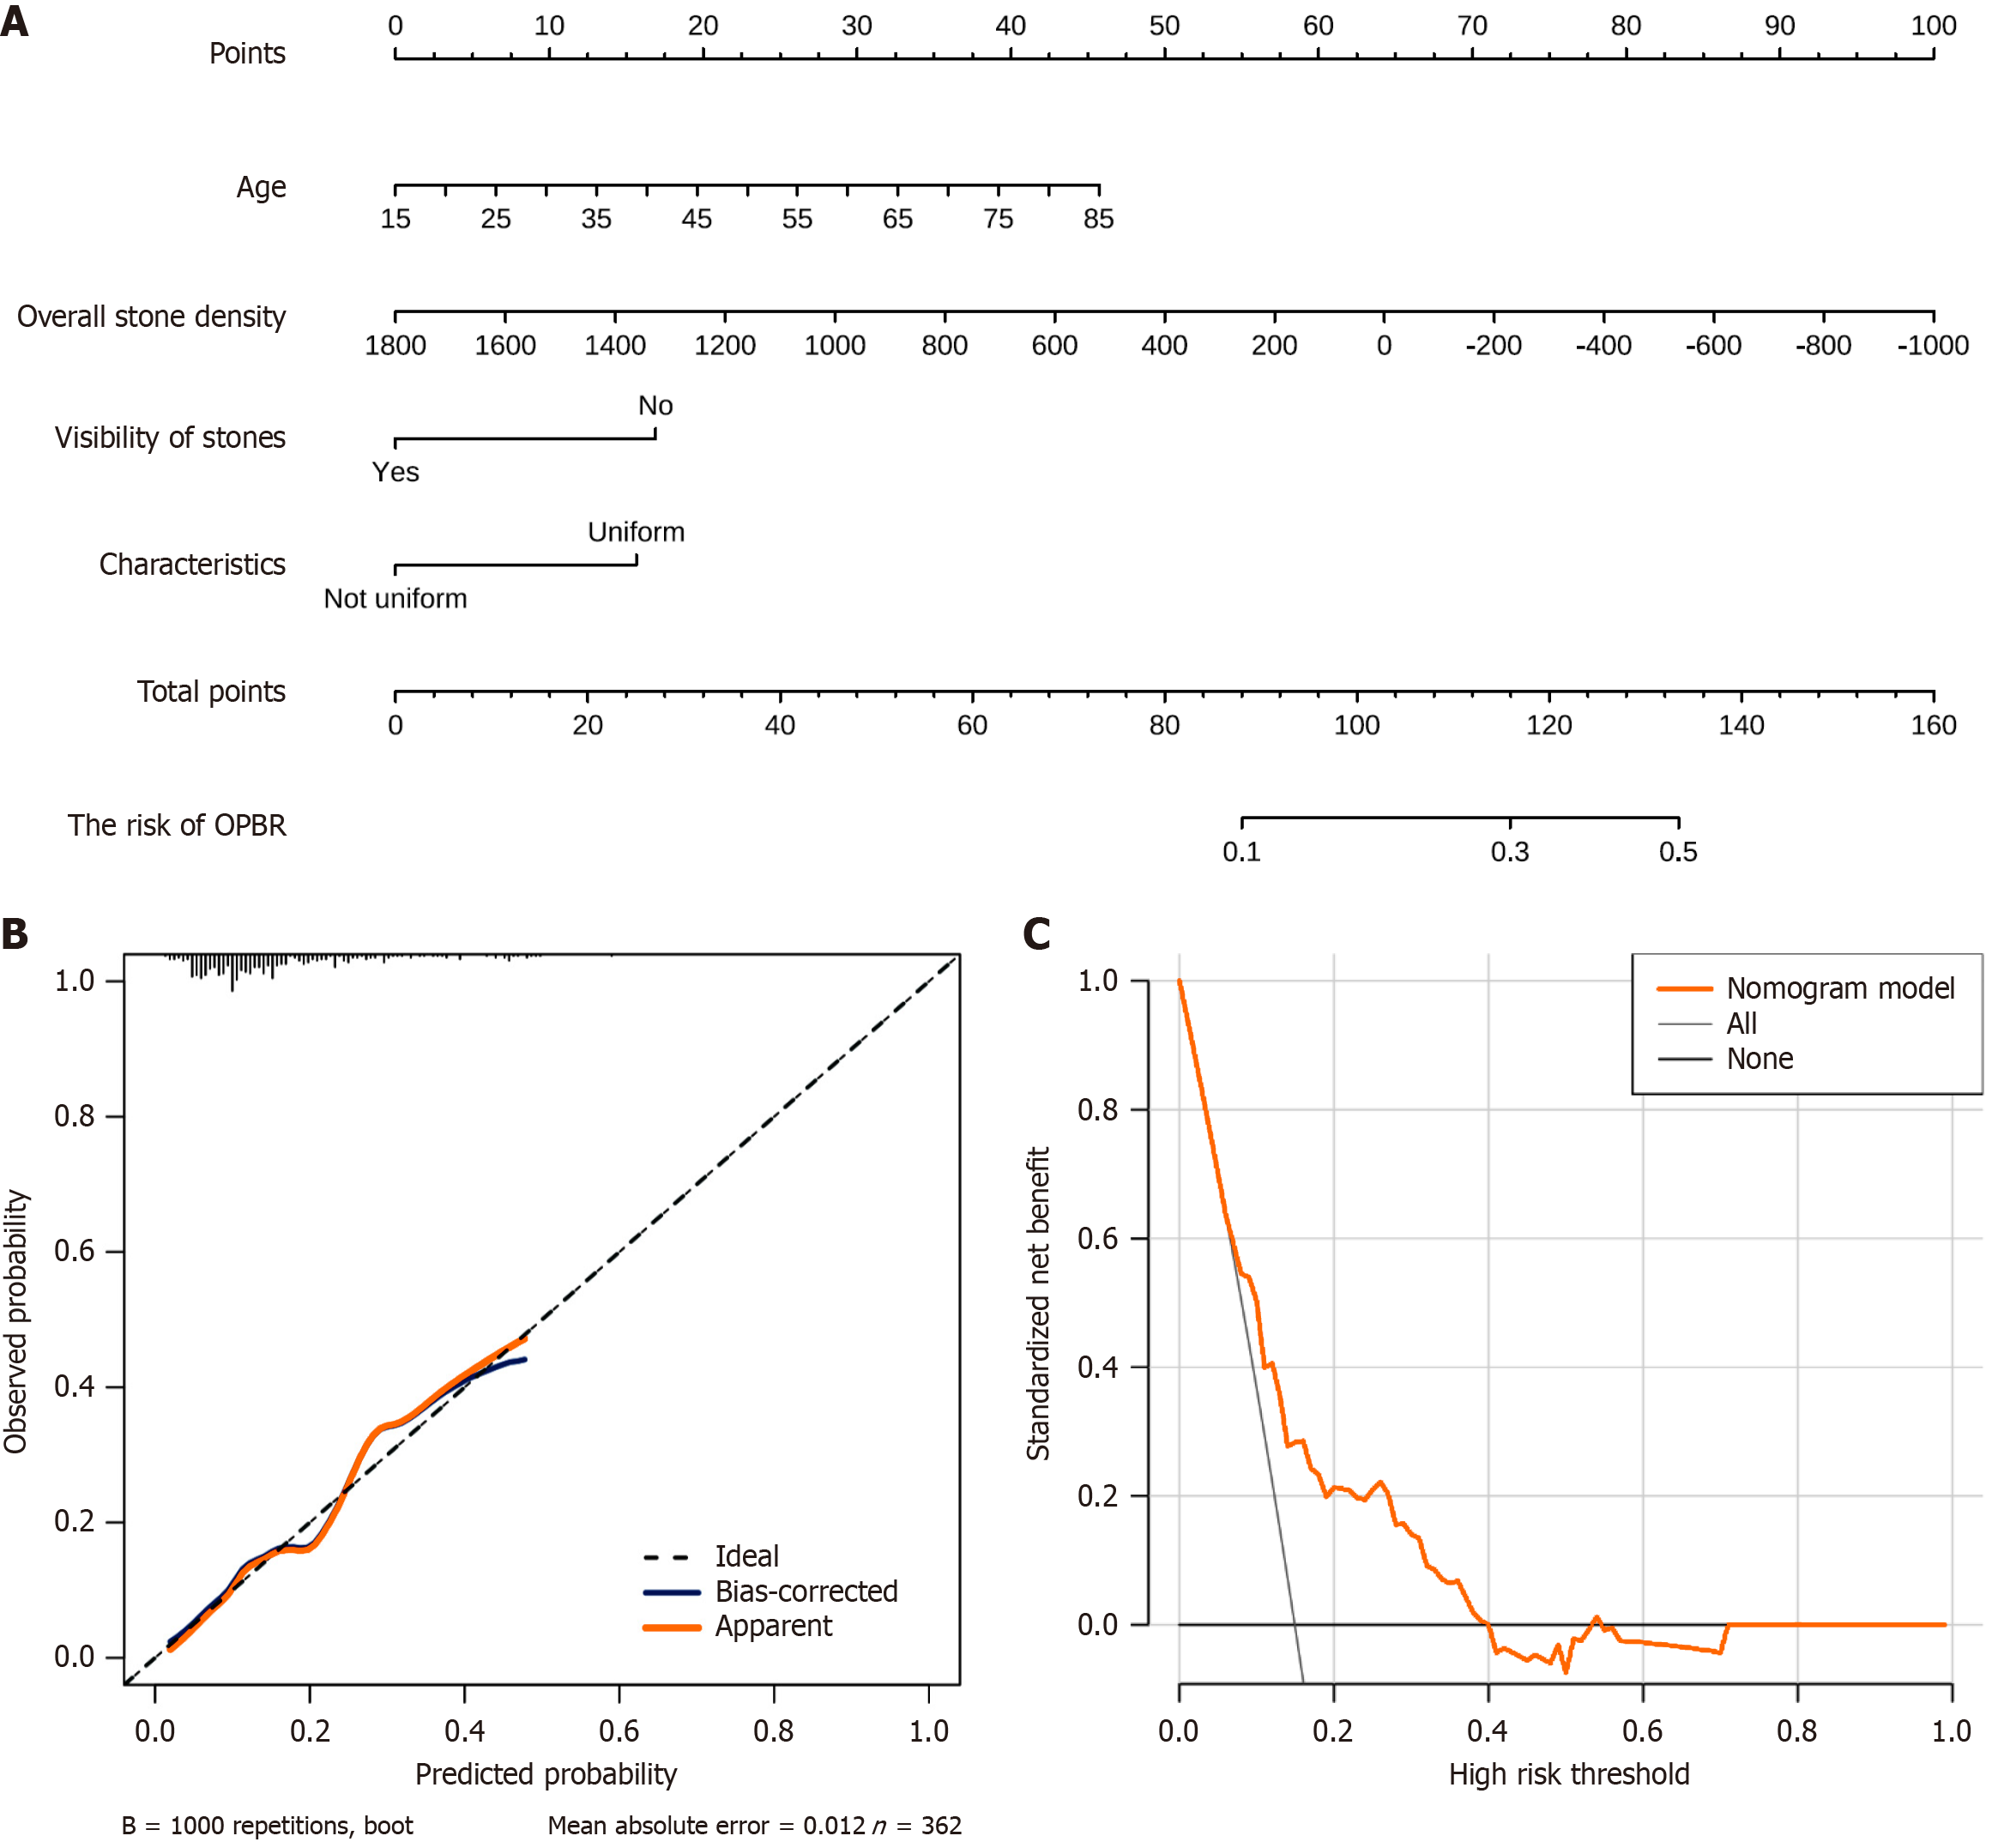
Figure 6 Nomogram-based prediction model for occult pancreaticobiliary reflux.
A: Risk nomogram for predicting occult pancreaticobiliary reflux (OPBR); B: OPBR prediction model performance evaluation: Calibration curve; C: Clinical decision curve for risk assessment.
- Citation: Qiu C, Xiang YK, Hu H, Da XB, Li G, Zhang YY, Zhang HL, Zhang C, Yang YL. Characterization of gallbladder stones associated with occult pancreaticobiliary reflux using computed tomography. World J Gastroenterol 2025; 31(12): 100855
- URL: https://www.wjgnet.com/1007-9327/full/v31/i12/100855.htm
- DOI: https://dx.doi.org/10.3748/wjg.v31.i12.100855


