Copyright
©The Author(s) 2025.
World J Gastroenterol. Mar 21, 2025; 31(11): 102795
Published online Mar 21, 2025. doi: 10.3748/wjg.v31.i11.102795
Published online Mar 21, 2025. doi: 10.3748/wjg.v31.i11.102795
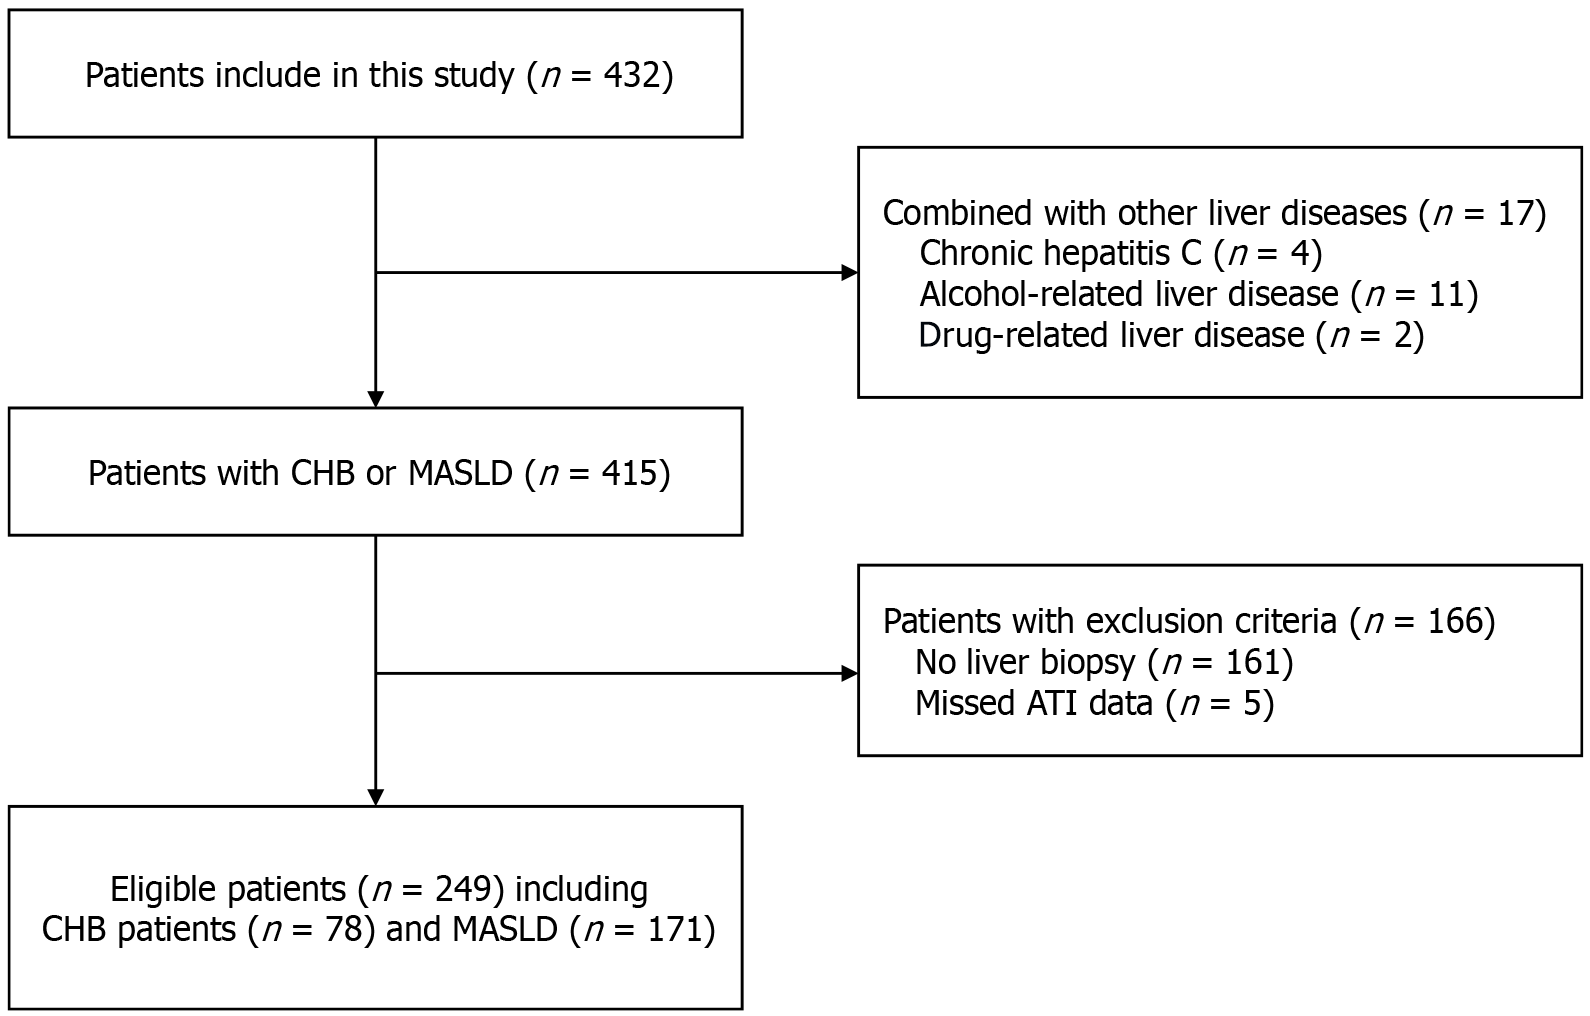
Figure 1 Flowchart illustrating patient selection.
ATI: Attenuation imaging; CHB: Chronic hepatitis B; MASLD: Metabolic dysfunction–associated steatotic liver disease.
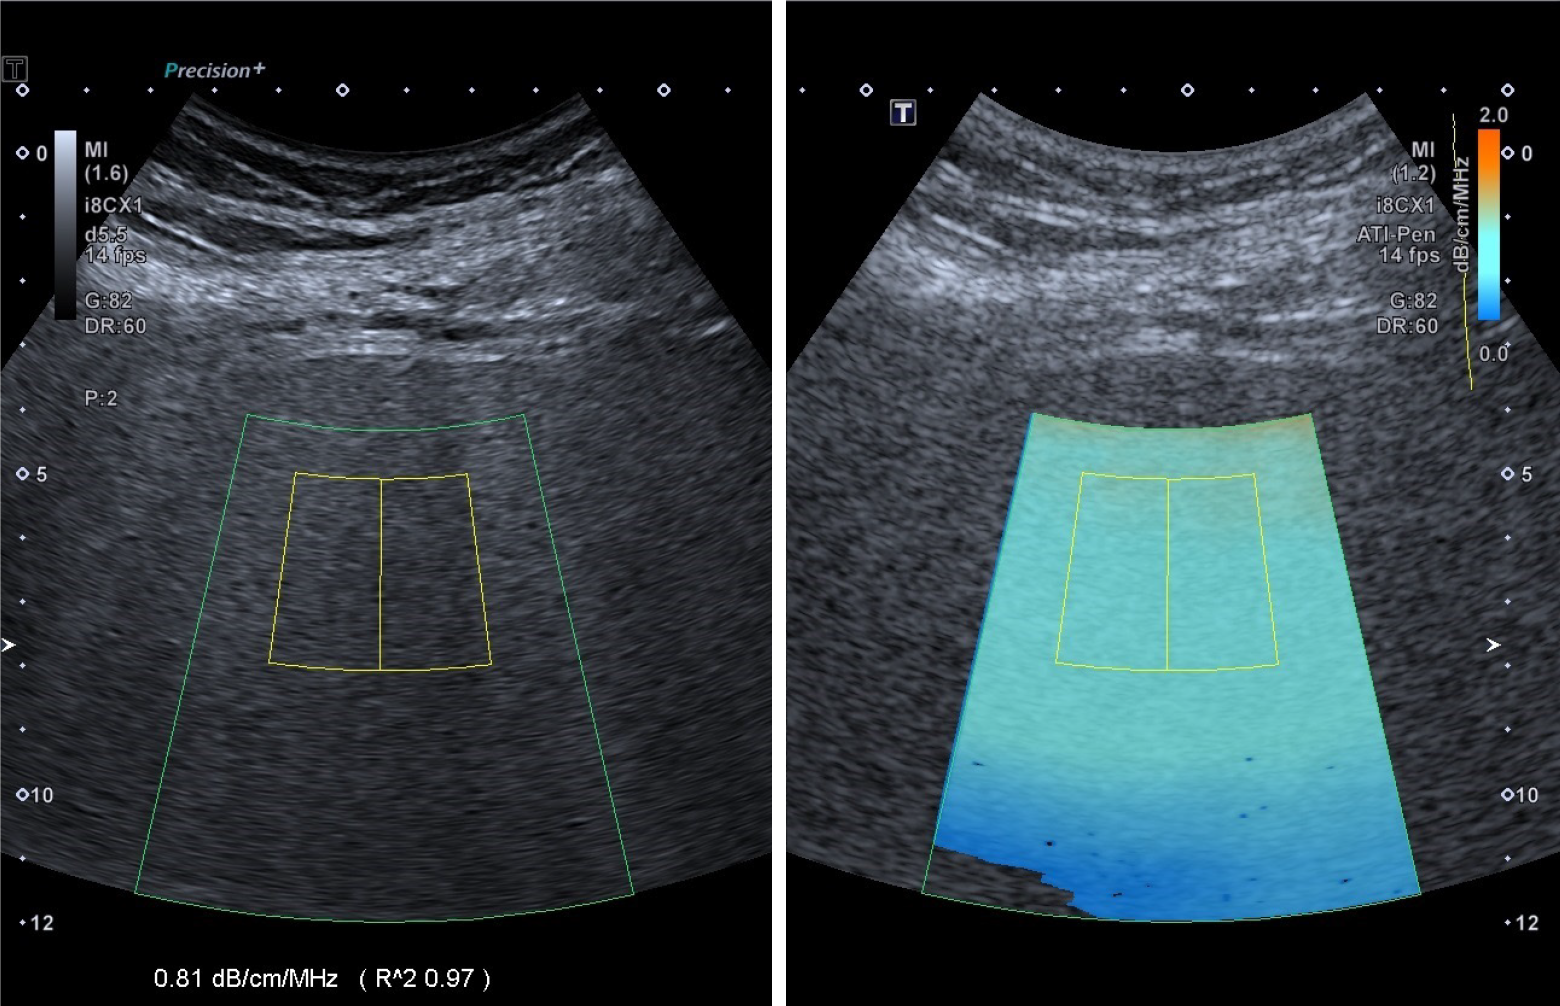
Figure 2 Ultrasound attenuation imaging.
In this case, the attenuation coefficient is 0.81 dB × cm-1 × MHz-1, with R2 of 0.97 as an effective value.
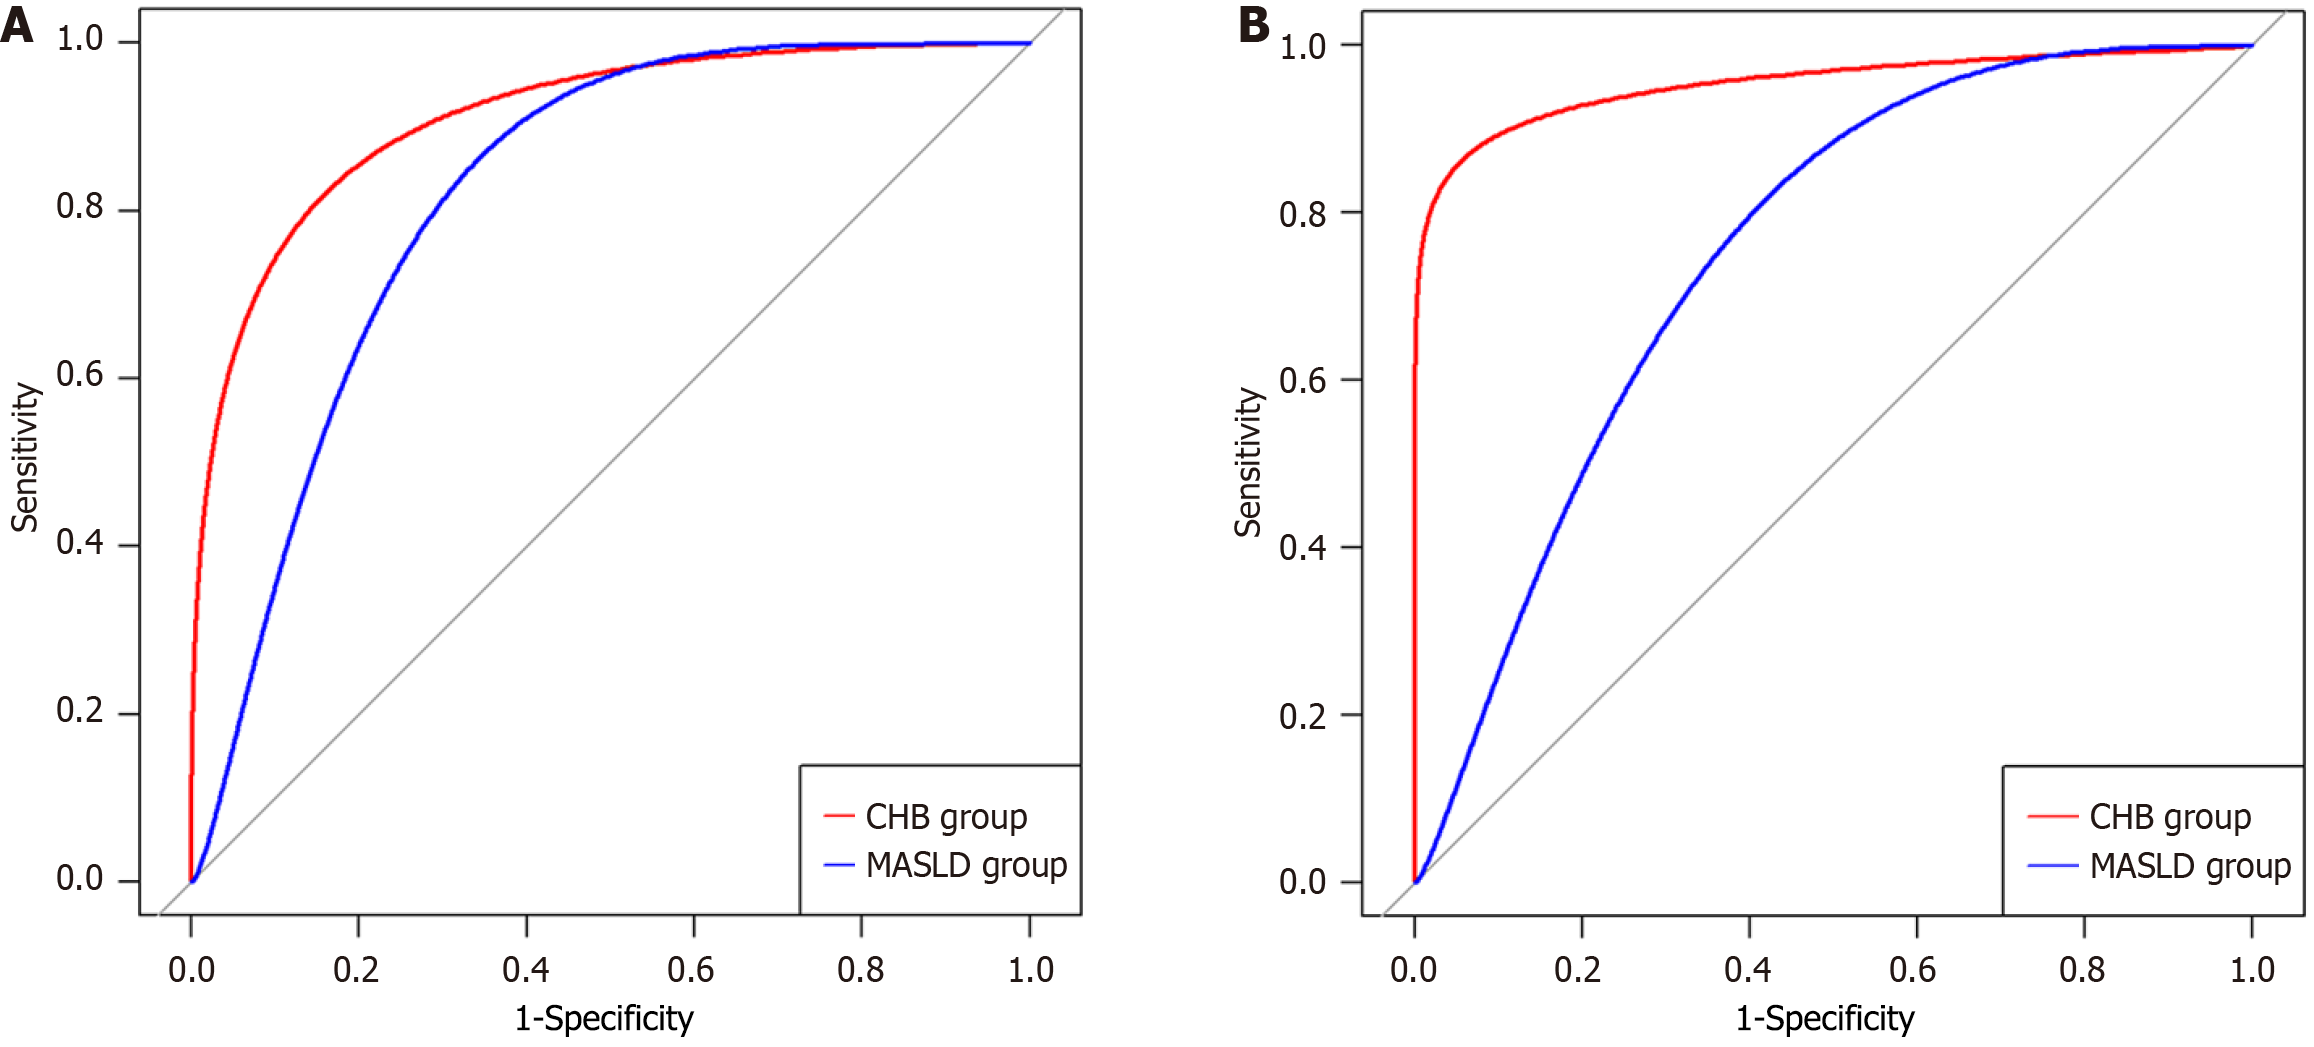
Figure 3 Receiver operating characteristic curves of the attenuation coefficient for detecting different grades of liver steatosis.
A: Liver steatosis grade S1 or higher; B: Liver steatosis grade S2 or higher. CHB: Chronic hepatitis B; MASLD: Metabolic dysfunction–associated steatotic liver disease.
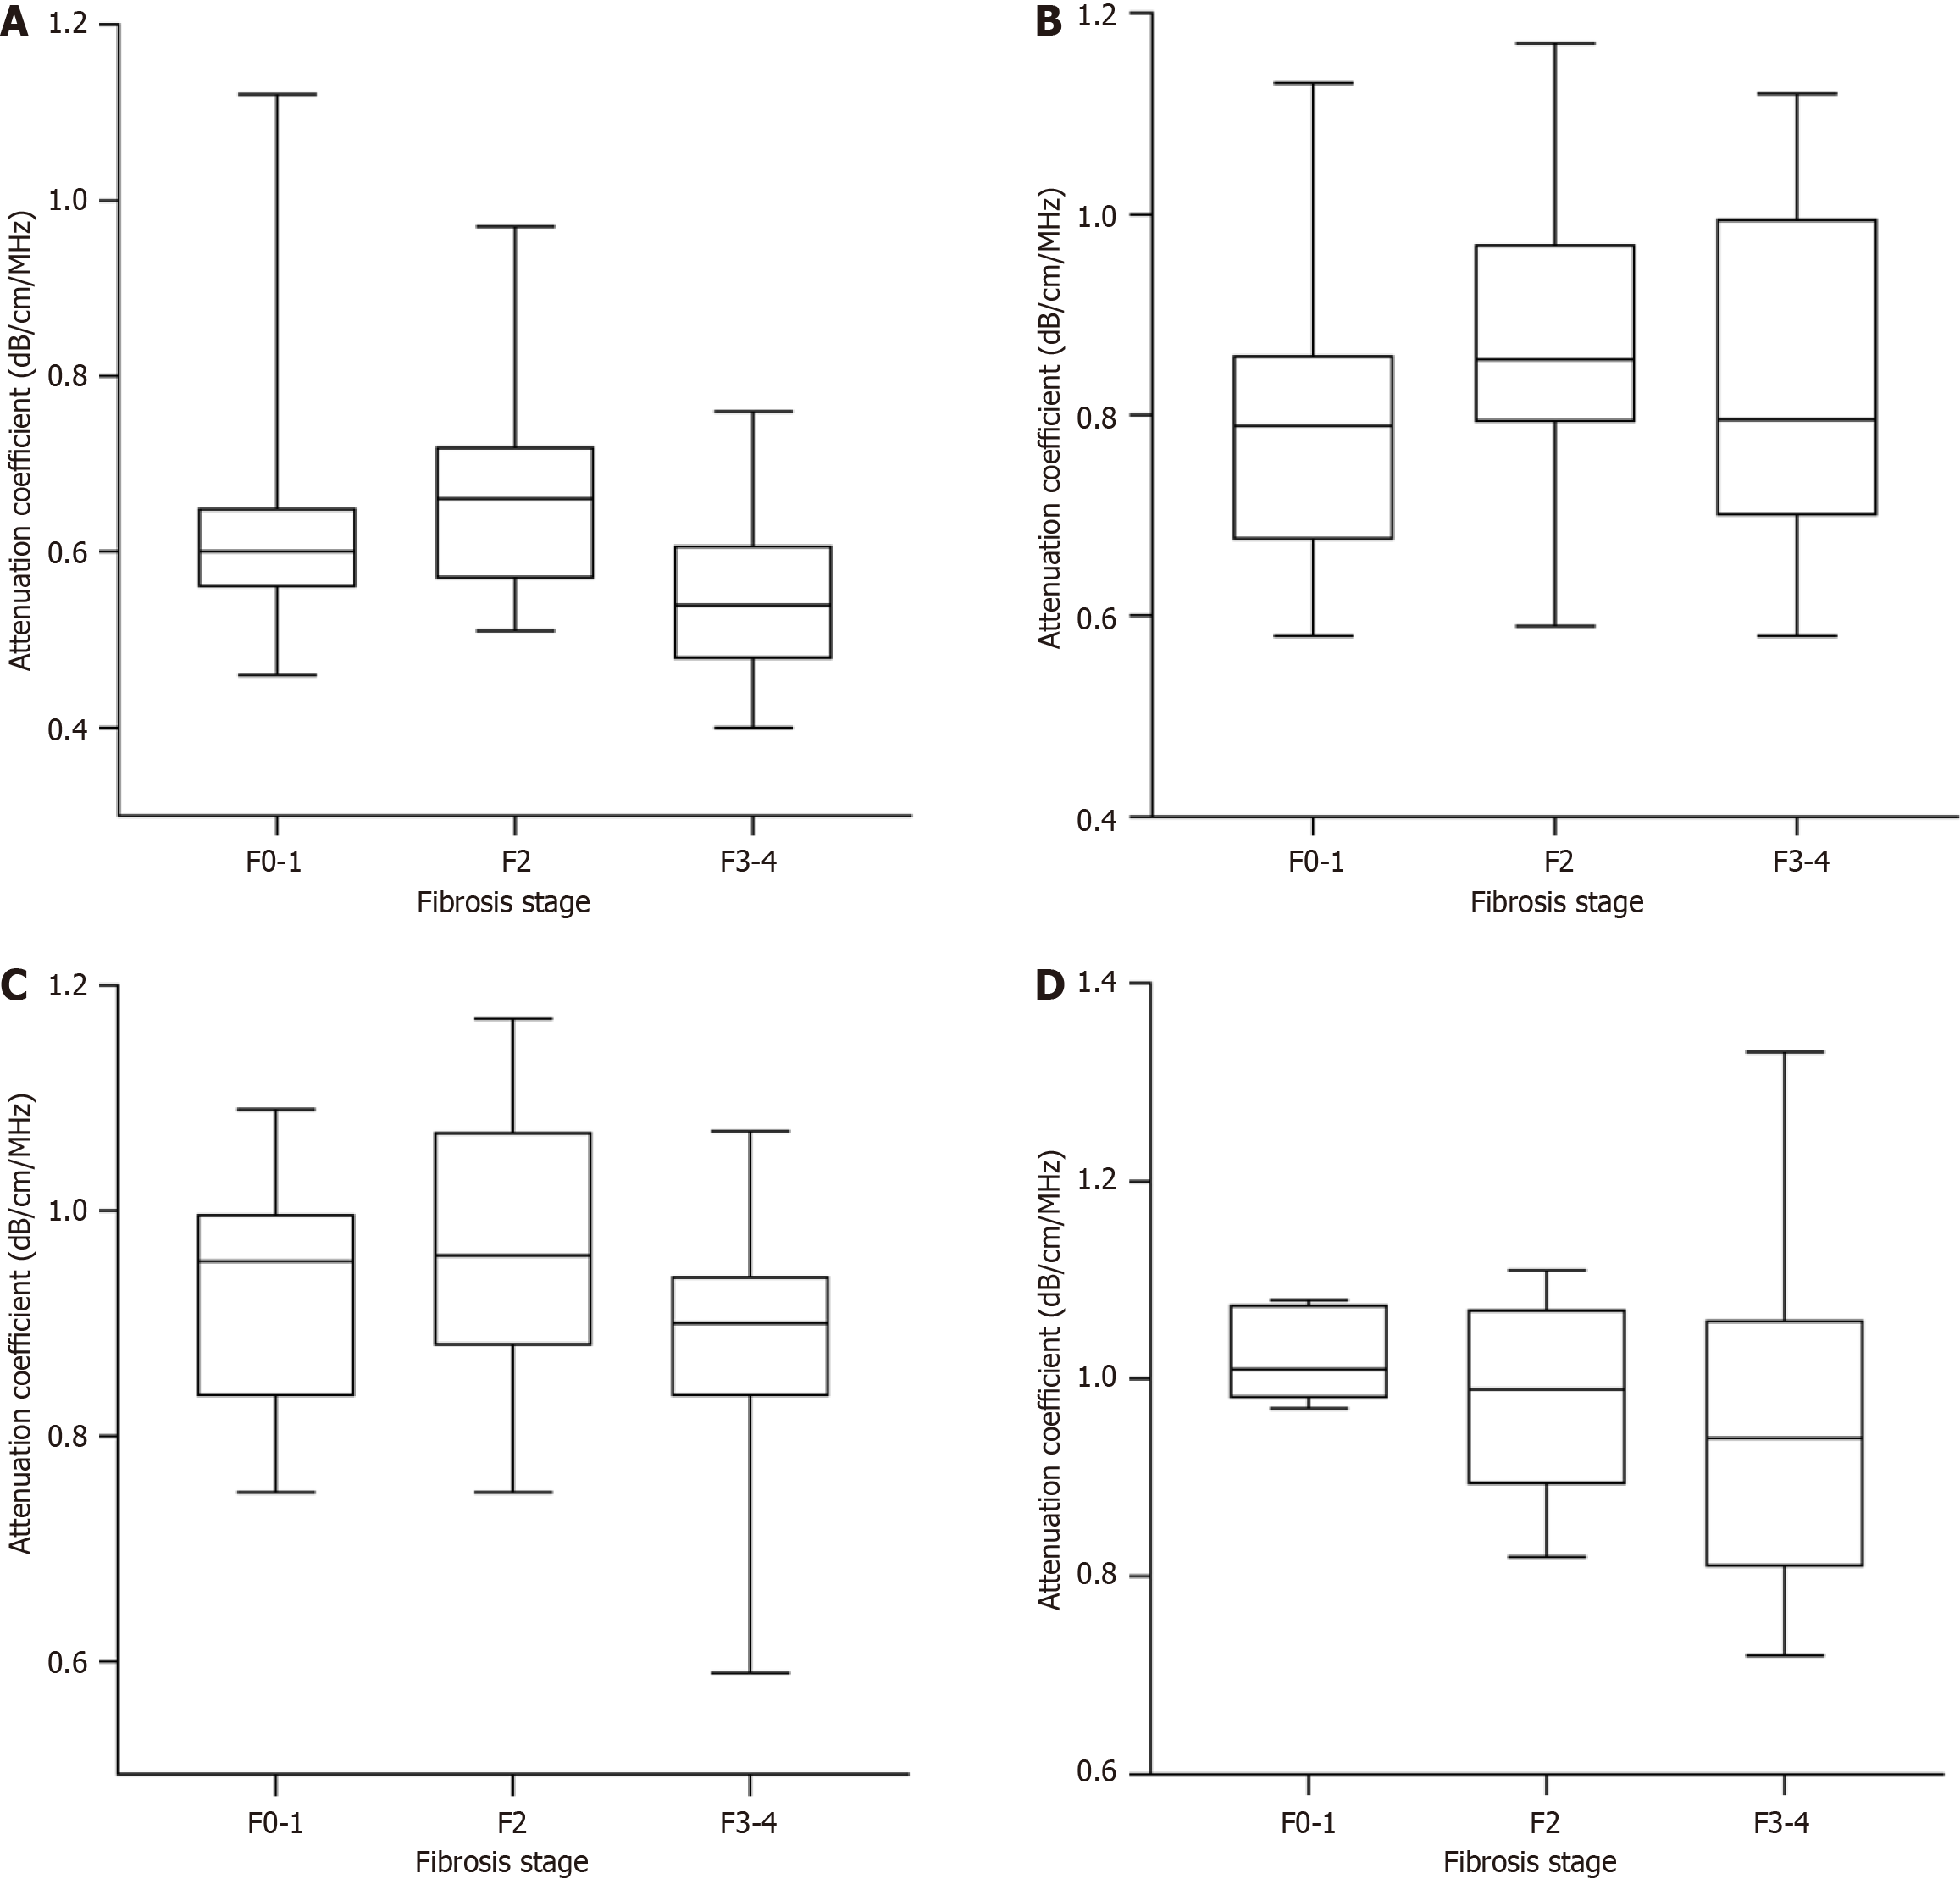
Figure 4 Box plot graphs illustrating the distribution of attenuation coefficient with different fibrosis stages within each steatosis grade.
A: Liver steatosis grade S0; B: Liver steatosis grade S1; C: Liver steatosis grade S2; D: Liver steatosis grade S3. Boxes represent the 25th and 75th percentiles and outlier dots.
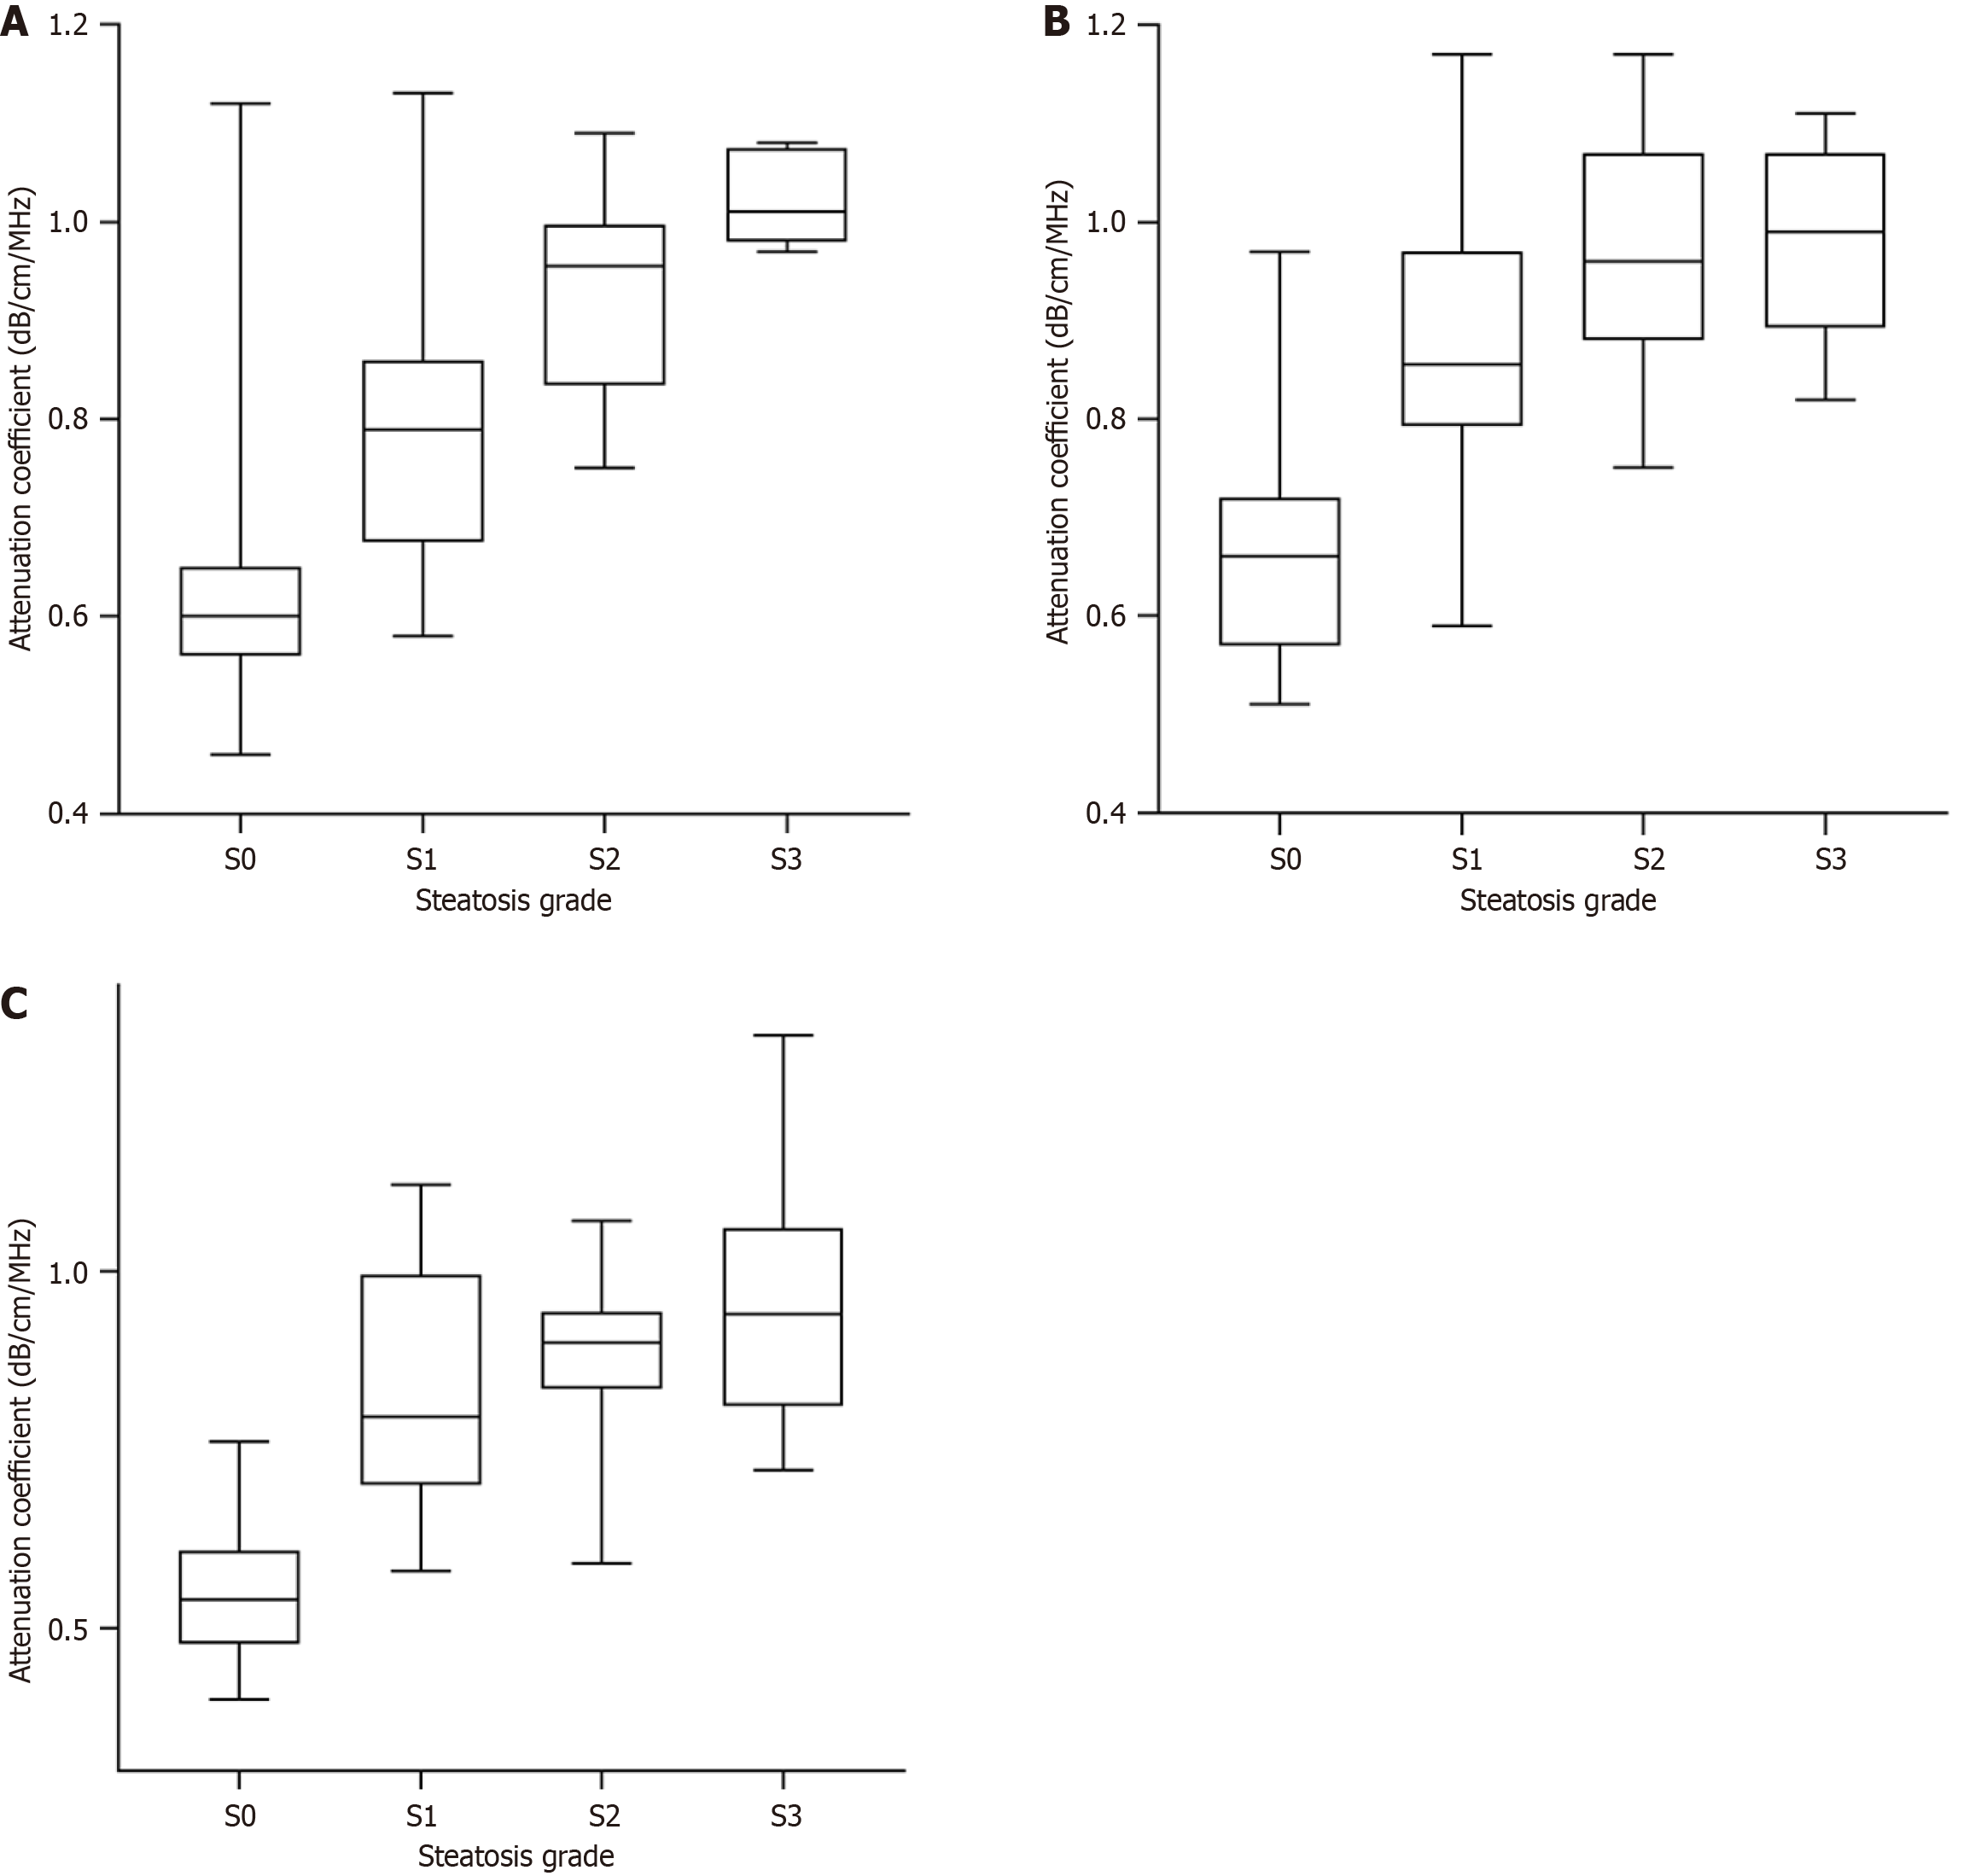
Figure 5 Box plot graphs illustrating the distribution of attenuation coefficient with different steatosis grades within each fibrosis stage.
A: Fibrosis stage F0 and F1; B: Fibrosis stage F2; C: Fibrosis stage F3 and F4. Boxes represent the 25th and 75th percentiles and outlier dots.
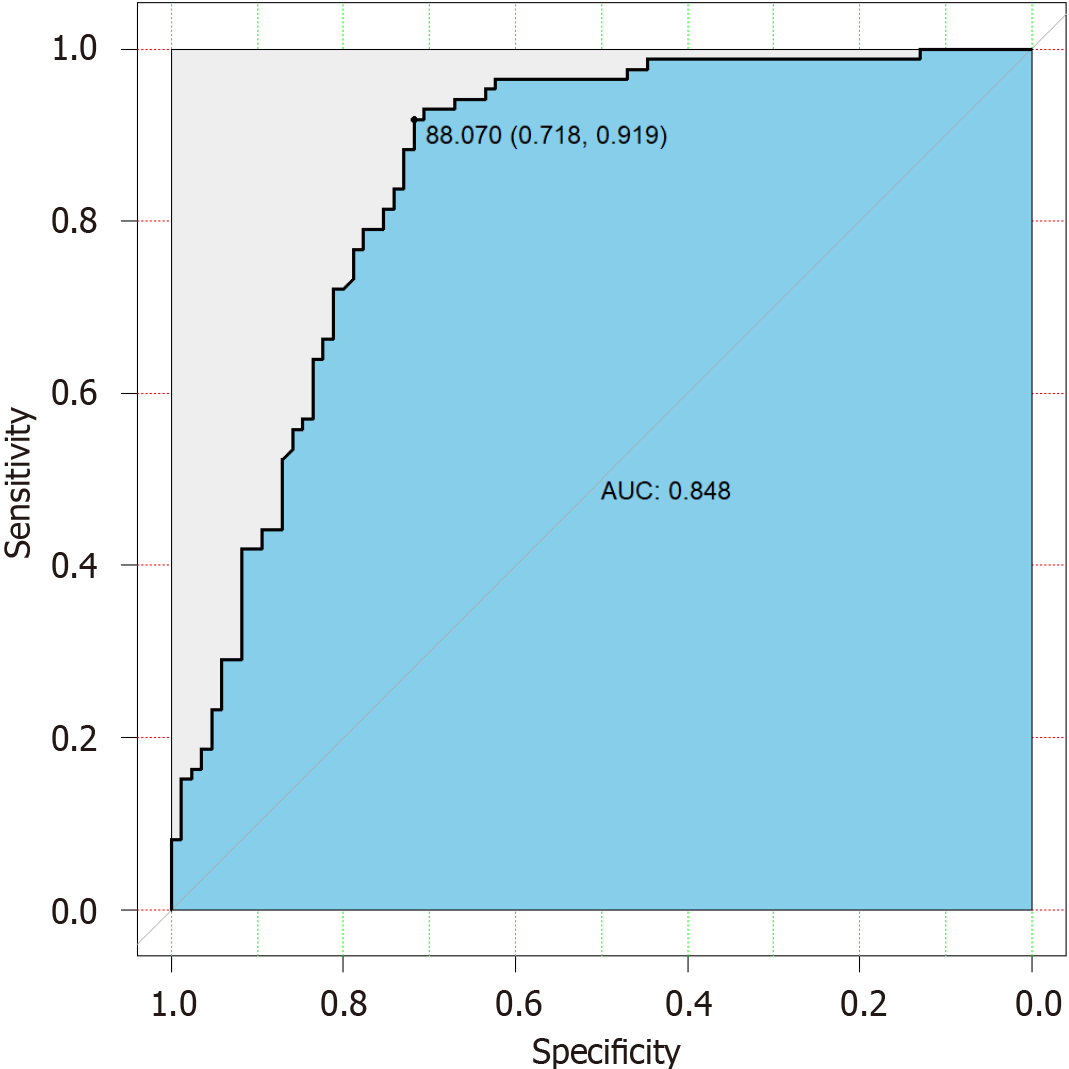
Figure 6 Receiver operating characteristic curves of the attenuation coefficient of clinical model predicted steatosis ≥ S2 in the metabolic dysfunction-associated steatotic liver disease group.
AUC: Area under the curve.
- Citation: Li XQ, Cheng GW, Akiyama I, Huang XJ, Liang J, Xue LY, Cheng Y, Kudo M, Ding H. Attenuation imaging for hepatic steatosis in chronic hepatitis B vs metabolic dysfunction-associated steatotic liver disease. World J Gastroenterol 2025; 31(11): 102795
- URL: https://www.wjgnet.com/1007-9327/full/v31/i11/102795.htm
- DOI: https://dx.doi.org/10.3748/wjg.v31.i11.102795


