Copyright
©The Author(s) 2025.
World J Gastroenterol. Mar 21, 2025; 31(11): 102387
Published online Mar 21, 2025. doi: 10.3748/wjg.v31.i11.102387
Published online Mar 21, 2025. doi: 10.3748/wjg.v31.i11.102387
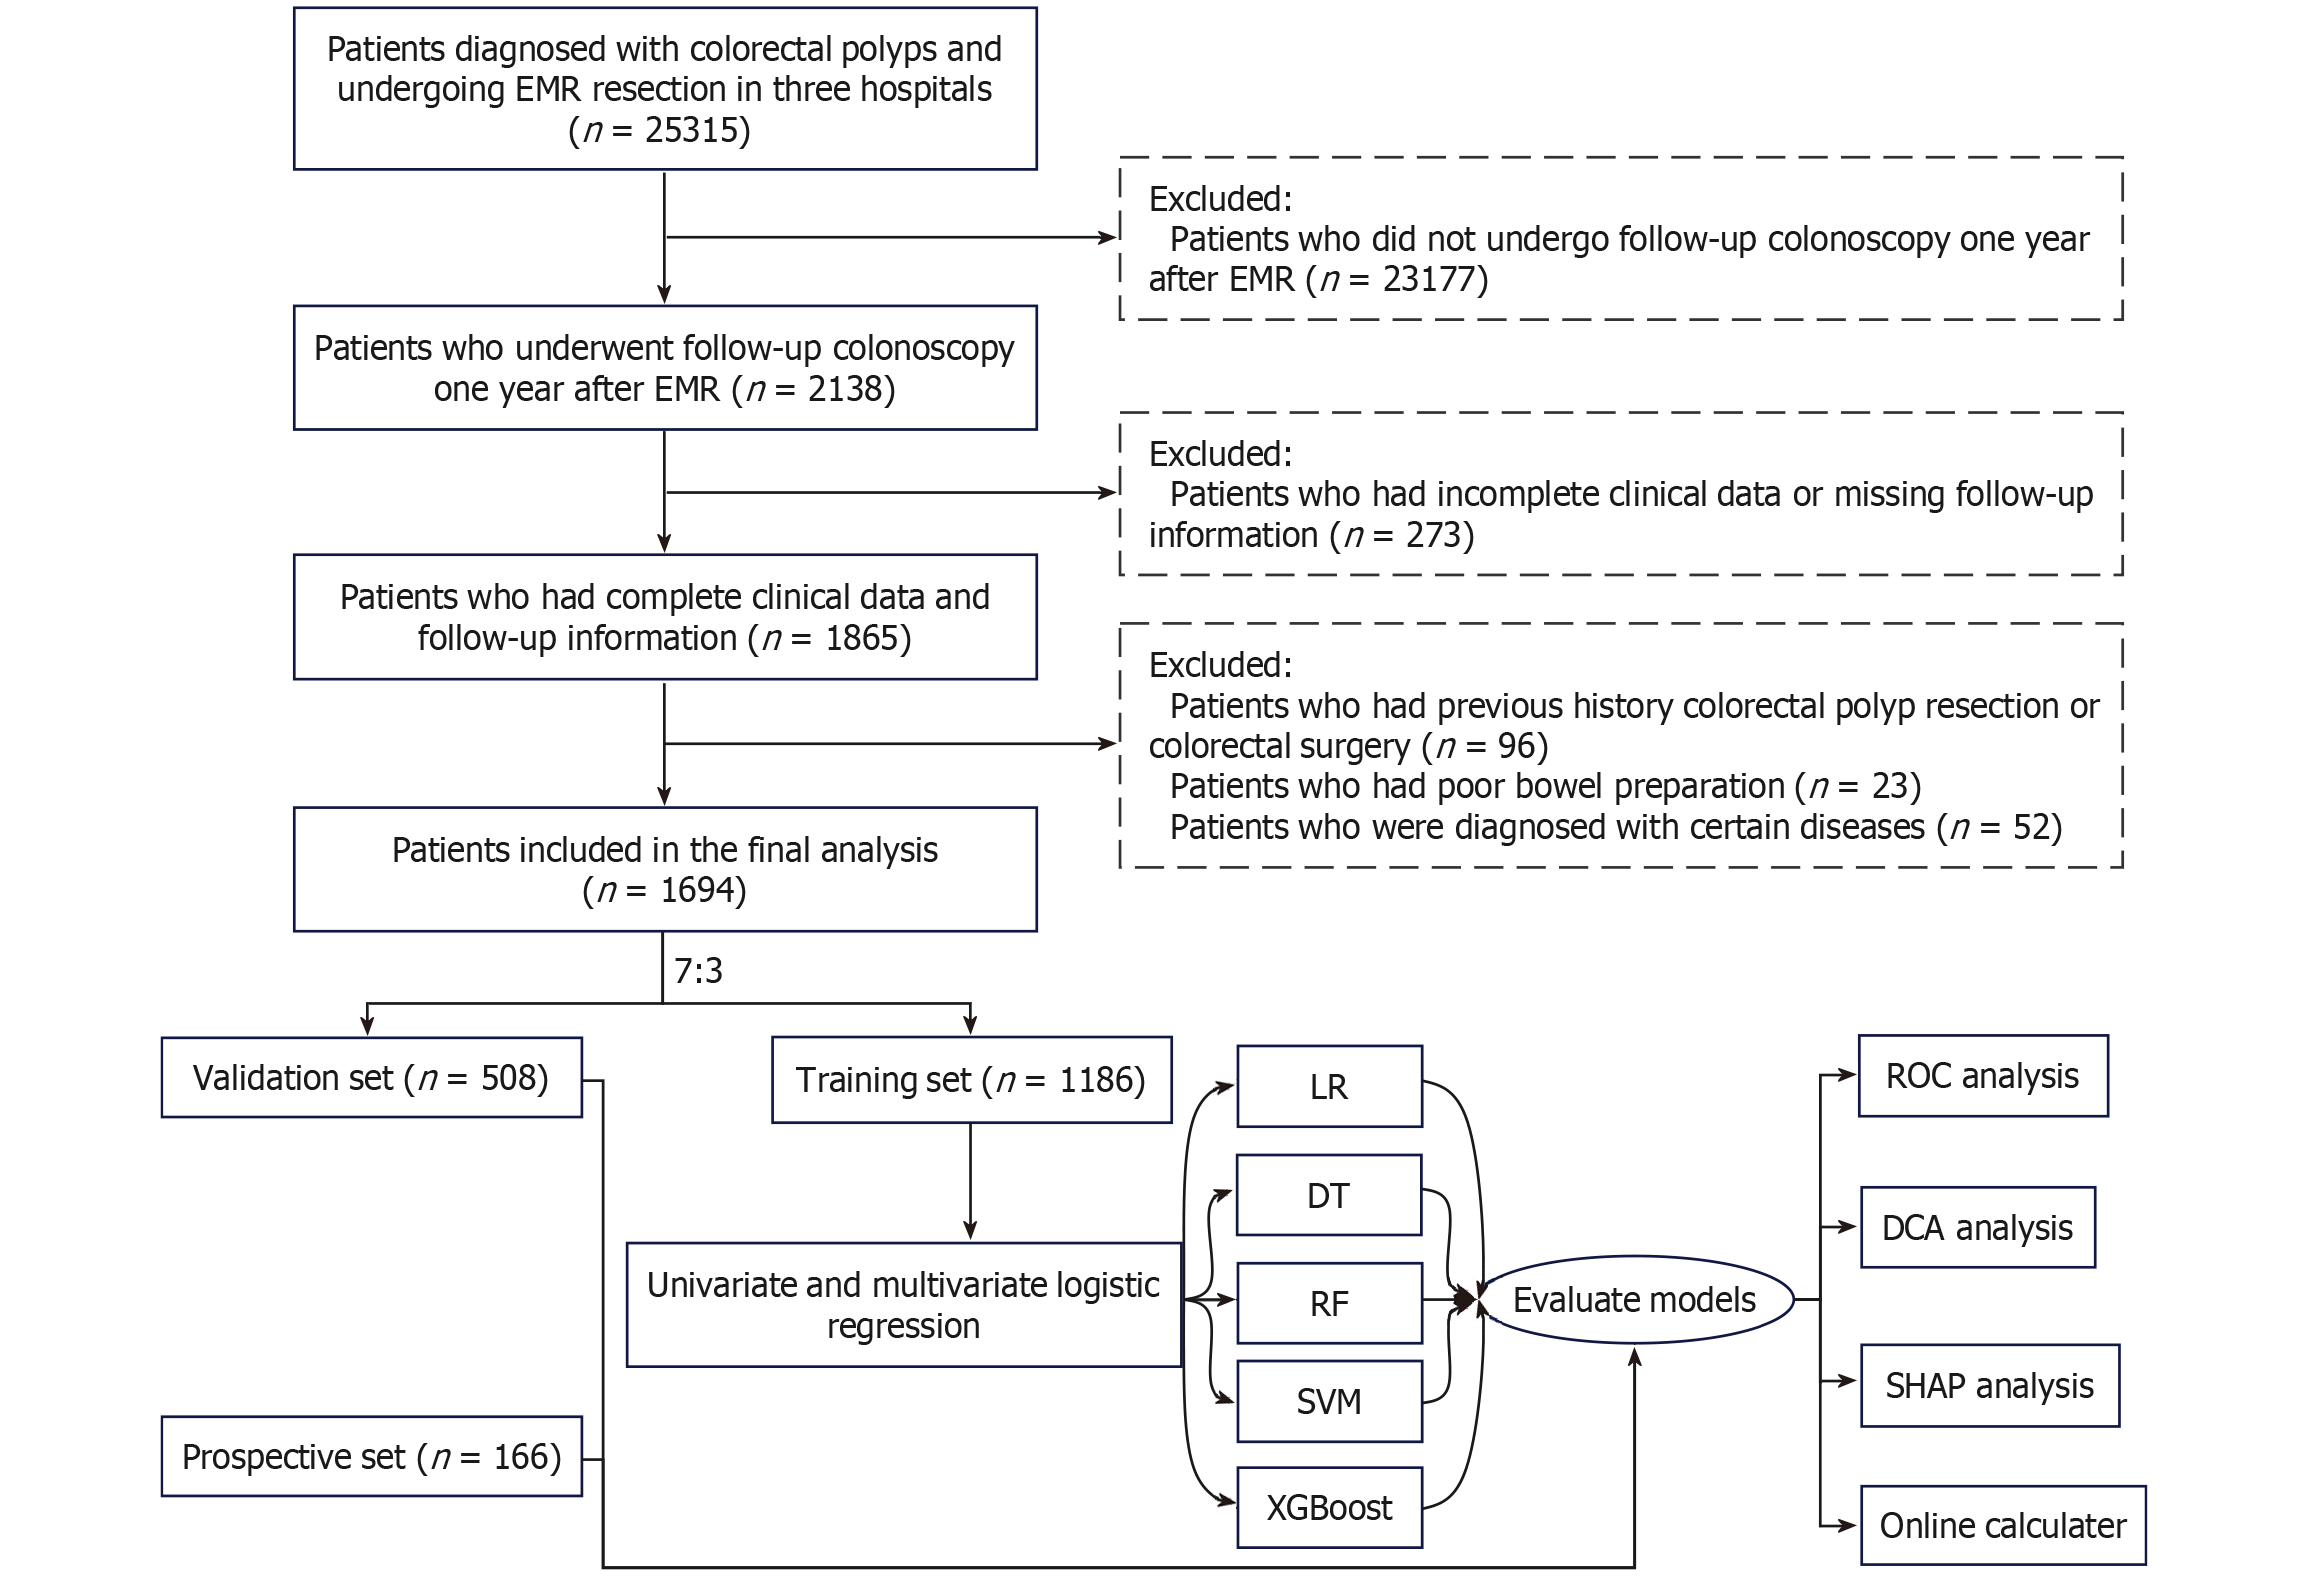
Figure 1 Flowchart of study design route.
EMR: Endoscopic mucosal resection; LR: Logistic Regression; DT: Decision Trees; RF: Random Forest; SVM: Support Vector Machine; XGBoost: EXtreme Gradient Boosting; ROC: Receiver operating characteristic; DCA: Decision curve analysis; SHAP: SHapley Additive exPlanations.
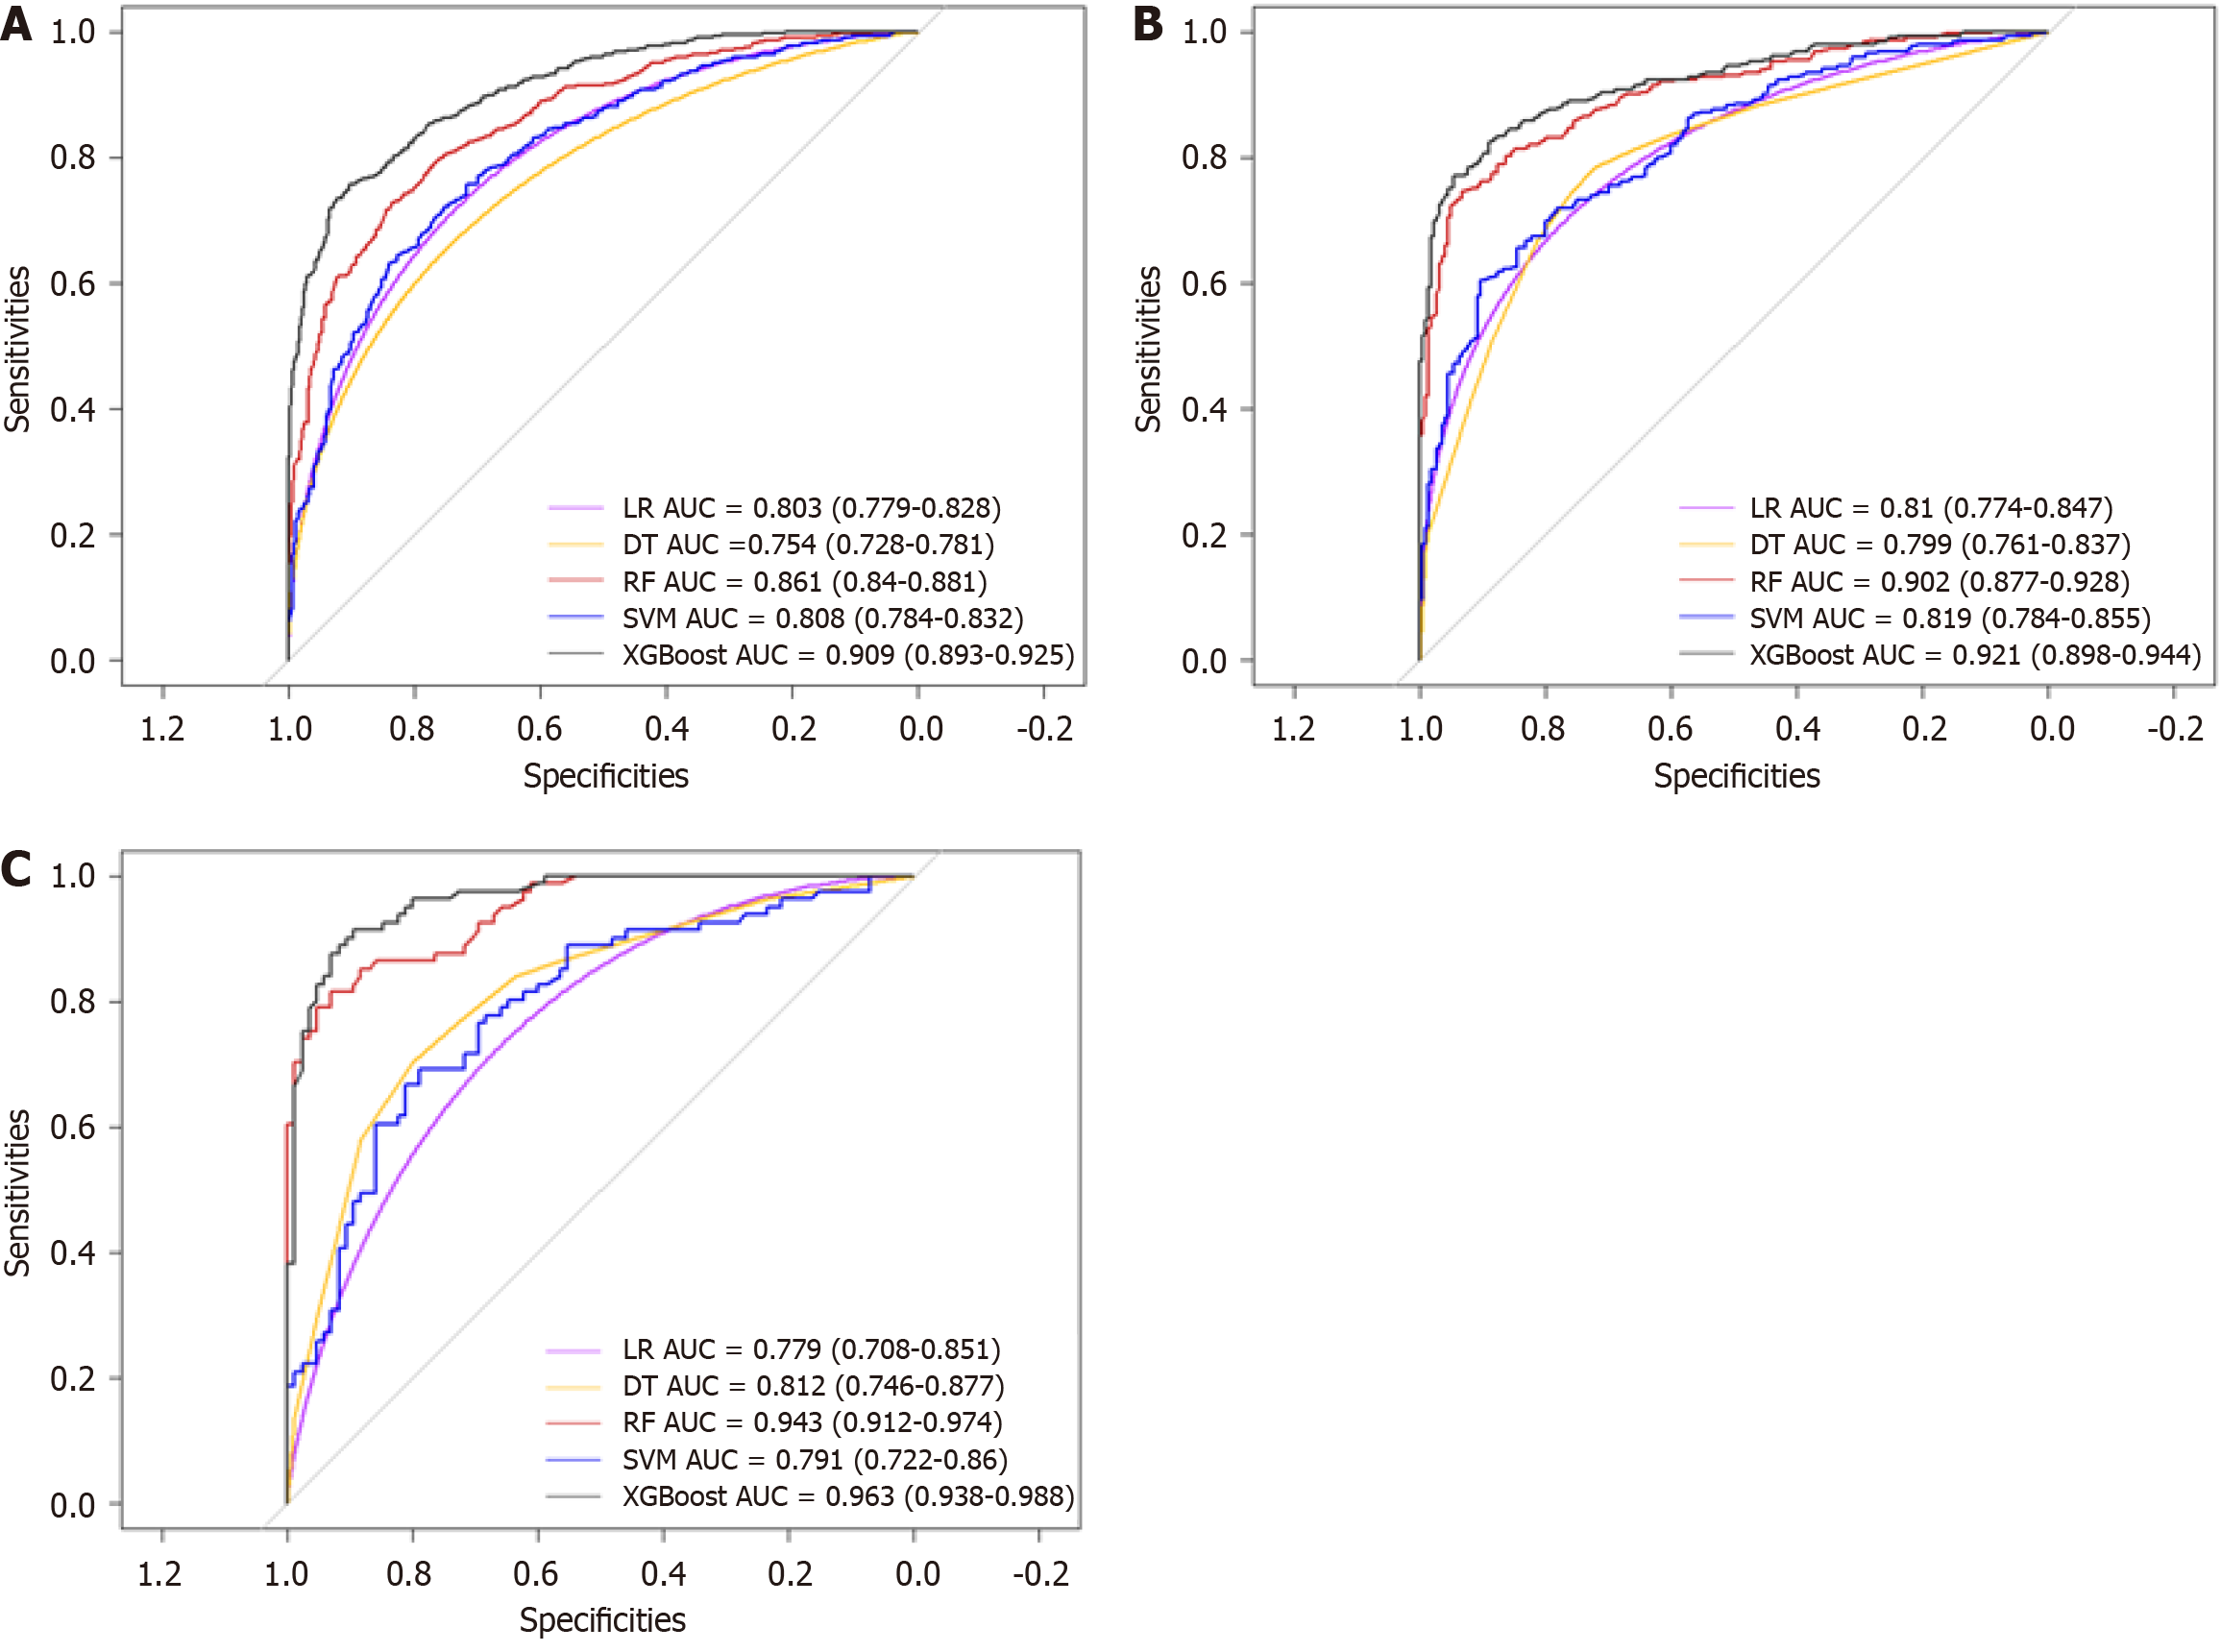
Figure 2 Receiver operating characteristic curves of different models across various datasets.
A: Training set; B: Validation set; C: Prospective set. LR: Logistic Regression; DT: Decision Trees; RF: Random Forest; SVM: Support Vector Machine; XGBoost: EXtreme Gradient Boosting; AUC: Area under the curve.
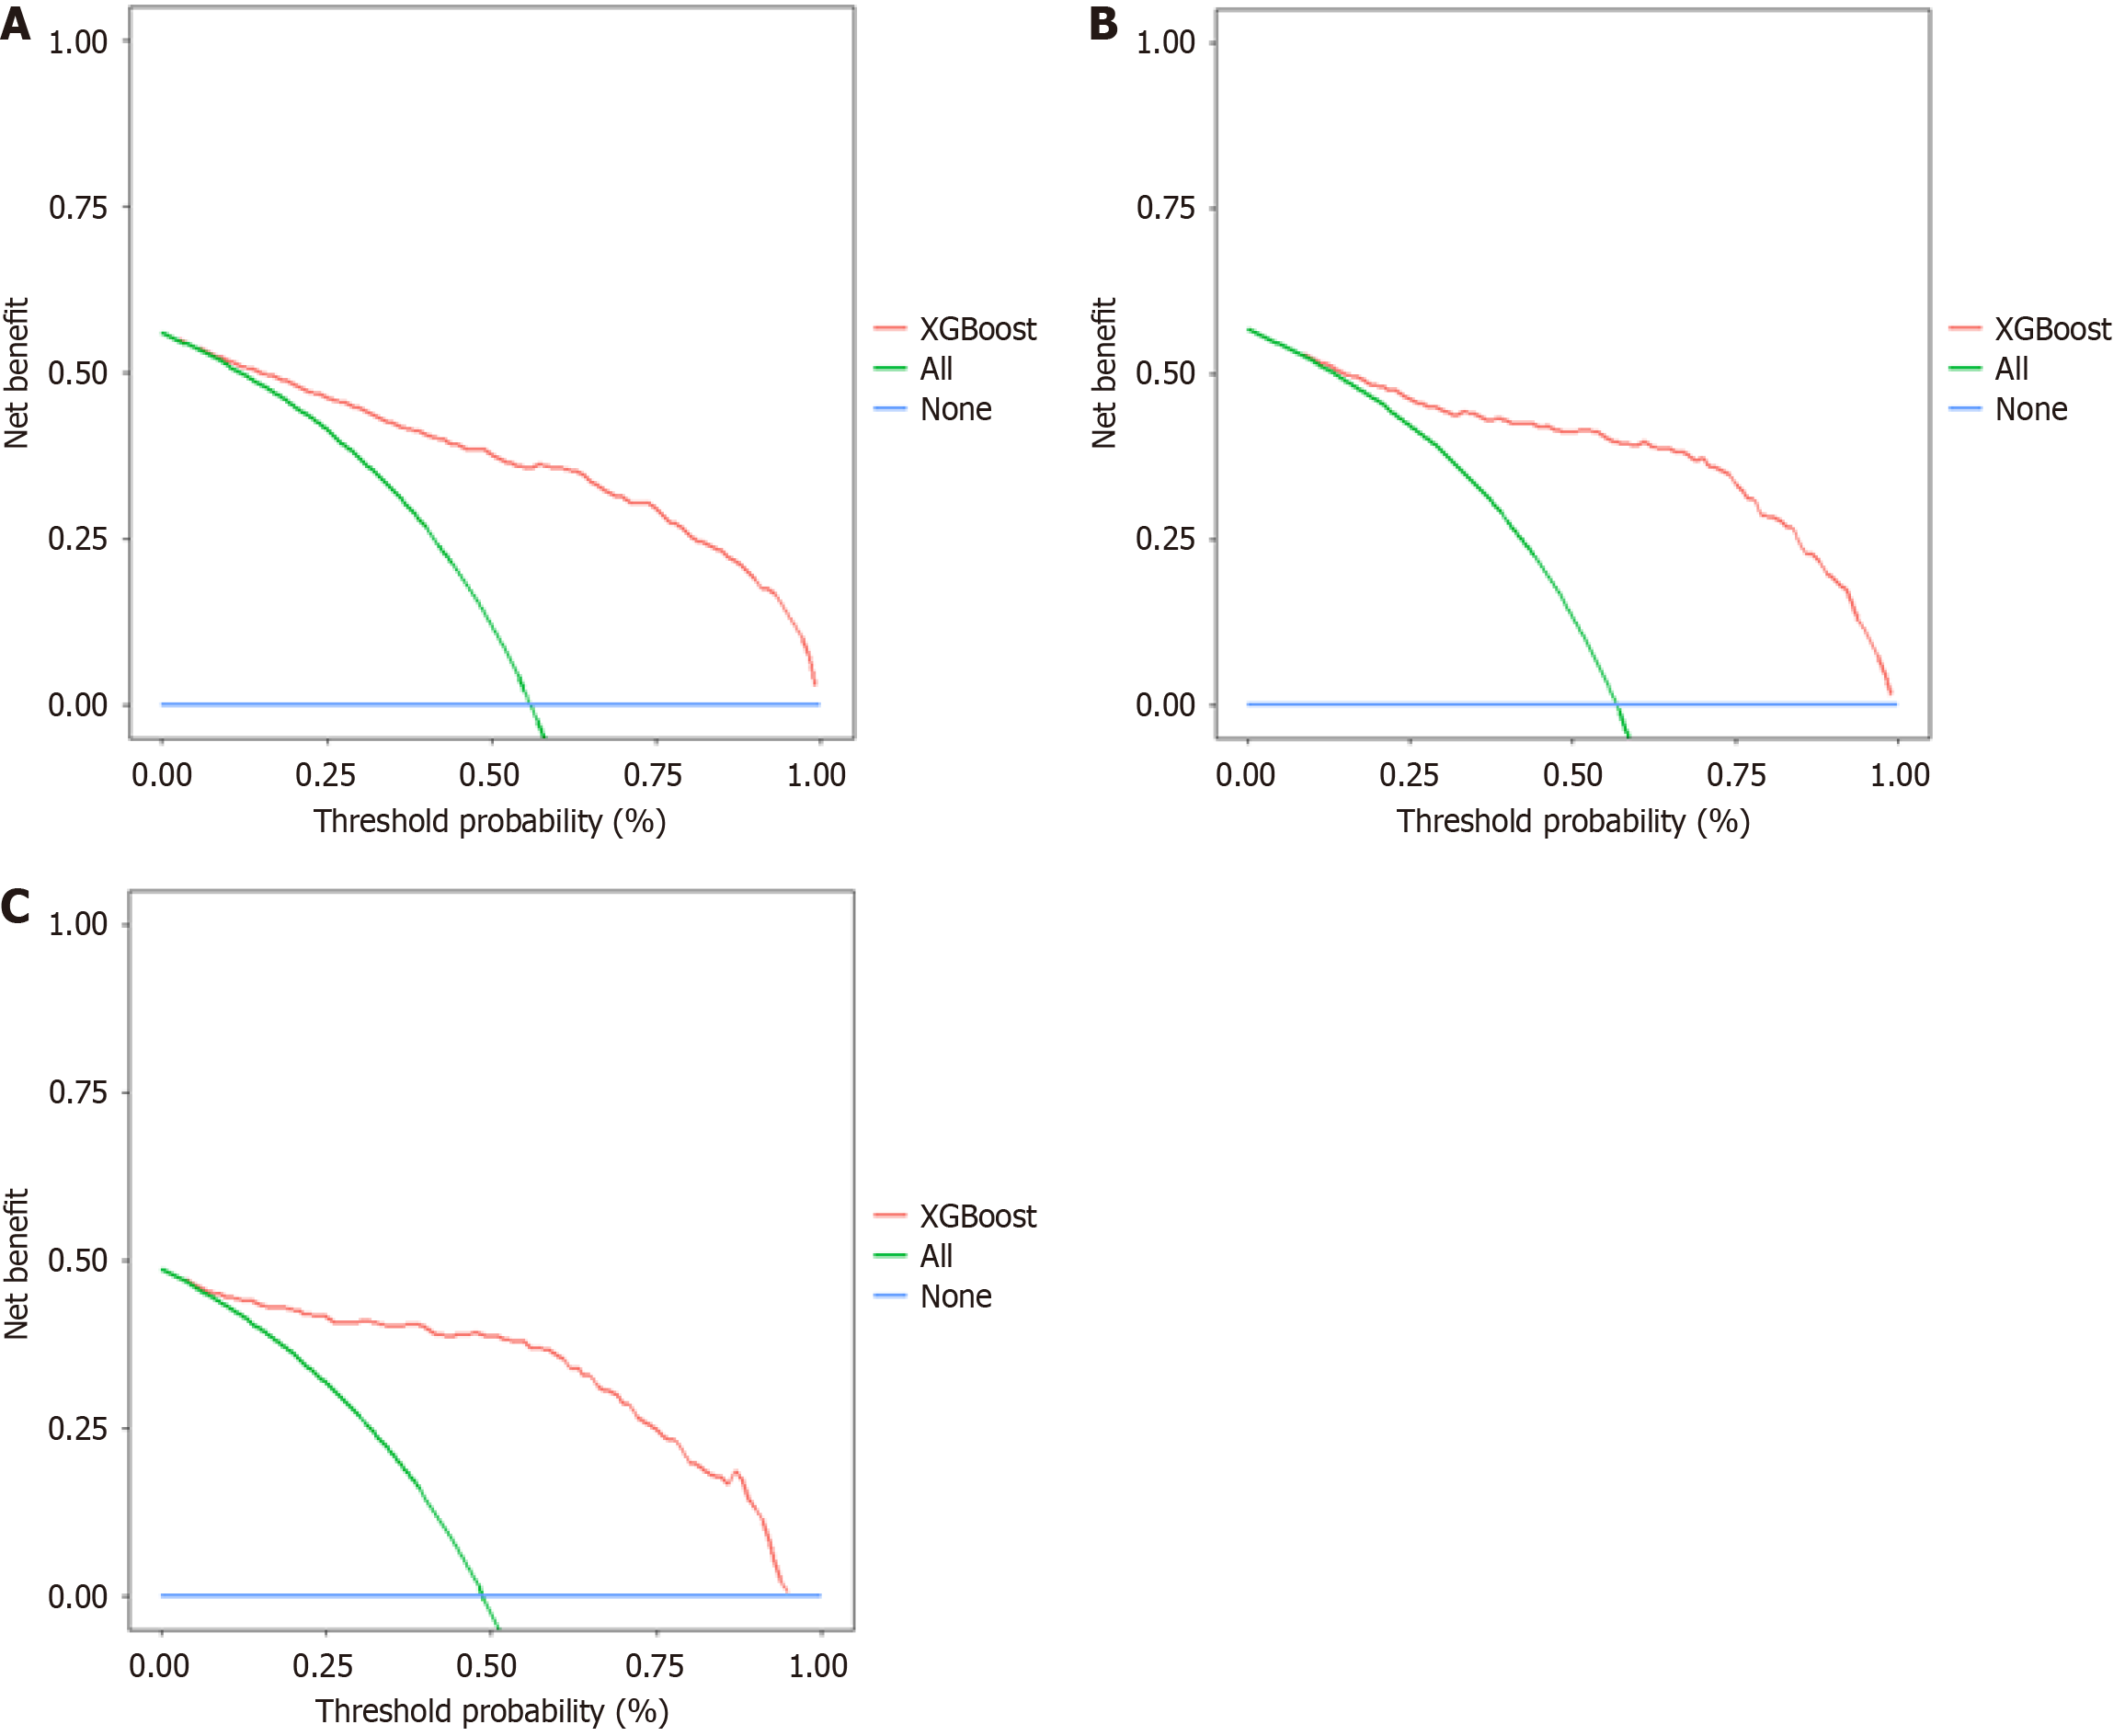
Figure 3 Decision curves of the eXtreme Gradient Boosting model across various datasets.
A: Training set; B: Validation set; C: Prospective set. XGBoost: EXtreme Gradient Boosting.
Figure 4 SHapley Additive exPlanations analysis of the XGBoost model.
A: SHapley Additive exPlanations (SHAP) summary bar plot, where features are ranked in descending order according to the mean absolute SHAP value; B: SHAP beeswarm plot, displaying the SHAP value of each feature for every sample in the dataset. Each row represents a feature, and each dot corresponds to a sample. The color of the dots indicates feature values, with yellow representing high values and purple representing low values. SHAP: SHapley Additive exPlanations.
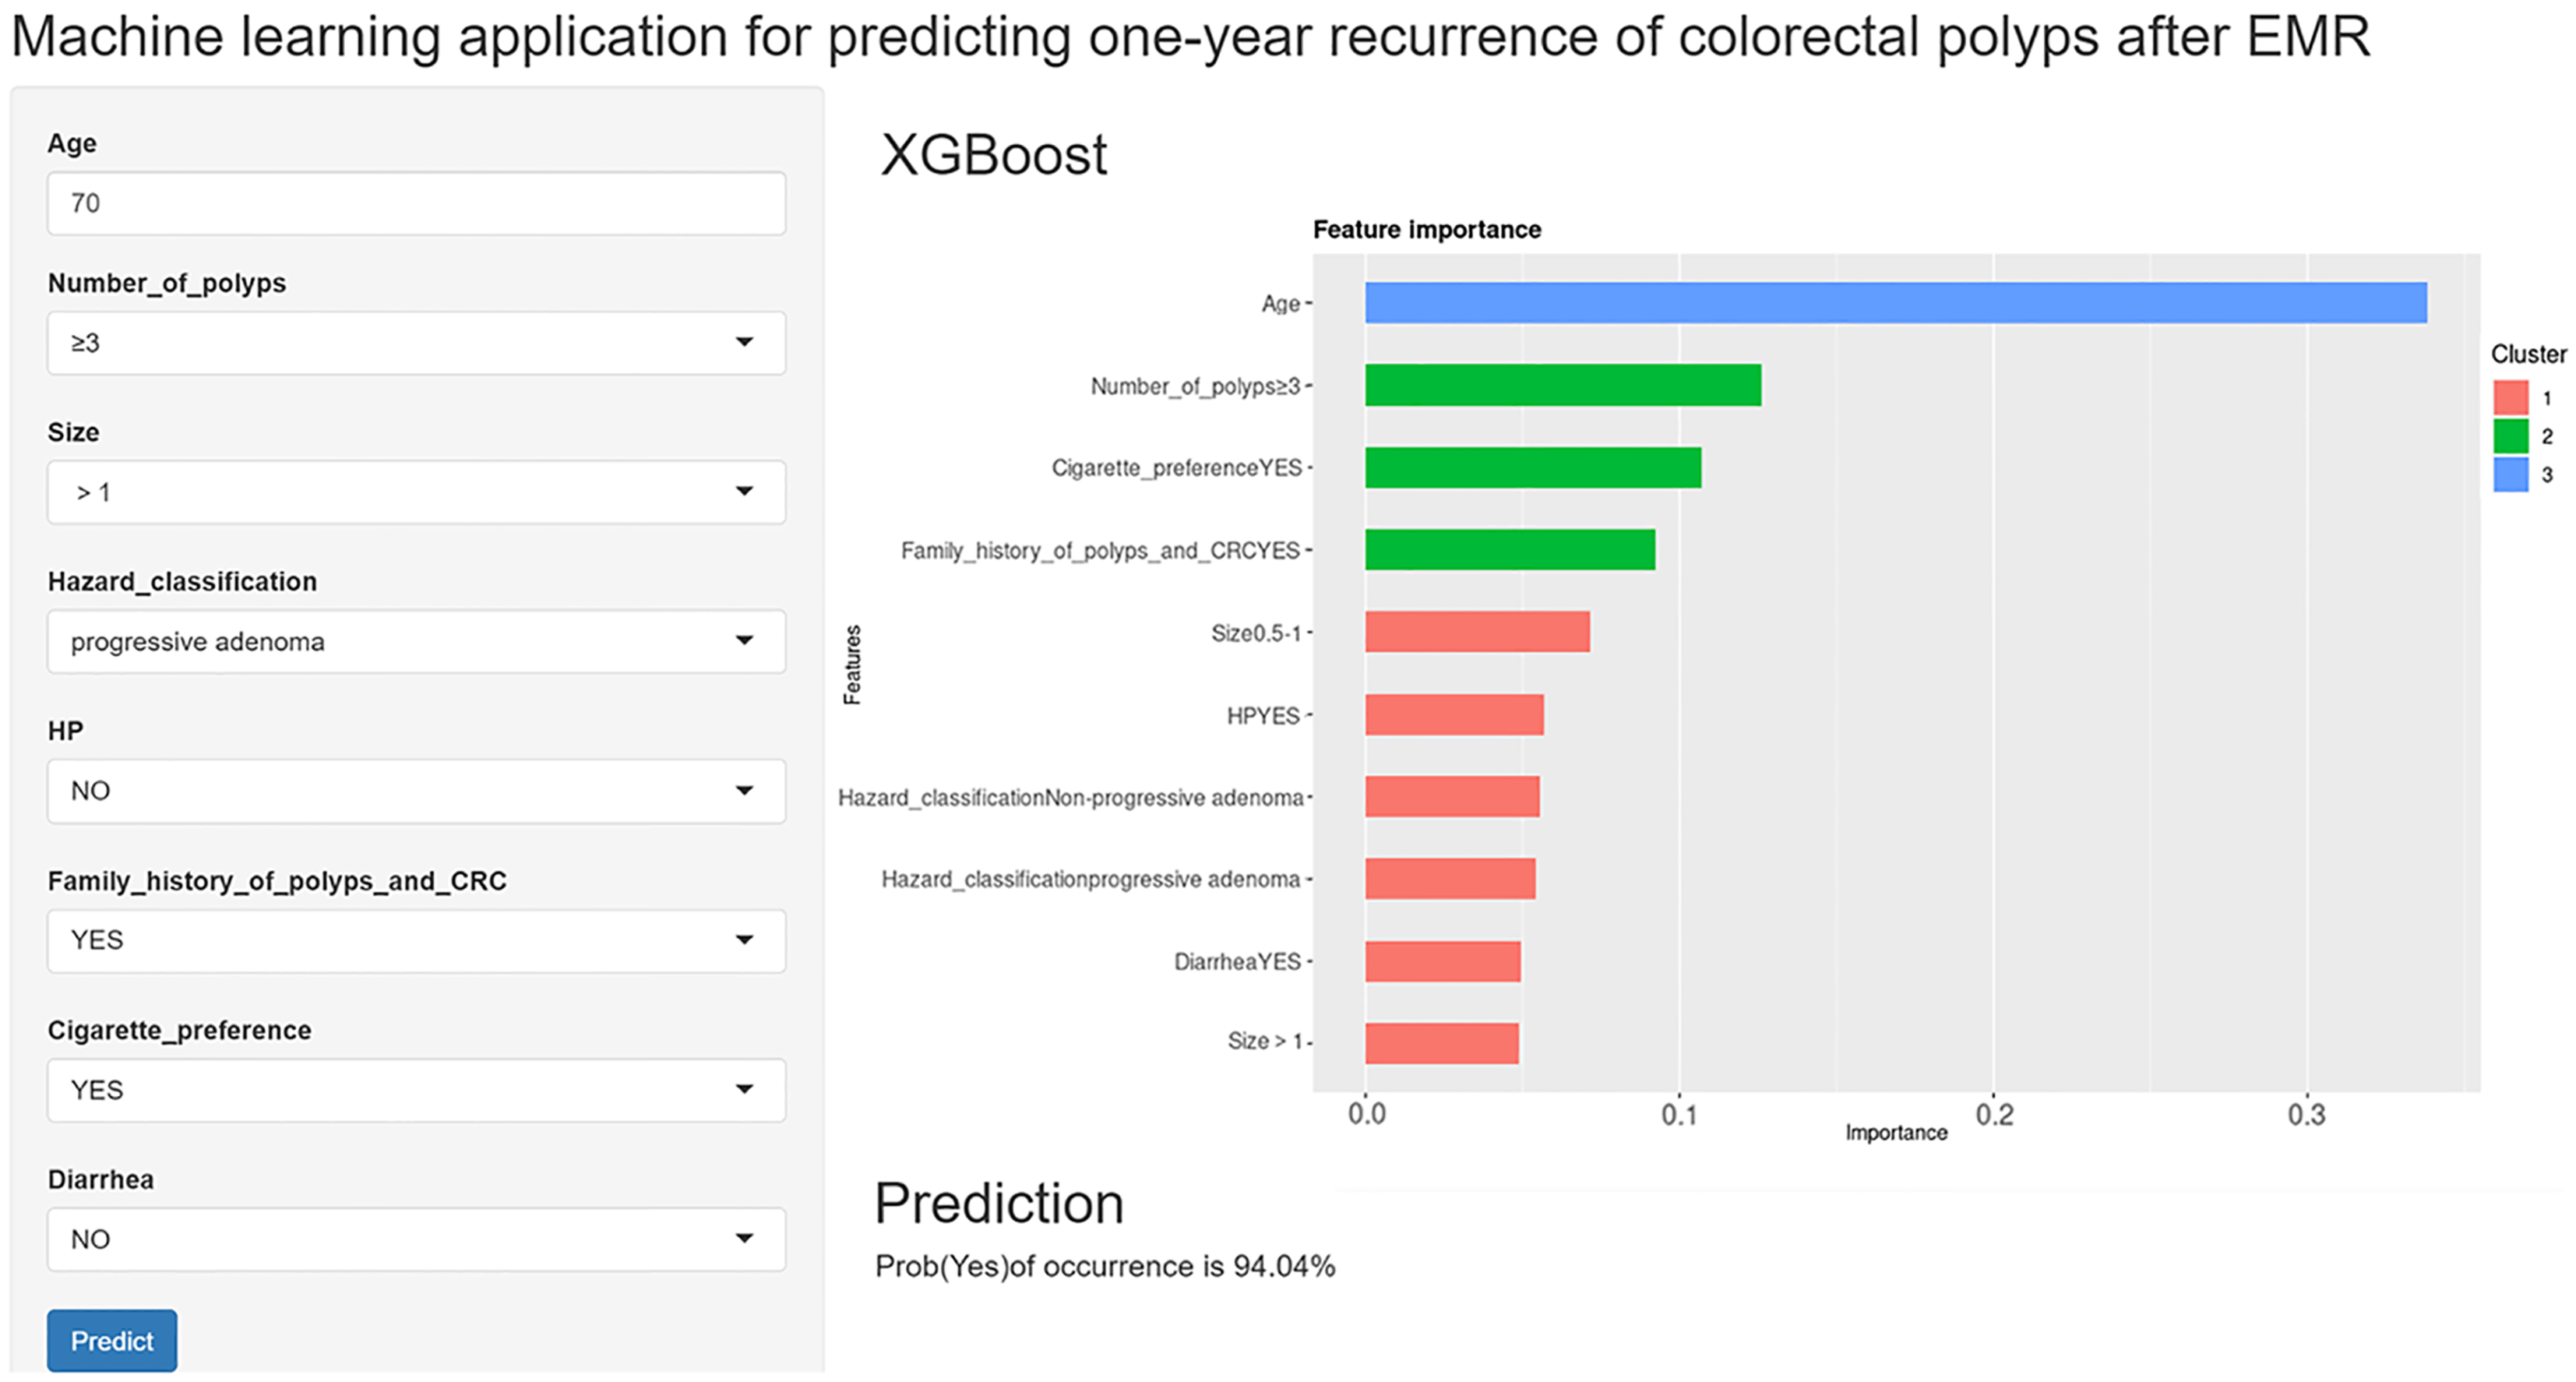
Figure 5 Online web calculator for predicting colorectal polyp recurrence 1 year after Endoscopic mucosal resection.
EMR: Endoscopic mucosal resection; XGBoost: EXtreme Gradient Boosting; CRC: Colorectal cancer.
- Citation: Shi YH, Liu JL, Cheng CC, Li WL, Sun H, Zhou XL, Wei H, Fei SJ. Construction and validation of machine learning-based predictive model for colorectal polyp recurrence one year after endoscopic mucosal resection. World J Gastroenterol 2025; 31(11): 102387
- URL: https://www.wjgnet.com/1007-9327/full/v31/i11/102387.htm
- DOI: https://dx.doi.org/10.3748/wjg.v31.i11.102387


