Copyright
©The Author(s) 2025.
World J Gastroenterol. Mar 21, 2025; 31(11): 100911
Published online Mar 21, 2025. doi: 10.3748/wjg.v31.i11.100911
Published online Mar 21, 2025. doi: 10.3748/wjg.v31.i11.100911
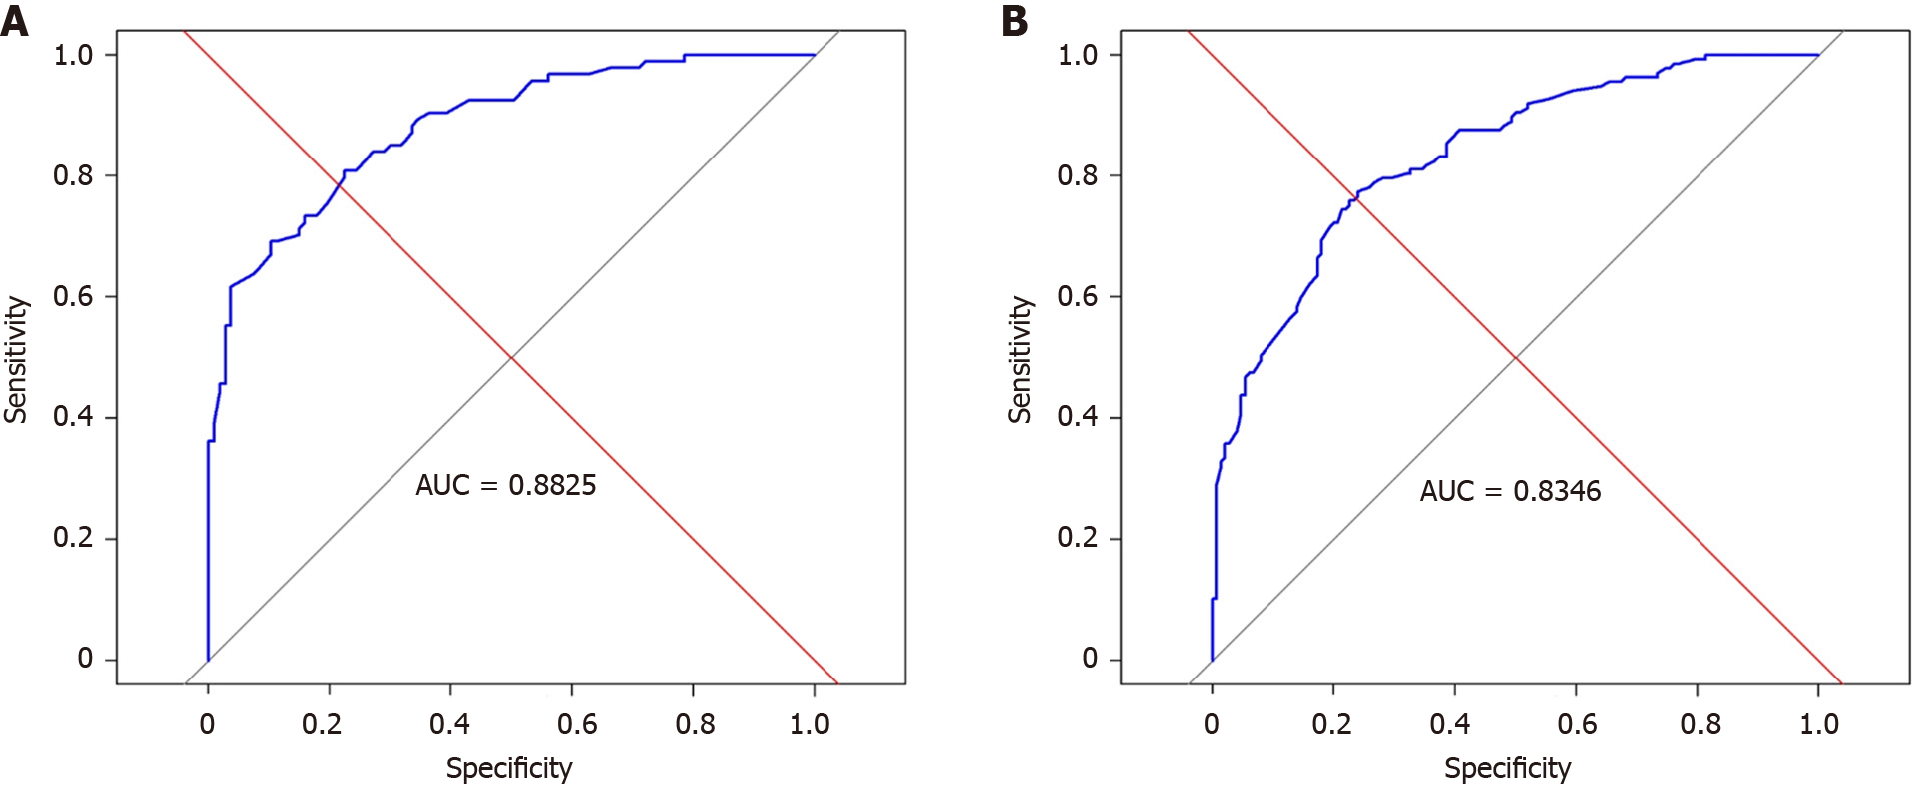
Figure 1 The area under the curve of EXtreme Gradient Boosting model.
A: The results showed that the EXtreme Gradient Boosting (XGBoost) model has good prediction effect in the train group [area under the curve (AUC) = 0.882]; B: The XGboost model has good prediction effect in validation group (AUC = 0.834). AUC: Area under the curve.
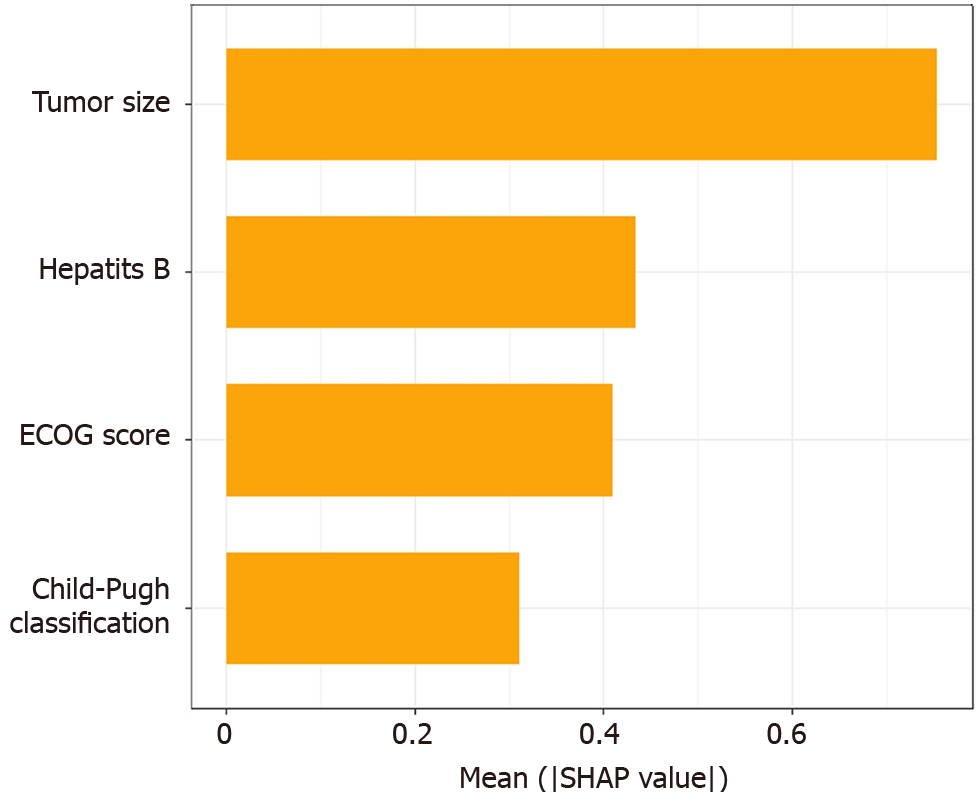
Figure 2 Variable importance ranking.
The SHapley Additive exPlanations histogram shows that the variables with weights from high to low in the model are: Tumor size, Child-Pugh grade, hepatitis B, and Eastern Cooperative Oncology Group score. ECOG score: Eastern Cooperative Oncology Group score; SHAP: The SHapley Additive exPlanations.
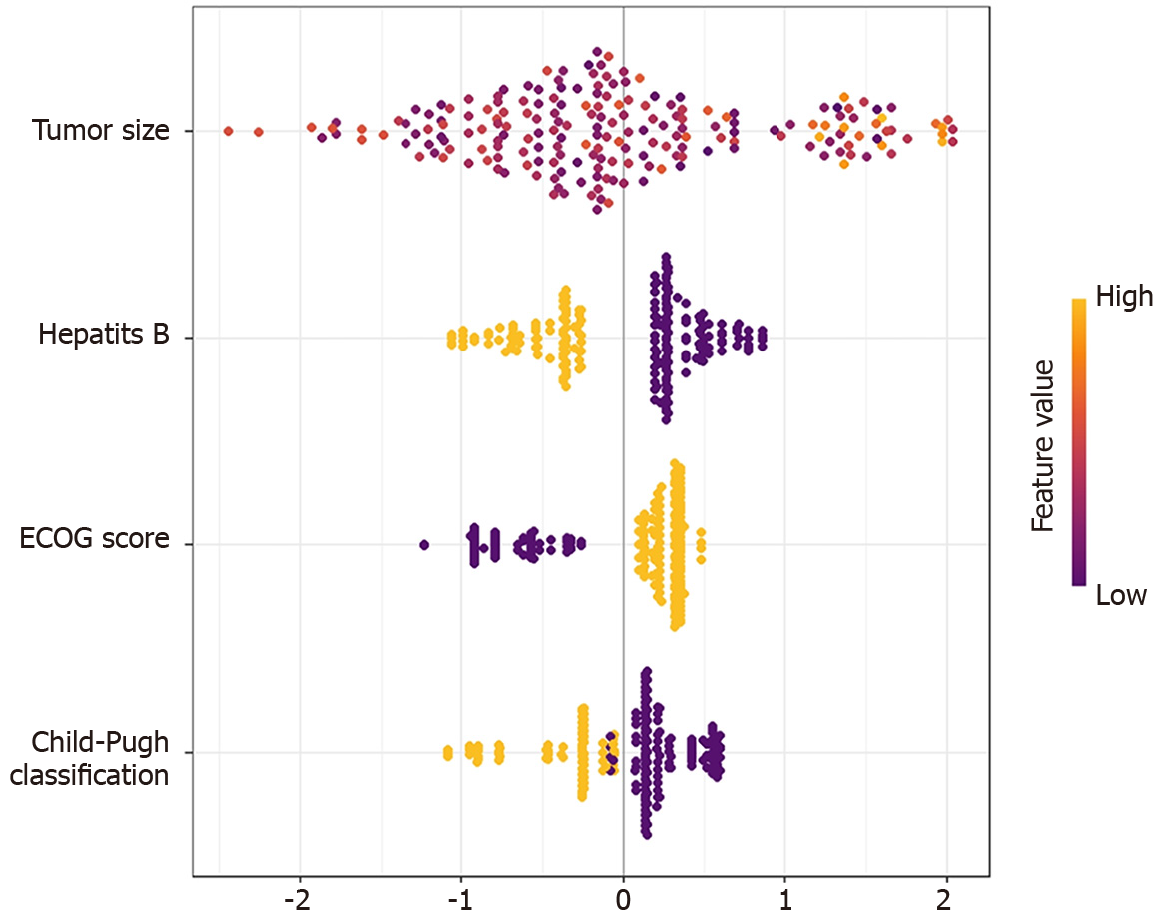
Figure 3 The SHapley Additive exPlanations bee swarm plot.
The color of the point represents the original value of the feature. Red represents high values and blue represents low values. The results show that tumor size has the most important impact on model prediction. ECOG score: Eastern Cooperative Oncology Group score.
Figure 4 Machine learning prediction process diagram.
Taking No. 1 patient as an example, the patient has a tumor of 8 cm (-0.154), hepatitis B virus negative (+0.197), and liver function Child A grade (+0.136). Eastern Cooperative Oncology Group 0 points (-0.922). The overall score f (x) = -0.743 points, so the model believes that the patient cannot achieve the textbook outcome, which is consistent with the actual situation. ECOG score: Eastern Cooperative Oncology Group score; SHAP: The SHapley Additive exPlanations.
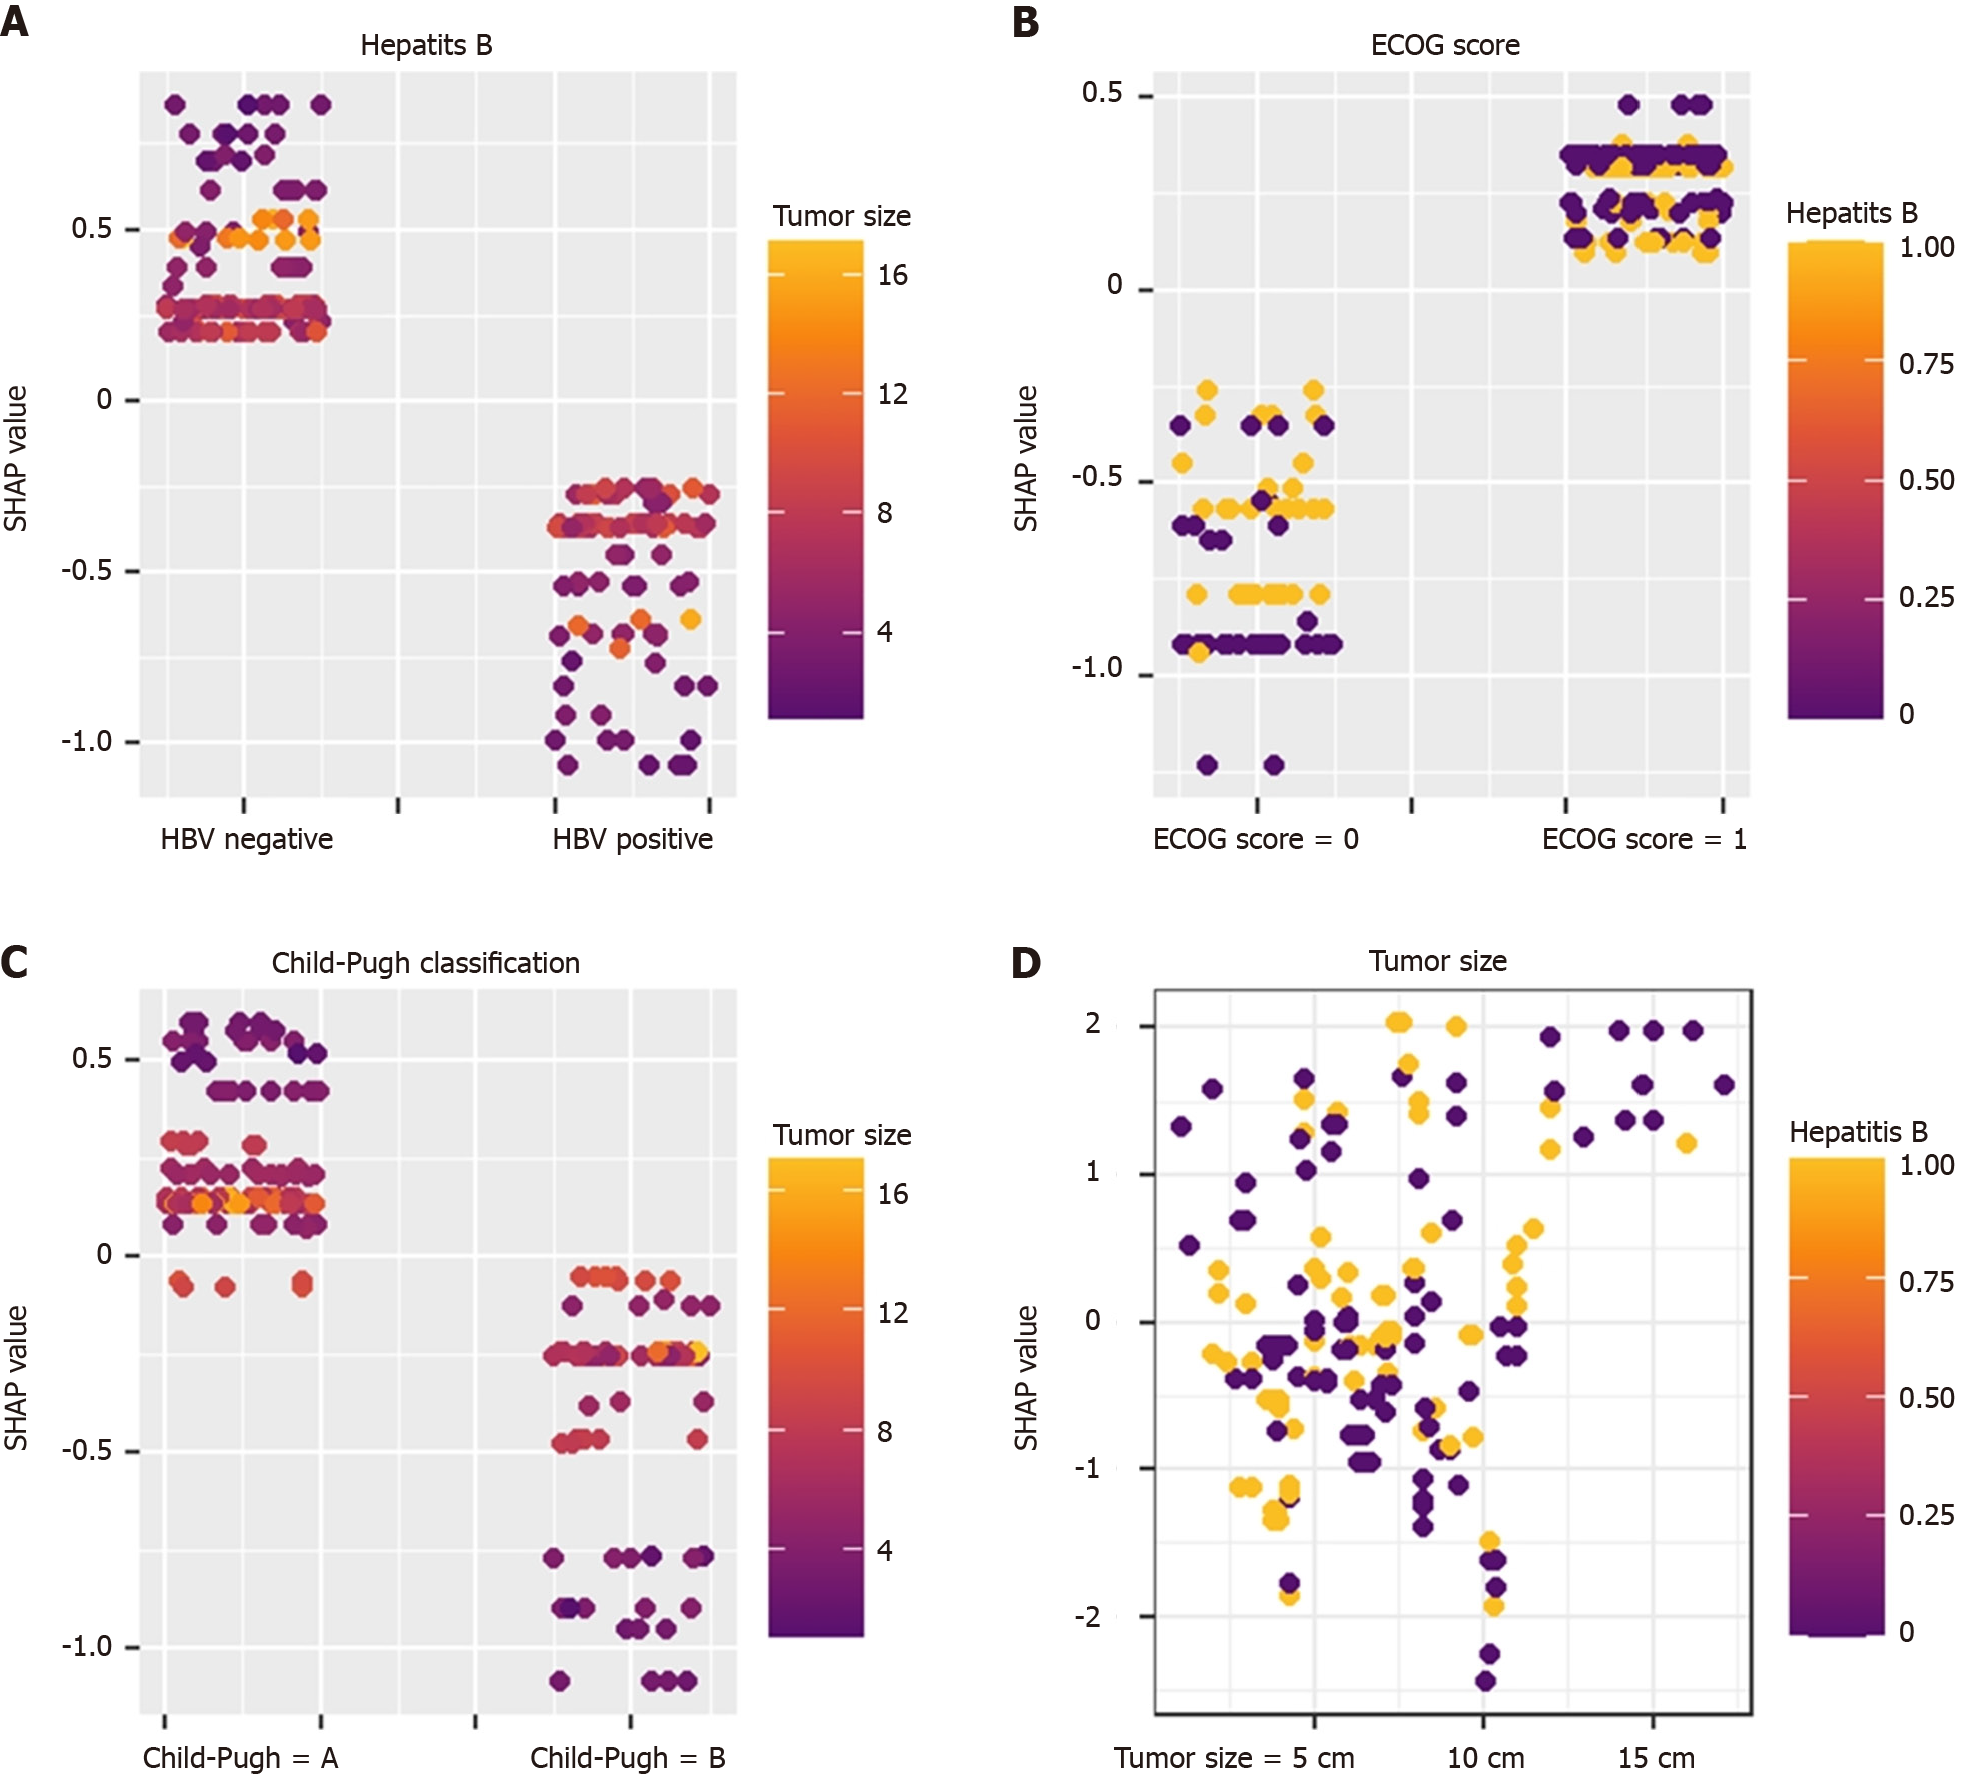
Figure 5 Diagram of variable interaction.
A: Hepatitis B; B: Eastern Cooperative Oncology Group score; C: Child-Pugh classification; D: Tumor size. Different features interact with each other to predict the textbook outcome (TO). For example: In hepatitis B-negative patients, the smaller the tumor, the higher the SHapley Additive exPlanations value, indicating that in hepatitis B-negative patients, the smaller the tumor, the easier it is to achieve the TO. ECOG score: Eastern Cooperative Oncology Group score; SHAP: The SHapley Additive exPlanations.
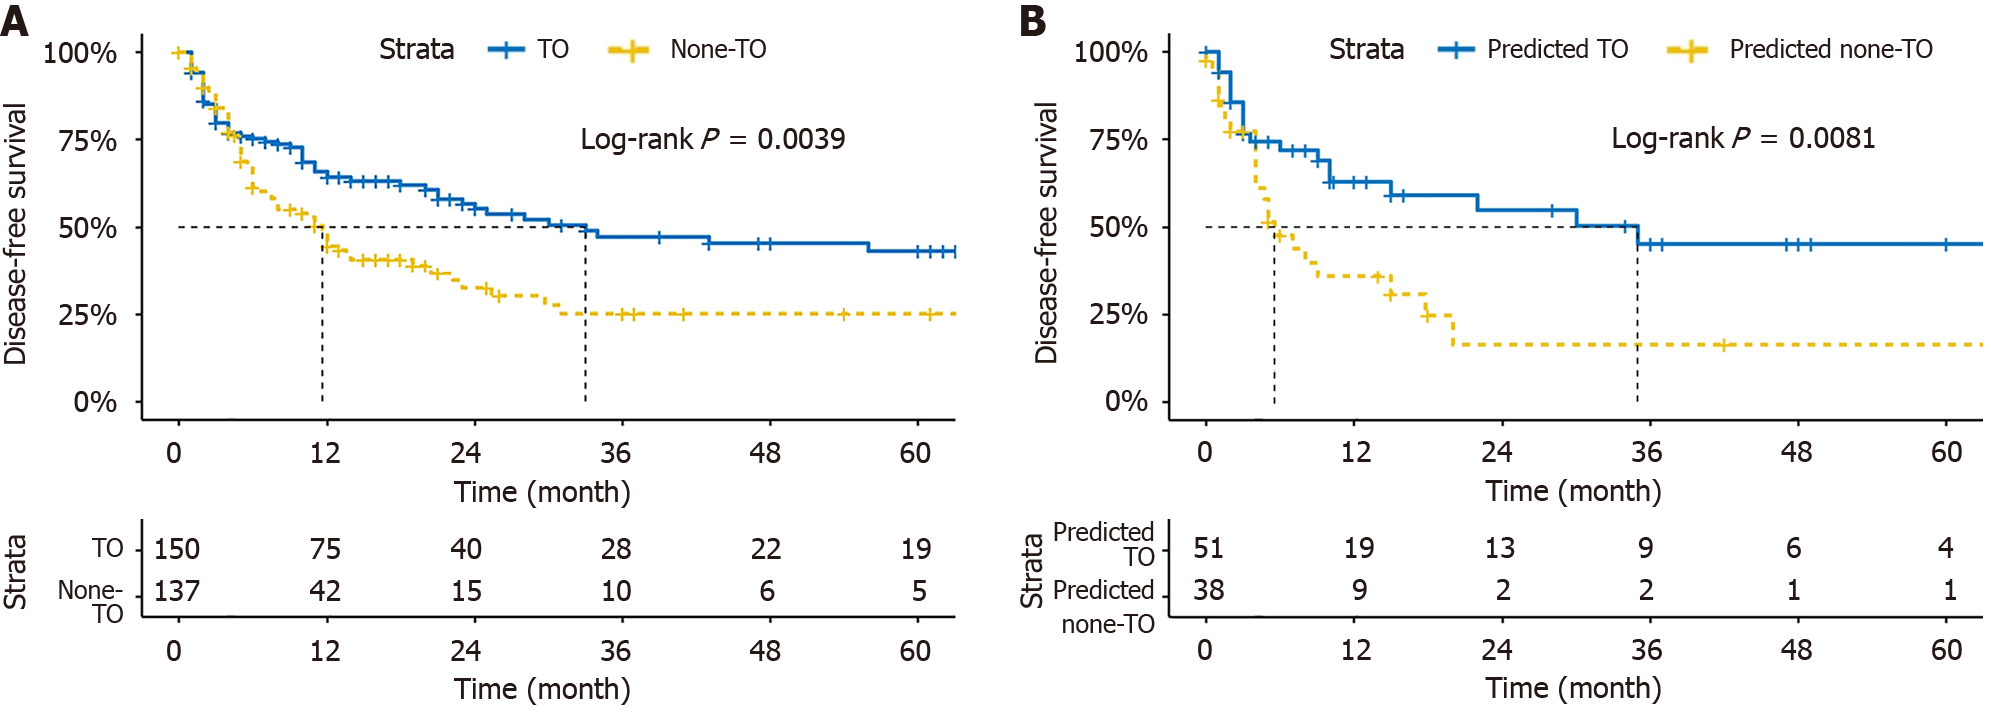
Figure 6 Disease-free survival.
A: Disease-free survival (DFS) of patients who achieved textbook outcome (TO) and those who did not. Survival analysis shows that the DFS of patients reaching the TO in 1, 2, and 3 years were 642%, 56.8%, and 43.4%; B: DFS chart of patients predicted to achieve TO and those predicted not to achieve. The DFS of patients that did not meet the TO in 1, 2, and 3 years were 447%, 32.5%, and 25.2%. TO: Textbook outcome.
- Citation: Huang TF, Luo C, Guo LB, Liu HZ, Li JT, Lin QZ, Fan RL, Zhou WP, Li JD, Lin KC, Tang SC, Zeng YY. Preoperative prediction of textbook outcome in intrahepatic cholangiocarcinoma by interpretable machine learning: A multicenter cohort study. World J Gastroenterol 2025; 31(11): 100911
- URL: https://www.wjgnet.com/1007-9327/full/v31/i11/100911.htm
- DOI: https://dx.doi.org/10.3748/wjg.v31.i11.100911


