Copyright
©The Author(s) 2025.
World J Gastroenterol. Mar 21, 2025; 31(11): 100785
Published online Mar 21, 2025. doi: 10.3748/wjg.v31.i11.100785
Published online Mar 21, 2025. doi: 10.3748/wjg.v31.i11.100785
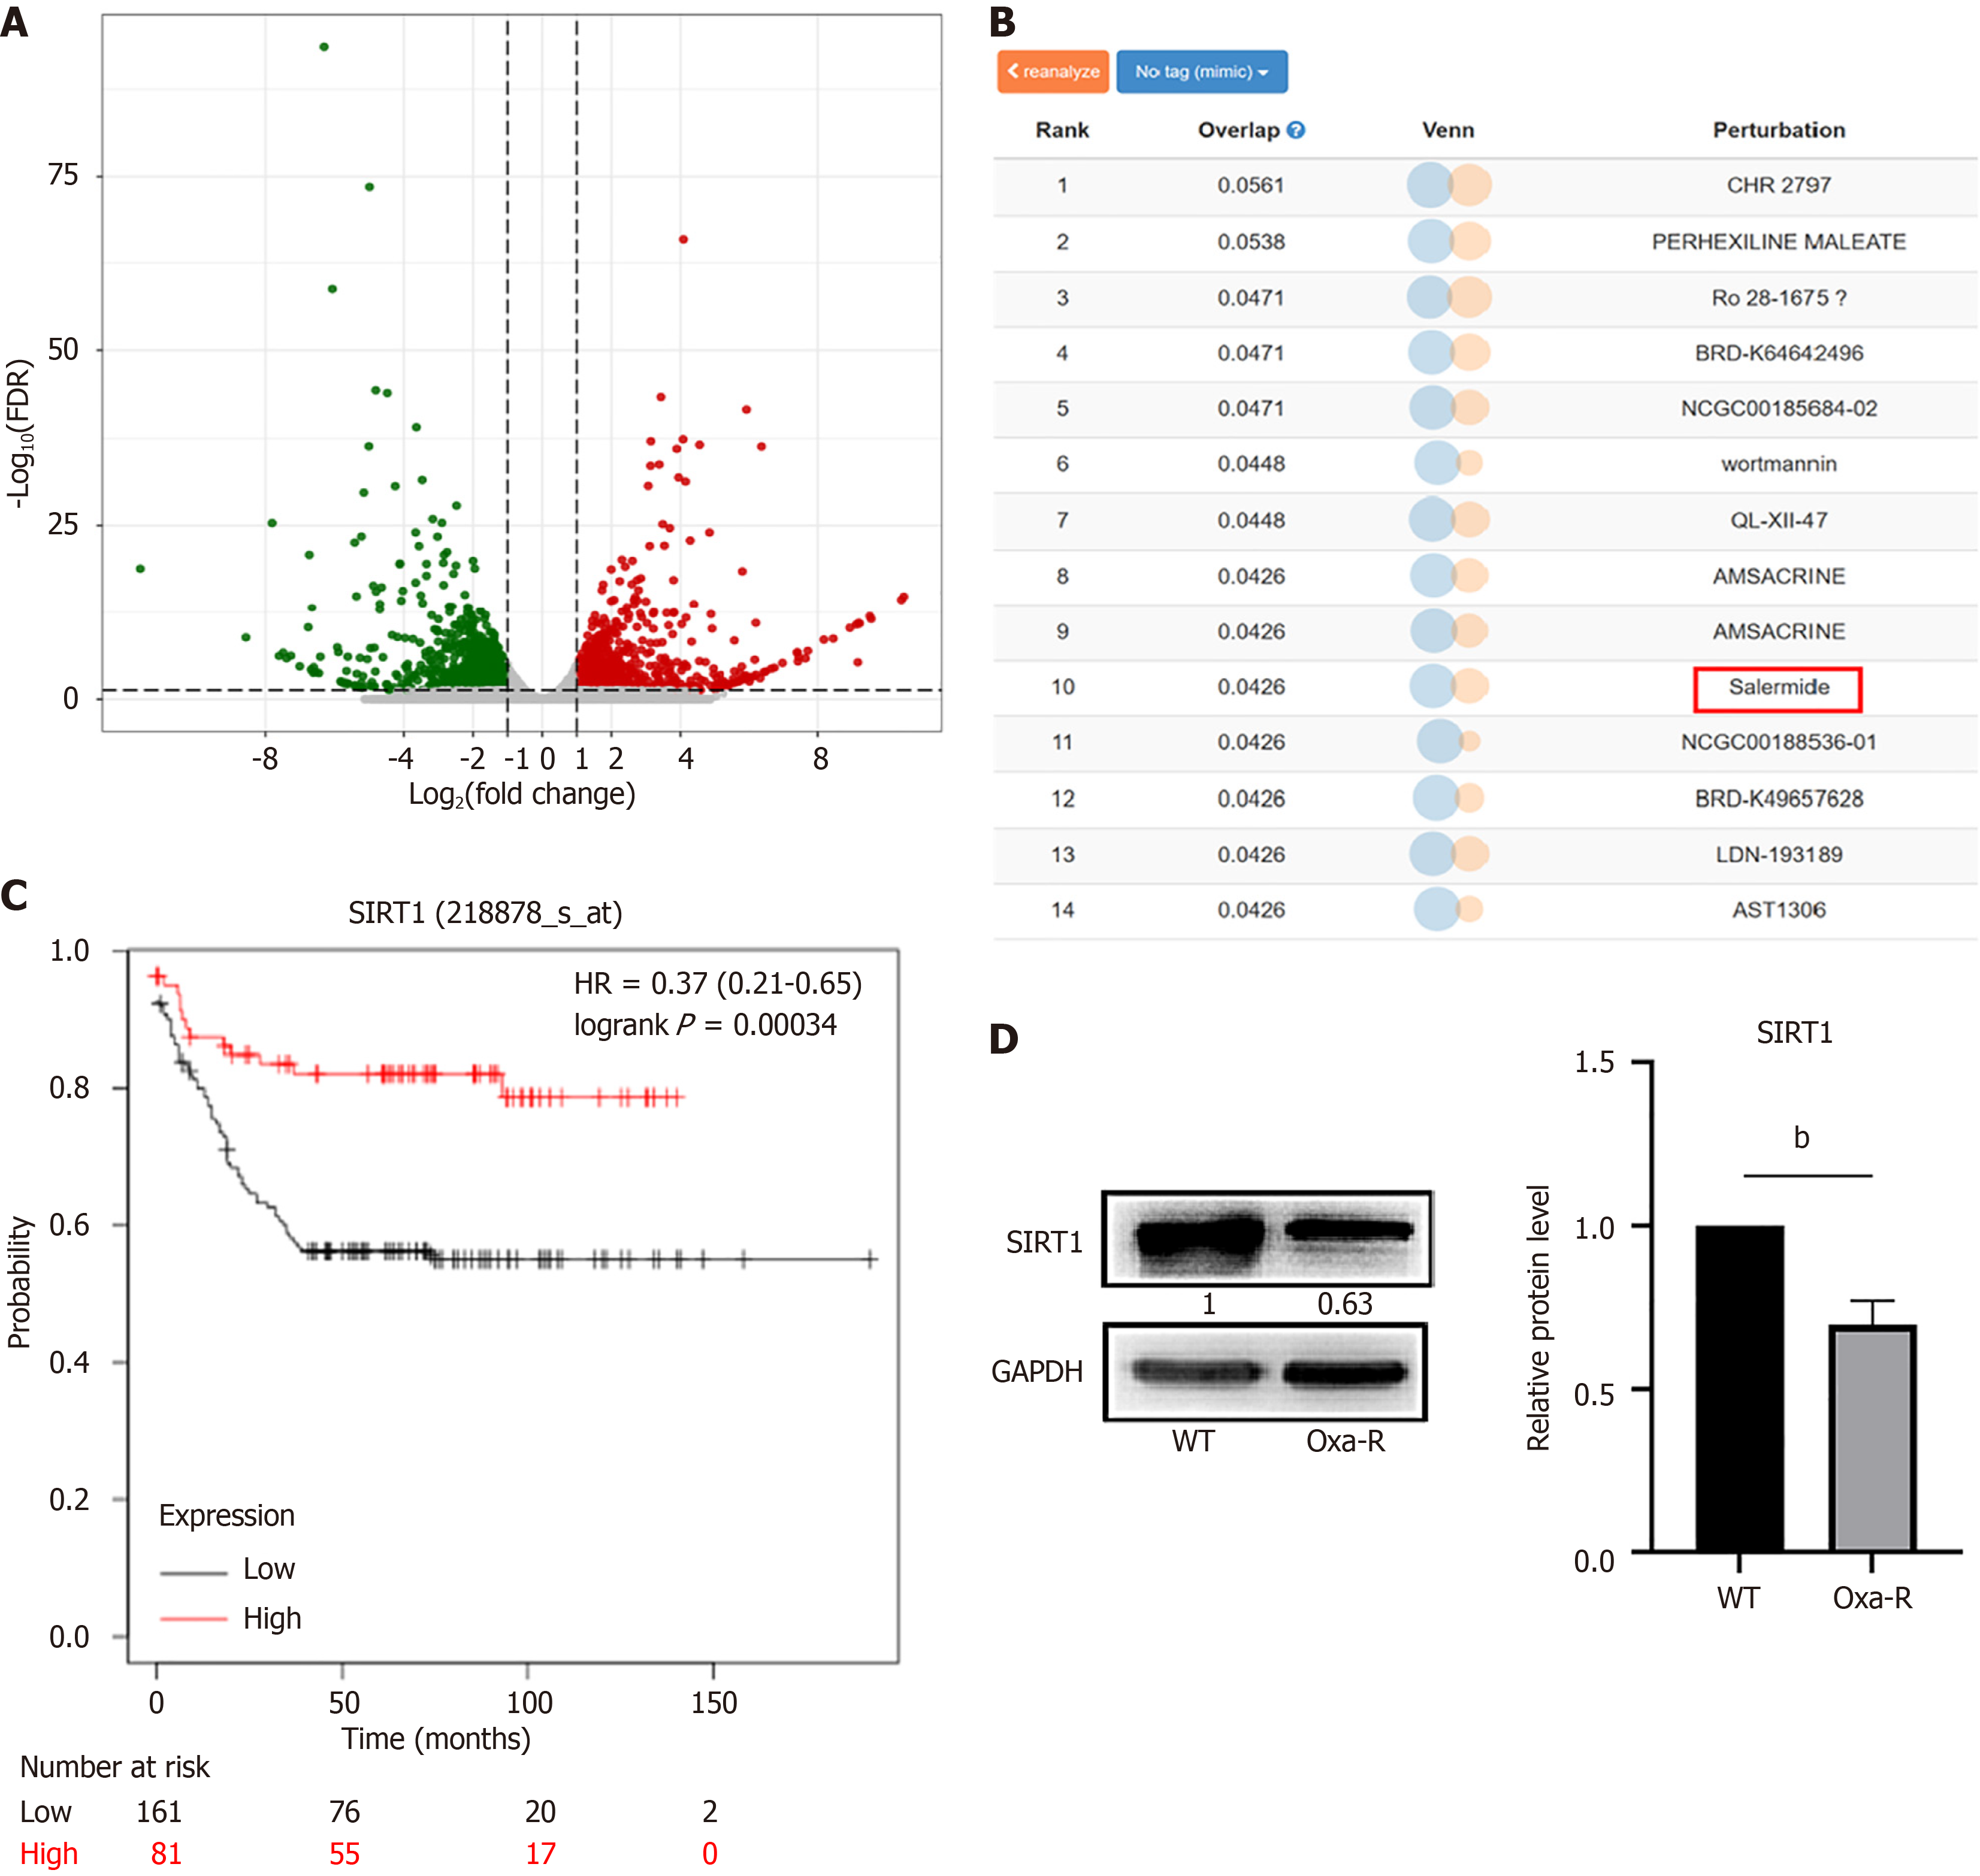
Figure 1 Screening of key molecules that regulate oxaliplatin resistance in colorectal cancer.
A: Differentially expressed genes between HCT116-WT and HCT116 Oxa-R cells are shown in a volcano plot. In this plot, red dots represent upregulated differentially expressed genes, whereas green dots represent downregulated differentially expressed genes; B: Based on the expression profile of resistance-related differentially expressed genes, the Library of Integrated Network-based Cellular Signatures database was queried to identify small molecules with connectivity scores that are positively correlated with the resistance profile. These candidate drugs likely target mechanisms or pathways involved in regulating oxaliplatin resistance; C: The expression of SIRT1 mRNA were associated with overall survival in colorectal cancer patients with p53 mutations; D: Western blotting was performed to detect the expression levels of SIRT1 in both HCT116-WT cells and HCT116 Oxa-R cells. Each bar represents means ± SD of three separate experiments. bP < 0.01.
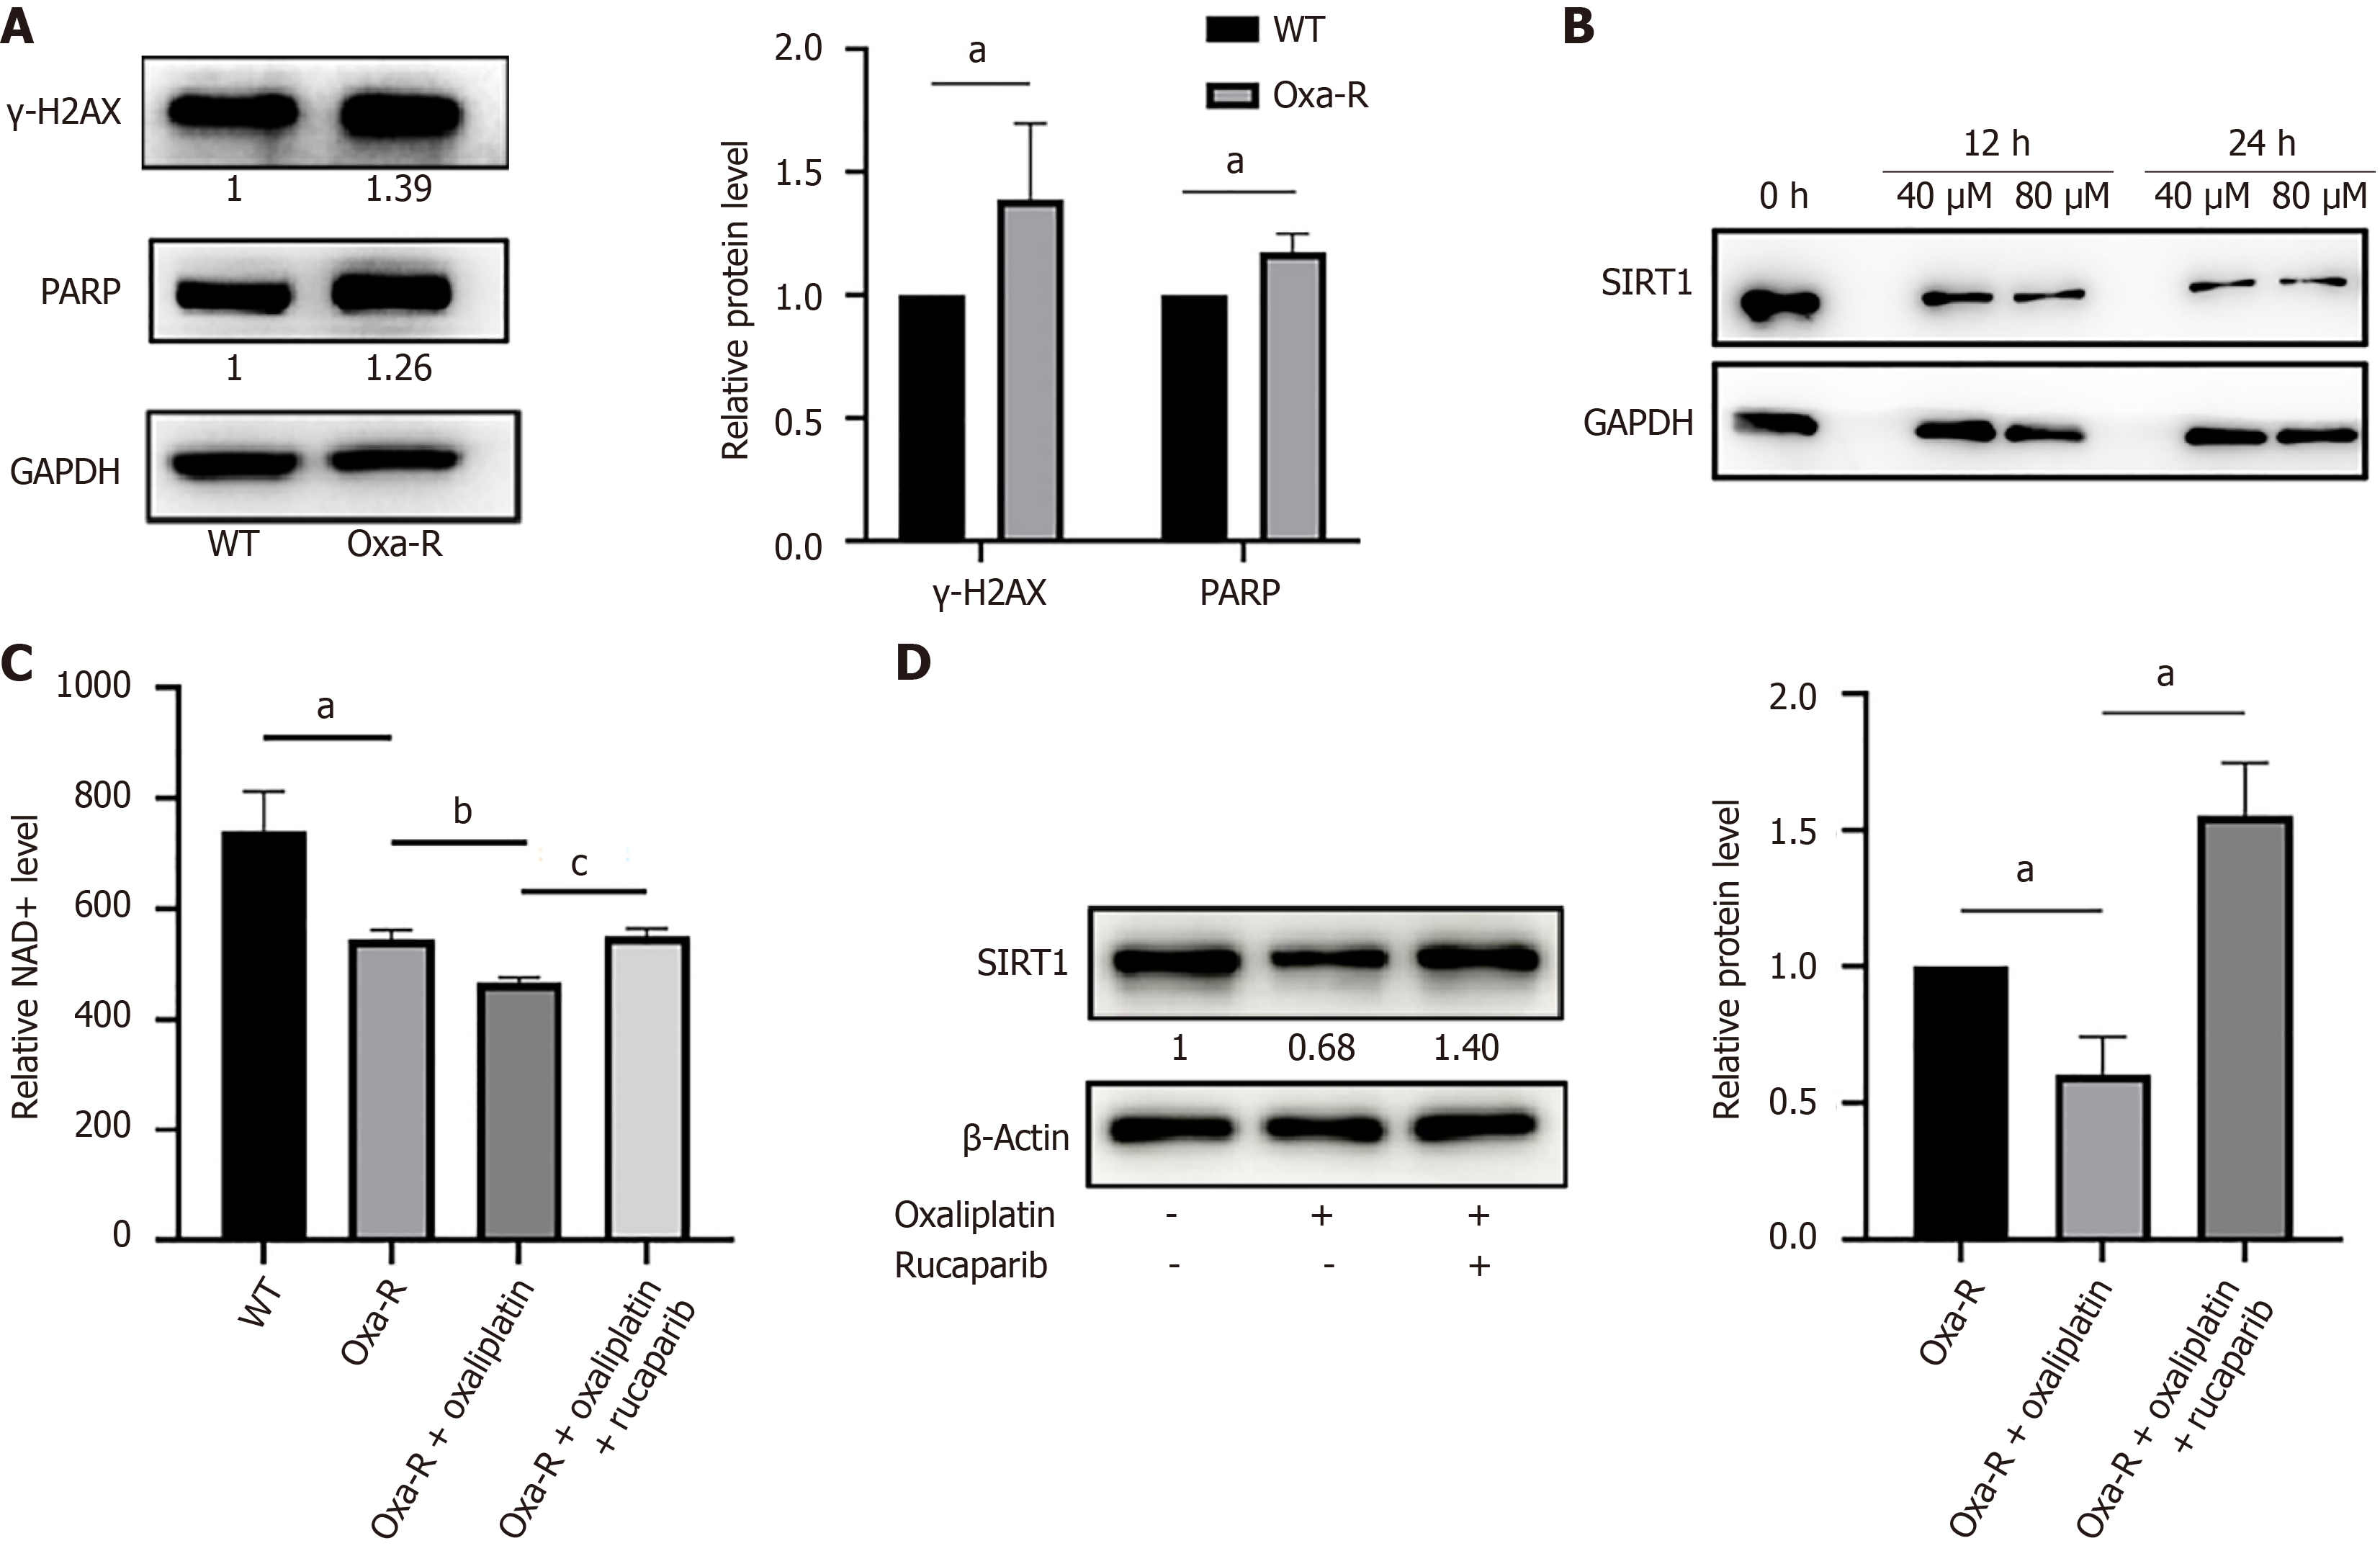
Figure 2 DNA damage induces NAD+ depletion and inhibits SIRT1 expression.
A: Western blot analysis of γ-H2AX and PARP expression in HCT116-WT and HCT116 Oxa-R cells. Each bar represents means ± SD of three separate experiments. aP < 0.05. β-Actin was used as the internal reference; B: Western blot analysis shows SIRT1 expression in HCT116 Oxa-R cells treated with different concentrations of oxaliplatin (40, 80 μM) for 12 or 24 hours. GAPDH was used as the internal reference; C: Flow cytometry results indicate that NAD+ levels are lower in HCT116 Oxa-R cells than in HCT116-WT cells. Treatment with oxaliplatin (40 μM) for 12 hours induced NAD+ depletion in HCT116 Oxa-R cells, whereas treatment with rucaparib (5 μM) for 12 hours inactivated PARP and reversed oxaliplatin-induced NAD+ depletion. The data are presented as the means ± SD. aP < 0.05; bP < 0.01; cP < 0.001; D: Treatment with rucaparib (5 μM) for 12 hours reversed the oxaliplatin-induced reduction in SIRT1 expression. Each bar represents means ± SD of three separate experiments. aP < 0.05.
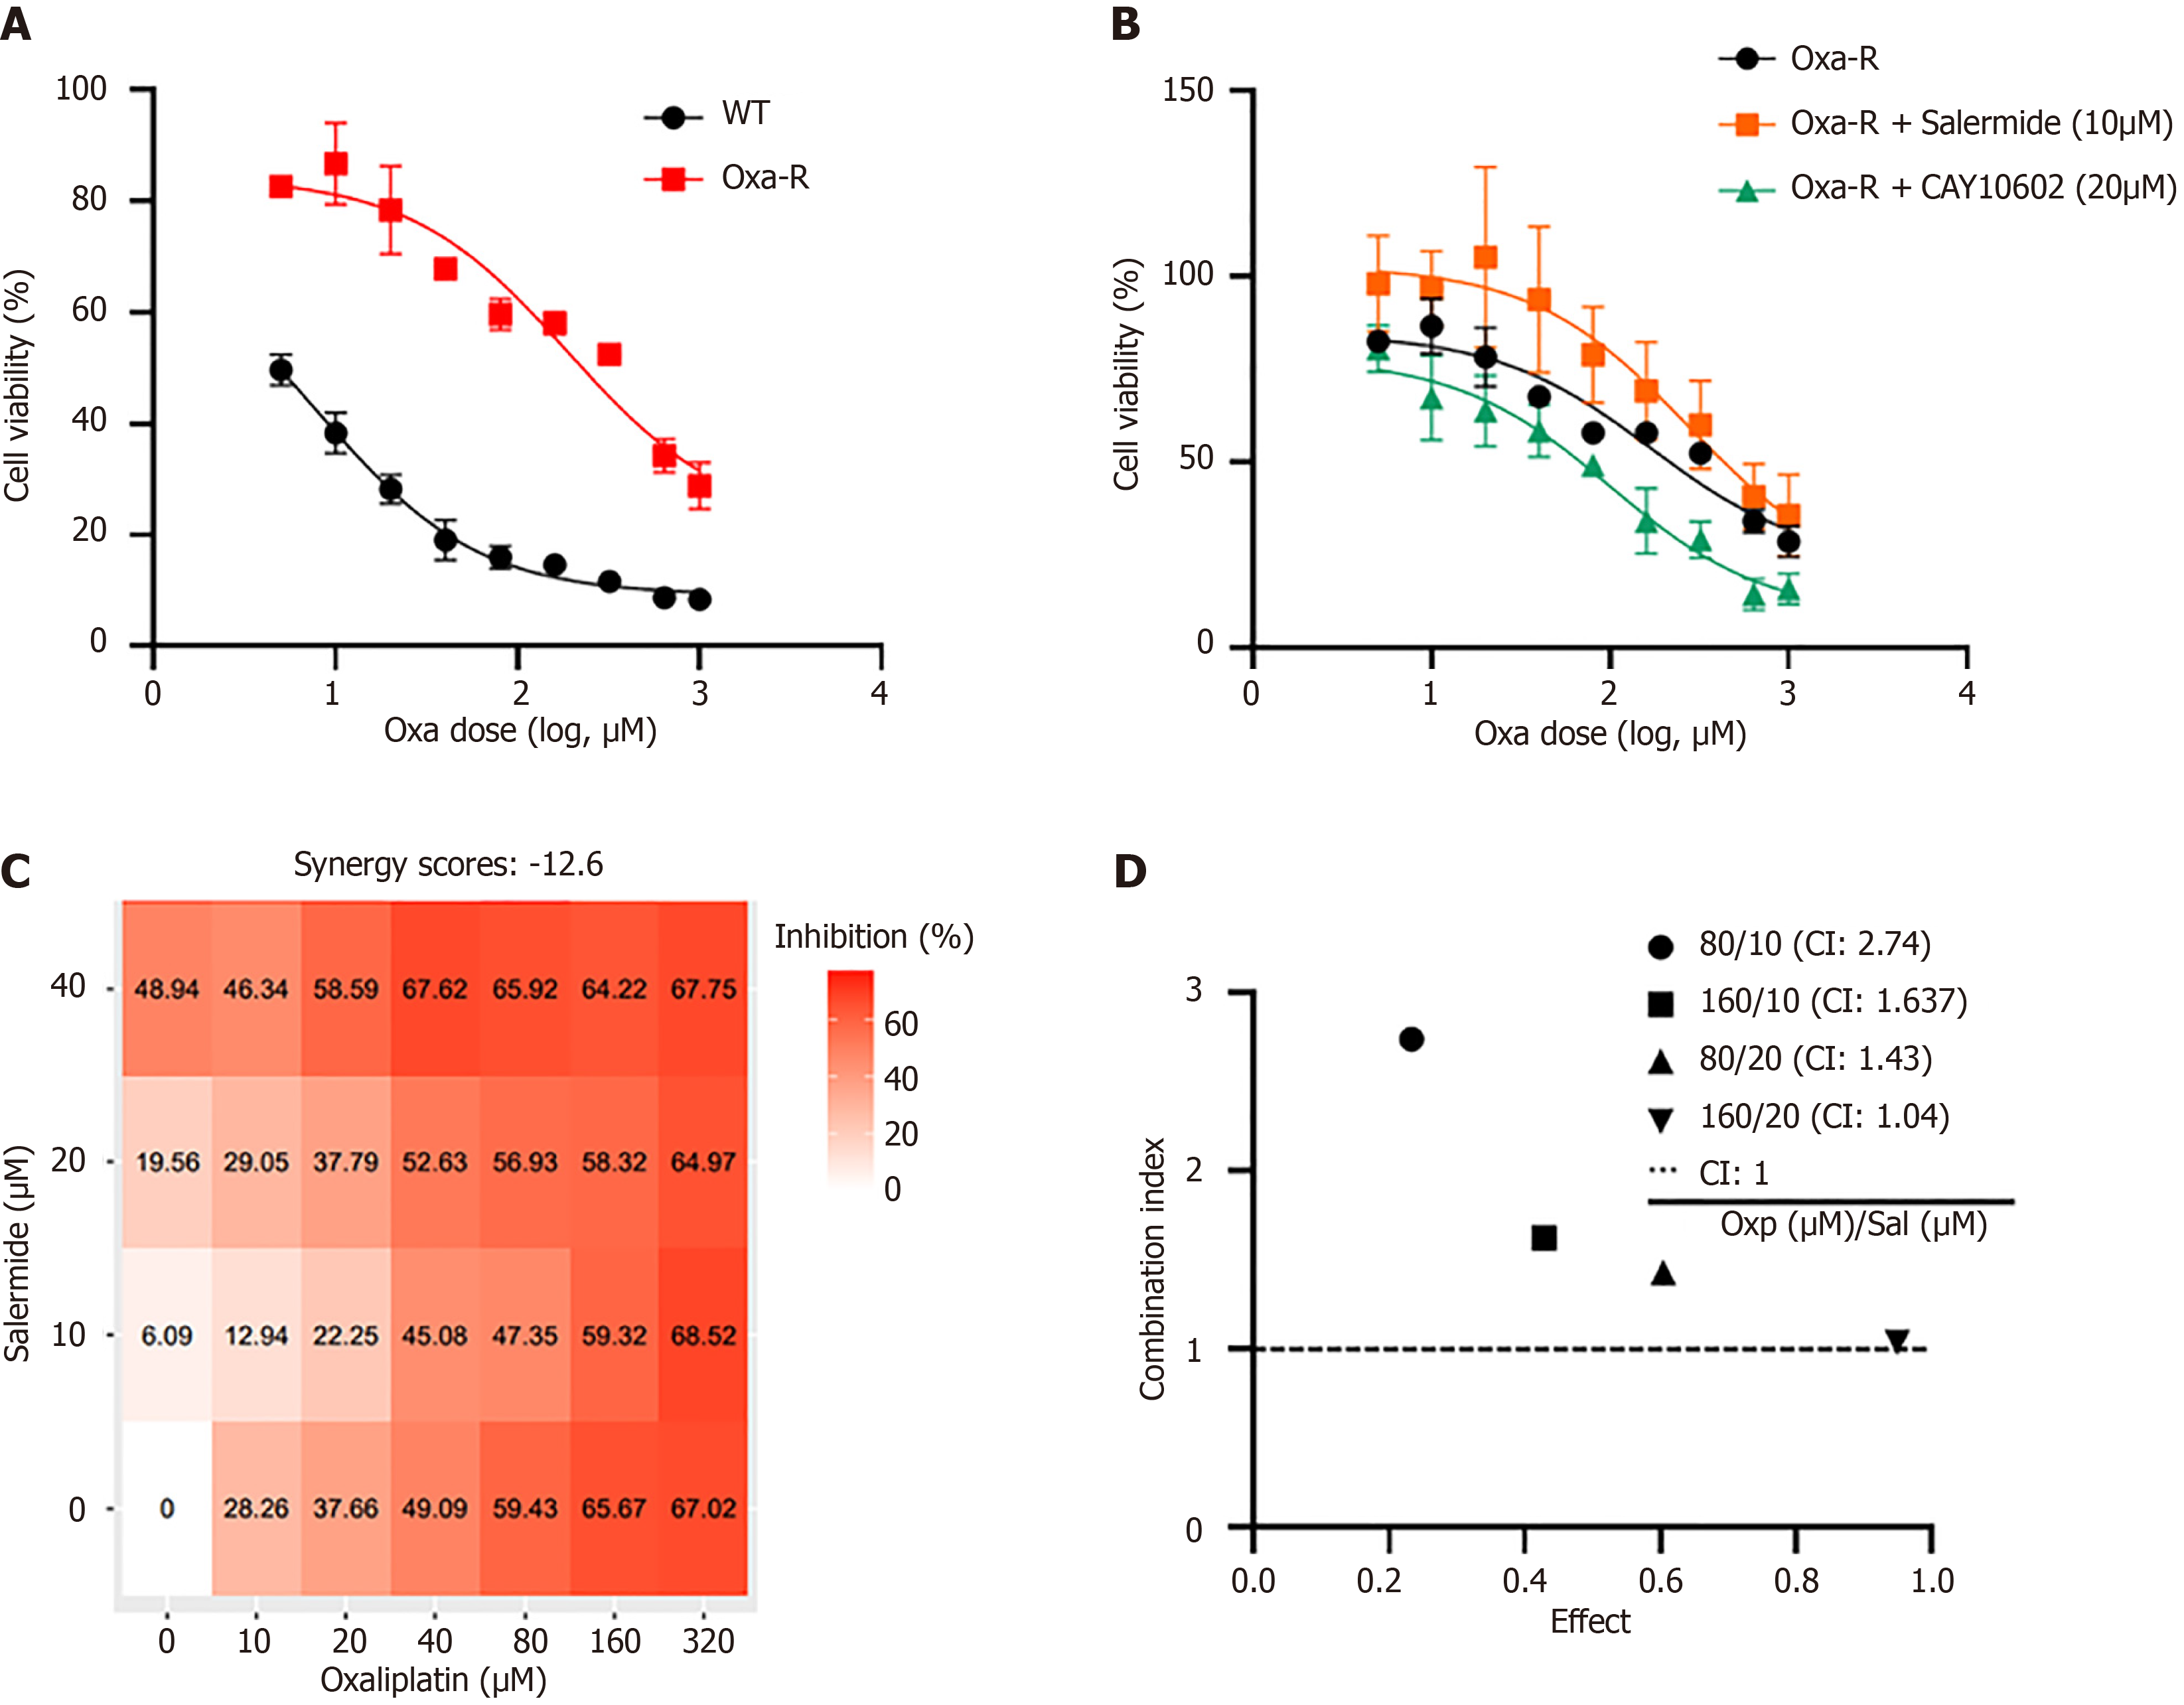
Figure 3 SIRT1 expression regulates the sensitivity of HCT116 Oxa-R cells to oxaliplatin.
A: MTS assay was performed to determine the IC50 of oxaliplatin in HCT116-WT and HCT116 Oxa-R cells; B: HCT116 Oxa-R cells were treated with salermide (10 μM) to inhibit SIRT1 expression or CAY10602 (20 μM) to increase SIRT1 expression. Cell survival curves revealed that inhibition of SIRT1 increased the IC50 of oxaliplatin in HCT116 Oxa-R cells, whereas an increase in SIRT1 expression decreased the IC50; C: SynergyFinder software was used to calculate the synergy score for the combination of oxaliplatin and salermide in HCT116 Oxa-R cells (a score > 10 indicates synergy, -10 to 10 indicates additive effects, and < -10 indicates antagonism); D: Compusyn software was used to evaluate the combination index (CI) for oxaliplatin and salermide in HCT116 Oxa-R cells (CI < 1 indicates synergy, CI > 1 indicates antagonism, and CI = 1 indicates additive effects). CI: Combination index.
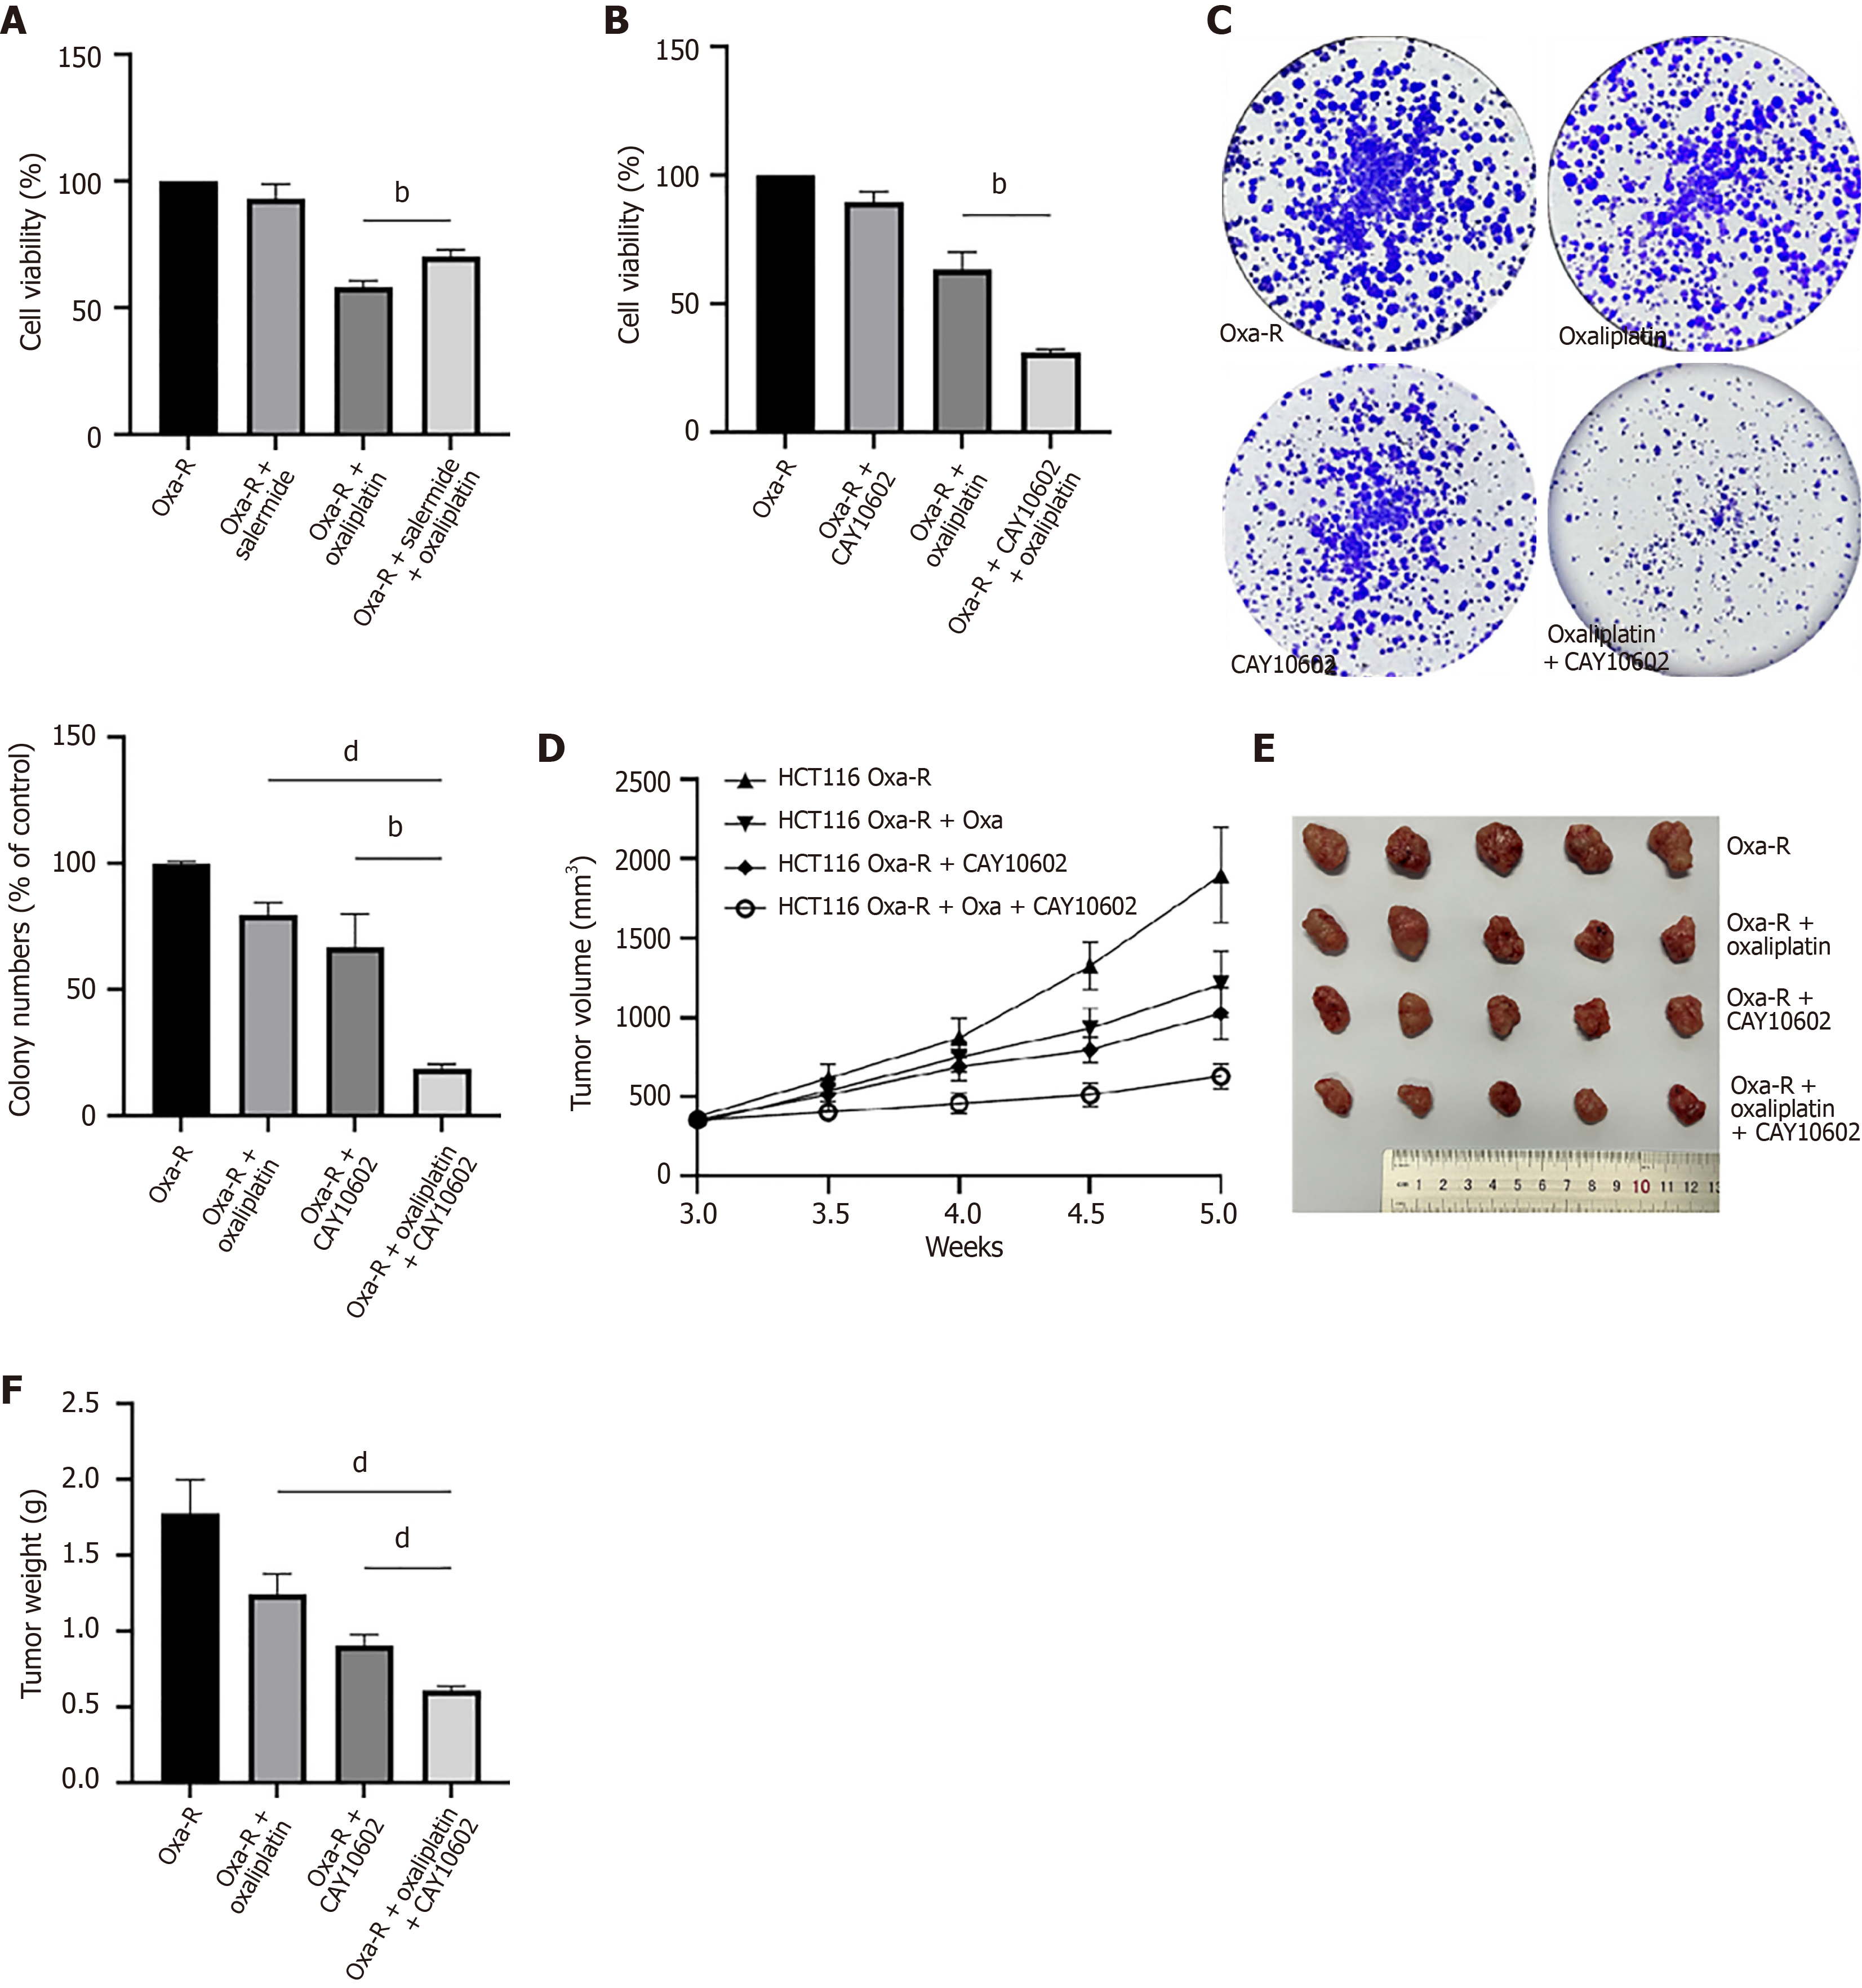
Figure 4 CAY10602 enhances the sensitivity of resistant cells to oxaliplatin.
A: MTS results after 24 hours of treatment of HCT116 Oxa-R cells with oxaliplatin (40 μM) alone, salermide (10 μM) alone, or oxaliplatin combined with salermide. bP < 0.01; B: MTS results after 24 hours of treatment of HCT116 Oxa-R cells with oxaliplatin (40 μM) alone, CAY10602 (20 μM) alone, or oxaliplatin combined with salermide. bP < 0.01; C: Colony formation assay confirmed the inhibitory effect of 14 days of treatment with oxaliplatin (40 μM) alone, CAY10602 (20 μM) alone, or oxaliplatin combined with salermide in HCT116 Oxa-R cells. bP < 0.01; dP < 0.0001; D-F: Effect of CAY10602 on oxaliplatin resistance in subcutaneously implanted HCT116 Oxa-R cells in a nude mouse model (1× 10⁶/mouse; n = 5/group). Tumors harvested from these nude mice were treated with saline (control), oxaliplatin alone (10 mg/kg, three times a week), CAY10602 alone (10 mg/kg, three times a week) or oxaliplatin together with CAY10602. The tumor volumes were quantified as V = L × W2/2 (where L is the length and W is the width). Tumors were harvested when the diameter was > 1.5 cm. dP < 0.0001.
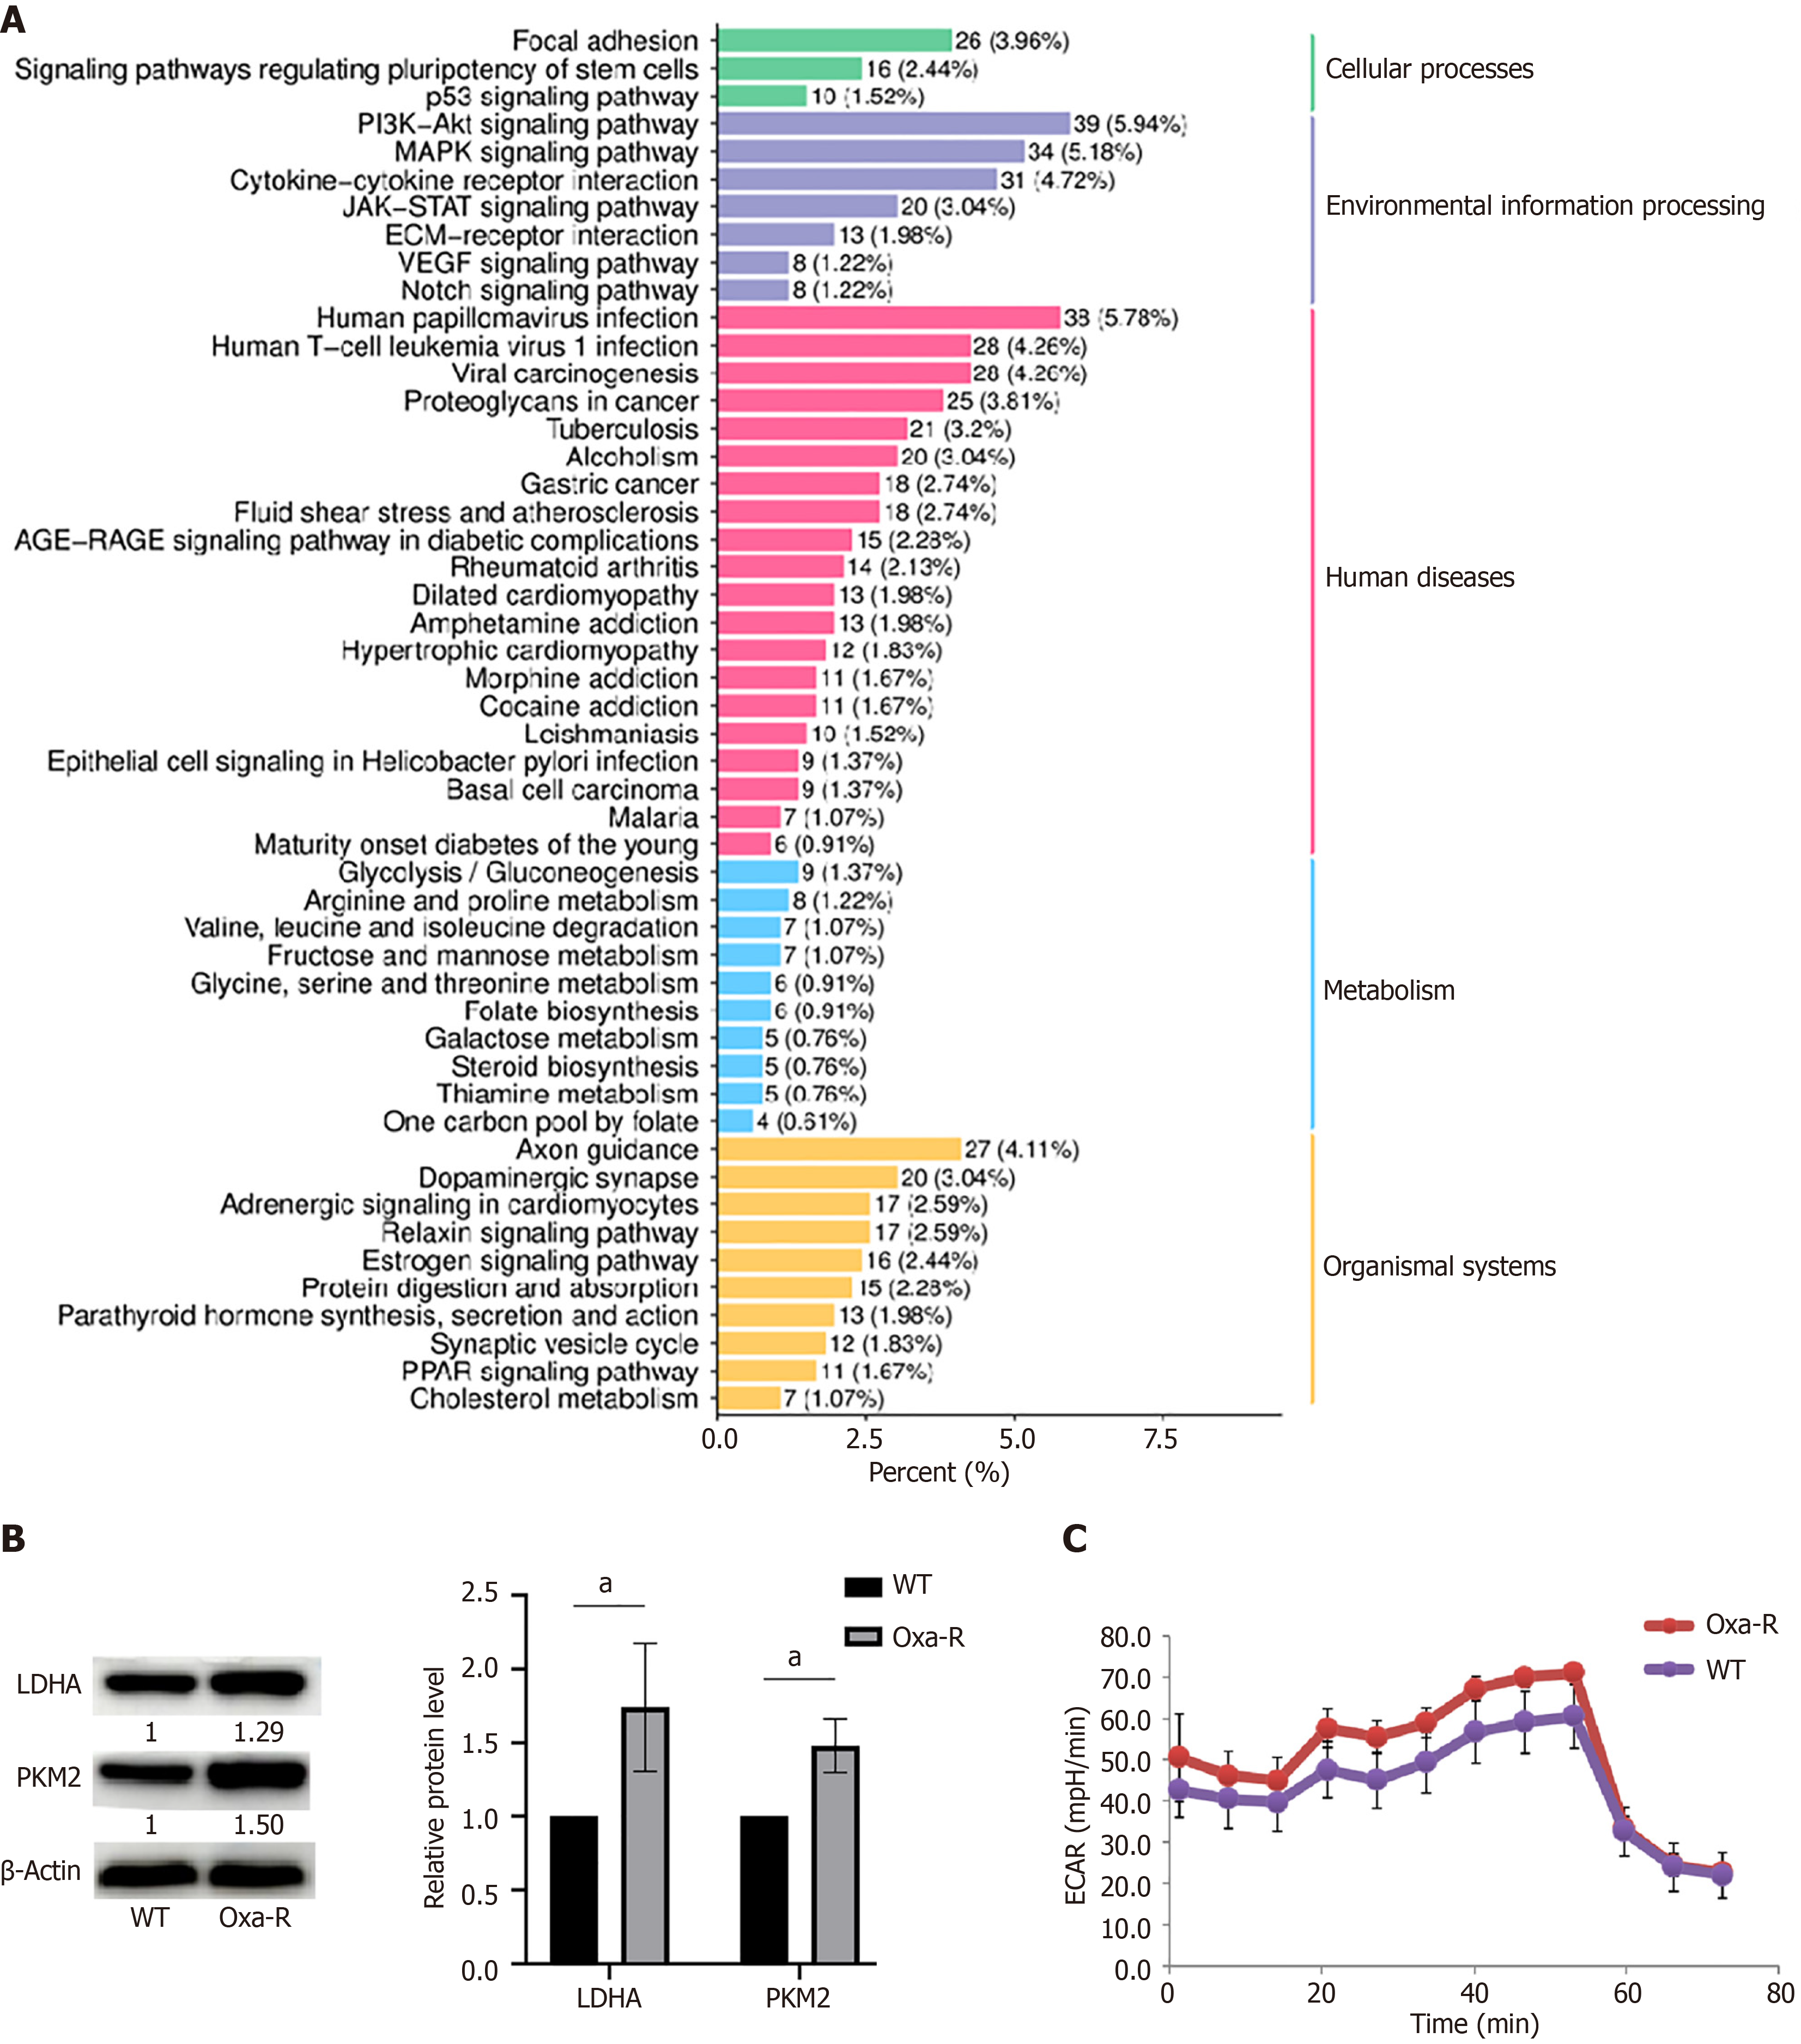
Figure 5 Increased glycolysis in Oxa-R colorectal cancer cells.
A: Enrichment analyses of the Kyoto Encyclopedia of Genes and Genomes pathways associated with resistance-related differentially expressed genes; B: Western blots to determine expression of the key glycolytic enzymes LDHA and PKM2 in HCT116-WT and HCT116 Oxa-R cells. Each bar represents means ± SD of three separate experiments. aP < 0.05. β-Actin was used as the internal reference; C: HCT116-WT and HCT116 Oxa-R cells were seeded in 96-well Seahorse assay plates, and glucose (100 mmol/L), oligomycin (10 μM) and 2-DG (500 mmol/L) were successively added to measure the extracellular acidification rate.
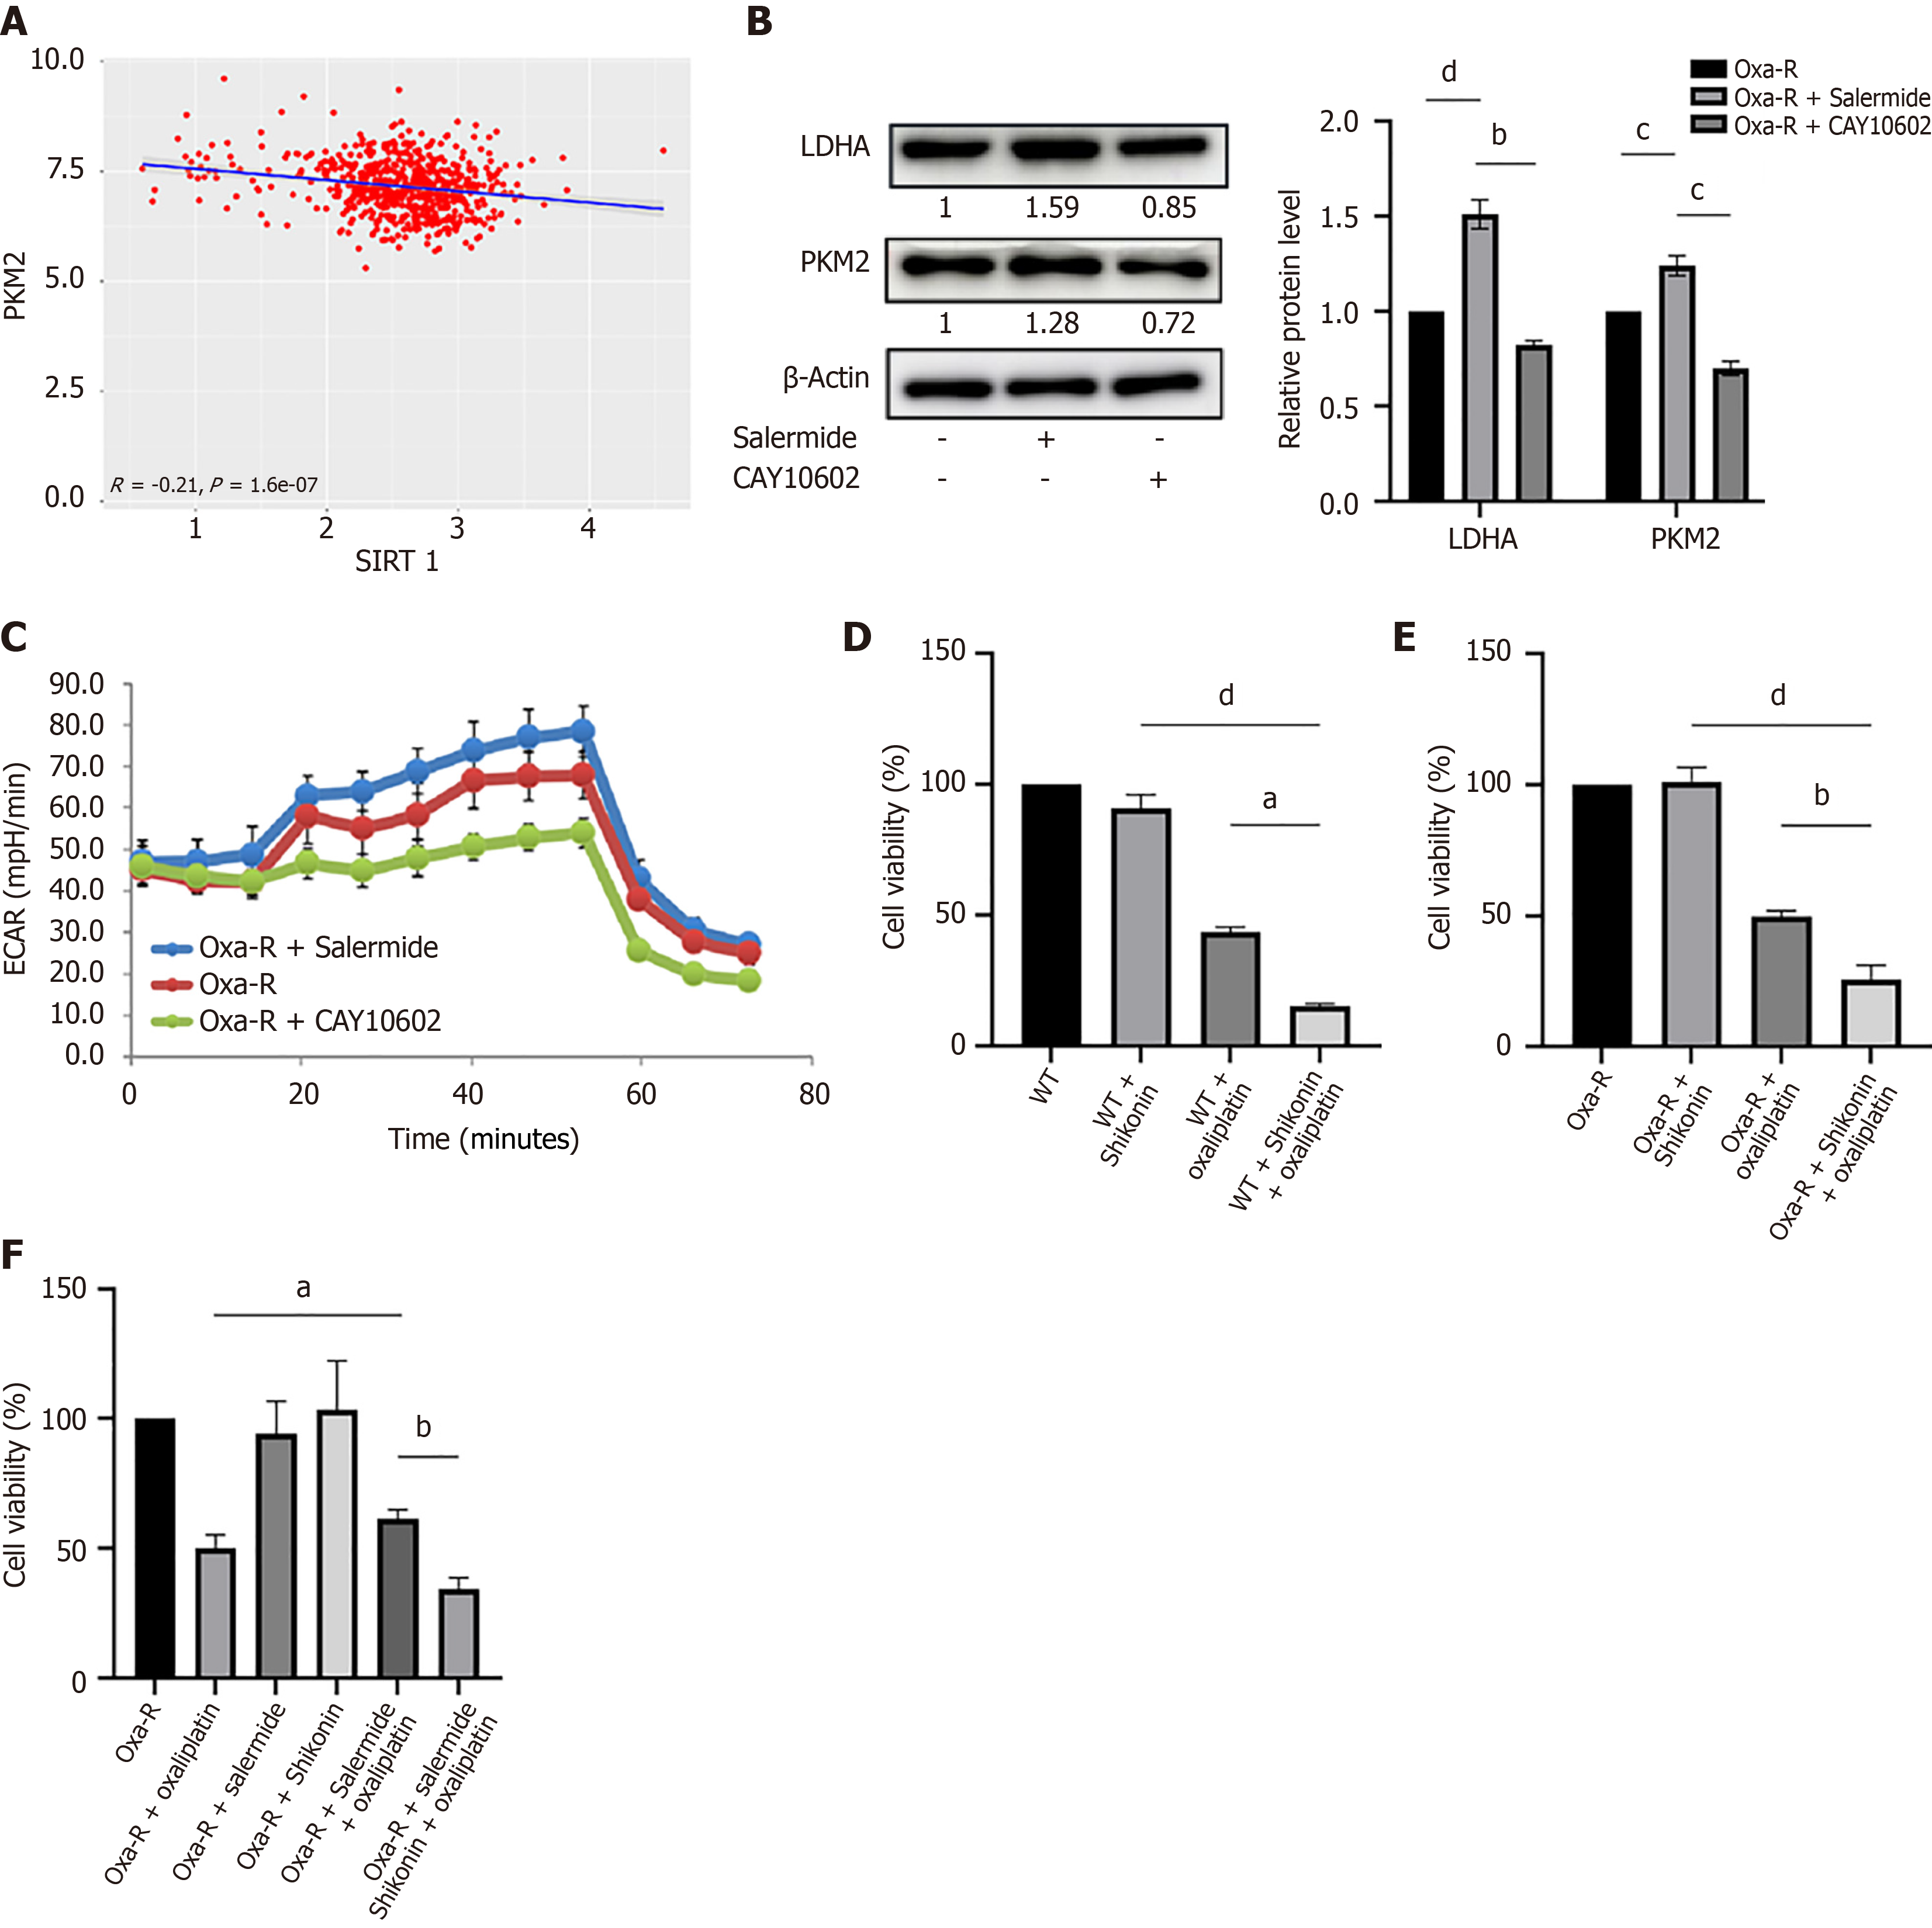
Figure 6 SIRT1 influences oxaliplatin resistance in colorectal cancer cells by regulating glycolysis.
A: Analysis of the Cancer Genome Atlas data shows the correlation between SIRT1 and PKM2 expression in colorectal cancer; B: Western blot analysis revealed the expression of LDHA and PKM2 in HCT116 Oxa-R cells after treatment with salermide (10 μM) or CAY10602 (20 μM) for 12 hours. Each bar represents means ± SD of three separate experiments. bP < 0.01; cP < 0.001; dP < 0.0001. β-Actin served as the internal reference; C: Measurement of the extracellular acidification rate in HCT116 Oxa-R cells with increased or inhibited SIRT1 expression; D: MTS results after 24 hours of treatment of HCT116-WT cells with oxaliplatin (40 μM) alone, shikonin (1 μM) alone, or oxaliplatin combined with shikonin. aP < 0.05; dP < 0.0001; E: MTS results after 24 hours of treatment of HCT116 Oxa-R cells with oxaliplatin (40 μM) alone, shikonin (1 μM) alone, or oxaliplatin combined with shikonin. bP < 0.01; dP < 0.0001; F: A rescue experiment using the MTS assay was performed to evaluate the effect of glycolysis inhibition on the enhanced resistance to oxaliplatin caused by low SIRT1 expression. The Oxa-R cells were treated with oxaliplatin (40 μM) alone, shikonin (1 μM) alone, salermide (10 μM) alone, oxaliplatin (40 μM) combined with salermide (10 μM), or oxaliplatin (40 μM) combined with salermide (10 μM) and shikonin (1 μM) for 24 hours. aP < 0.05; bP < 0.01.
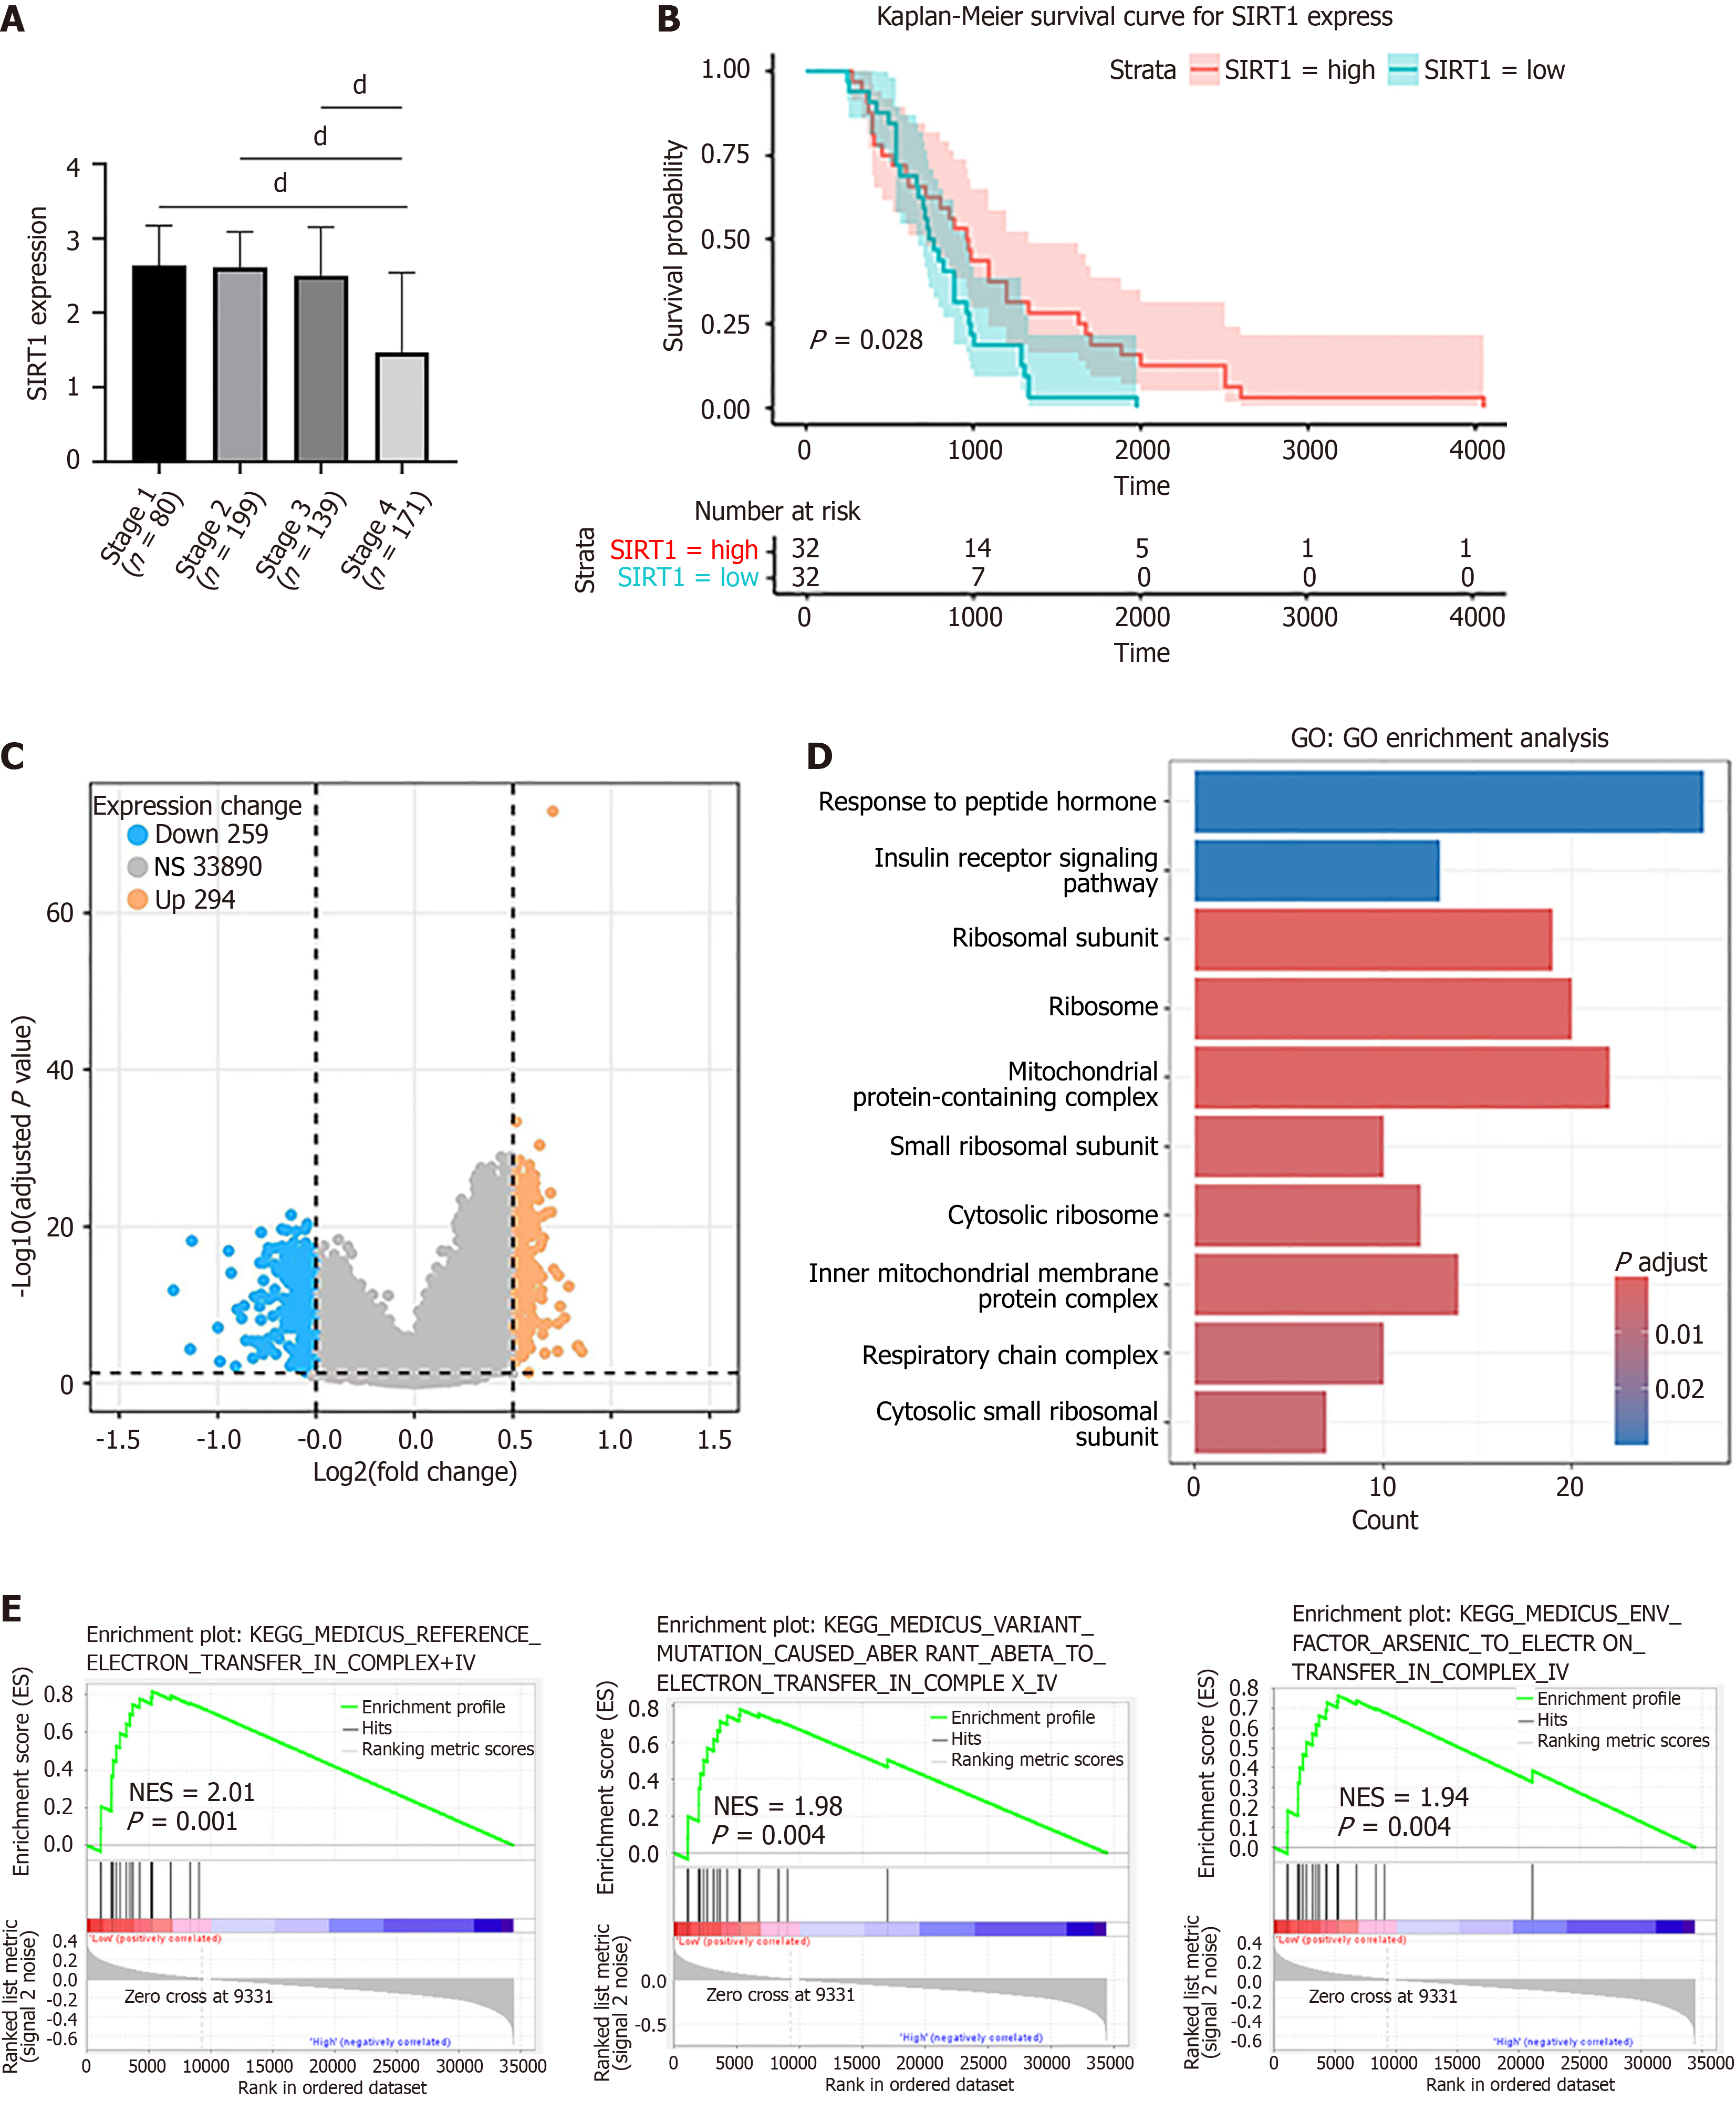
Figure 7 Integrated analysis expression, prognostic value and associated molecular pathways of SIRT1 in colorectal cancer.
A: Relationships between SIRT1 mRNA levels and individual cancer stages of colorectal cancer (CRC). dP < 0.0001; B: Relationships between SIRT1 mRNA levels and overall survival of CRC patients undergoing adjuvant chemotherapy were conducted using Kaplan-Meier analysis; C: Volcano plot of differentially expressed genes in CRC patients with high and low SIRT1 mRNA expression. Yellow dots represent upregulated genes; blue dots represent downregulated genes; gray dots represent non-significant genes; D: Gene Ontology functional enrichment analysis of differentially expressed genes; E: Gene Set Enrichment analysis in the low SIRT1 mRNA expression group. NES: Normalized enrichment scores.
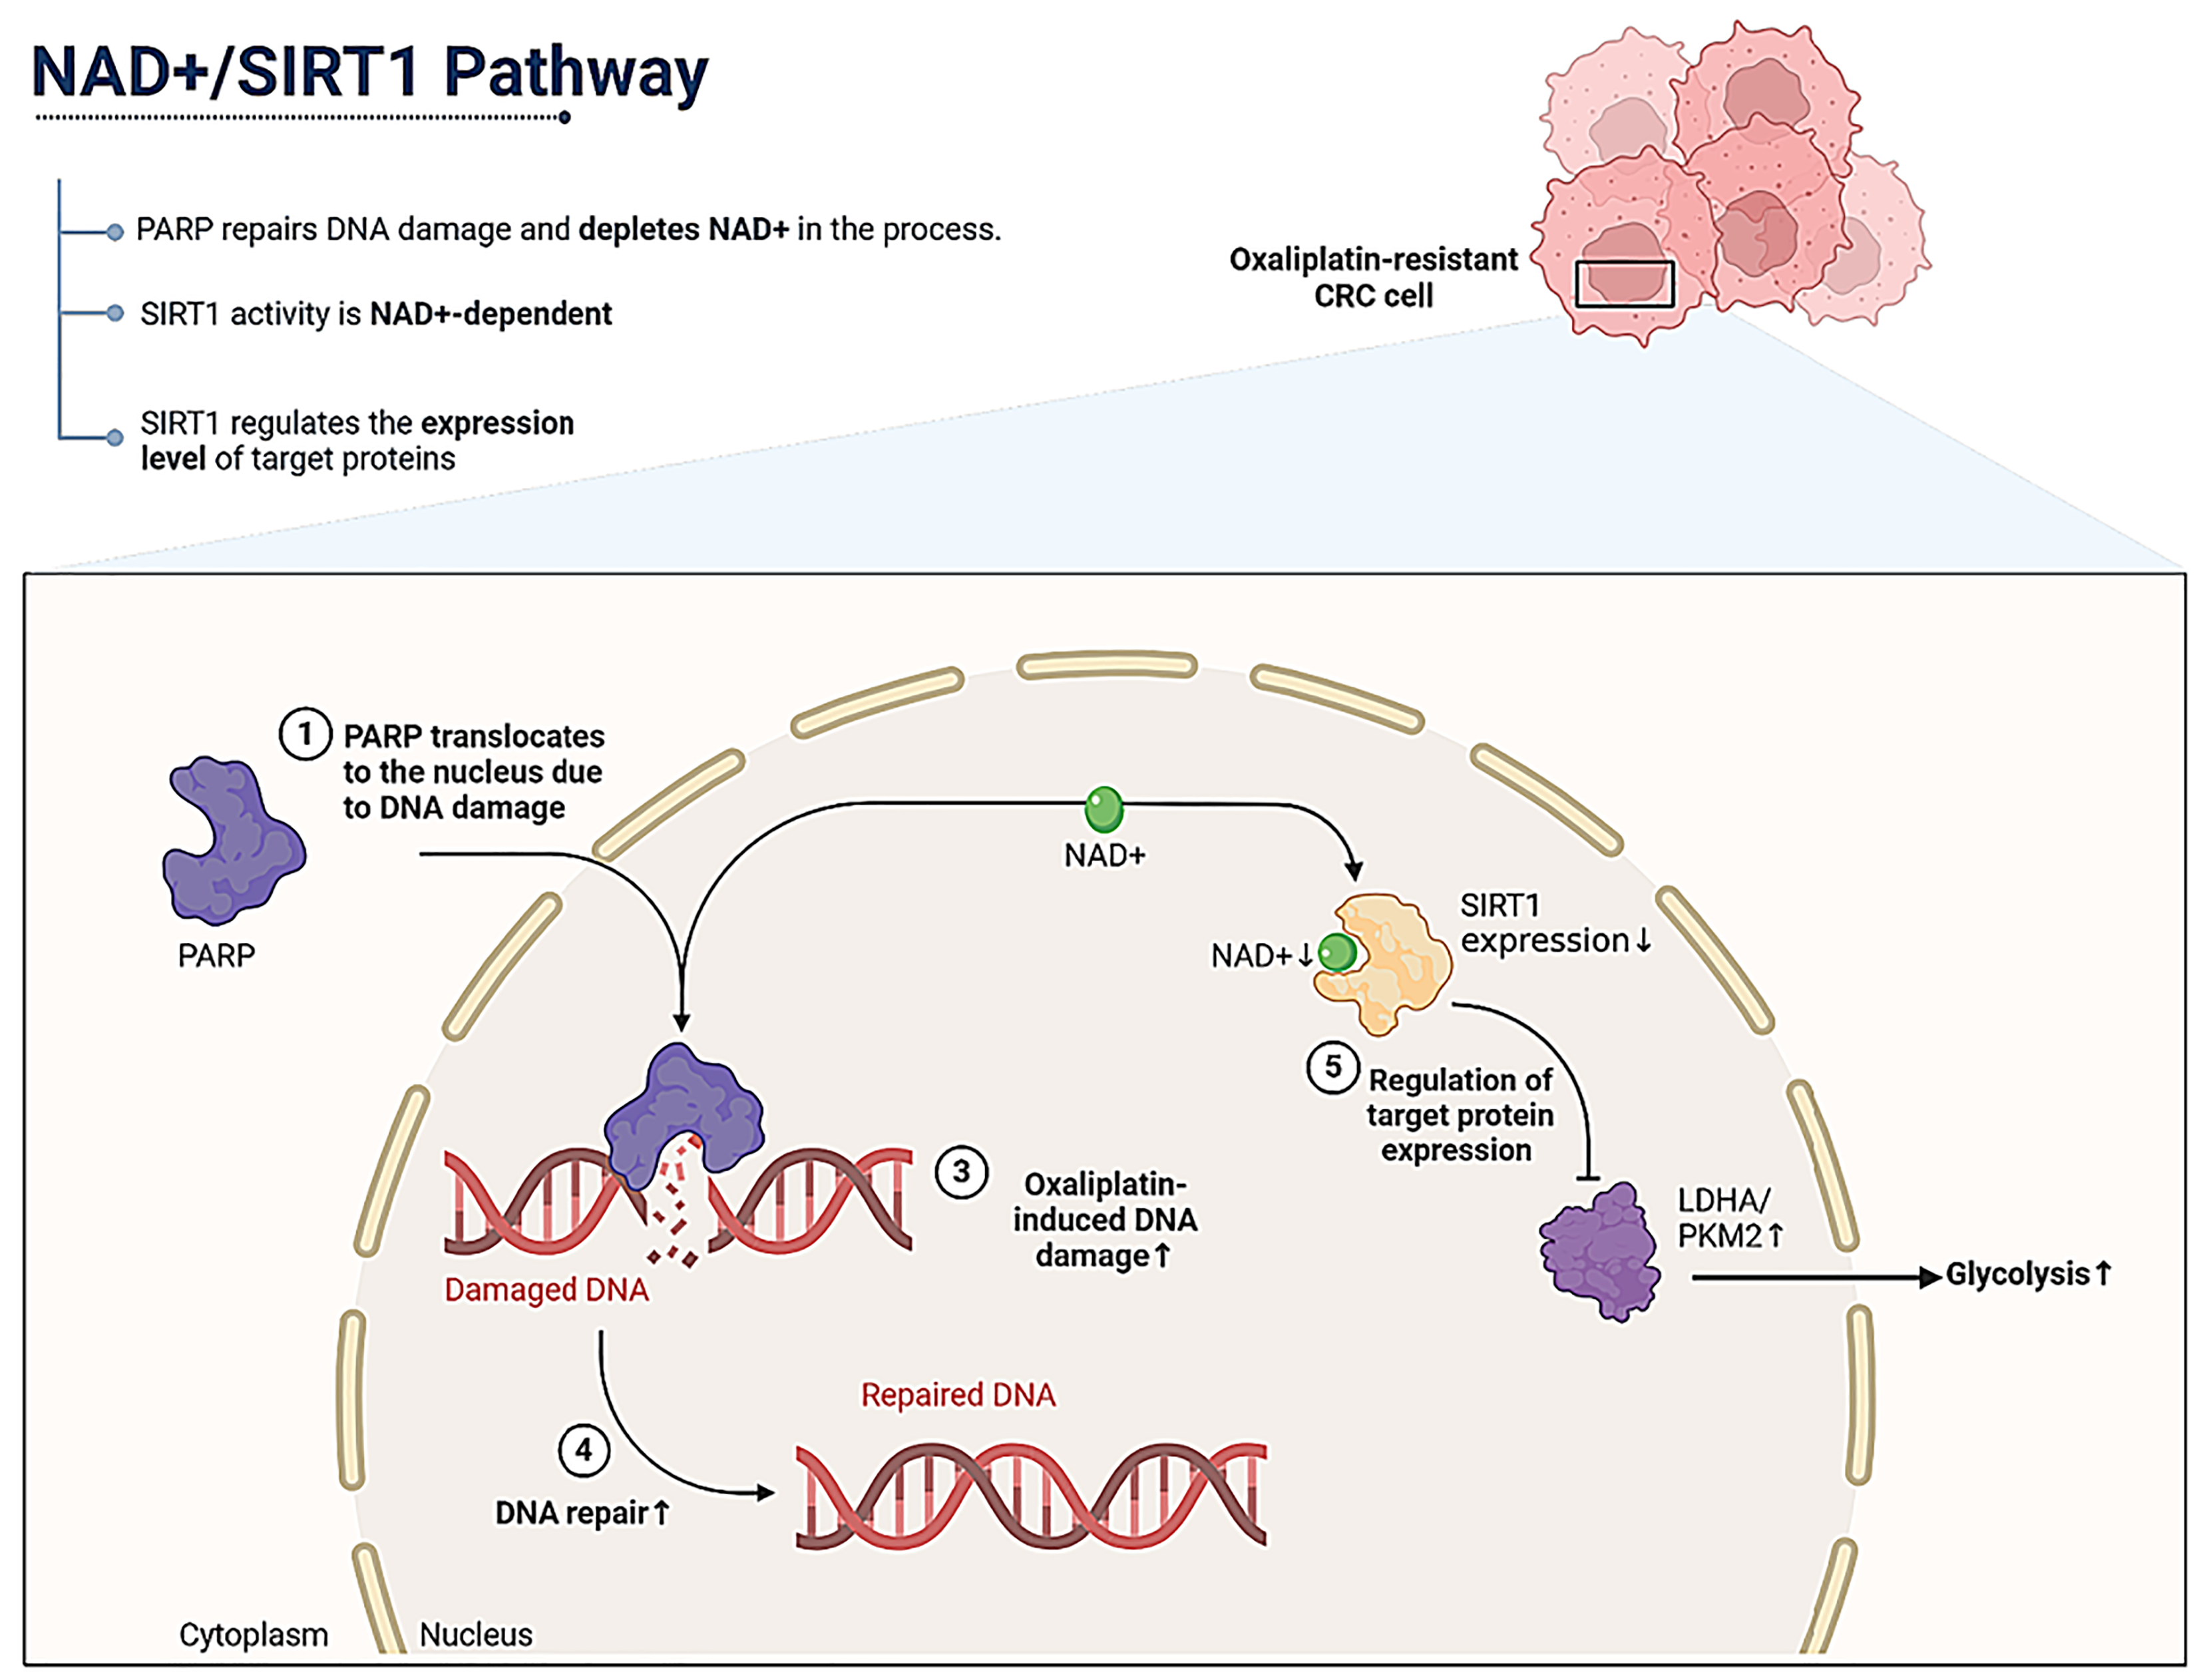
Figure 8 Schematic diagram of SIRT1 inhibition-driven glycolysis and oxaliplatin resistance in colorectal cancer cells.
DNA damage, a crucial driver of increased glycolysis in colorectal cancer (CRC) cells, exerts its effect primarily through PARP activation, which depletes intracellular NAD+, thereby inhibiting SIRT1 expression. Enhanced glycolysis in CRC cells via SIRT1 inhibition, which contributes to oxaliplatin resistance. CRC: Colorectal cancer.
- Citation: Niu YR, Xiang MD, Yang WW, Fang YT, Qian HL, Sun YK. NAD+/SIRT1 pathway regulates glycolysis to promote oxaliplatin resistance in colorectal cancer. World J Gastroenterol 2025; 31(11): 100785
- URL: https://www.wjgnet.com/1007-9327/full/v31/i11/100785.htm
- DOI: https://dx.doi.org/10.3748/wjg.v31.i11.100785


