Copyright
©The Author(s) 2025.
World J Gastroenterol. Mar 14, 2025; 31(10): 103133
Published online Mar 14, 2025. doi: 10.3748/wjg.v31.i10.103133
Published online Mar 14, 2025. doi: 10.3748/wjg.v31.i10.103133
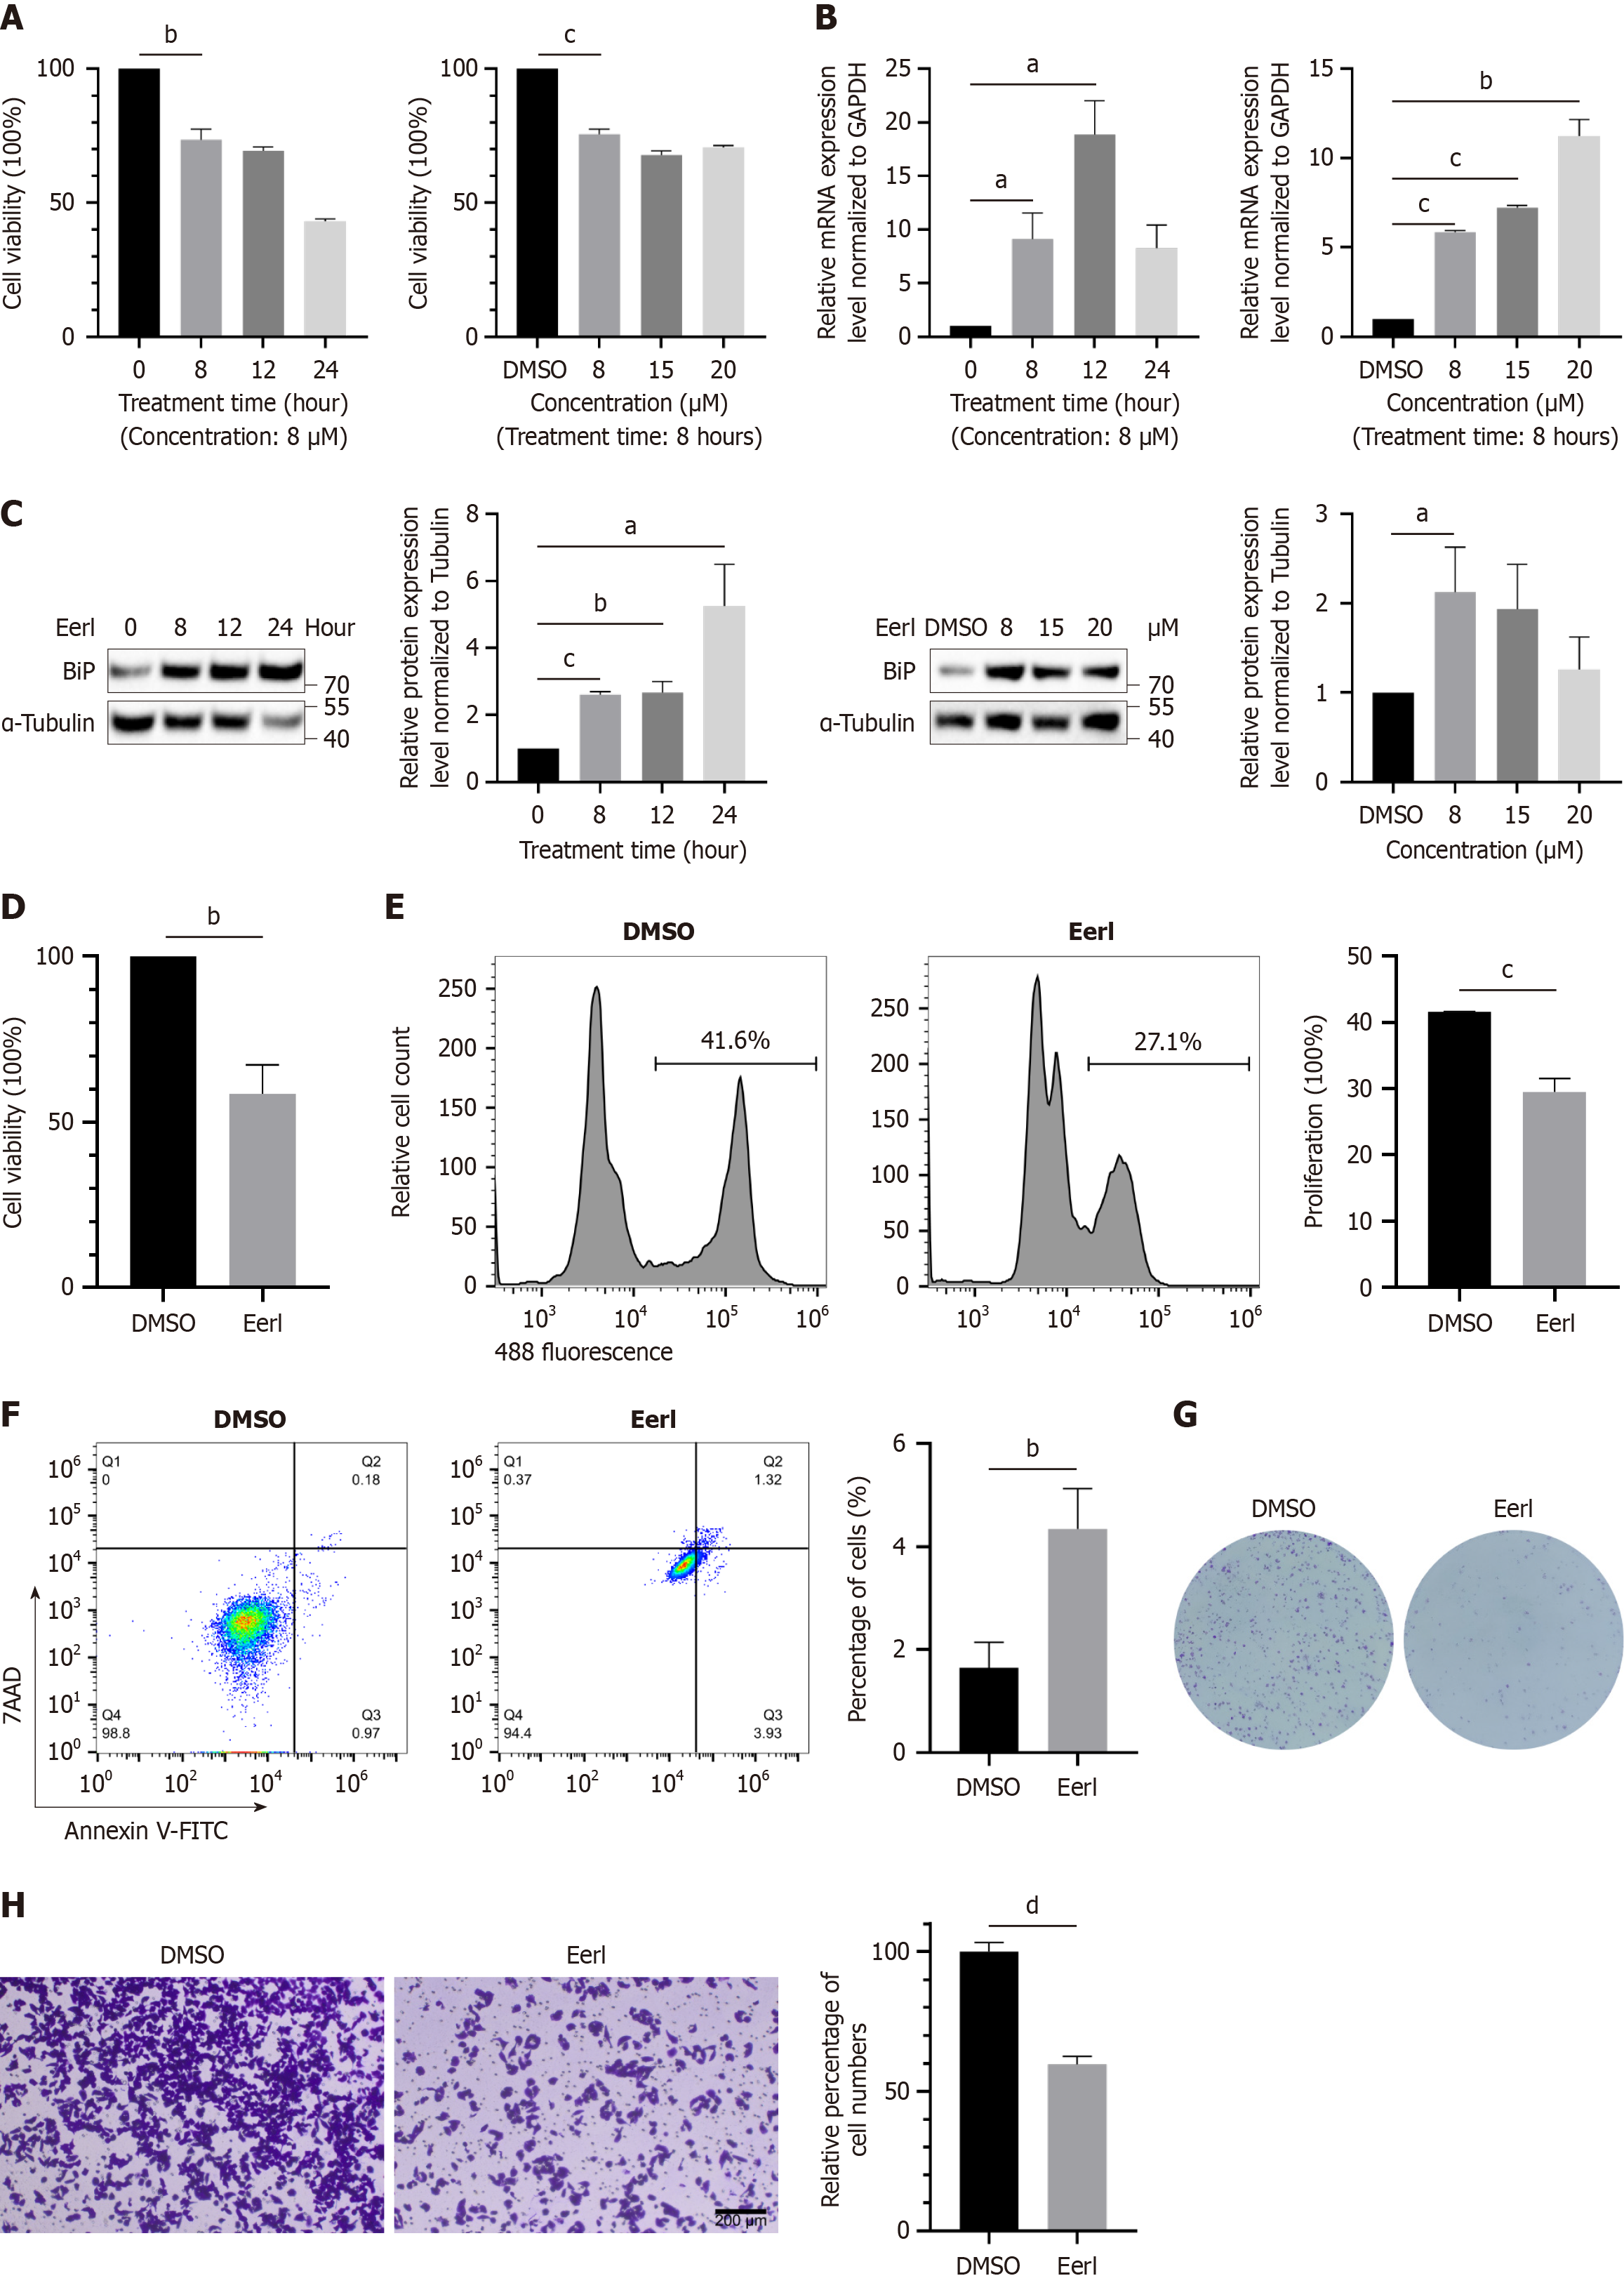
Figure 1 Endoplasmic reticulum-associated protein degradation inhibitor treatment significantly inhibited the growth of Huh7 cells.
A: Time course and concentration course of endoplasmic reticulum-associated protein degradation (ERAD) inhibitor treatment; B: Heavy-chain binding protein mRNA expression at different time points and concentrations of the inhibitor; C: Protein expression at different time points and concentrations of the inhibitor; D: The proliferation of Huh7 cells in the dimethyl sulfoxide (DMSO) and ERAD inhibitor groups was assessed using cell counting kit-8; E: The proliferation of Huh7 cells in the dimethyl sulfoxide and ERAD inhibitor groups was assessed using 5-Ethynyl-2’-deoxyuridine; F: The apoptosis rate of Huh7 cells treated with DMSO or the ERAD inhibitor was assessed using annexin V-fluorescein isothiocyanate/7-aminoactinomycin D staining; G: The proliferation of Huh7 cells in the DMSO and ERAD inhibitor groups was assessed using clone formation assays; H: The migration ability of DMSO or ERAD inhibitor treated Huh7 cells was detected by the transwell assay. aP < 0.05. bP < 0.01. cP < 0.001. dP < 0.0001. DMSO: Dimethyl sulfoxide; GAPDH: Glyceraldehyde-3-phosphate dehydrogenase; BiP: Heavy-chain binding protein; EerI: Eeyarestatin I; 7AAD: 7-aminoactinomycin D staining; V-FITC: V-fluorescein isothiocyanate.
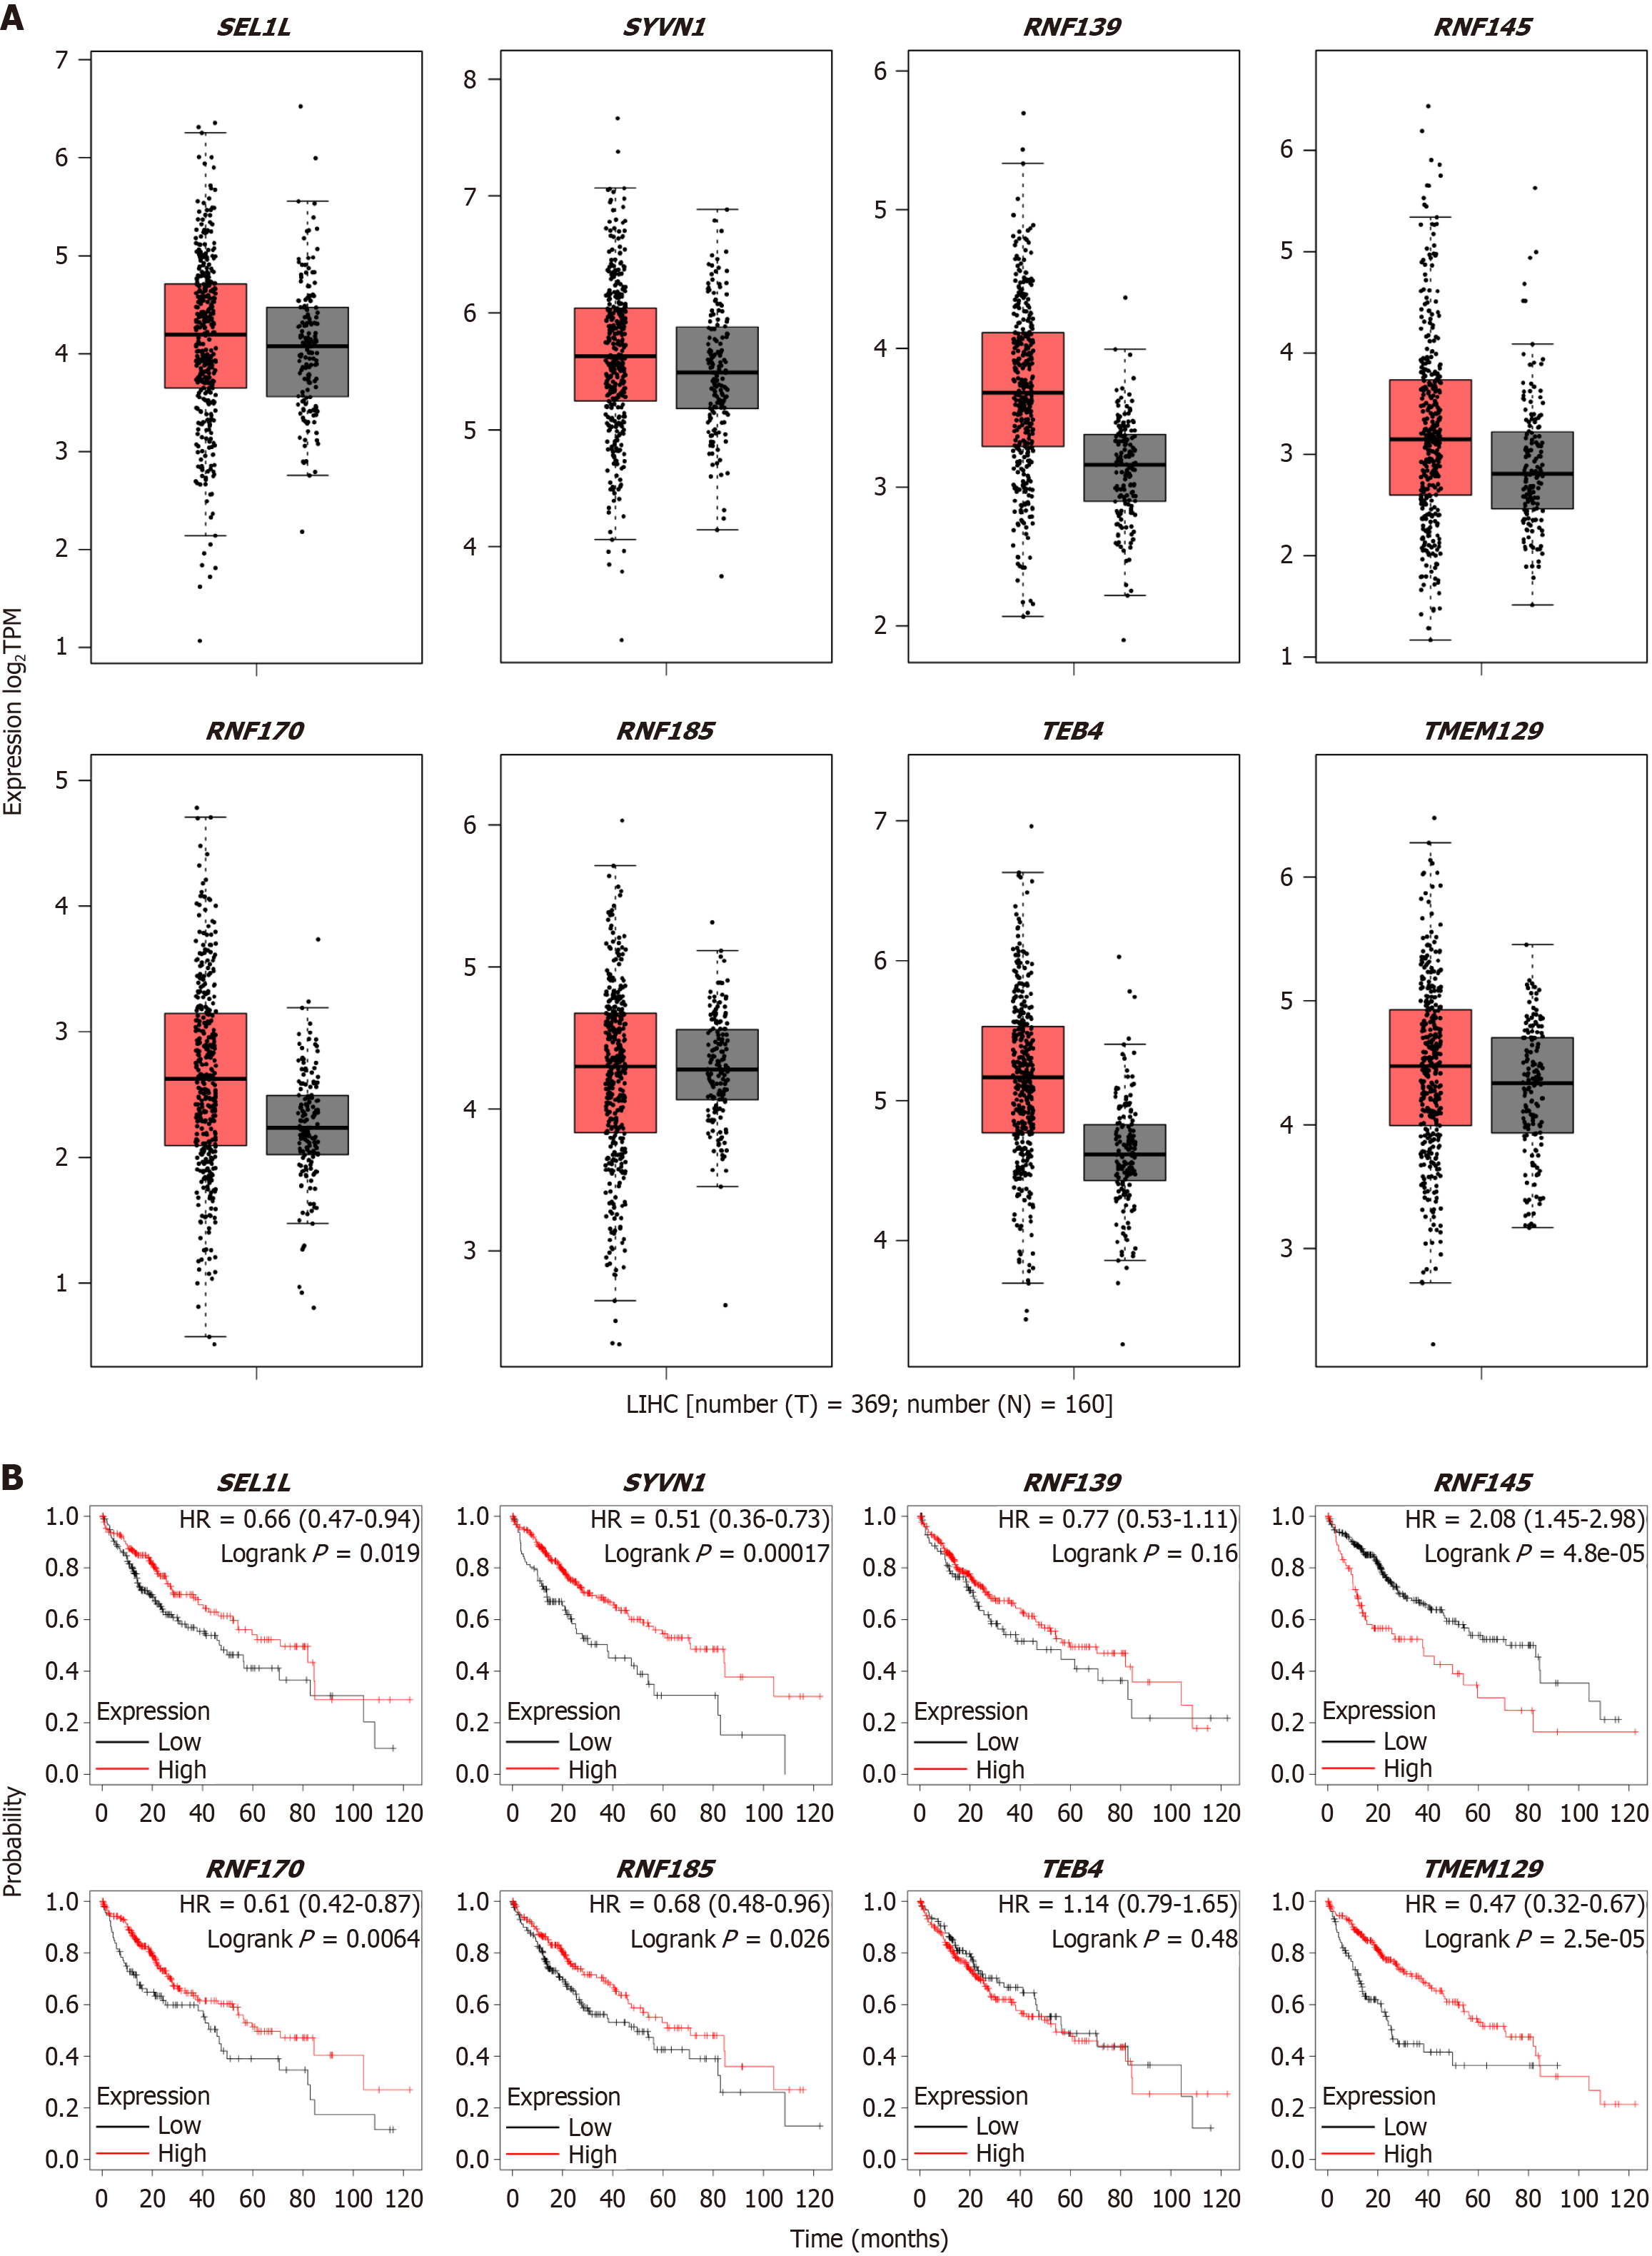
Figure 2 Different endoplasmic reticulum-associated protein degradation complex expression in liver hepatocellular carcinoma.
A: Different endoplasmic reticulum-associated protein degradation (ERAD) complex gene expression analyses in liver hepatocellular carcinoma using GEPIA2; B: Survival analysis between different ERAD genes and prognosis. T: Tumor; N: Normal; TPM: Transcripts per million; LIHC: Liver hepatocellular carcinoma; HR: Hazard ratio.
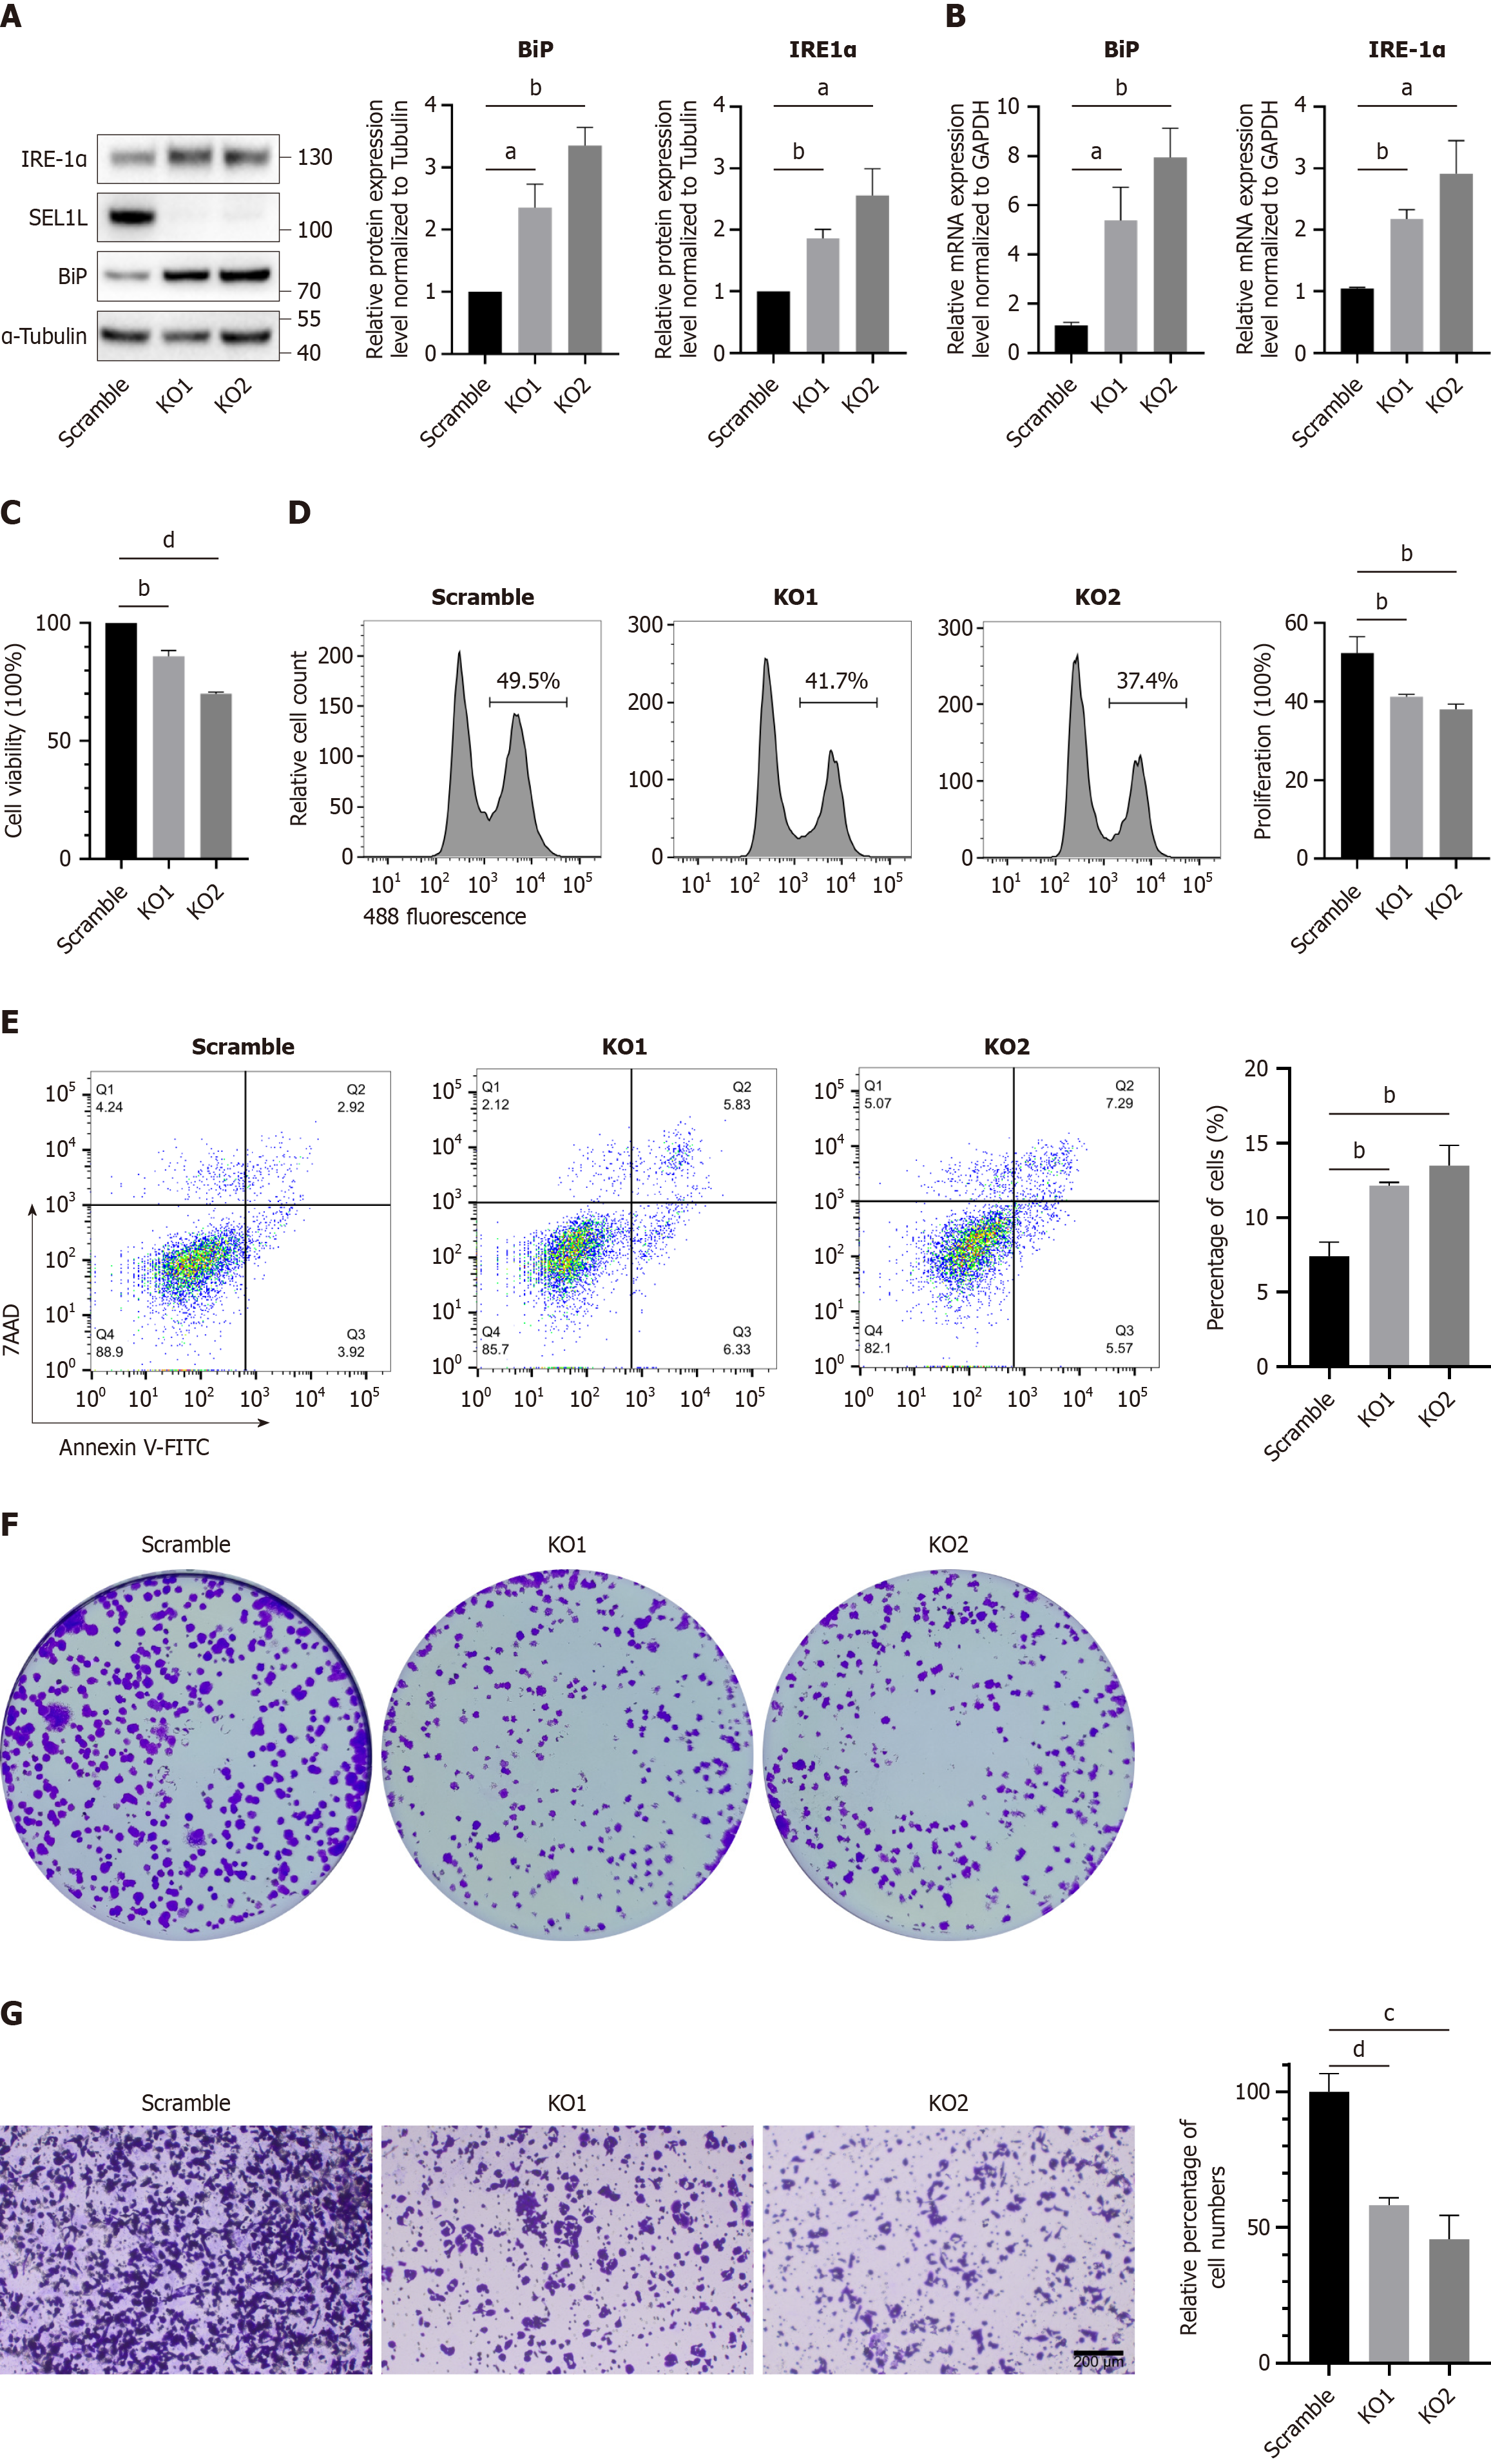
Figure 3 SEL1L knockout affected the growth of Huh7 cells.
A: Western blot analysis of heavy-chain binding protein (BiP) and inositol-requiring enzyme (IRE)-1α after SEL1L knockout in Huh7 cells; B: Quantitative real-time polymerase chain reaction was conducted to assess BiP expression and IRE-1α expression; C: The proliferation of scramble and SEL1L knockout Huh7 cells was assessed using the cell counting kit-8; D: The proliferation of scramble and SEL1L knockout Huh7 cells was assessed using the 5-Ethynyl-2’-deoxyuridine; E: The apoptosis rate in scramble and SEL1L knockout Huh7 cells was assessed using annexin V-fluorescein isothiocyanate/7-aminoactinomycin D staining; F: The proliferation of scramble and SEL1L knockout Huh7 cells was assessed using the clone formation assays; G: The migration ability of SEL1L knockout Huh7 cells was detected by the transwell assay. aP < 0.05. bP < 0.01. cP < 0.001. dP < 0.0001. GAPDH: Glyceraldehyde-3-phosphate dehydrogenase; BiP: Heavy-chain binding protein; IRE-1α: Inositol-requiring enzyme-1α; KO: Knockout; 7AAD: 7-aminoactinomycin D staining; V-FITC: V-fluorescein isothiocyanate.
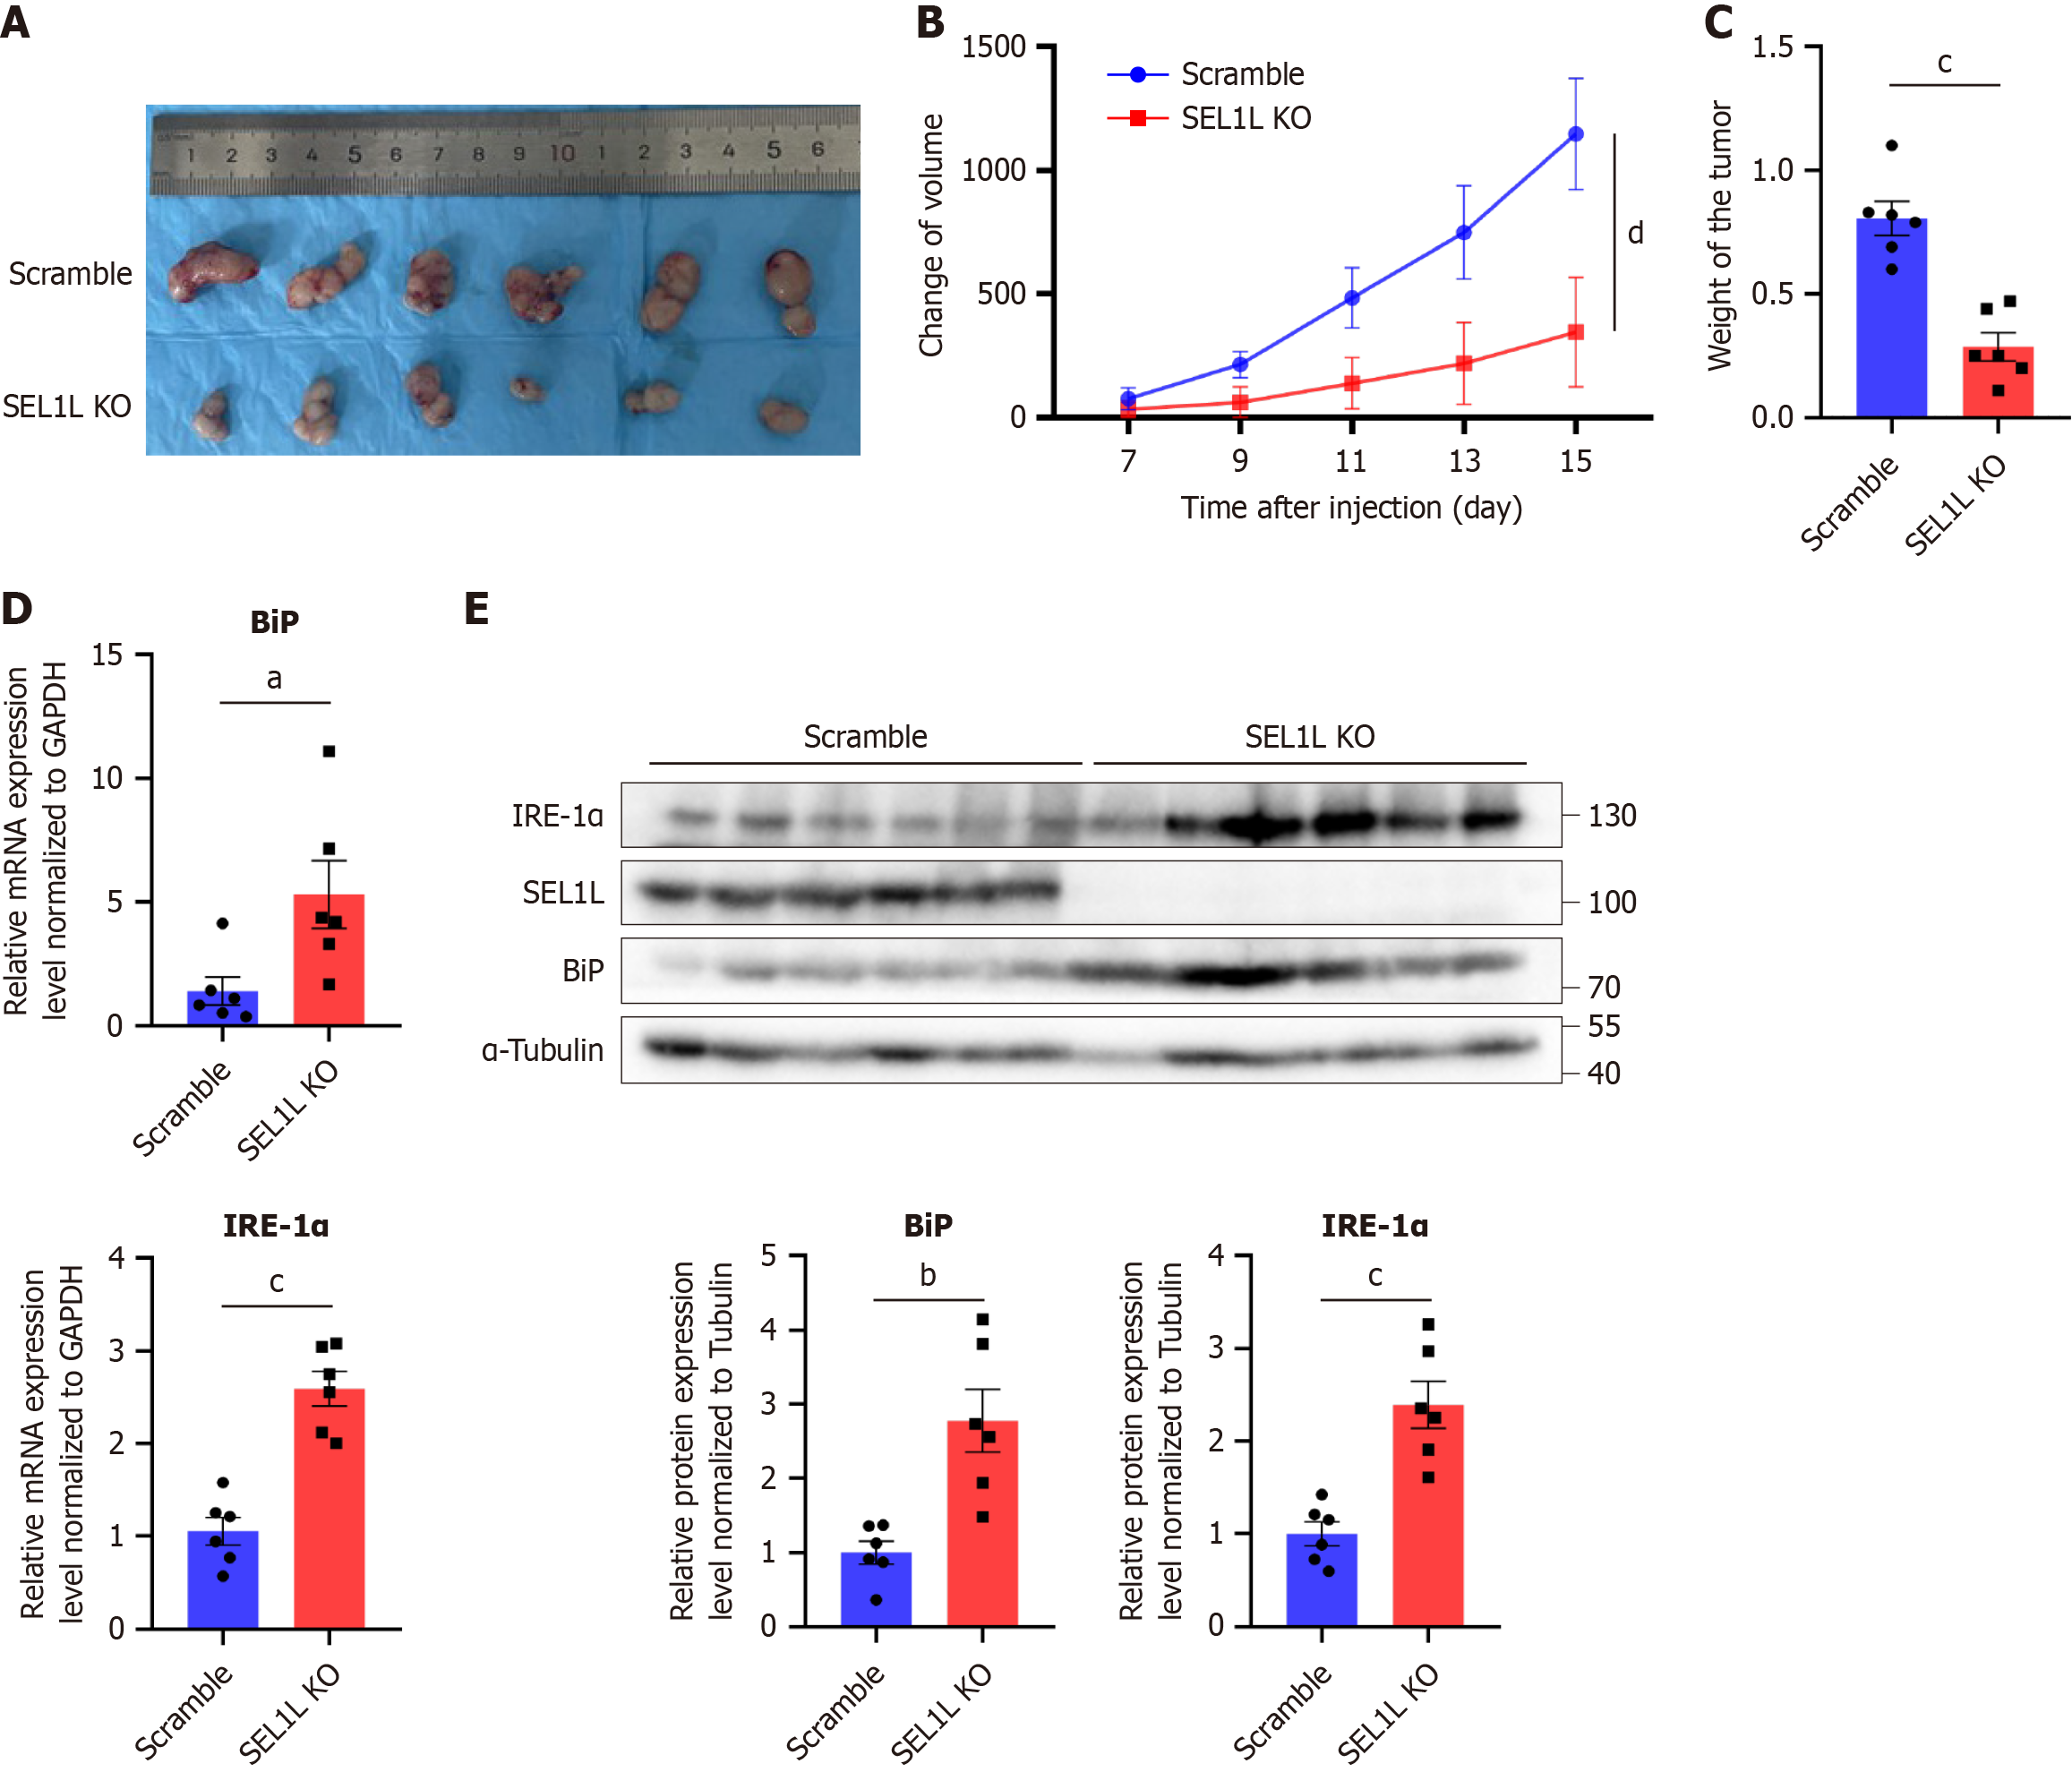
Figure 4 SEL1L knockout affected the tumor growth in vivo.
A: Subcutaneous xenografts dissected from mice at the endpoint; B: Subcutaneous tumor growth curves in nude mice (n = 6); C: Subcutaneous xenograft weights from mice at the endpoint; D: The mRNA expression of heavy-chain binding protein (BiP) and inositol-requiring enzyme (IRE)-1α was detected by quantitative real-time polymerase chain reaction. Each point represents a single sample; E: The protein expression of BiP and IRE-1α in the SEL1L knockout group was compared with the scramble group. aP < 0.05. bP < 0.01. cP < 0.001. dP < 0.0001. GAPDH: Glyceraldehyde-3-phosphate dehydrogenase; BiP: Heavy-chain binding protein; IRE-1α: Inositol-requiring enzyme-1α; KO: Knockout.
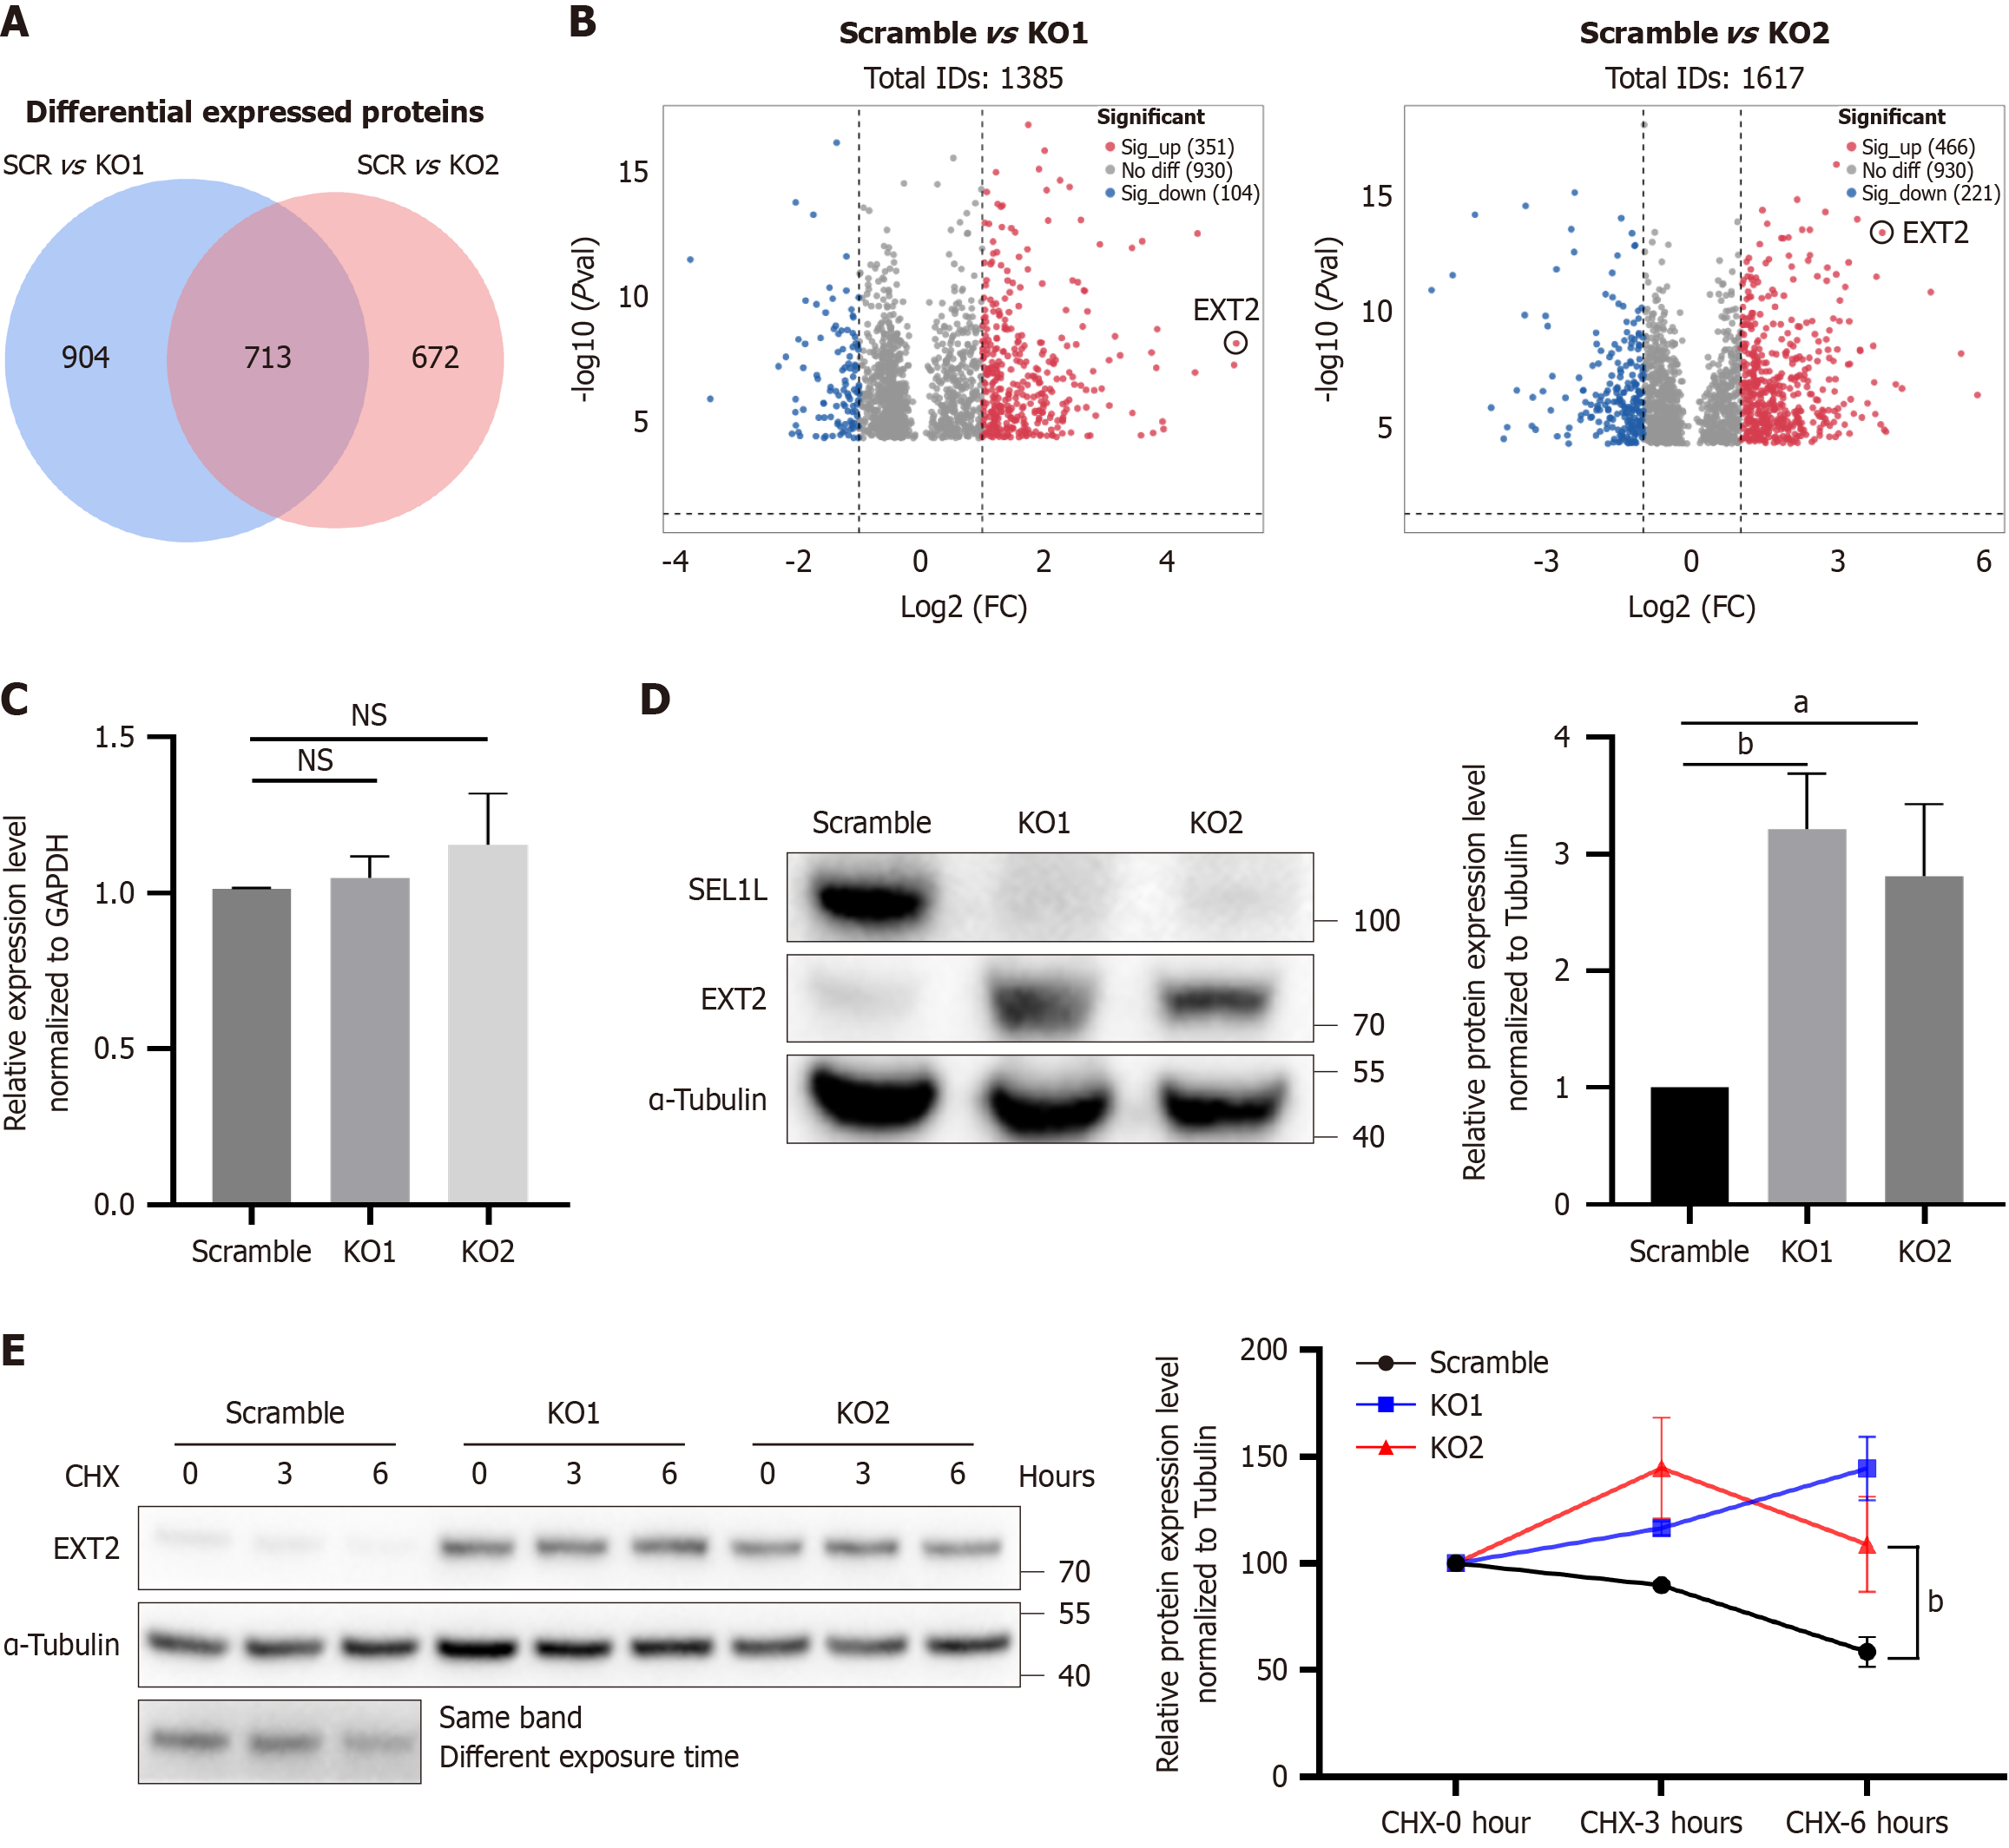
Figure 5 EXT2 was the main protein affected by SEL1L knockout in Huh7 cells.
A: Venn diagram; B: Volcano plot of differentially expressed genes from scramble and SEL1L knockout Huh7 cells; C: A quantitative real-time polymerase chain reaction assay was conducted to assess EXT2 expression in Huh7 cells following SEL1L knockout; D: Protein expression of EXT2 was detected by western blotting; E: Huh7 cells with either scramble or SEL1L knockout were cultured with or without cycloheximide, and then analyzed by western blotting using the specified antibodies. aP < 0.05. bP < 0.01. NS: Not significant; SCR: Scramble; KO: Knockout; FC: Fold change; GAPDH: Glyceraldehyde-3-phosphate dehydrogenase; CHX: Cycloheximide.
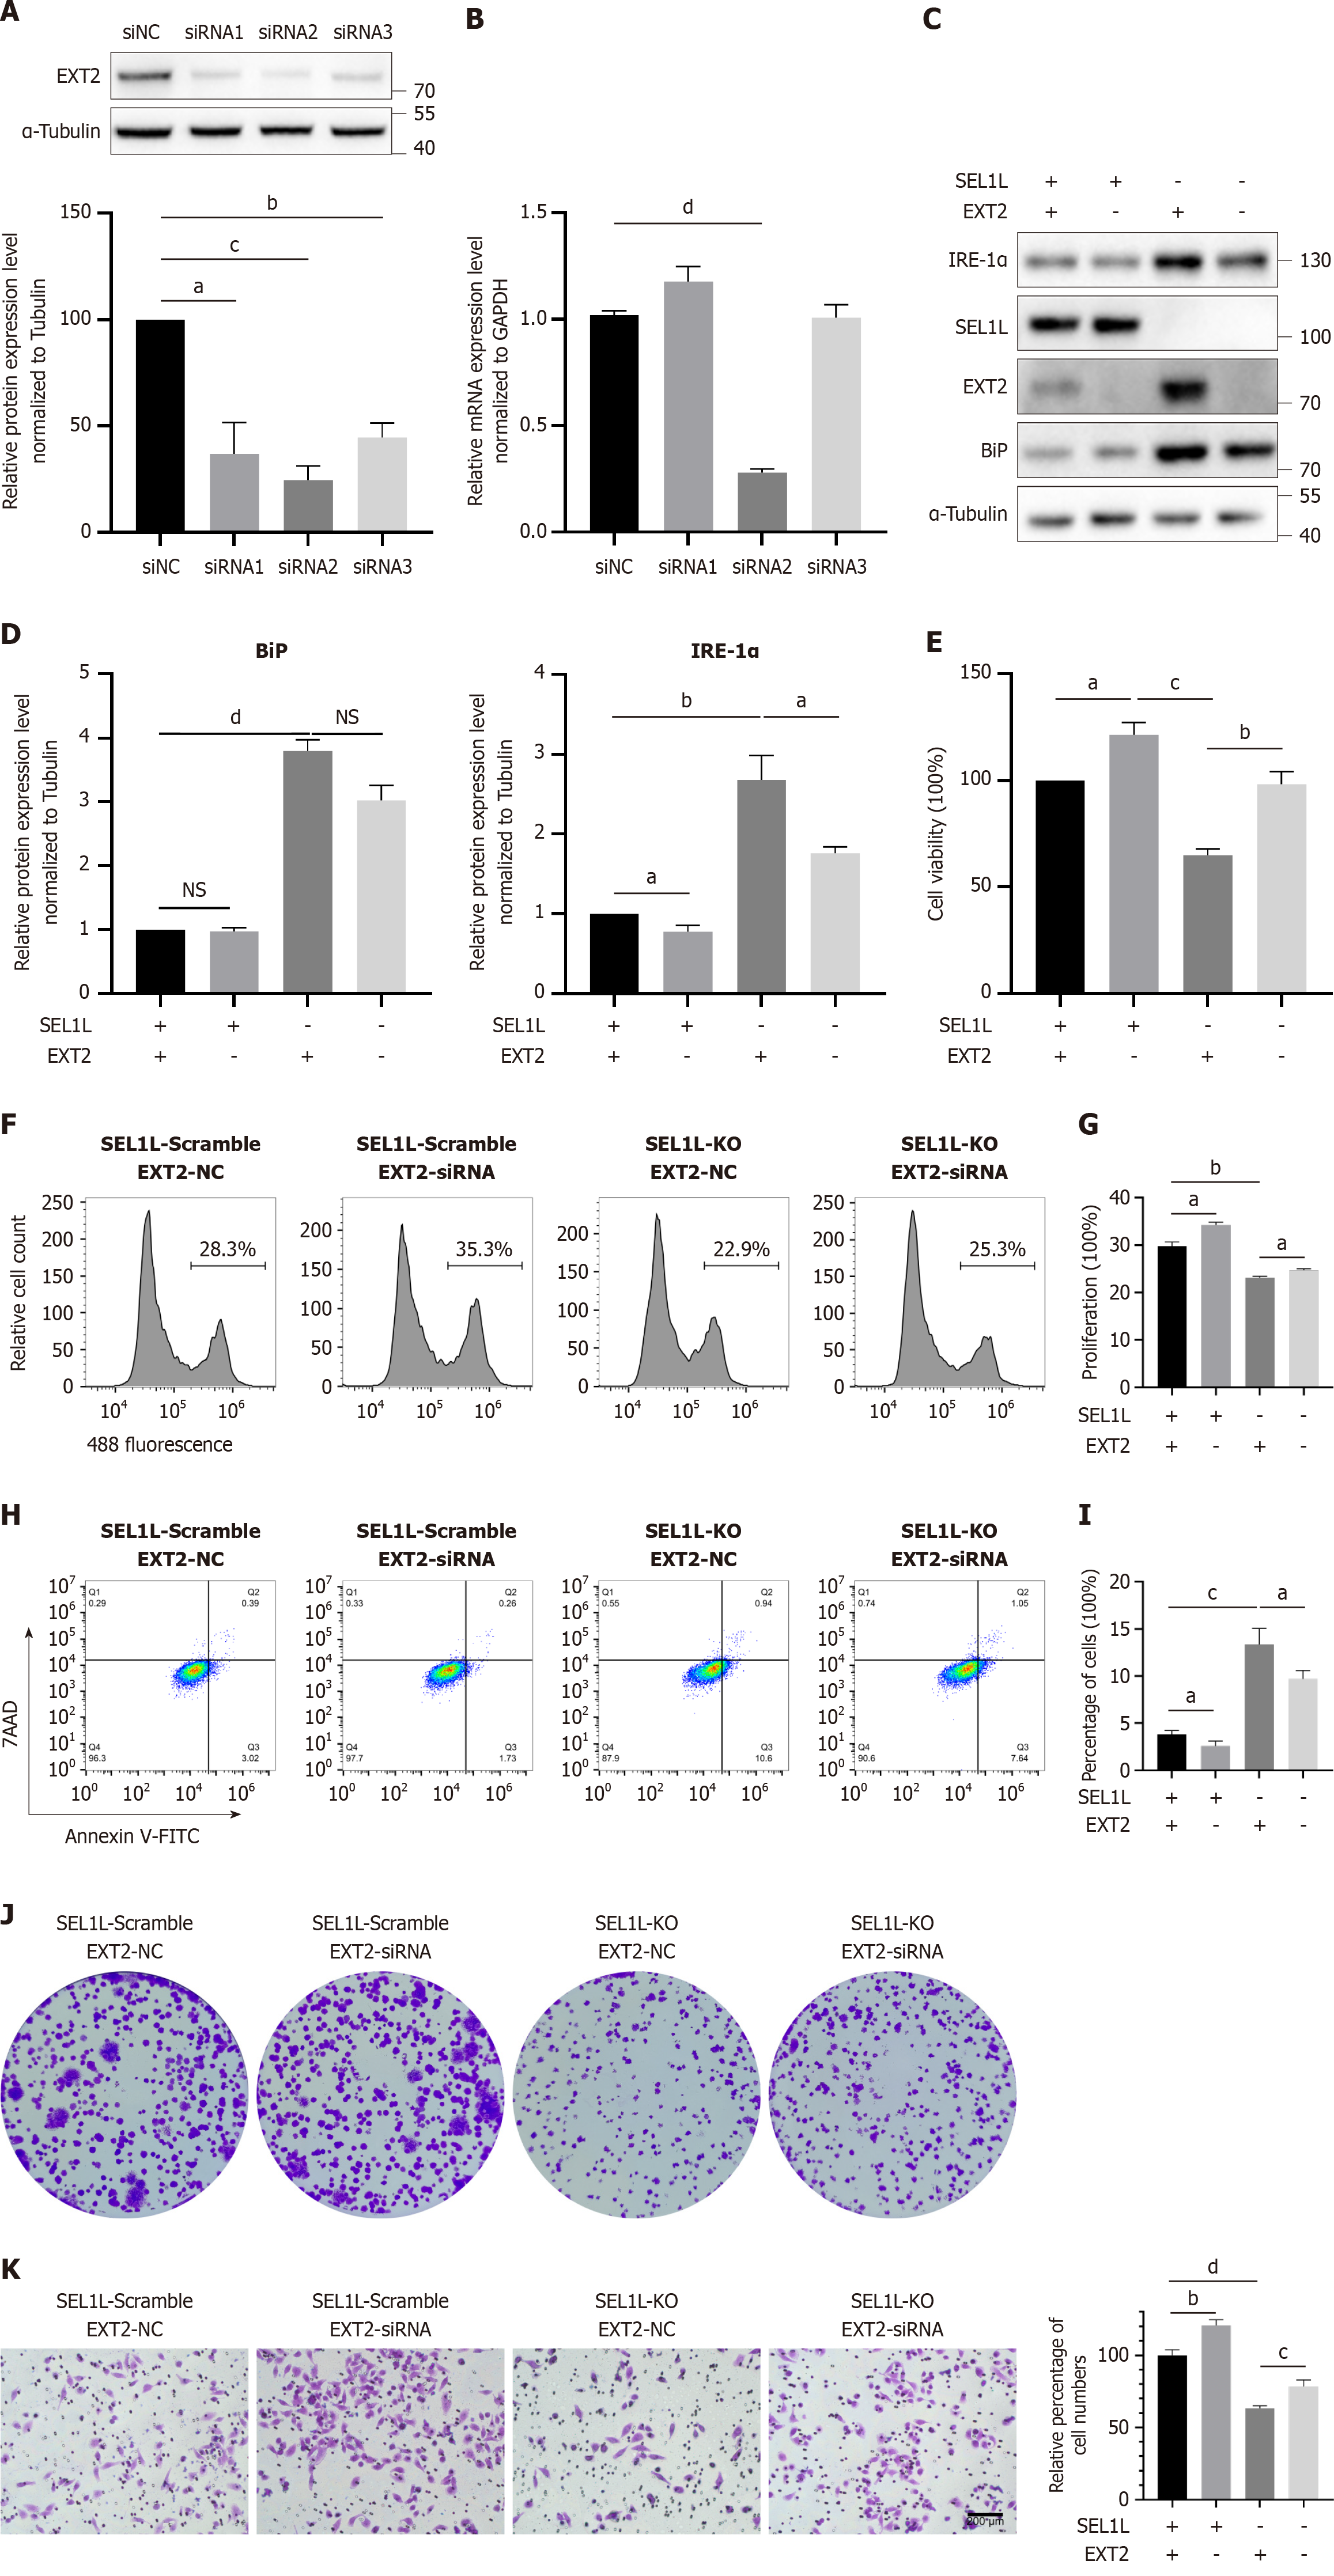
Figure 6 EXT2 knockdown partly reverses the impact of SEL1L knockout in Huh7 cells.
A: Western blot; B: Quantitative real-time polymerase chain reaction assay detected the efficiency of different siRNAs; C and D: Western blot analysis was conducted to assess the expression levels of EXT2, heavy-chain binding protein and inositol-requiring enzyme-1α following treatment; E: The proliferation of SEL1L knockout and EXT2 knockdown Huh7 cells was assessed using the cell counting kit-8; F and G: The proliferation of SEL1L knockout and EXT2 knockdown Huh7 cells was assessed using 5-Ethynyl-2’-deoxyuridine; H and I: The apoptosis rate of different Huh7 groups was detected by annexin V-fluorescein isothiocyanate/7-aminoactinomycin D staining; J: The proliferation of SEL1L knockout and EXT2 knockdown Huh7 cells was assessed using clone formation assays; K: The migration ability of SEL1L knockout and EXT2 knockdown Huh7 cells was detected by the transwell assay. aP < 0.05. bP < 0.01. cP < 0.001. dP < 0.0001. NS: Not significant; siNC: Small interfering RNA normal control; siRNA: Small interfering RNA; NC: Normal control; KO: Knockout; BiP: Heavy-chain binding protein; IRE-1α: Inositol-requiring enzyme-1α; 7AAD: 7-aminoactinomycin D staining; V-FITC: V-fluorescein isothiocyanate.
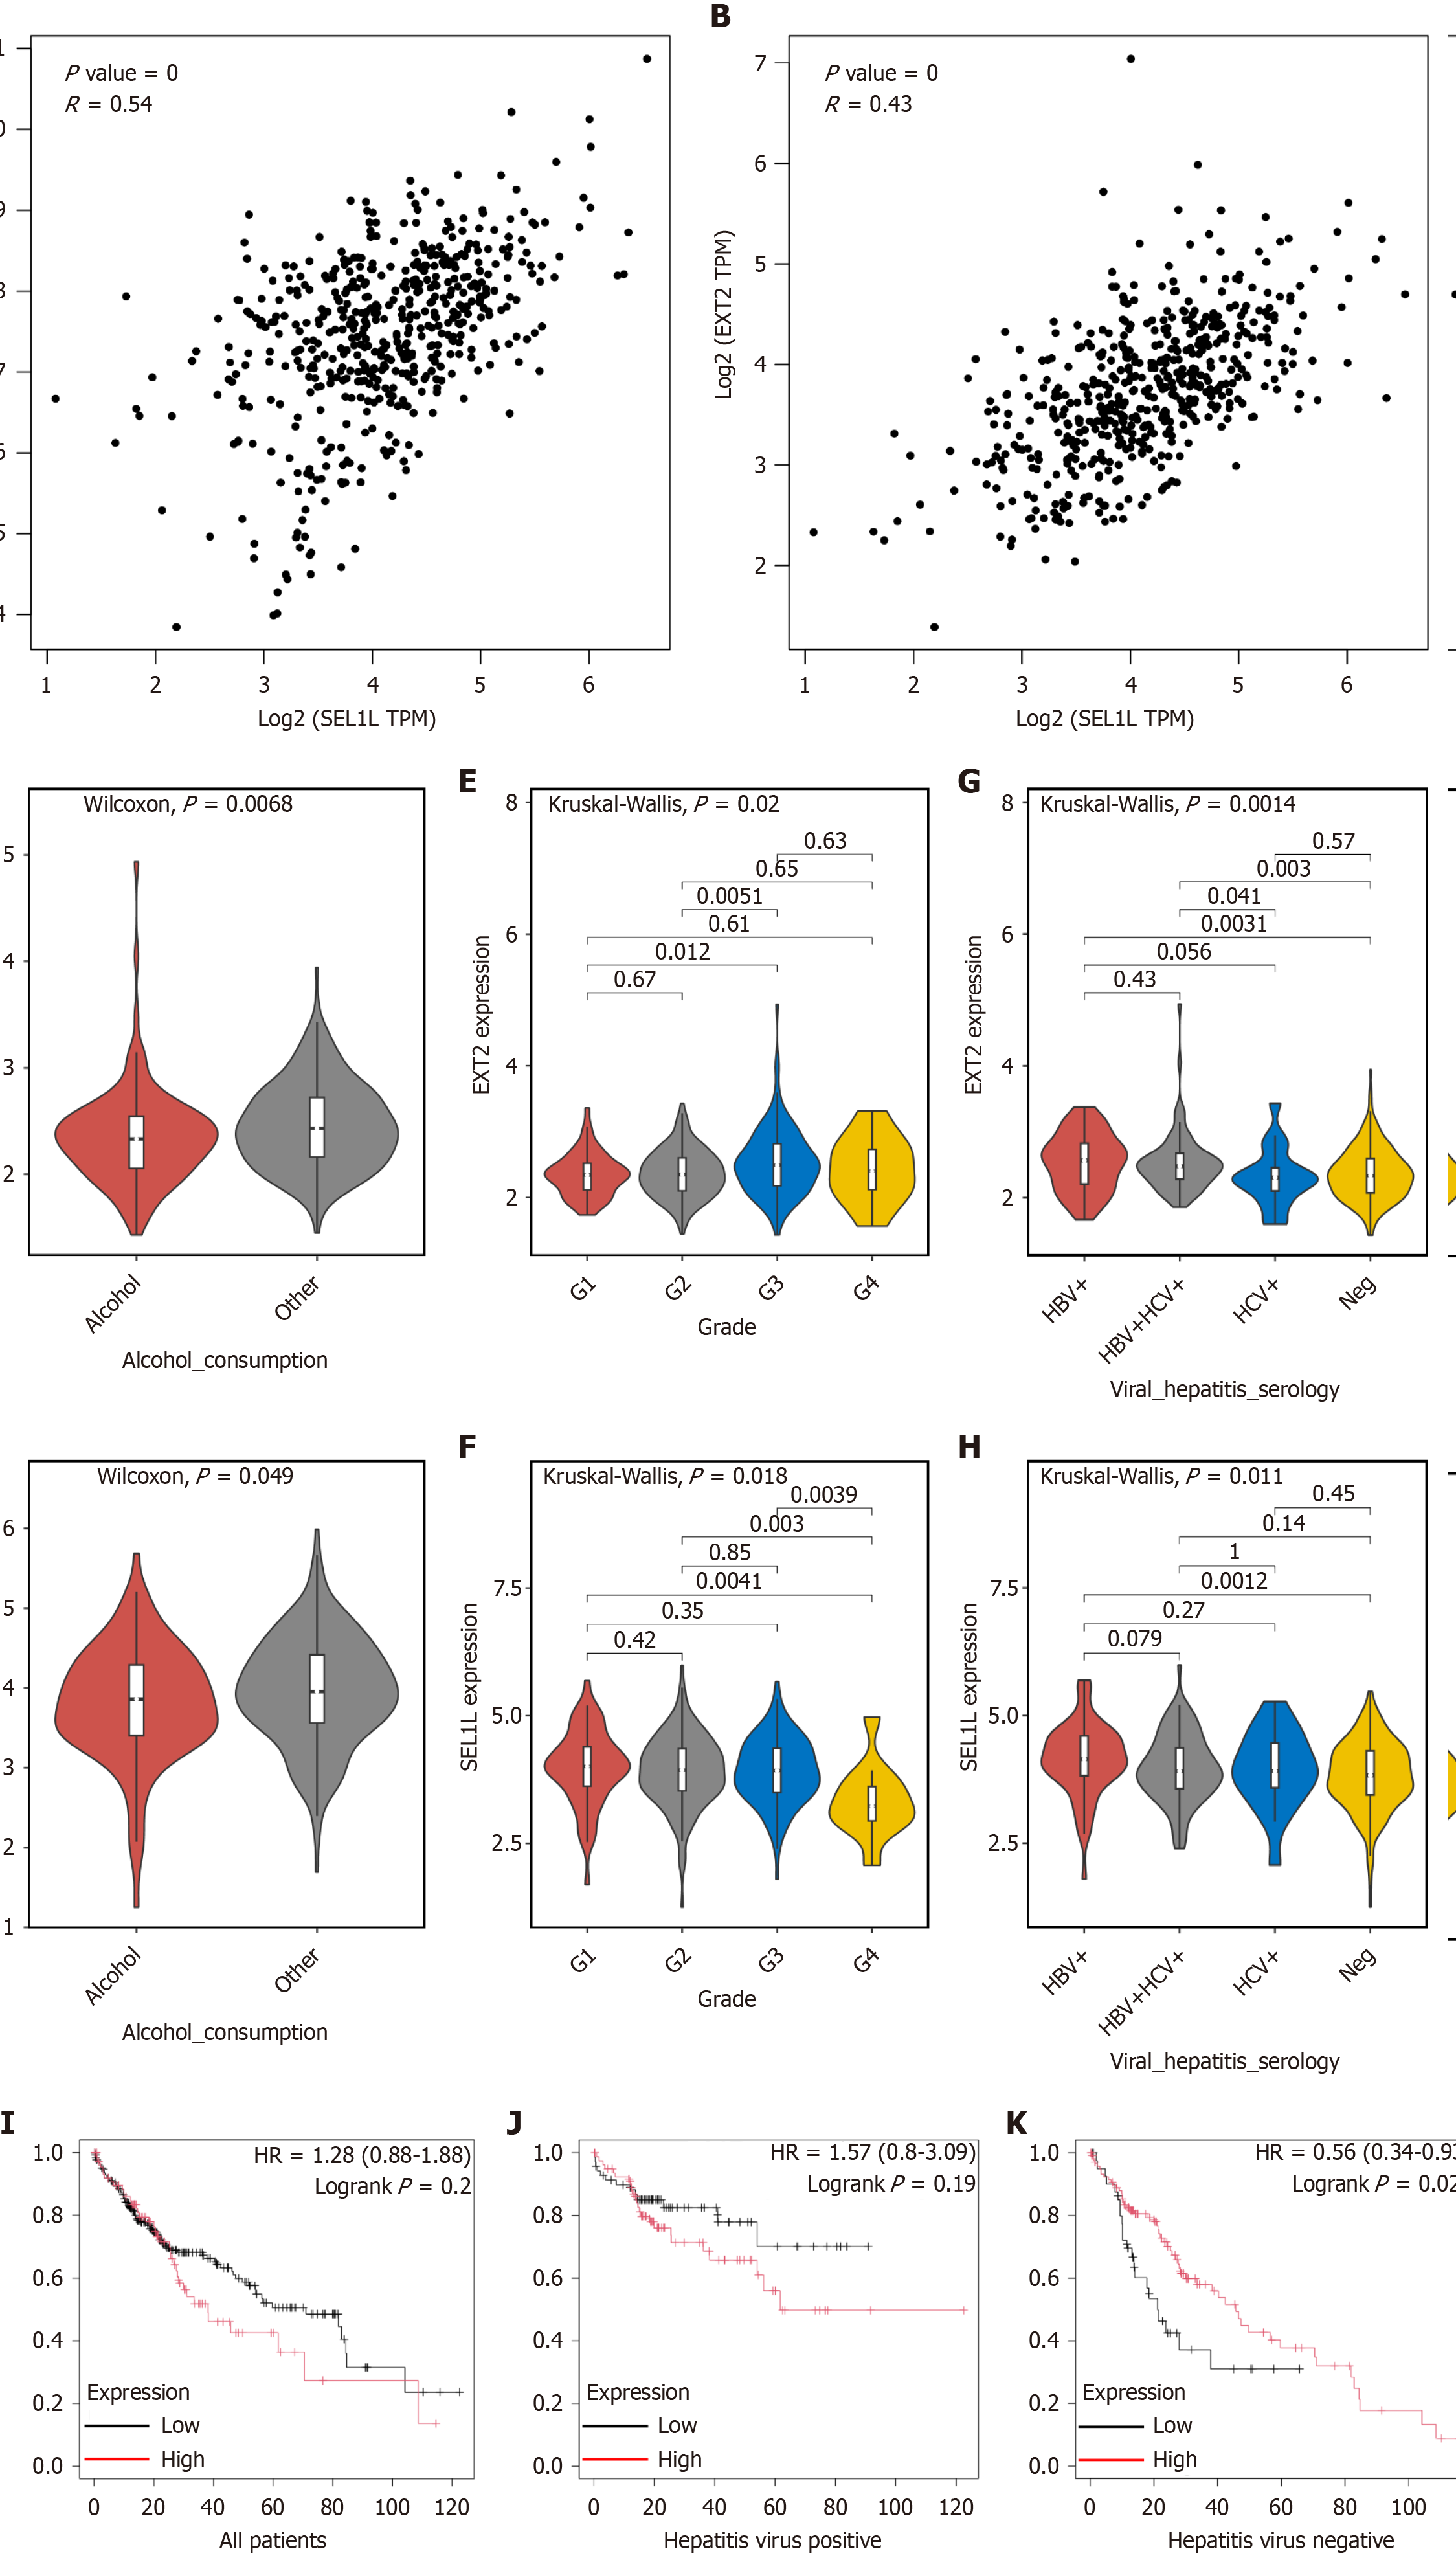
Figure 7 The expression of EXT2 in human tissue and the survival analysis.
A: Correlation analysis of EXT2 and SEL1L in liver hepatocellular carcinoma (LIHC) and liver tissues performed by GEPIA2; B: Correlation analysis of heavy-chain binding protein and SEL1L in LIHC and liver tissues performed by GEPIA2; The expression of EXT2 and SEL1L in patients in different subgroups were compared based on clinical factors such as C and D: Alcohol consumption; E and F: Neoplasm histologic grade; G and H: Hepatitis virus infection; I: Survival analysis of EXT2 in all patients; J and K: Survival analysis of EXT2 in patients with/without hepatitis virus infection. TPM: Transcripts per million; HBV: Hepatitis B virus; HCV: Hepatitis C virus; HR: Hazard ratio.
- Citation: Chen JN, Wang L, He YX, Sun XW, Cheng LJ, Li YN, Yoshida S, Shen ZY. SEL1L-mediated endoplasmic reticulum associated degradation inhibition suppresses proliferation and migration in Huh7 hepatocellular carcinoma cells. World J Gastroenterol 2025; 31(10): 103133
- URL: https://www.wjgnet.com/1007-9327/full/v31/i10/103133.htm
- DOI: https://dx.doi.org/10.3748/wjg.v31.i10.103133


