Copyright
©The Author(s) 2025.
World J Gastroenterol. Jan 7, 2025; 31(1): 101198
Published online Jan 7, 2025. doi: 10.3748/wjg.v31.i1.101198
Published online Jan 7, 2025. doi: 10.3748/wjg.v31.i1.101198
Figure 1 ASH1L protein expression levels in patient tissues.
A: Representative images showing ASH1L expression in normal liver and hepatocellular carcinoma tissues from the same patient; B and C: Representative images illustrating weak expression of ASH1L in the tumor low expression group and strong expression of ASH1L in the tumor high expression group; D: ASH1L expression in patients’ tissues analyzed by western blot; E: A quantitative analysis of the western blot data provided a numerical representation of ASH1L expression levels in the tumor and normal tissues; F: Quantitative results of ASH1L expression among patients’ tissues obtained by quantitative real-time polymerase chain reaction. cP < 0.001. dP < 0.0001. T: Tumor tissues; N: Liver tissues; GAPDH: Glyceraldehyde-3-phosphate dehydrogenase.
Figure 2 Kaplan-Meier survival analysis for all 111 hepatocellular carcinoma patients stratified by high and low ASH1L expression.
A: The overall survival of patients with hepatocellular carcinoma; B: Recurrence-free survival is shown for the same cohort of patients.
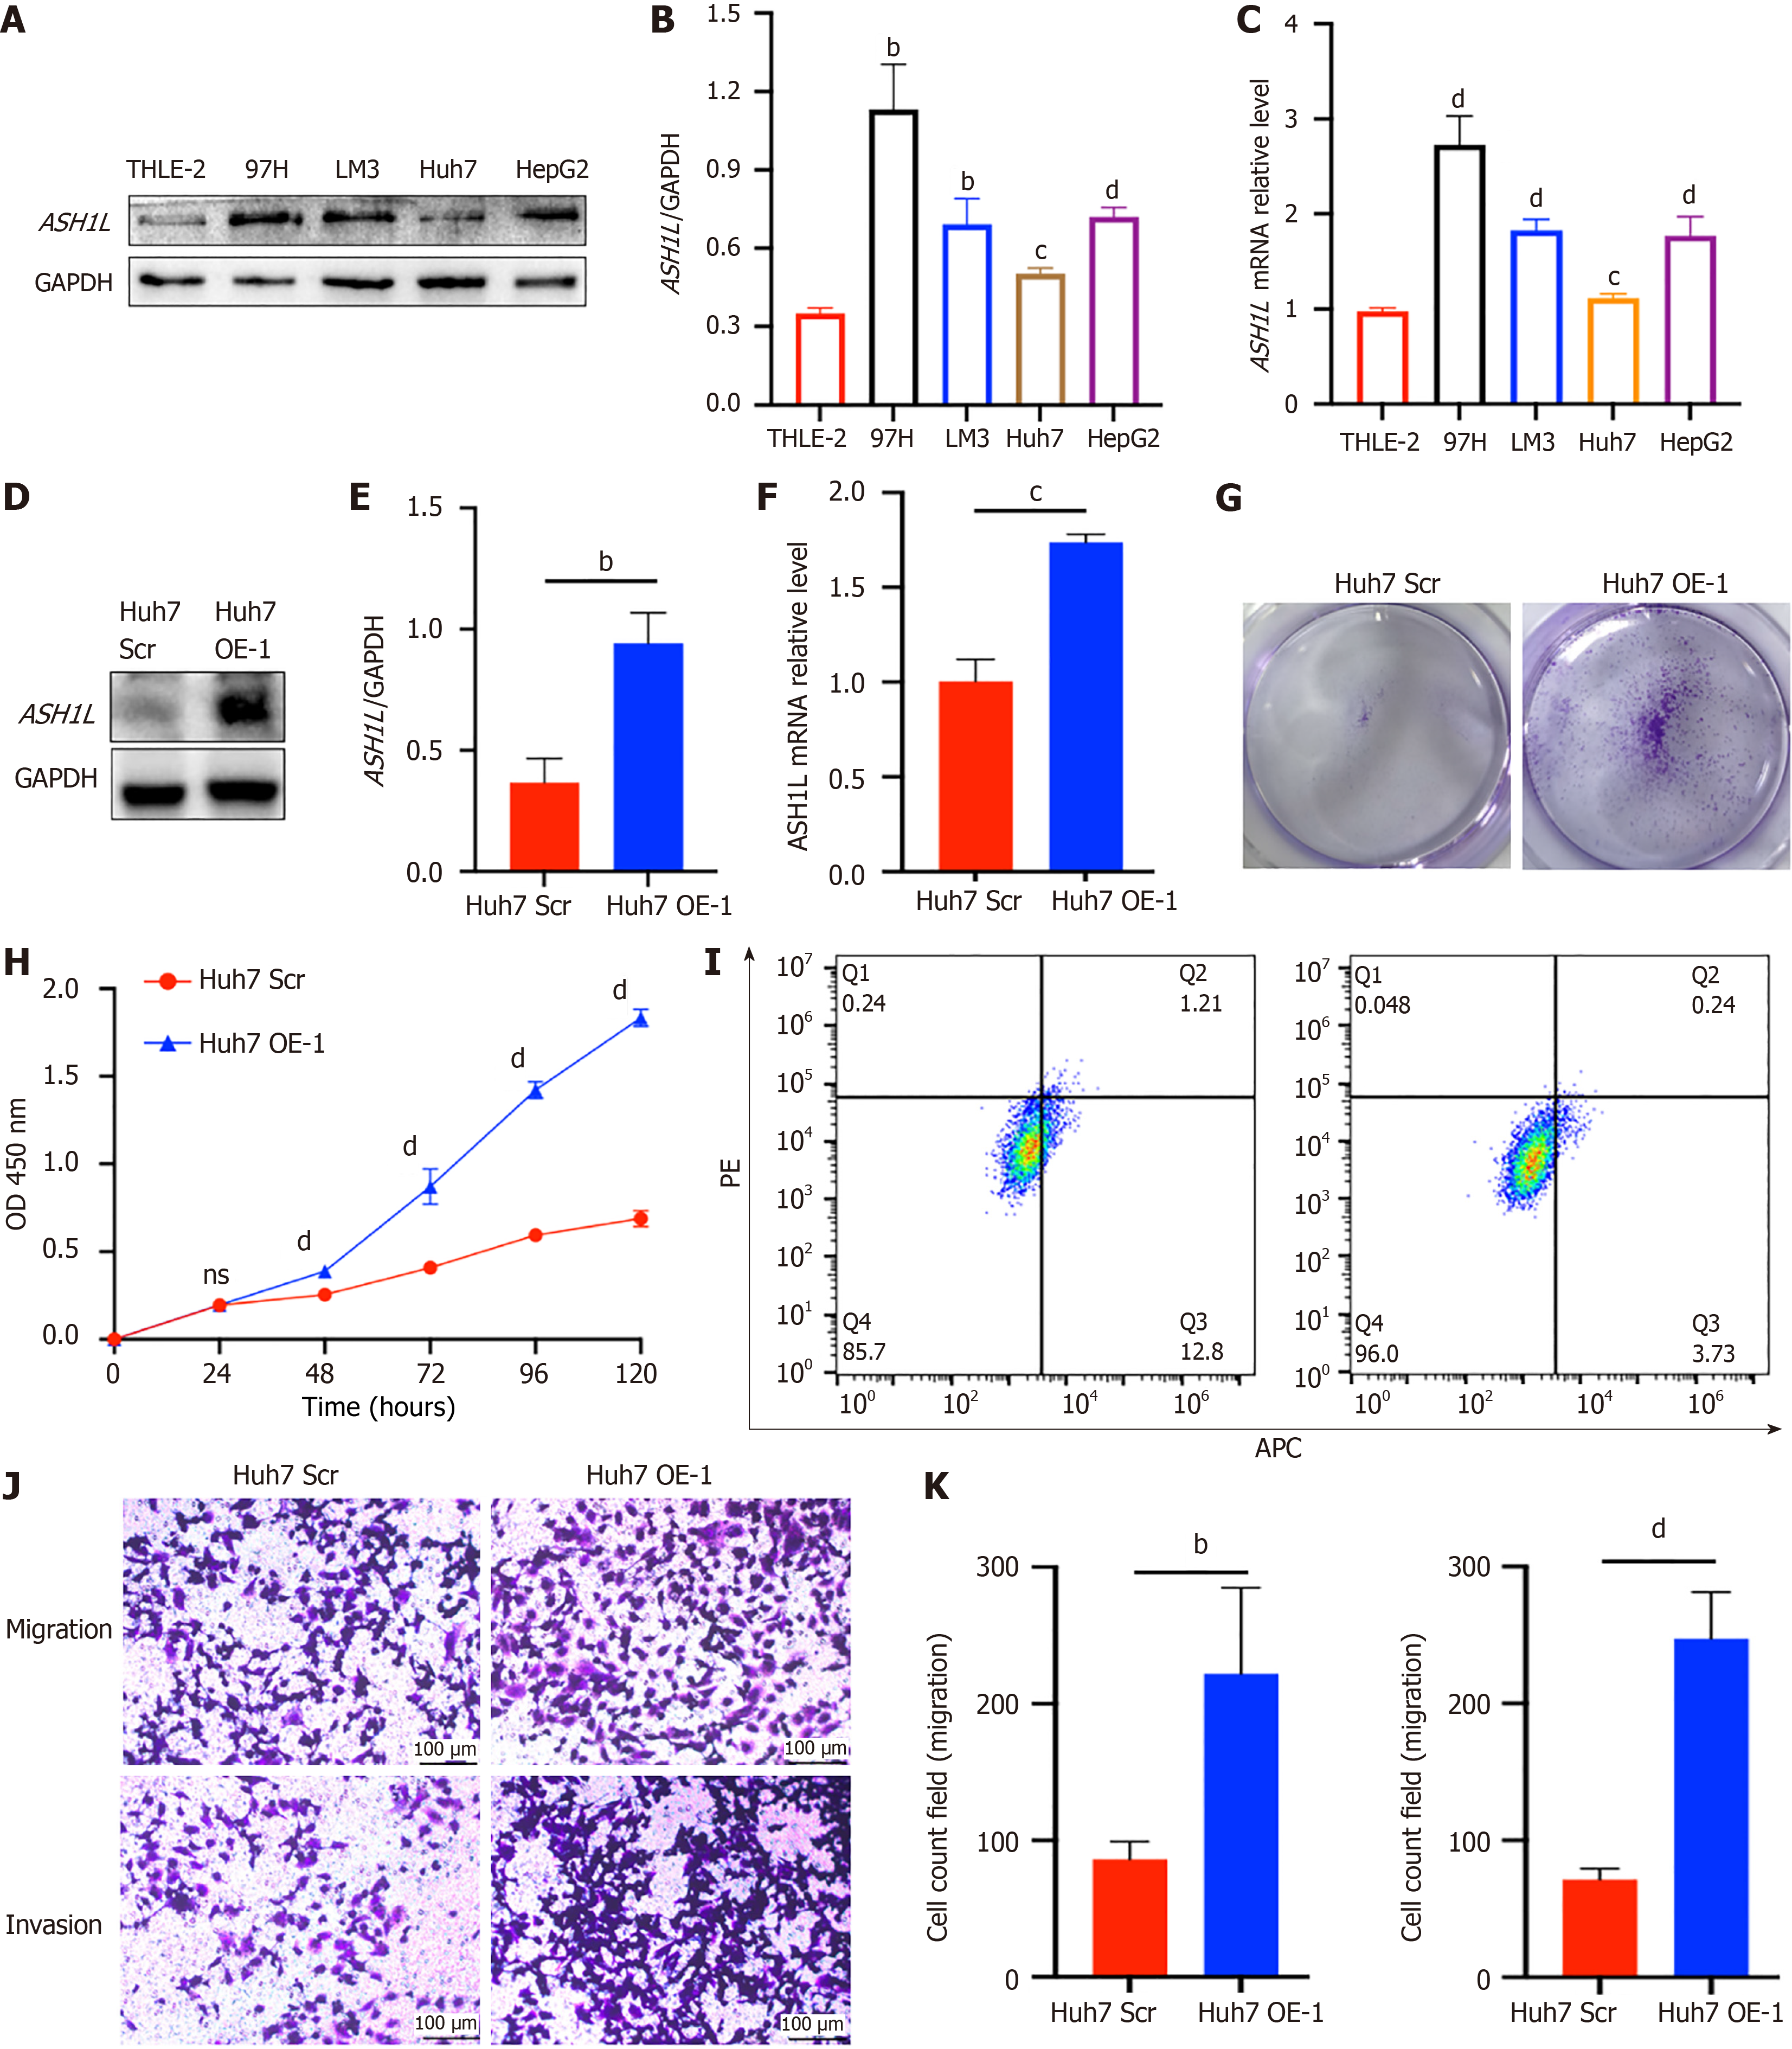
Figure 3 ASH1L expression in different cell lines, the establishment of overexpression cell lines and proliferation assay, migration, and invasion assay of Huh7-ASH1L-overexpression.
A: Western blot analysis was performed to assess ASH1L protein expression in both normal liver cells and a range of hepatocellular carcinoma (HCC) cell lines; B: A quantitative analysis of the western blot data provided a numerical representation of ASH1L expression levels in the liver and HCC cell lines; C: Quantitative real-time polymerase chain reaction (RT-qPCR) analysis was conducted to evaluate the transcriptional levels of ASH1L in liver cells and various HCC cell lines, offering insights into gene expression patterns; D: Western blot analysis was used comparing the protein levels between Huh7 scrambled (Scr) and overexpression (OE) groups; E: The quantitative results of the western blot analysis provided a statistical comparison of ASH1L protein levels between the Huh7 Scr and OE groups; F: RT-qPCR analysis was also performed to compare the ASH1L gene expression between the Huh7 Scr and OE groups, quantifying the effect of overexpression on the transcriptional level; G: A colony formation assay was carried out to determine the effect of ASH1L overexpression on the clonogenic capacity of the cells; H: Cell counting kit 8 assays were conducted to assess the proliferative activity of the cells, with results indicating the impact of ASH1L overexpression on cell growth; I: Cell apoptosis was detected by flow cytometry, and the results showed the influence of ASH1L overexpression on apoptosis; J: Transwell chamber assays were used to evaluate the migratory and invasive capabilities of the cells, highlighting the differences between the Huh7 Scr and OE groups; K: Quantitative analyses of the Transwell assay data provided a statistical comparison of the cell migration and invasion abilities between the Huh7 Scr and OE groups, further elucidating the role of ASH1L in these cellular processes. aP < 0.05. bP < 0.01. cP < 0.001. dP < 0.0001. GAPDH: Glyceraldehyde-3-phosphate dehydrogenase; Scr: Scrambled; OE: Overexpression; APC: Allophycocyanin conjugate; PE: Phycoerythrin.
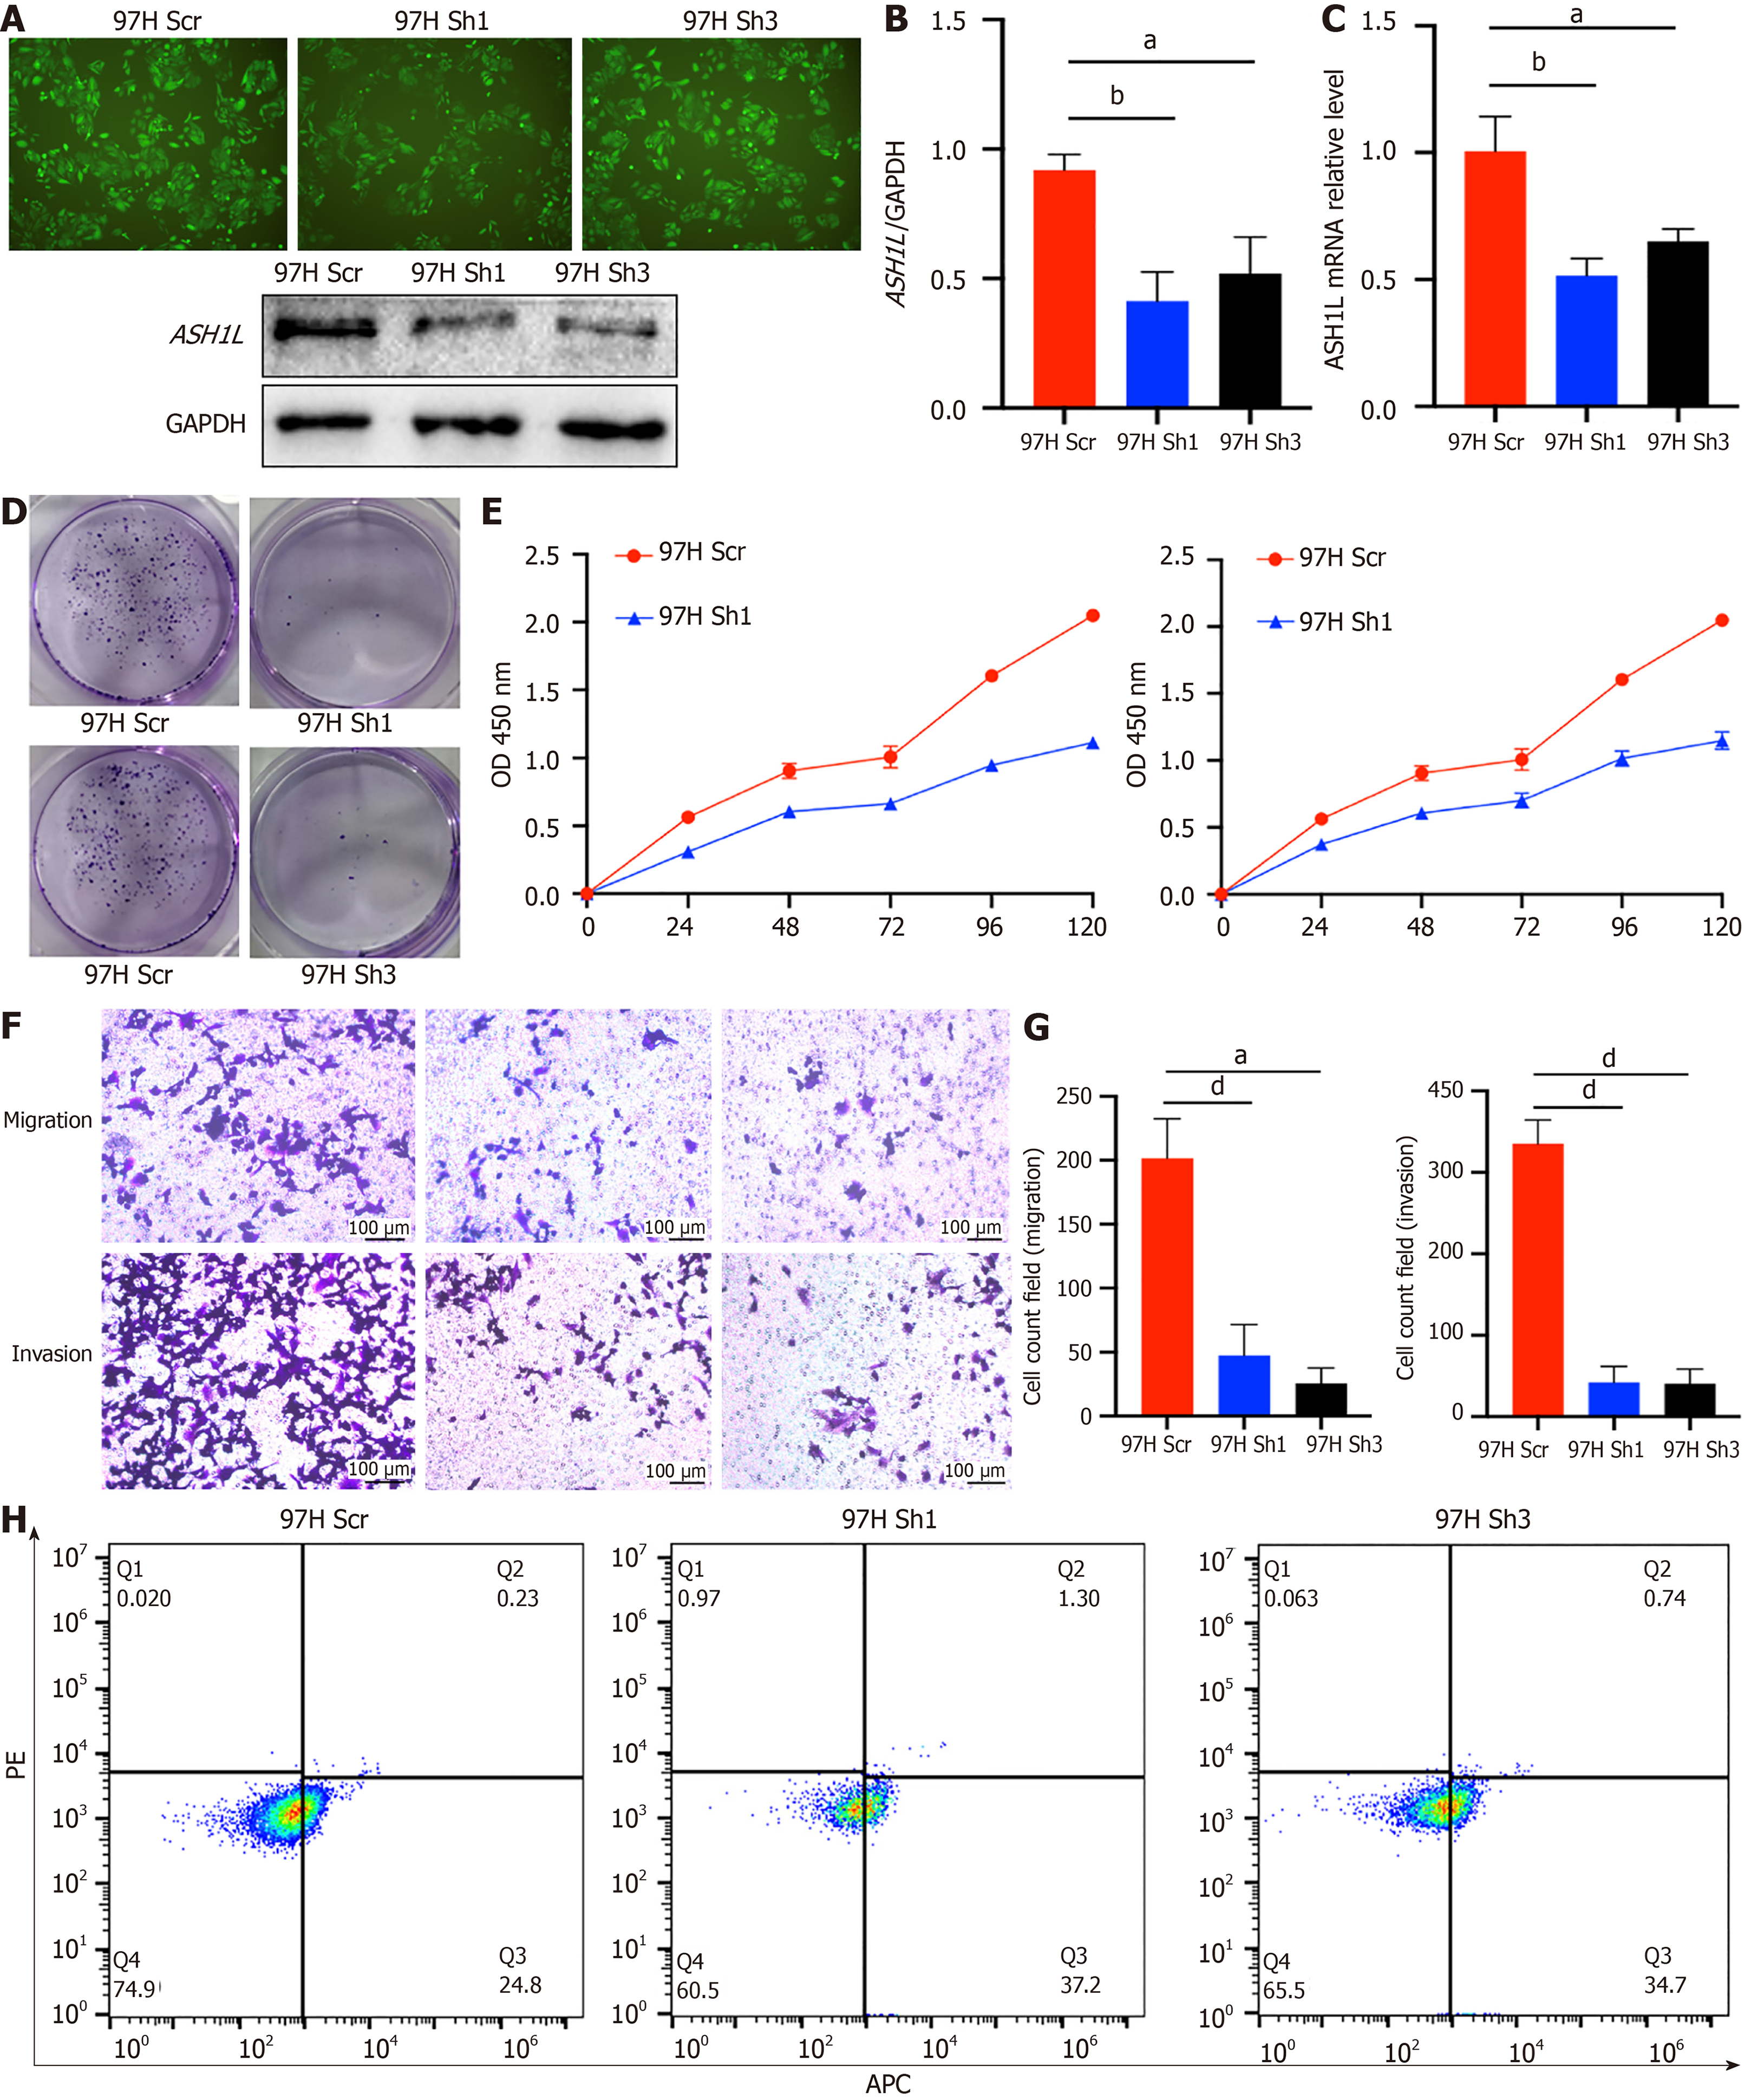
Figure 4 The expression of ASH1L in MHCC-97H and knockdown cell lines and proliferation assay, migration and invasion assay of 97H-ASH1L-knockdown.
A: Fluorescence imaging was conducted post-lentiviral transfection to visualize the ASH1L protein levels and western blot analysis was performed to compare the protein expression between MHCC-97H Scrambled (Scr) and Knockdown (KD) groups; B: The quantitative analysis of the western blot results provided a numerical comparison of ASH1L protein expression between the MHCC-97H Scr and KD groups; C: Quantitative real-time polymerase chain reaction (RT-qPCR) analysis was utilized to measure the differences in ASH1L gene expression between MHCC-97H Scr and KD groups, providing insights into the transcriptional effects of ASH1L knockdown; D: The colony formation assay indicated that the downregulation of endogenous ASH1L in MHCC-97H cells led to a decrease in the average number of colonies formed, suggesting a reduced clonogenic capacity; E: Cell counting kit 8 assays were employed to assess cell proliferation, and the results demonstrated that the downregulation of endogenous ASH1L significantly decreased the growth rate of MHCC-97H cells; F: Transwell chamber assays were conducted to evaluate and compare the abilities of MHCC-97H Scr and KD cells in terms of migration and invasion, revealing the impact of ASH1L on these cellular behaviors; G: Quantitative analyses of the Transwell assay data statistically compared the migration and invasion capabilities of MHCC-97H Scr and KD cells, further elucidating the role of ASH1L in cell movement and invasion; H: Cell apoptosis was detected by flow cytometry, and the results showed the influence of ASH1L knock-out on apoptosis. aP < 0.05. bP < 0.01. cP < 0.001. dP < 0.0001. GAPDH: Glyceraldehyde-3-phosphate dehydrogenase; Scr: Scrambled; APC: Allophycocyanin conjugate; PE: Phycoerythrin; OD: Optical density.
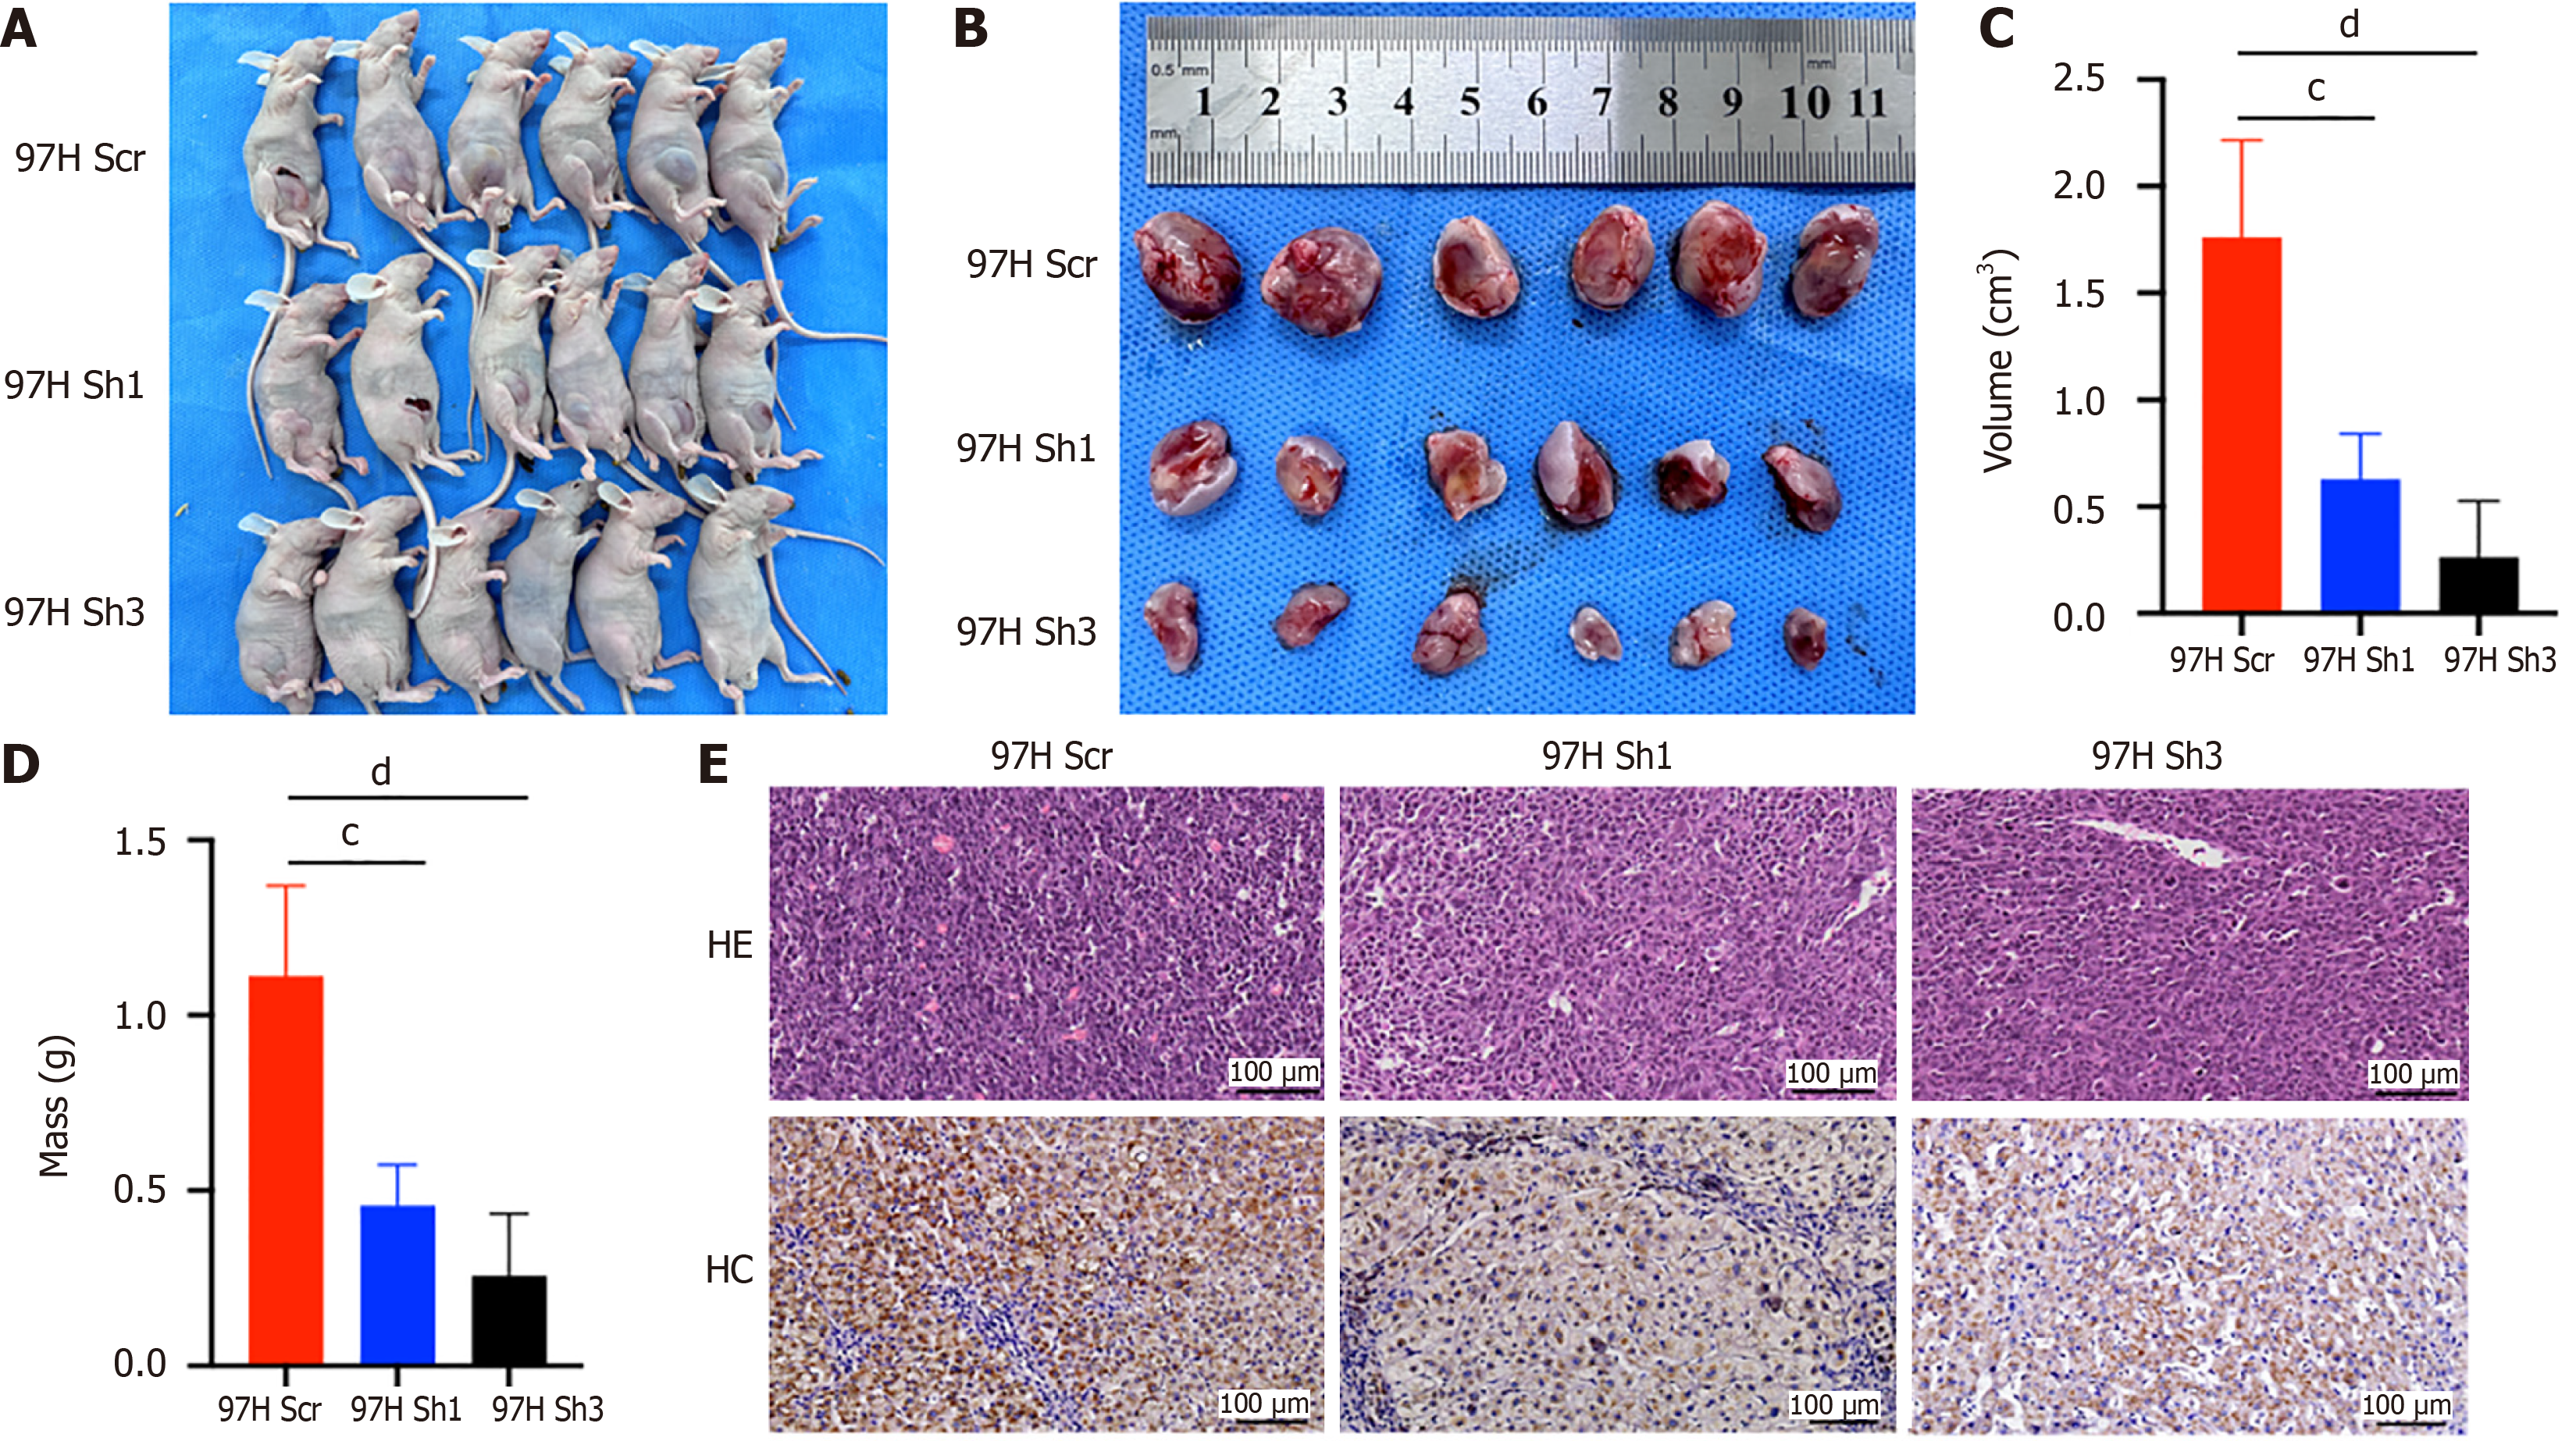
Figure 5 Inhibition of ASH1L expression affects tumorigeneses of hepatocellular carcinoma cells in vivo.
A: The 97H scrambled, 97H Sh1, and 97H Sh3 cell lines were individually implanted into the right inguinal region of male BALB/c nude mice, aged 4 to 6 weeks, to establish subcutaneous xenograft models; B: Photographs were taken to document the appearance and progression of subcutaneous tumors in the xenografted BALB/c nude mice across the different experimental groups; C and D: Quantitative analysis was conducted to measure and compare the tumor volume and mass among the various groups of BALB/c nude mice, providing a numerical assessment of tumor growth; E: Tumor sections from the different groups of BALB/c nude mice were subjected to hematoxylin and eosin staining and immunohistochemistry to evaluate histological characteristics and protein expression within the tumors, respectively. cP < 0.001. dP < 0.0001. Scr: Scrambled; HE: Hematoxylin and eosin staining; IHC: Immunohistochemistry.
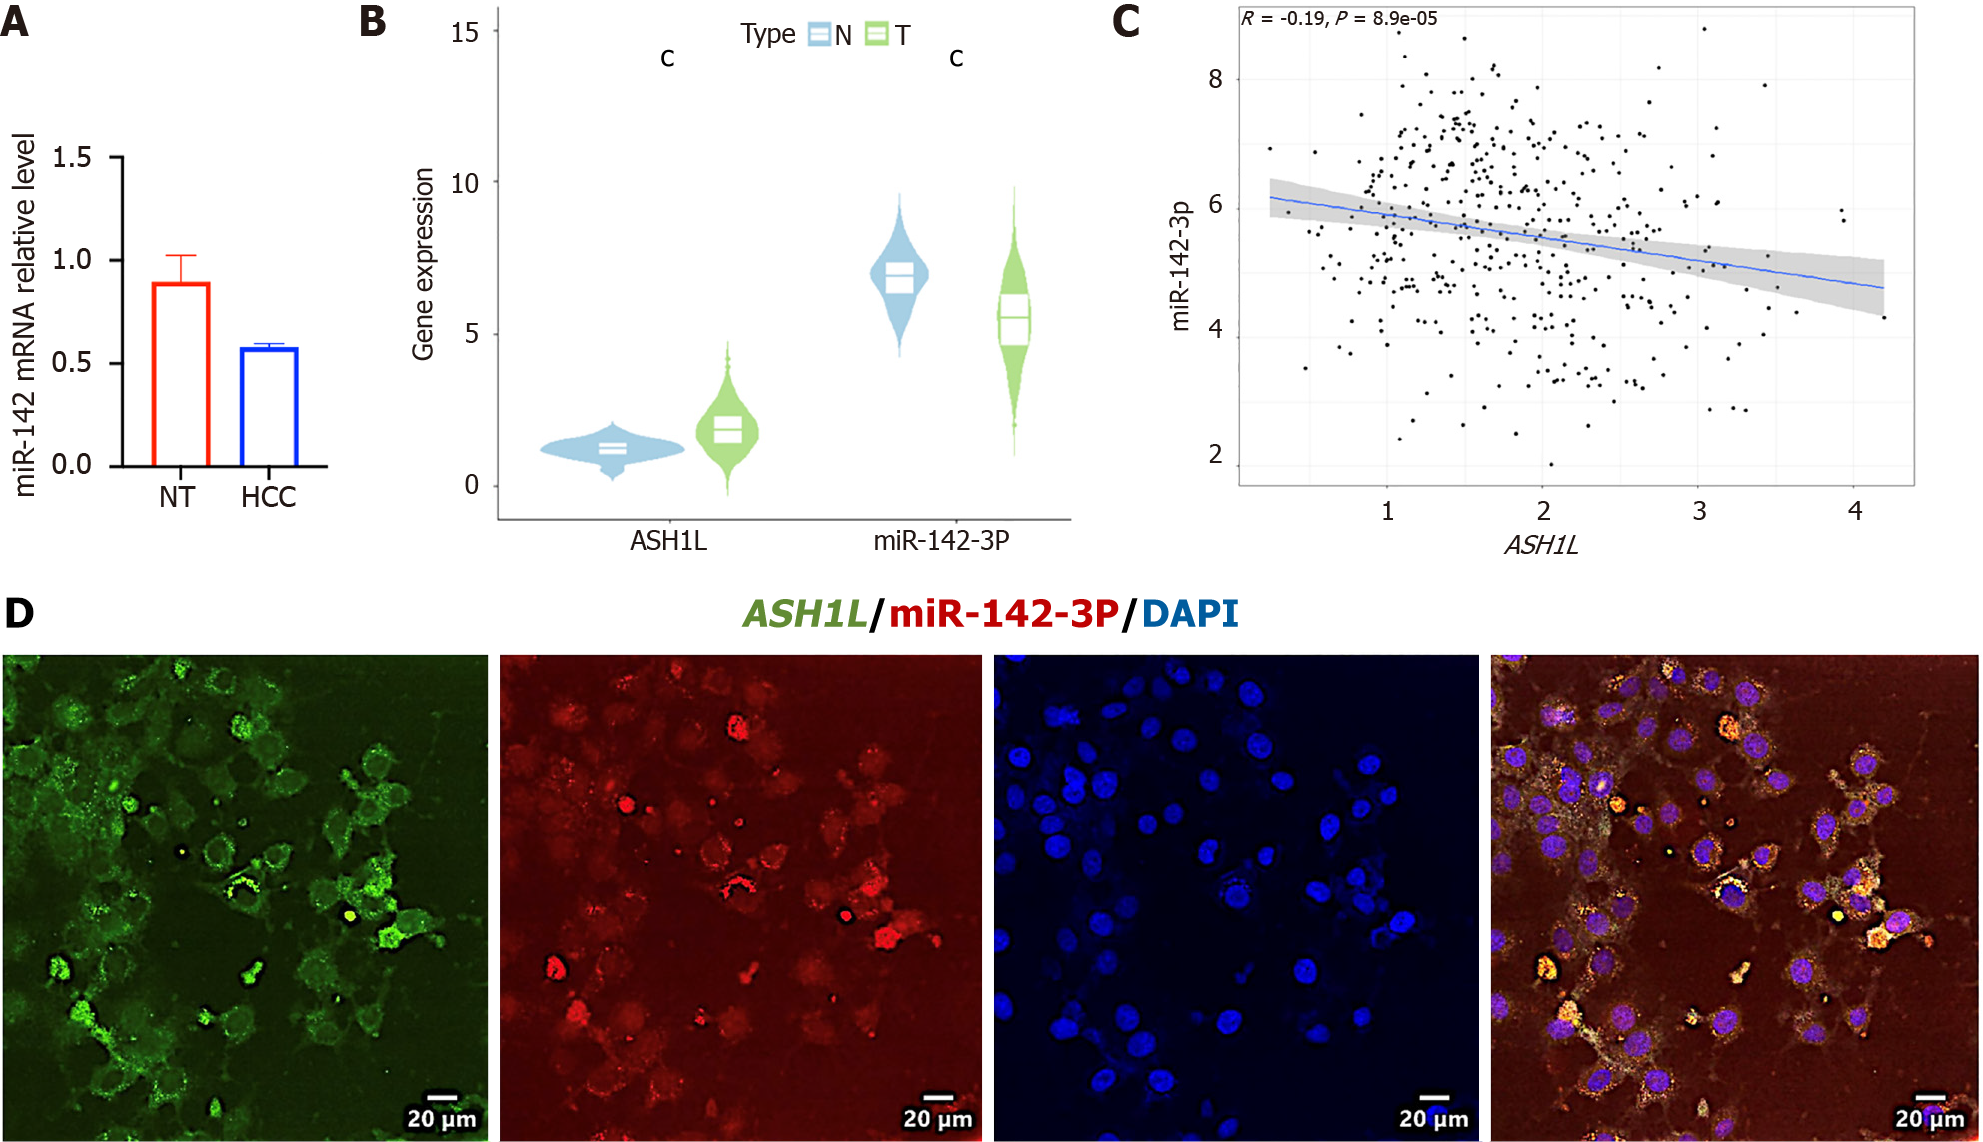
Figure 6 Content of microRNA-142-3p was low in hepatocellular carcinoma tissues and negatively correlated with ASH1L.
A: MicroRNA (MiR)-142-3p levels in patients’ tissues as assessed by quantitative real-time polymerase chain reaction; B: Comparison of MiR-142-3p and ASH1L levels in normal liver and hepatocellular carcinoma tissues in the cancer genome atlas; C: Correlation analysis between MiR-142-3p and ASH1L in the cancer genome atlas; D: Immunofluorescence analysis for ASH1L and MiR-142-3p levels in MHCC-97H cells. cP < 0.001. MiR: MicroRNA.
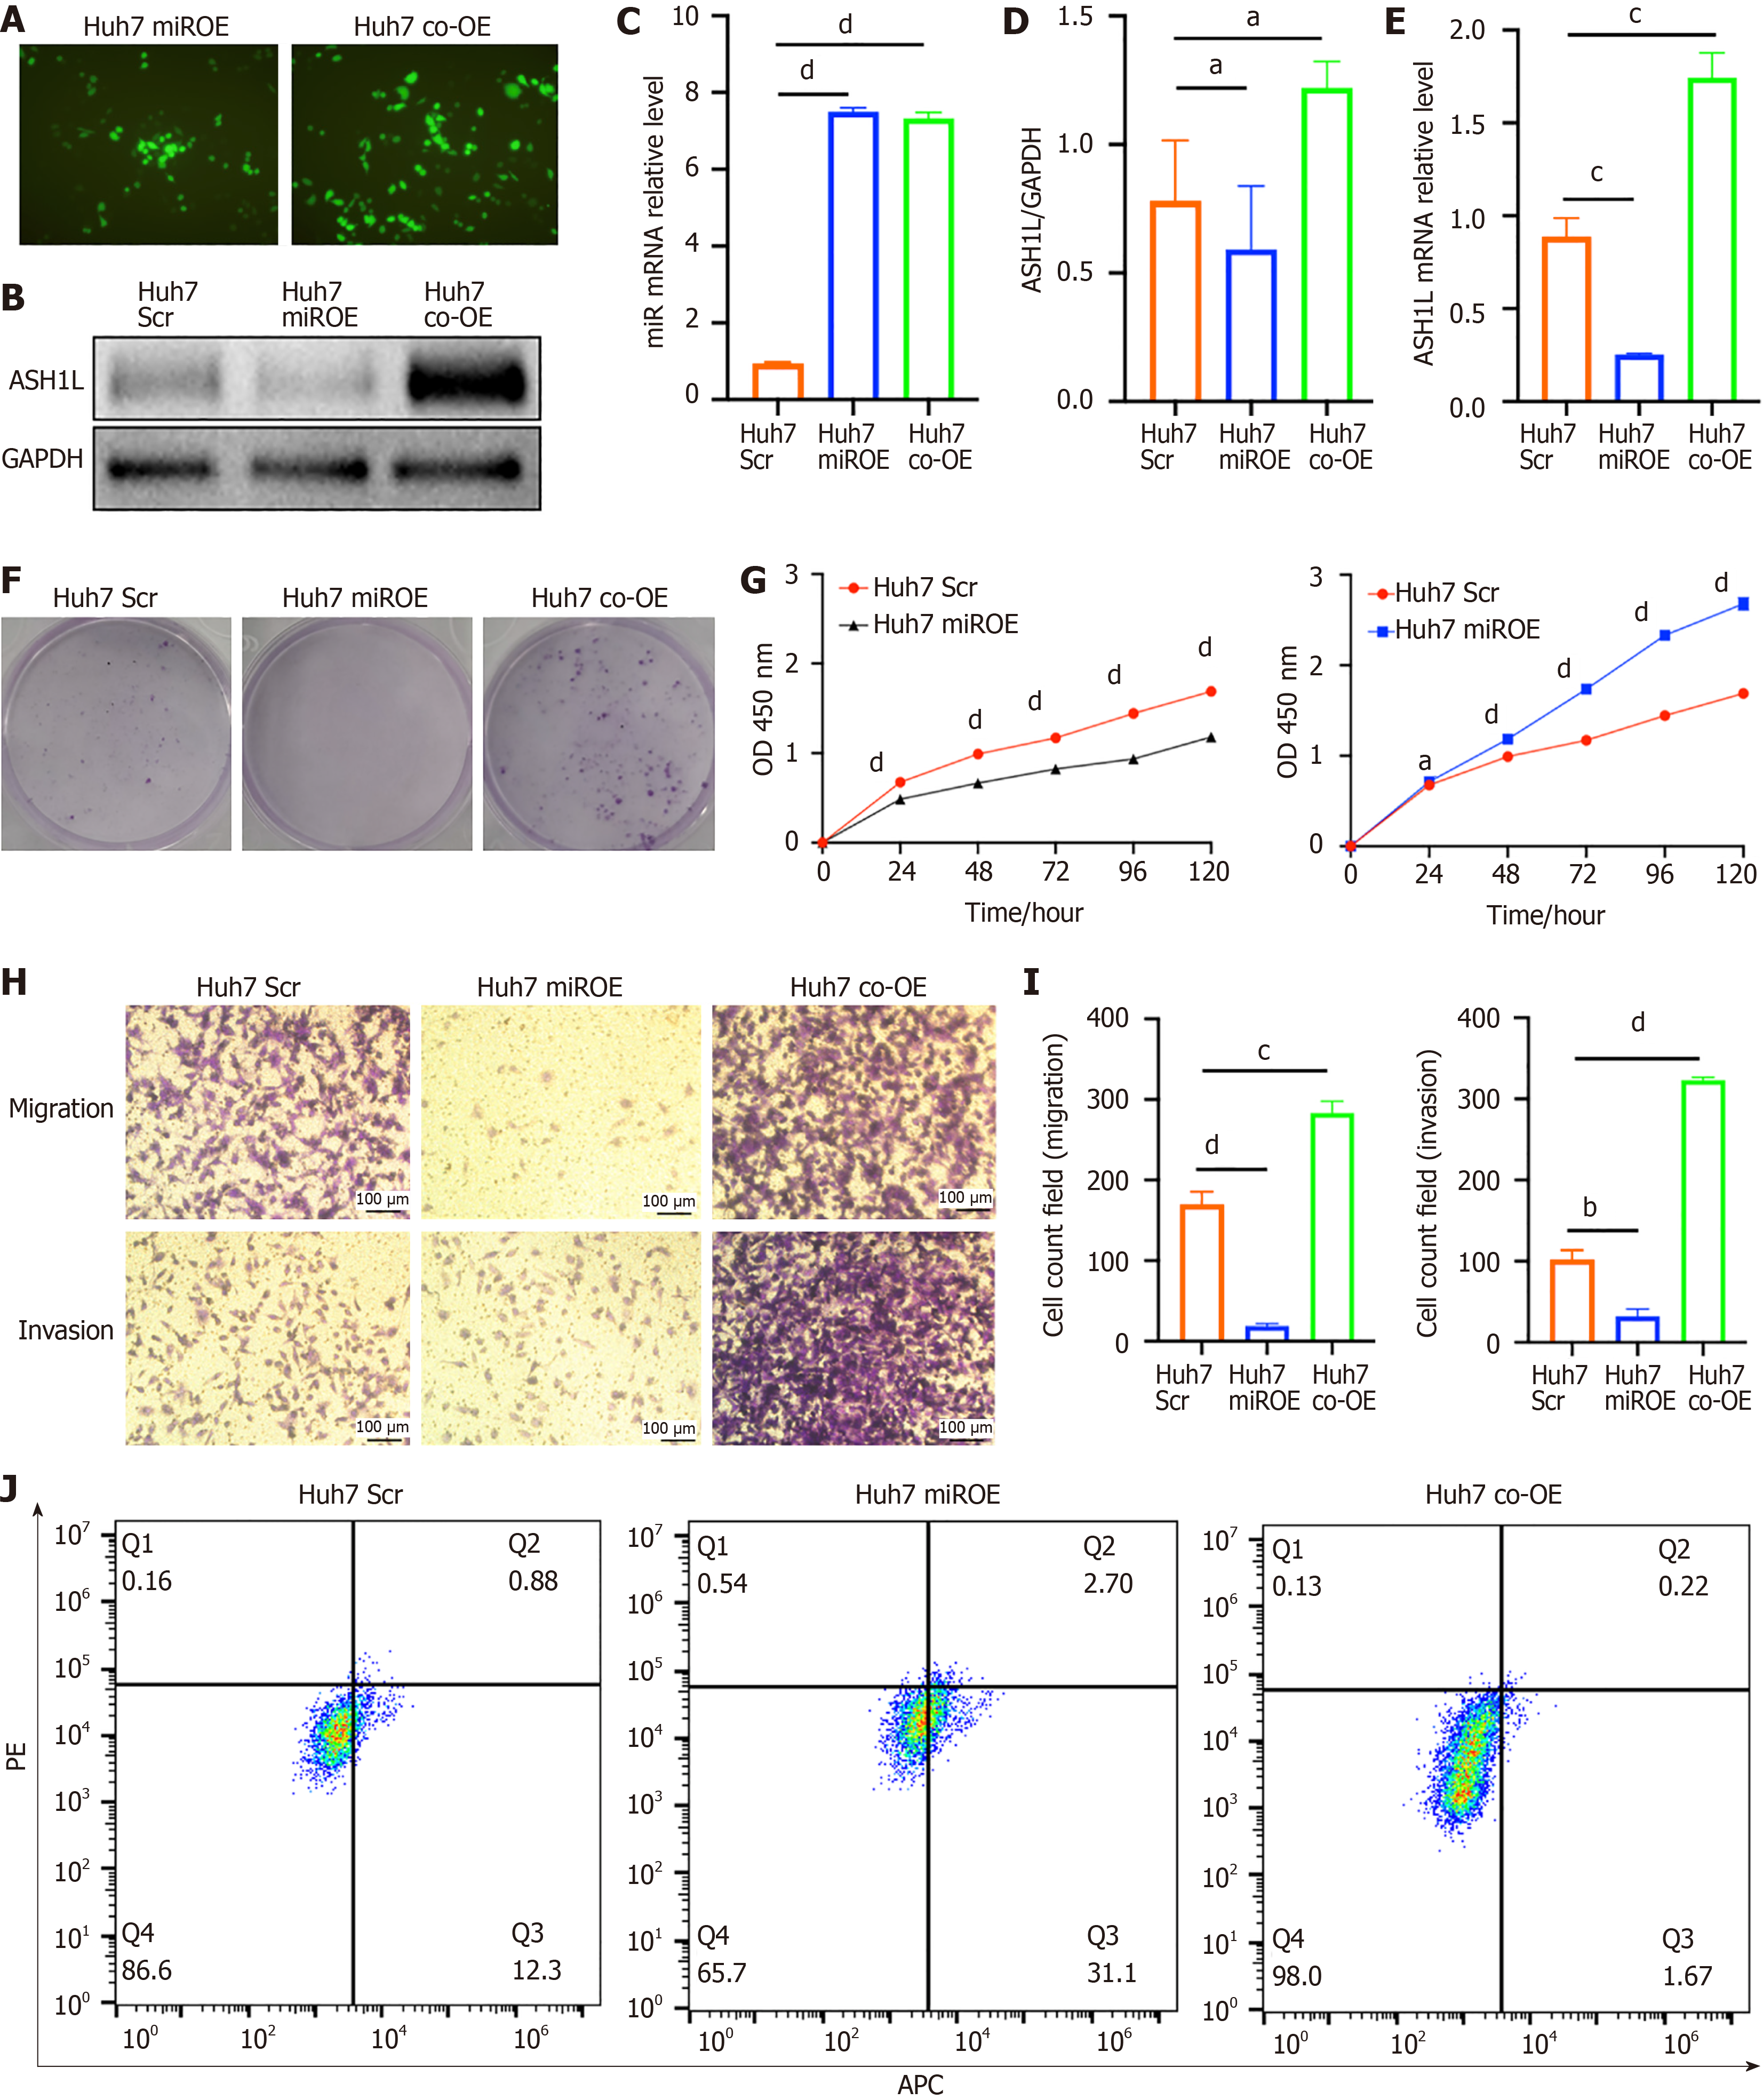
Figure 7 The expression of ASH1L and proliferation assay, migration and invasion assay in Huh7 scrambled, microRNA overexpression and co-overexpression cell lines.
A: Fluorescence imaging was conducted to visualize the transfection efficiency of lentivirus in Huh7 cells, allowing for the assessment of viral uptake and distribution within the cells; B: Western blot analysis was performed on Huh7 cells to evaluate protein expression levels among the group of scrambled (Scr), microRNA over-expression (miROE), and microRNA and ASH1L over-expression (co-OE) groups, providing insights into the molecular effects of these genetic modifications; C: Quantitative real-time polymerase chain reaction (RT-qPCR) analysis was carried out to quantify the expression of specific genes at the transcriptional level in Huh7 Scr, miROE, and co-OE groups, offering a detailed view of changes in gene expression post-transfection; D: The quantitative results of the western blot analysis provided numerical data on protein expression differences between the Huh7 Scr, miROE, and co-OE groups, allowing for statistical comparison of the effects of lentiviral transfection; E: RT-qPCR analysis was also conducted to compare the relative gene expression levels in Huh7 Scr, miROE, and co-OE groups, further validating the molecular changes induced by the transfections; F: A colony formation assay was used to assess the proliferative capacity of Huh7 Scr, miROE, and co-OE groups, indicating the clonogenic potential of the cells after genetic manipulation; G: Cell counting kit 8 assays were implemented to measure the cell proliferation rate in Huh7 Scr, miROE, and co-OE groups, providing a quantitative measure of cell growth and viability; H: Transwell chamber tests were conducted to determine the migratory and invasive capabilities of Huh7 Scr, miROE, and co-OE groups, revealing the functional consequences of altered gene expression on cell behavior; I: Quantitative analyses of the Transwell chamber test results provided statistical evaluation of the differences in cell migration and invasion among Huh7 Scr, miROE, and co-OE groups, quantifying the impact of the genetic interventions on these cellular processes; J: Cell apoptosis was detected by flow cytometry, and the results showed the influence of miR-142-3p and ASH1L overexpression on apoptosis. aP < 0.05. bP < 0.01. cP < 0.001. dP < 0.0001. GAPDH: Glyceraldehyde-3-phosphate dehydrogenase; Scr: Scrambled; miROE: MicroRNA over-expression; co-OE: MicroRNA and ASH1L over-expression; APC: Allophycocyanin conjugate; PE: Phycoerythrin.
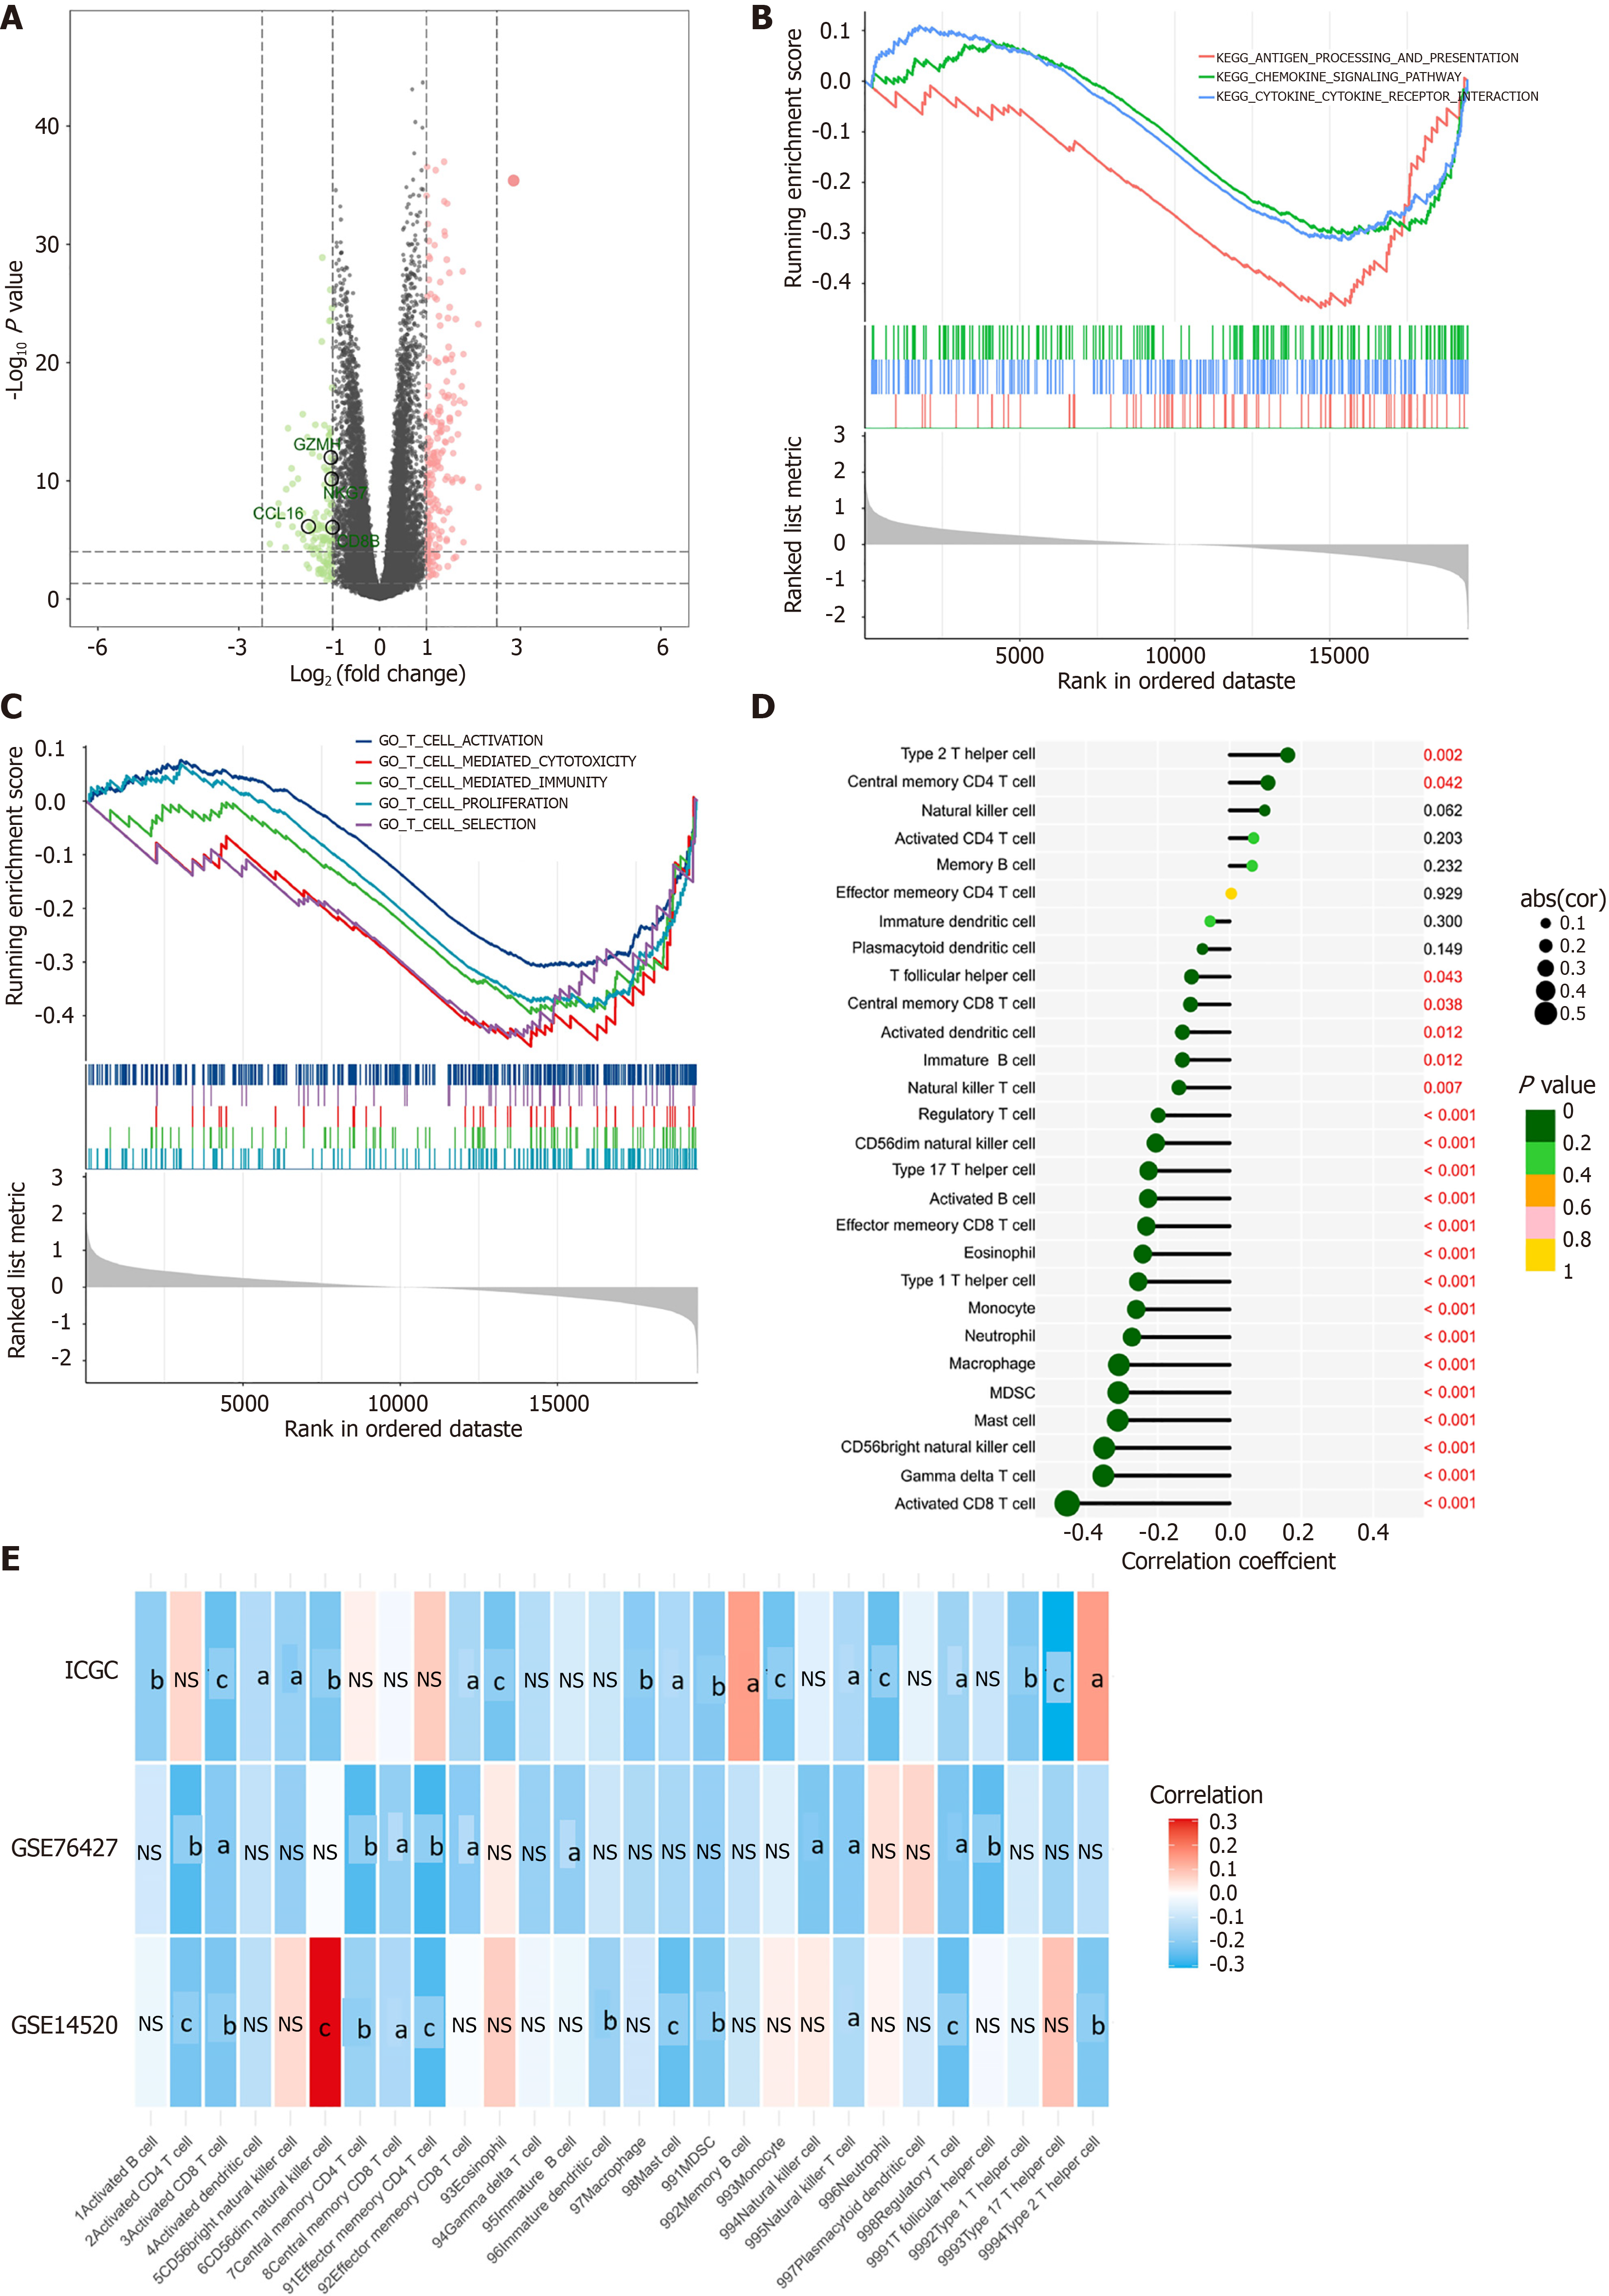
Figure 8 ASH1L promotes an immunosuppressive microenvironment in hepatocellular carcinoma.
A: Volcano plot of differentially expressed genes between high and low ASH1L groups; B: Kyoto encyclopedia of genes and genomes; C: Gene ontology pathway enrichment between high and low ASH1L groups; D: Correlation between ASH1L expression and 28 immune cell infiltration in the cancer genome atlas-liver hepatocellular carcinoma; E: Correlation between ASH1L expression and 28 immune cell infiltration in international cancer genome consortium, GSE76427 and GSE14520. MDSC: Myeloid-derived suppressor cell; GO: Gene ontology; KEGG: Kyoto encyclopedia of genes and genomes; CD: Cluster of differentiation; ICGC: International cancer genome consortium.
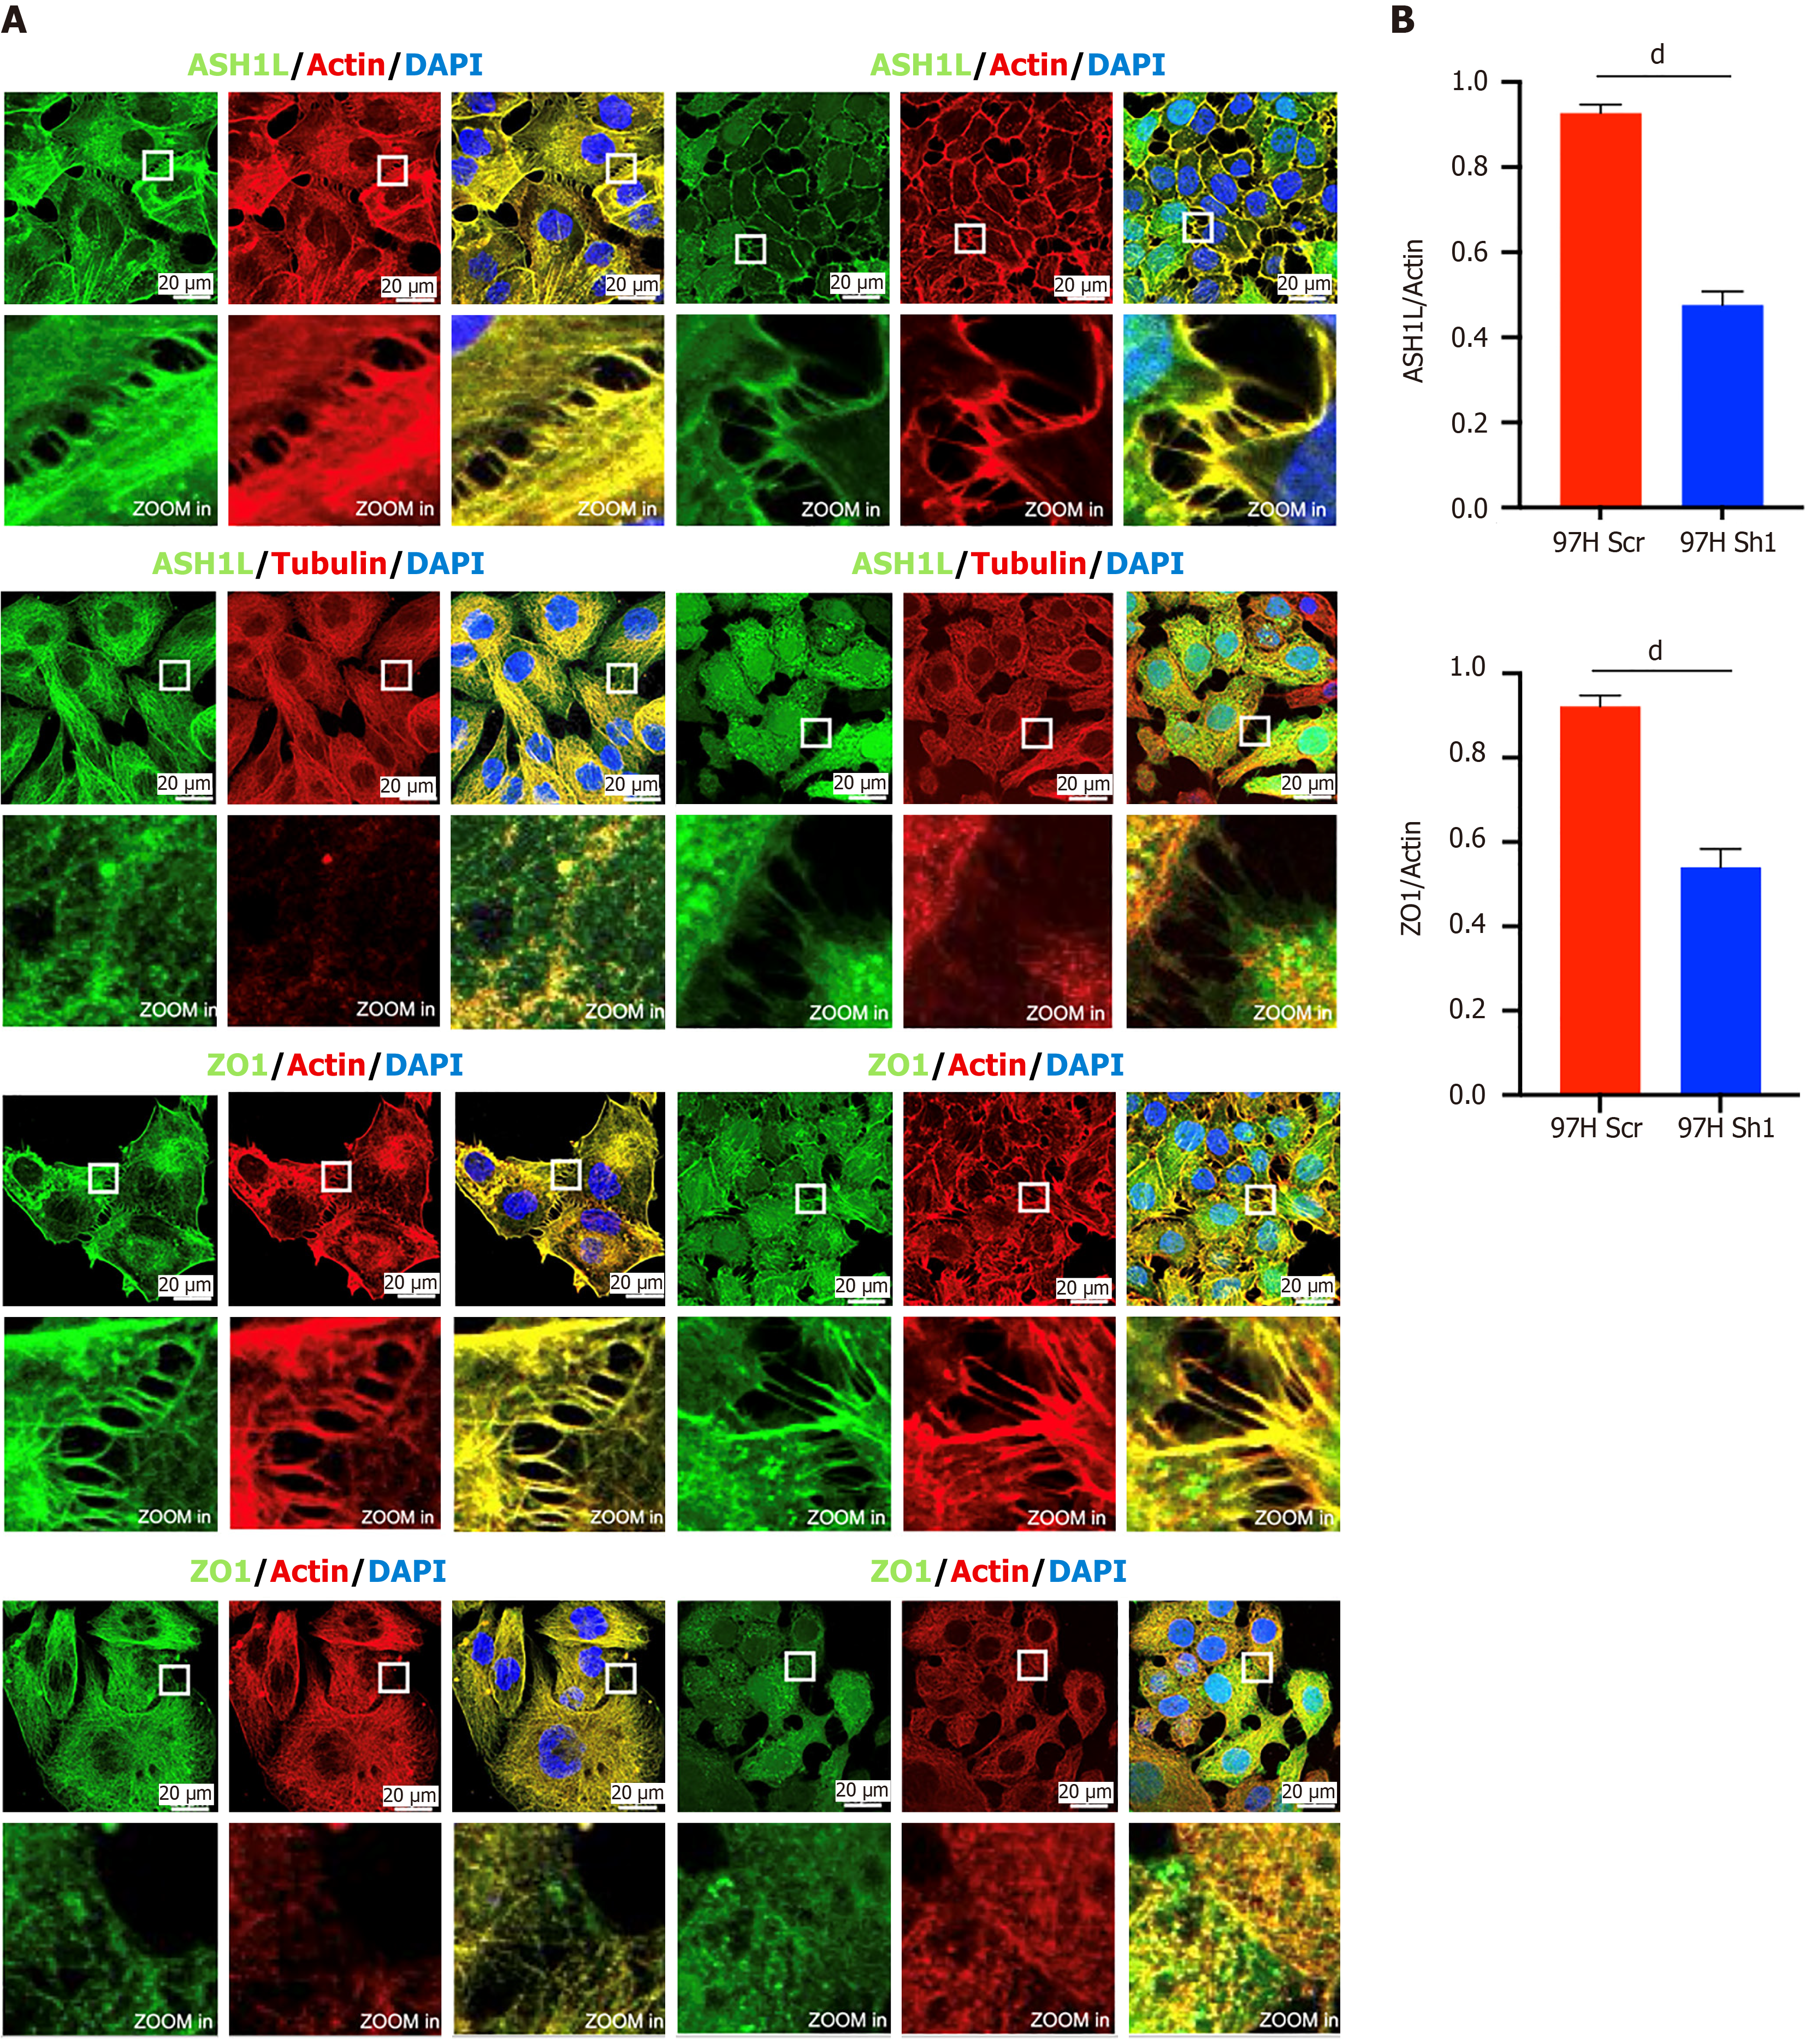
Figure 9 Immunofluorescence for detecting the different ASH1L and zonula occludens-1 content between MHCC-97H scrambled and knockdown cells.
A: Immunofluorescence analysis showing ASH1L and zonula occludens-1 content in MHCC-97H scrambled and knockdown cells; B: Quantitative analysis of A (ASH1L, zonula occludens-1, and actin are expressed inside cells and at cell junctions, while Tubulin is exclusively expressed inside cells). dP < 0.0001. ZO-1: Zonula occludens-1; DAPI: 4’,6-diamidino-2-phenylindole.
- Citation: Yu XH, Xie Y, Yu J, Zhang KN, Guo ZB, Wang D, Li ZX, Zhang WQ, Tan YY, Zhang L, Jiang WT. Loss-of-function mutations of microRNA-142-3p promote ASH1L expression to induce immune evasion and hepatocellular carcinoma progression. World J Gastroenterol 2025; 31(1): 101198
- URL: https://www.wjgnet.com/1007-9327/full/v31/i1/101198.htm
- DOI: https://dx.doi.org/10.3748/wjg.v31.i1.101198


