Copyright
©The Author(s) 2024.
World J Gastroenterol. Feb 28, 2024; 30(8): 969-983
Published online Feb 28, 2024. doi: 10.3748/wjg.v30.i8.969
Published online Feb 28, 2024. doi: 10.3748/wjg.v30.i8.969
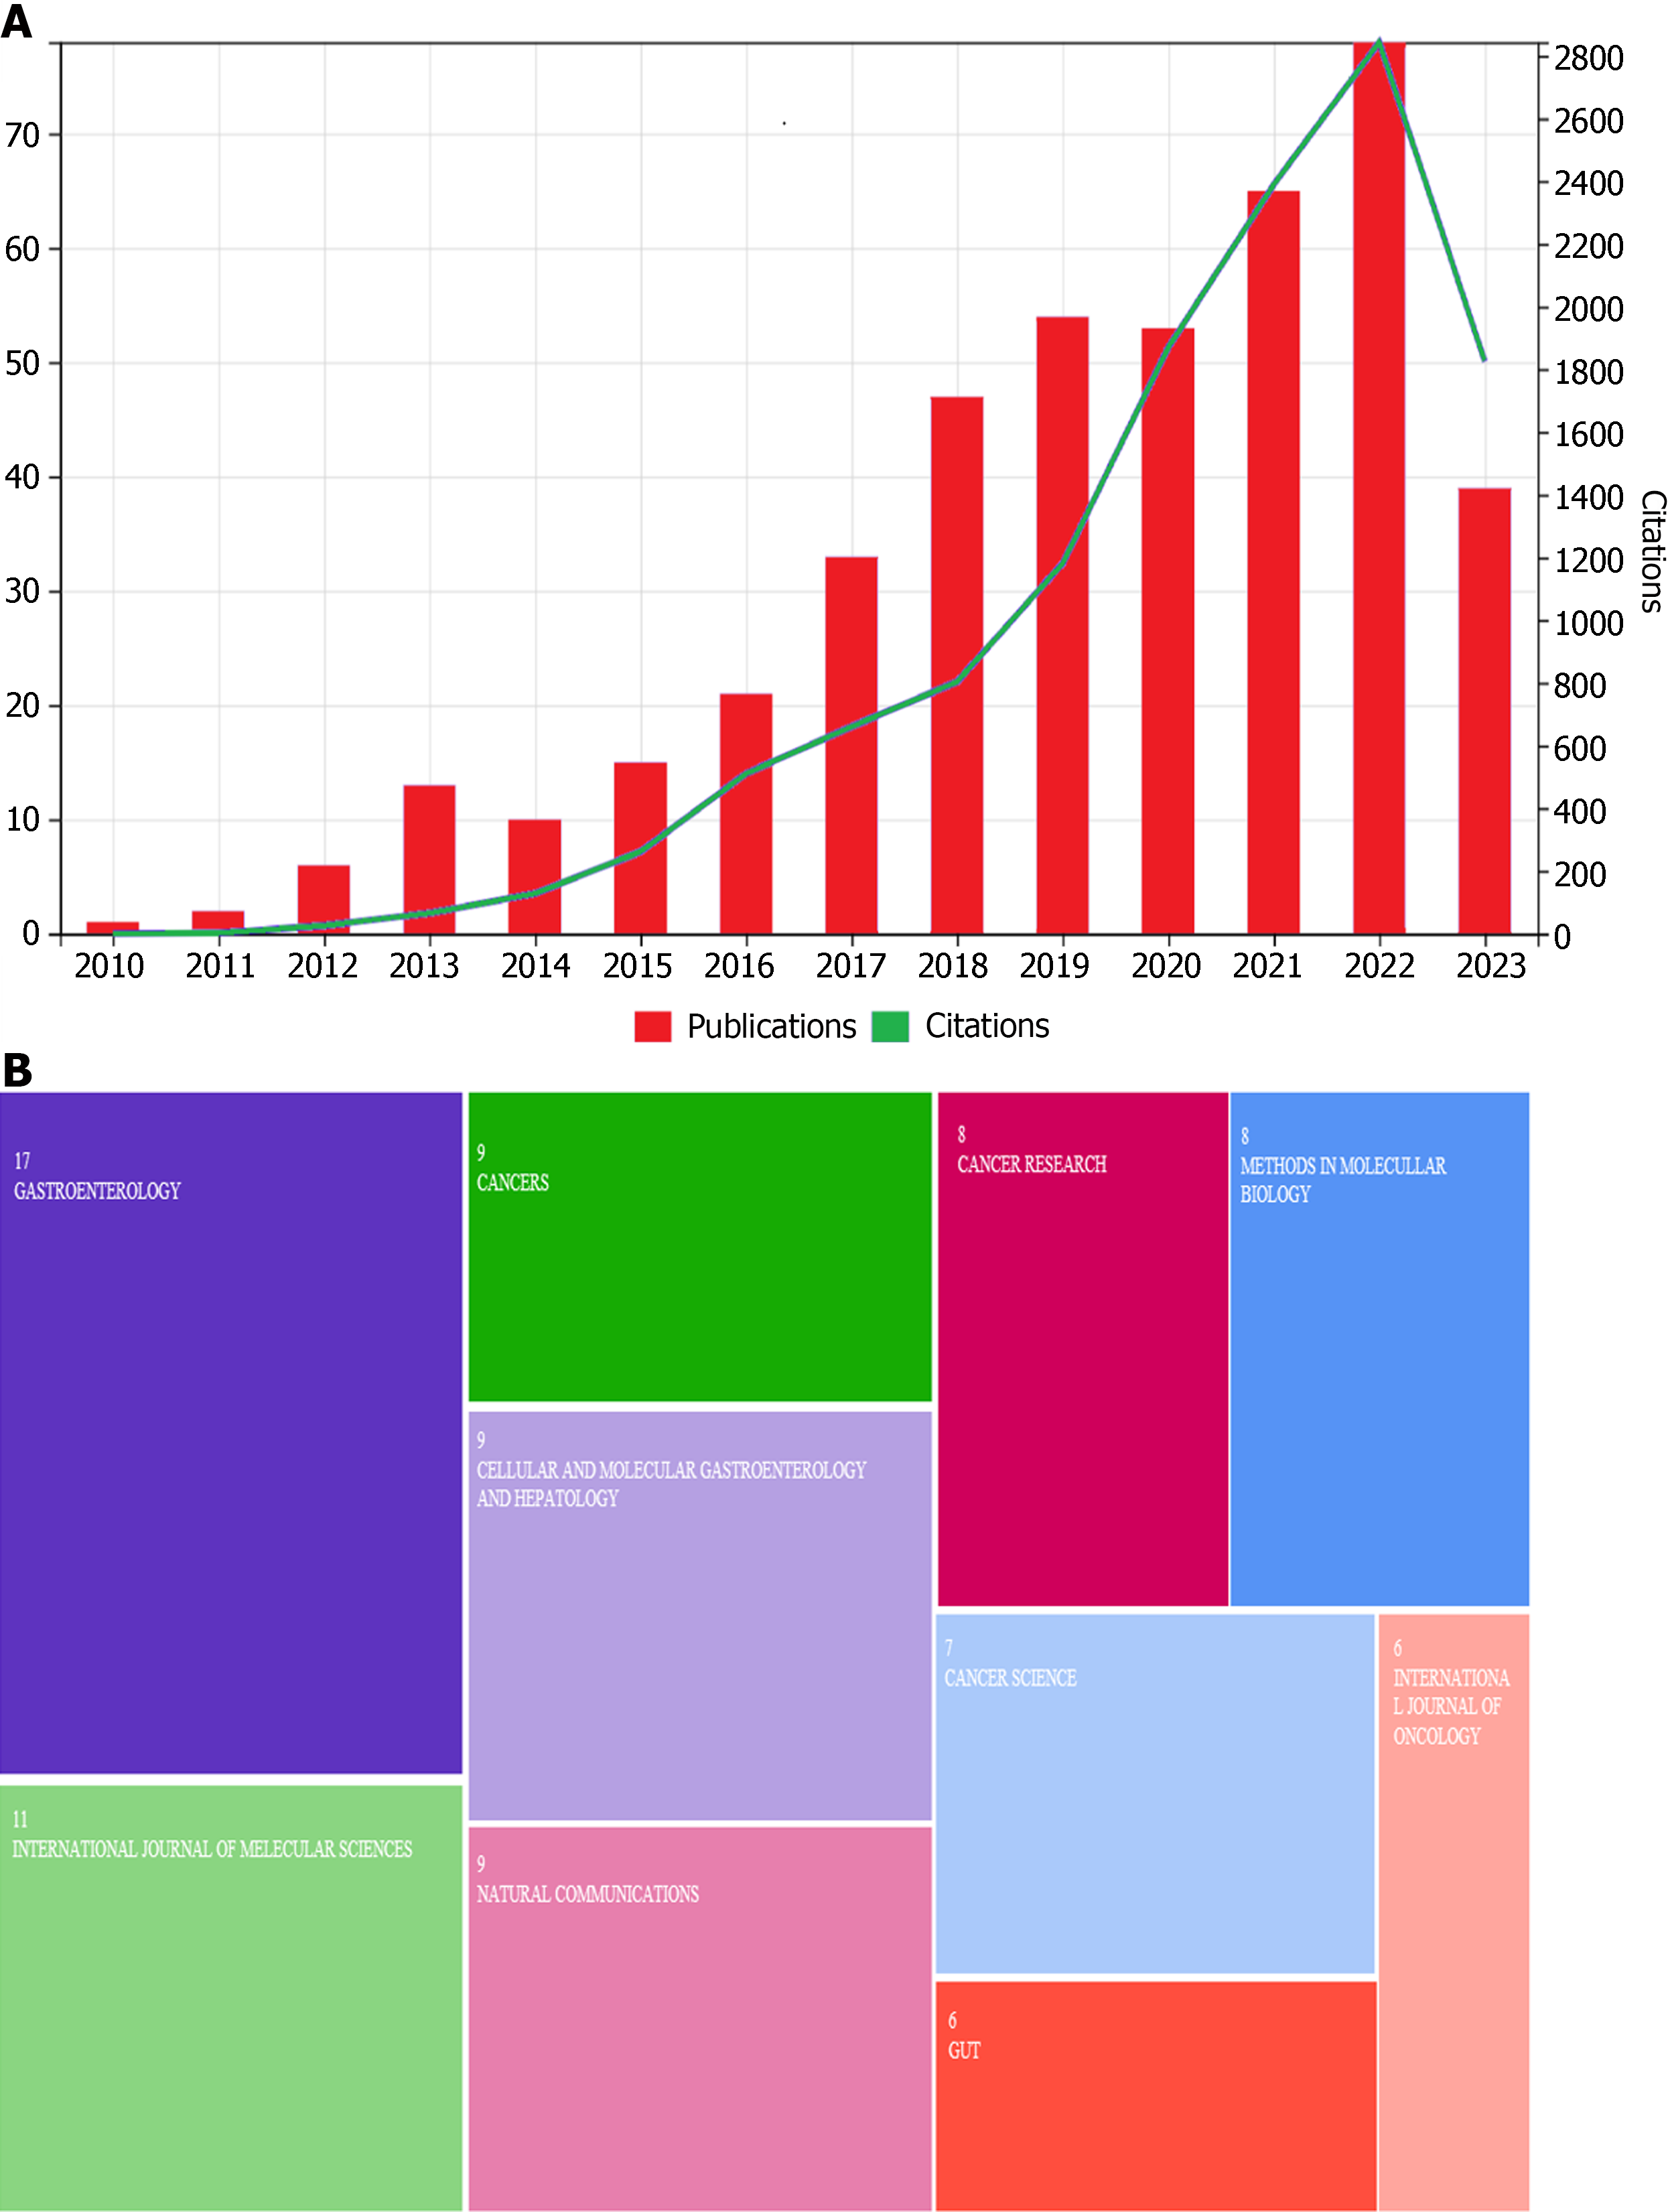
Figure 1 Publication and citation trends in gastric organoid.
A: The number of publications and citations per year from 2010 to 2023. The red bars represent the number of publications, and the green line indicates the number of citations, showing an overall upward trend in both metrics over the given period; B: Citations in different medical journals in a recent year, with each color-coded section corresponding to a different journal. The size of each section reflects the number of citations, and the number is provided within each, with Gastroenterology and Cancers being among the journals with the highest citation counts.
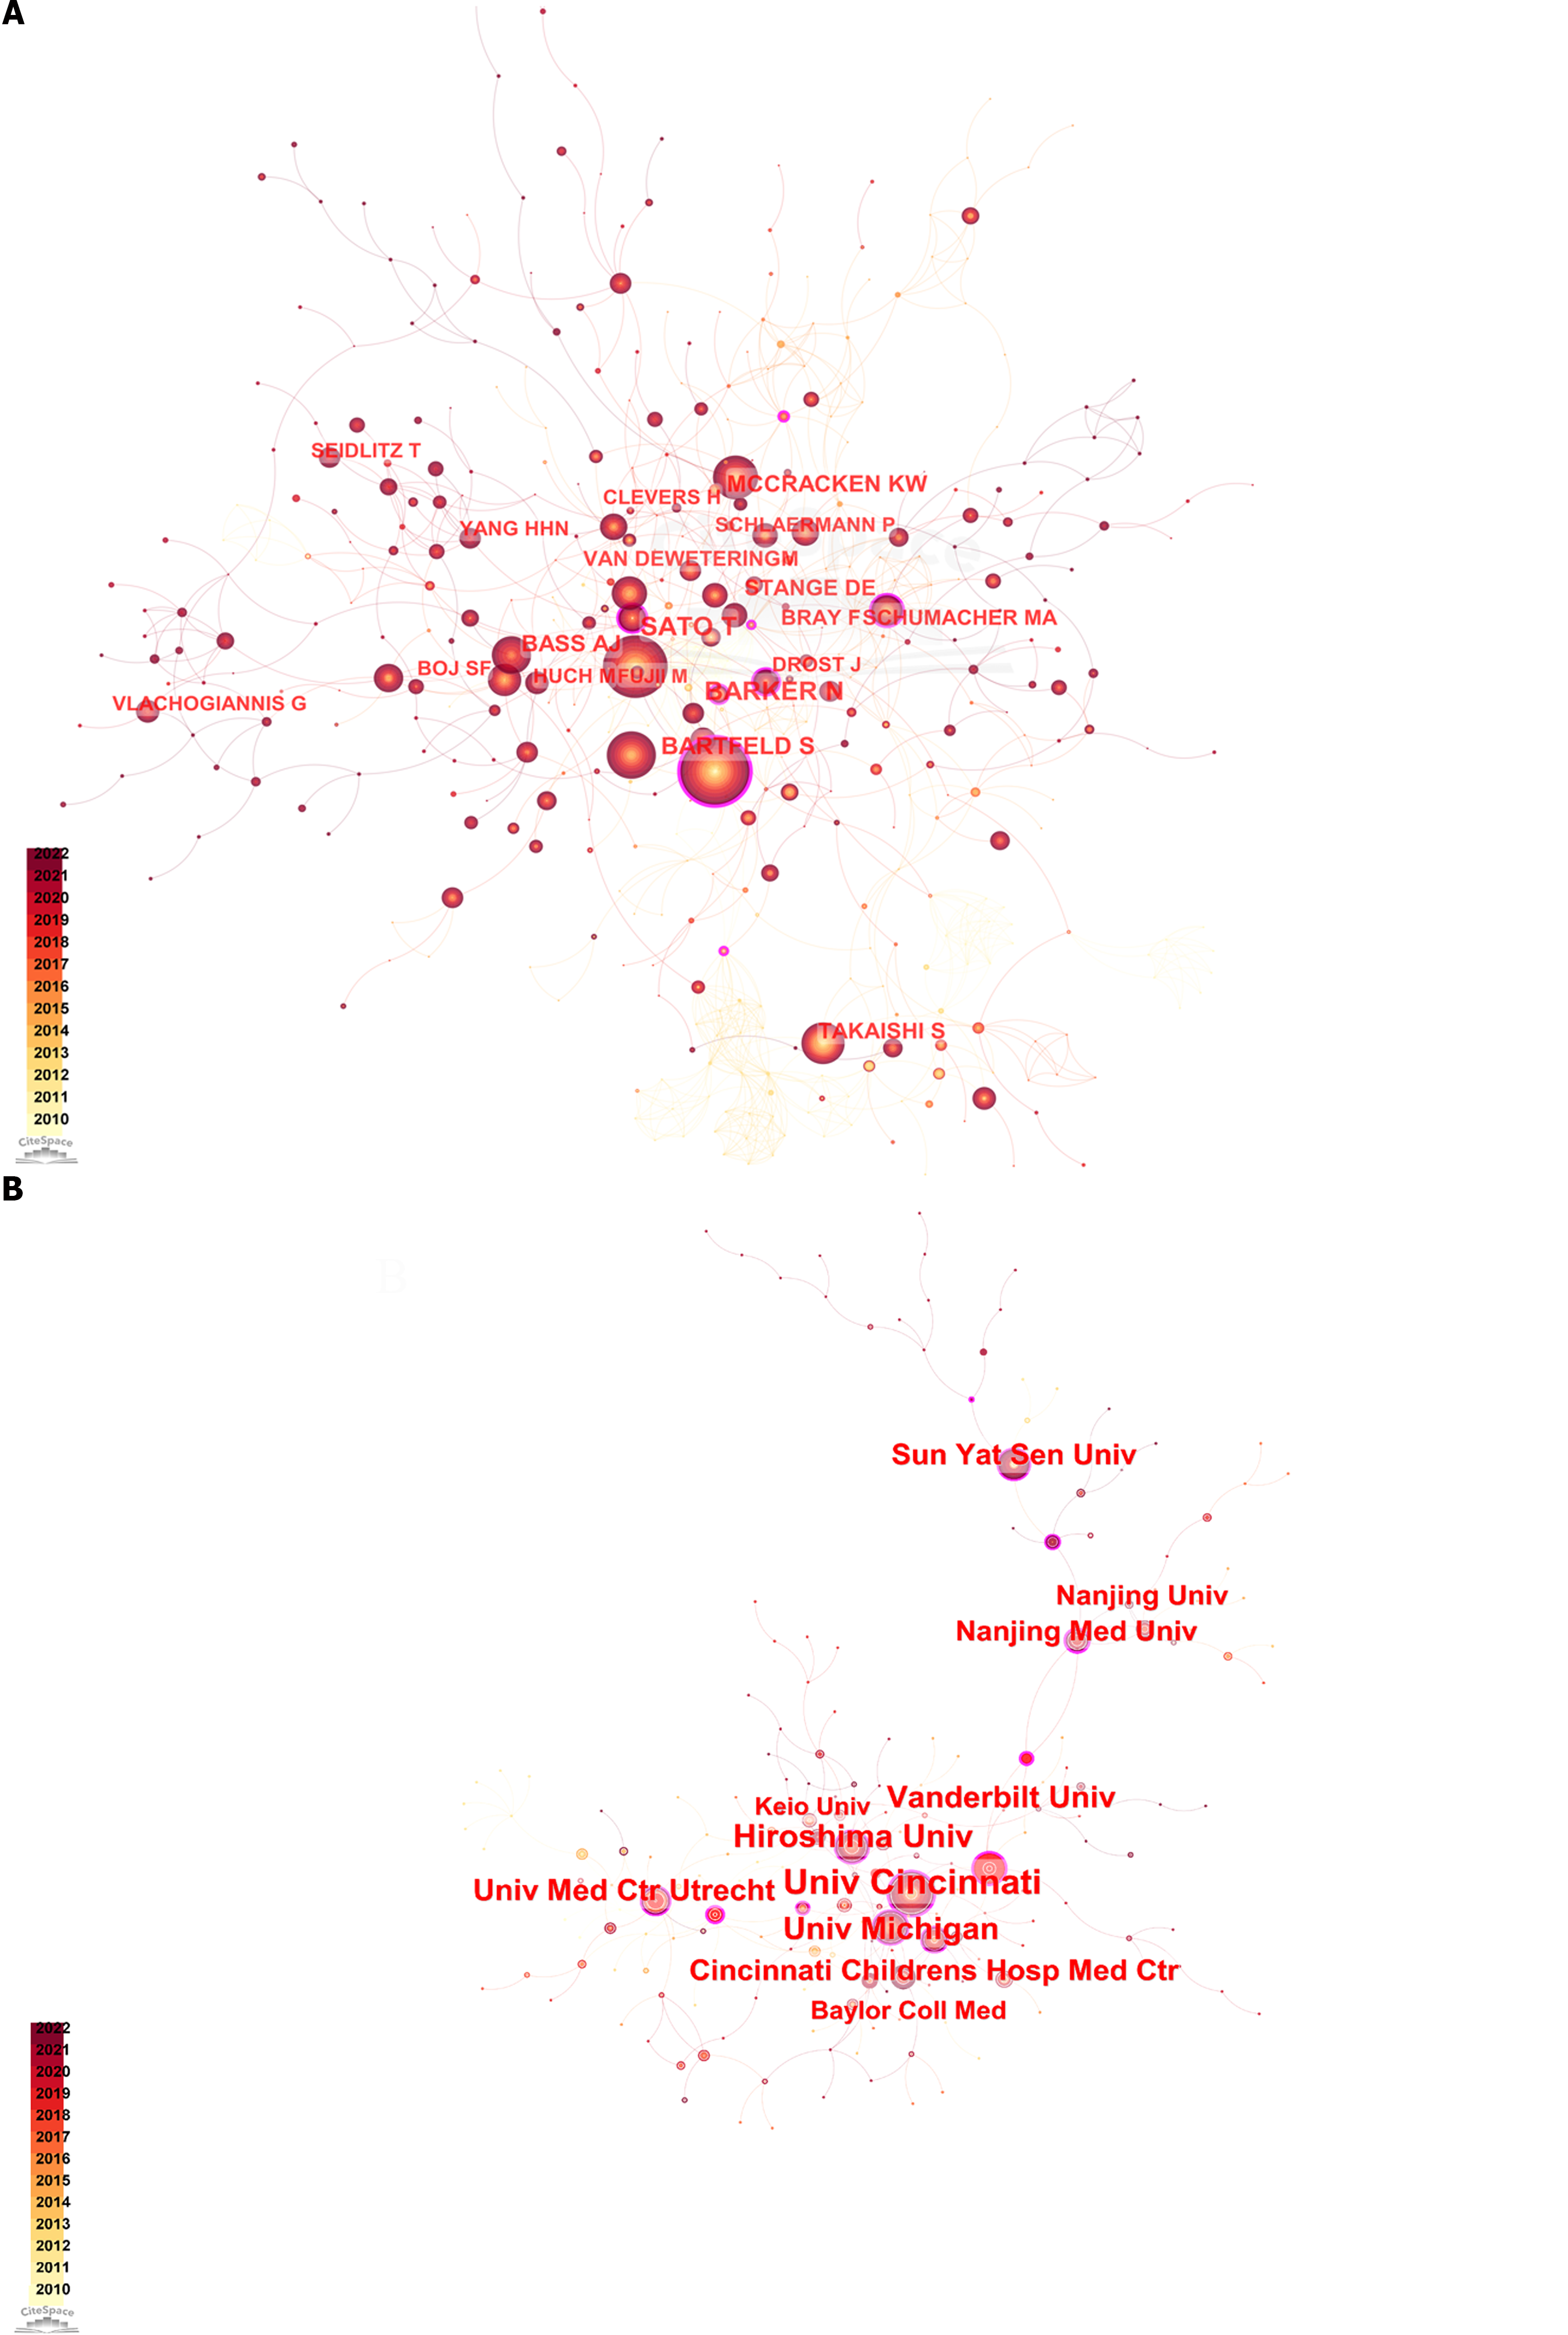
Figure 2 Network analysis of key scholars and institutions in gastric organoid research (2010-2023).
A: Depicts the collaboration and citation network among key scholars in the field, where the size of the nodes represents the citation count, and the color gradient indicates the year of publication (from light for 2010 to dark for 2023); B: The network positioning and relationships of major research institutions, with node size and color coding similarly representing the volume of citations and the temporal progression of research.
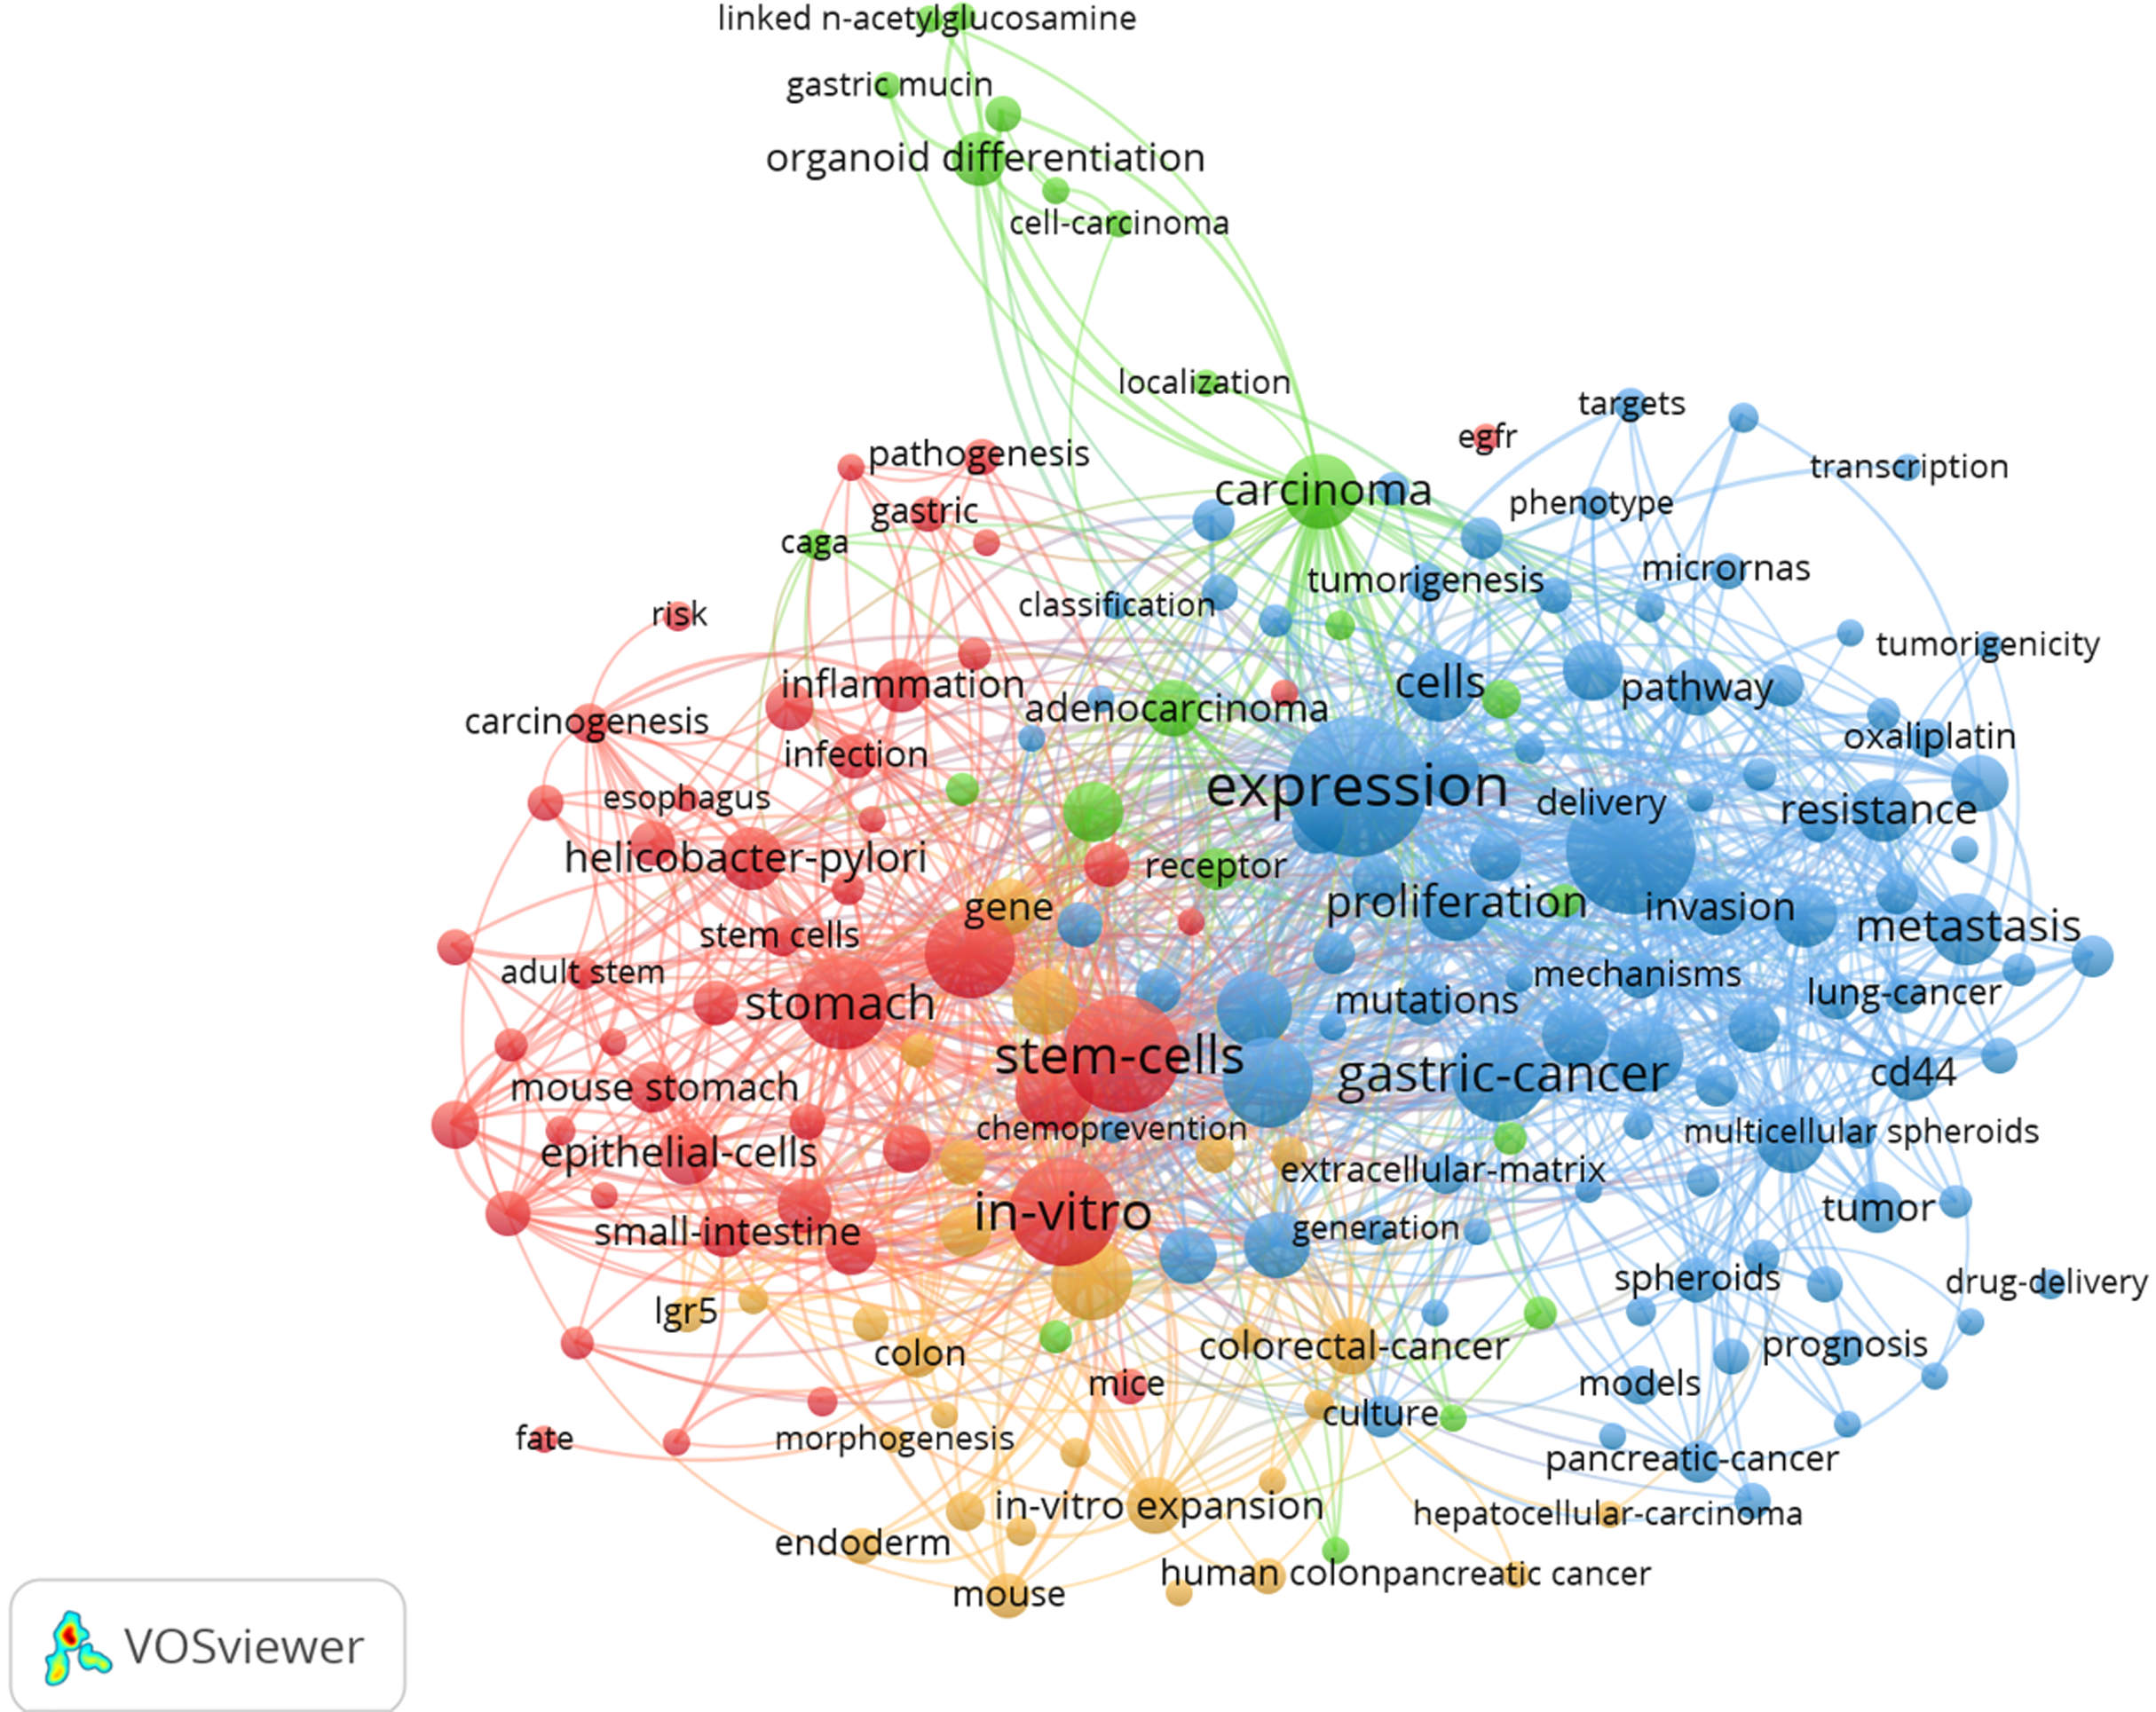
Figure 3 Keyword co-occurrence network in gastric organoid research.
This visualization maps the interconnectivity of keywords within the gastric organoid literature, with node size indicating the frequency of keyword occurrence and edge thickness representing the strength of the keyword co-occurrence.
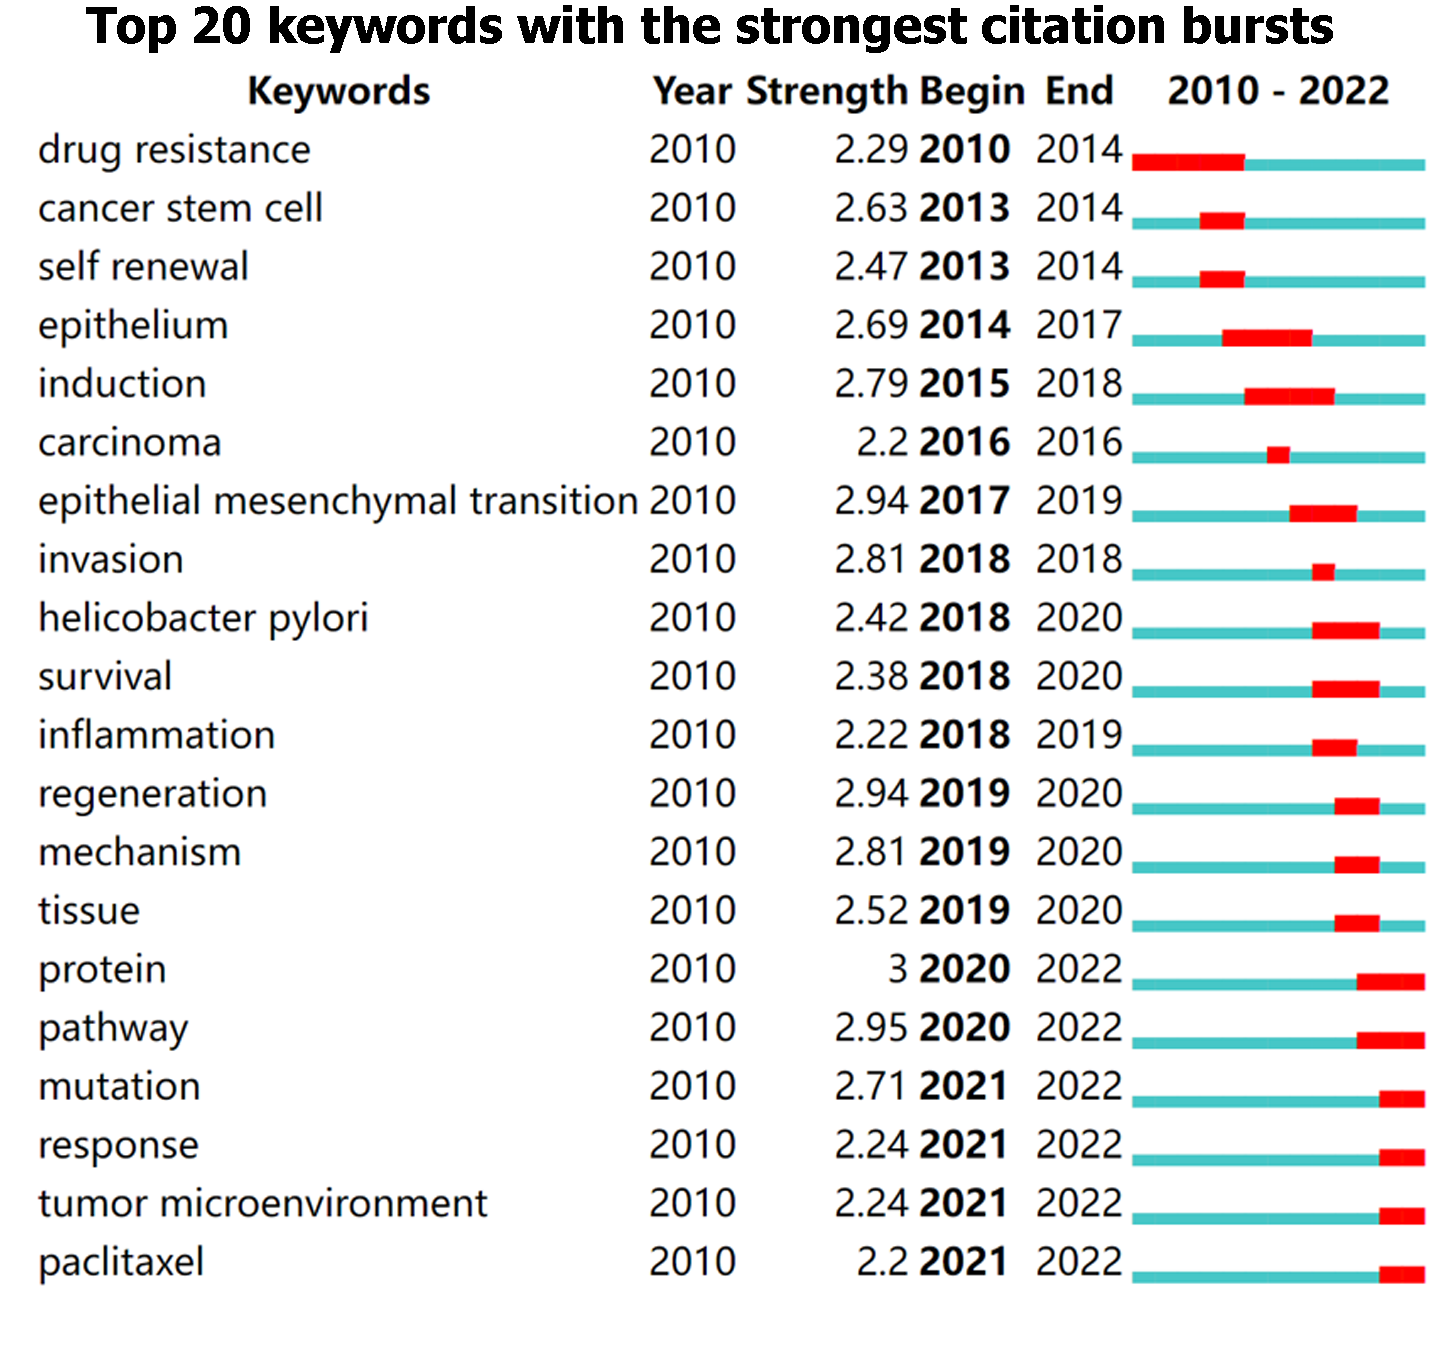
Figure 4 Top 20 keywords with the strongest citation bursts.
The bar chart highlights keywords that have experienced significant surges in citations over specific time periods, with the length and color of the bars indicating the duration and intensity of the citation bursts, respectively.
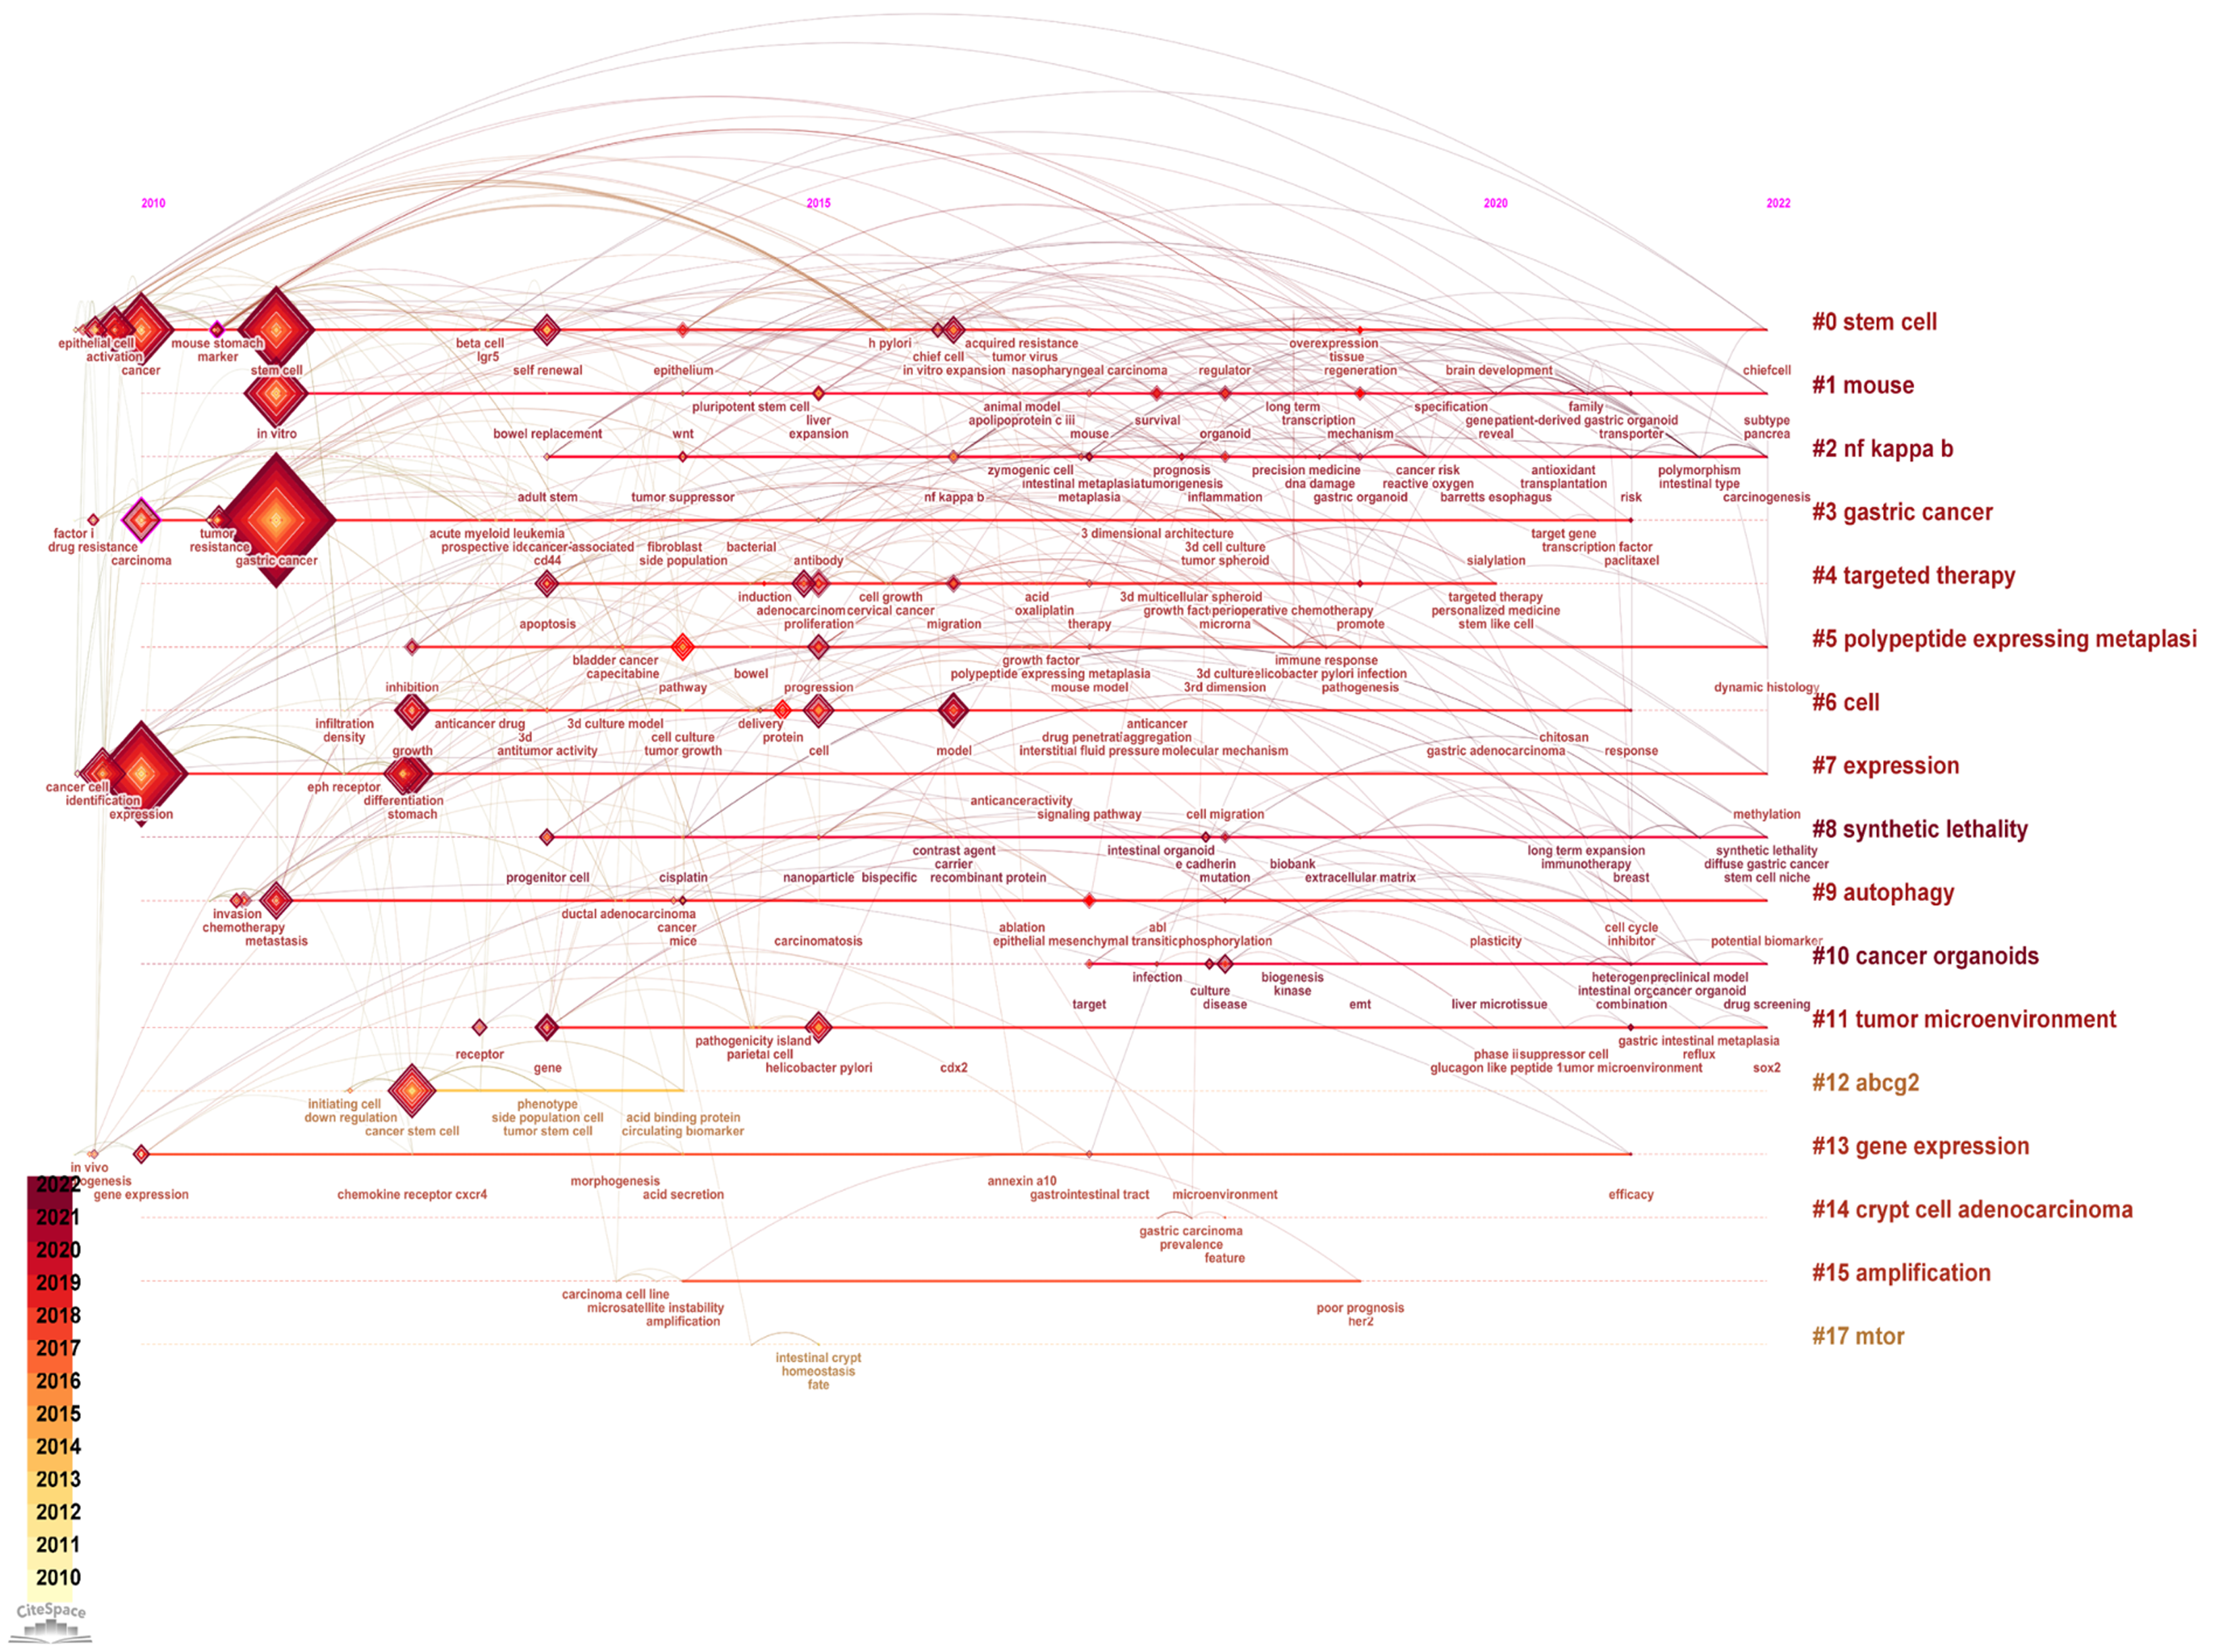
Figure 5 Timeline visualization of thematic evolution in gastric organoid research.
This timeline graphically represents the evolution of research themes in the field of gastric organoids, with cluster size indicating the number of publications and connecting lines representing thematic shifts over time.
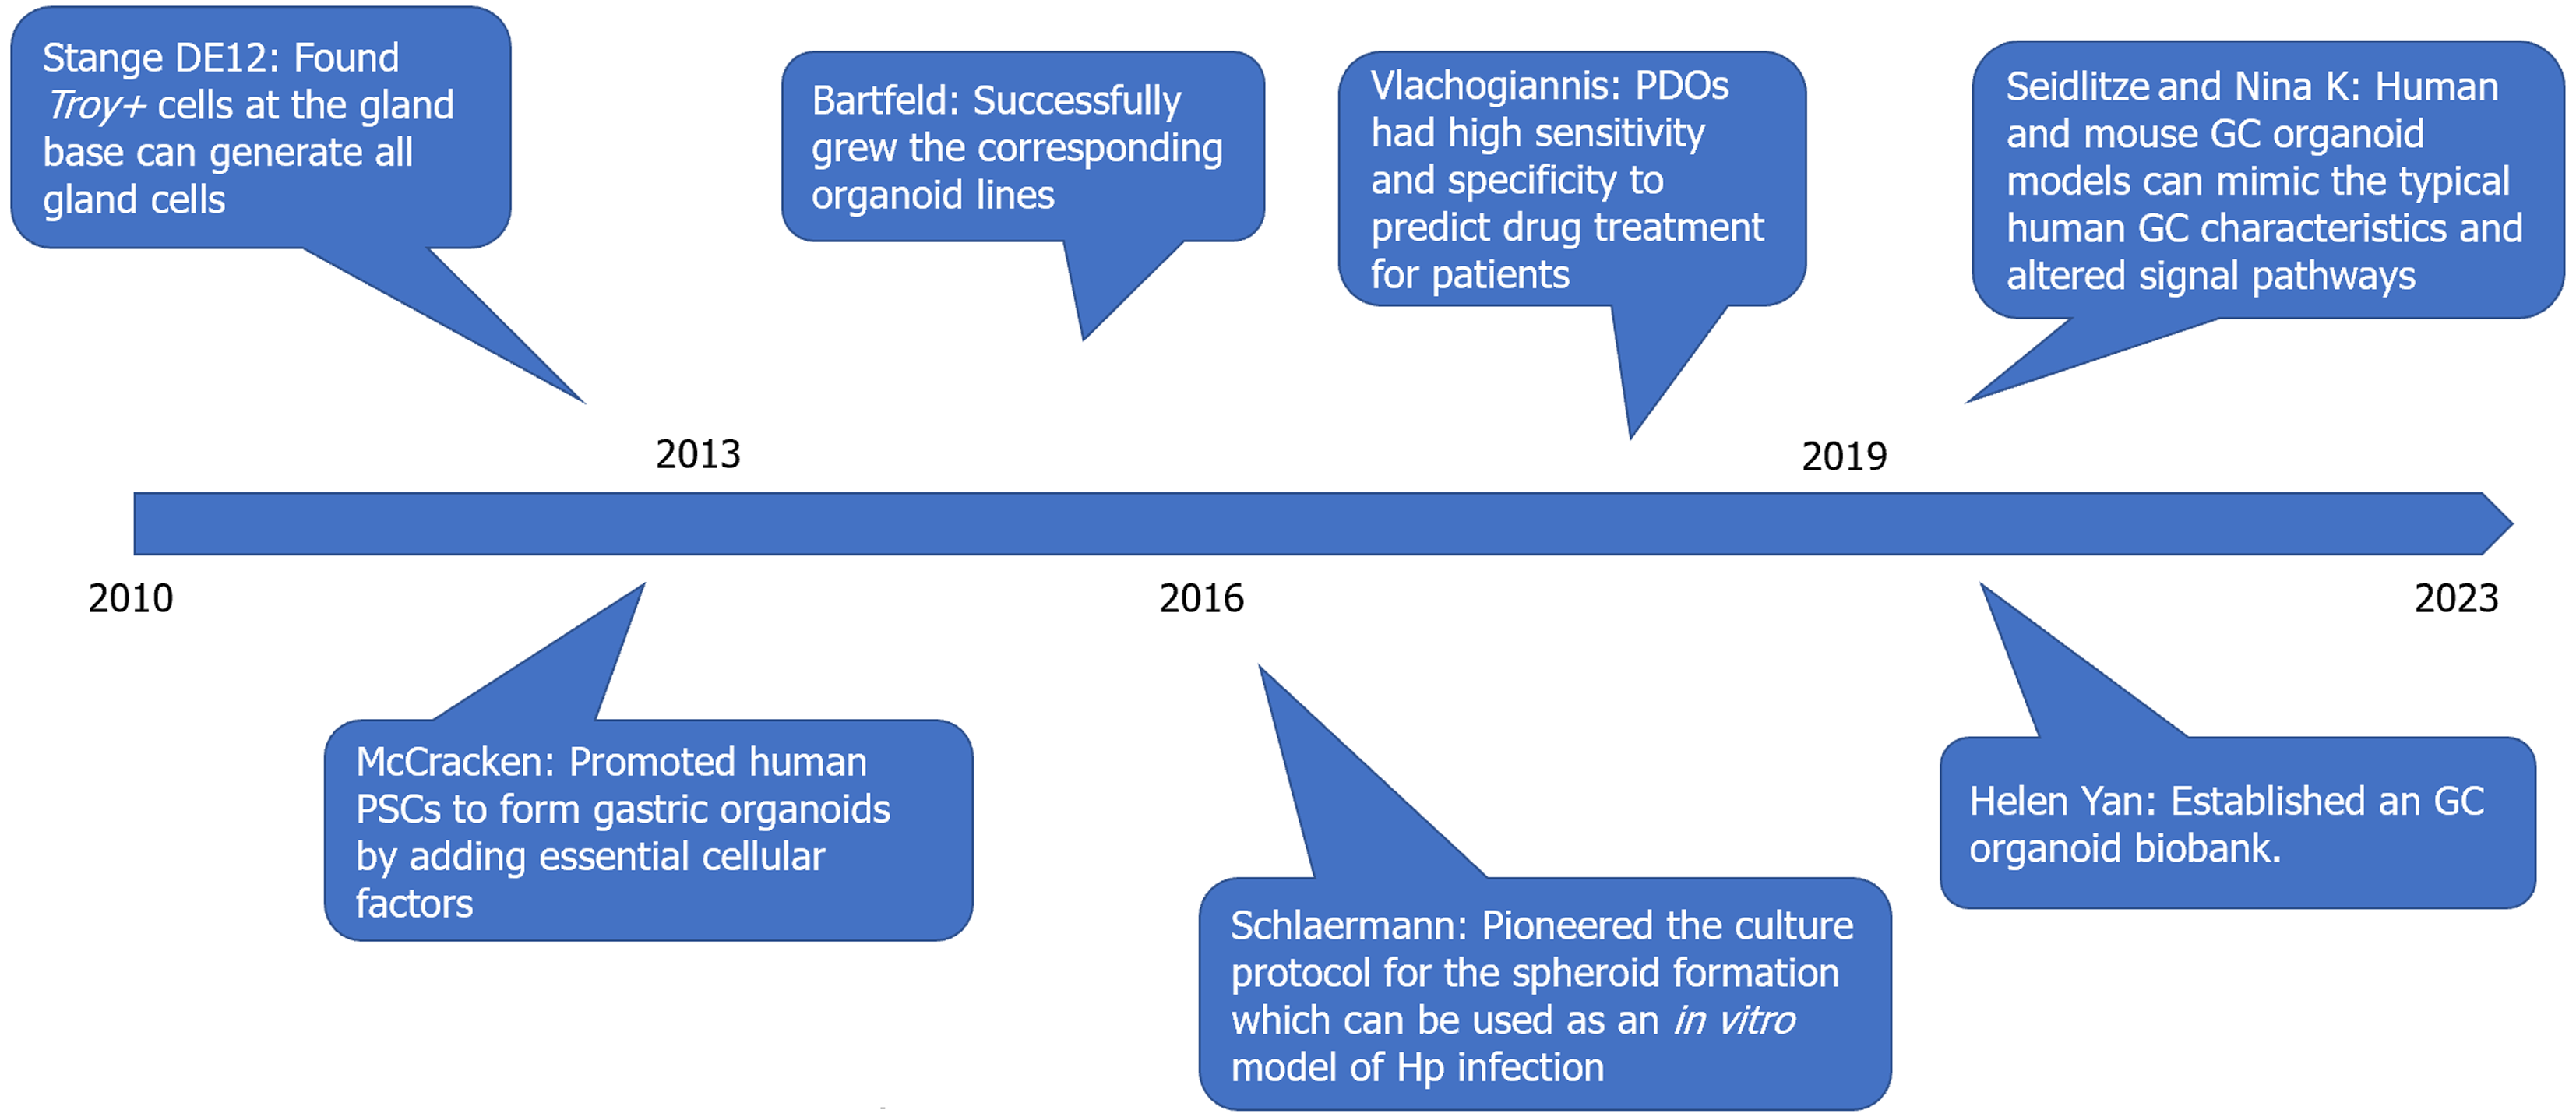
Figure 6 Milestone timeline in gastric organoid research.
A chronological display of significant milestones in gastric organoid research, with each entry detailing a breakthrough and its impact on the field. PDO: Patient-derived organoids; GC: Gastric cancer; Hp: Helicobacter pylori; PSC: Pluripotent stem cell.
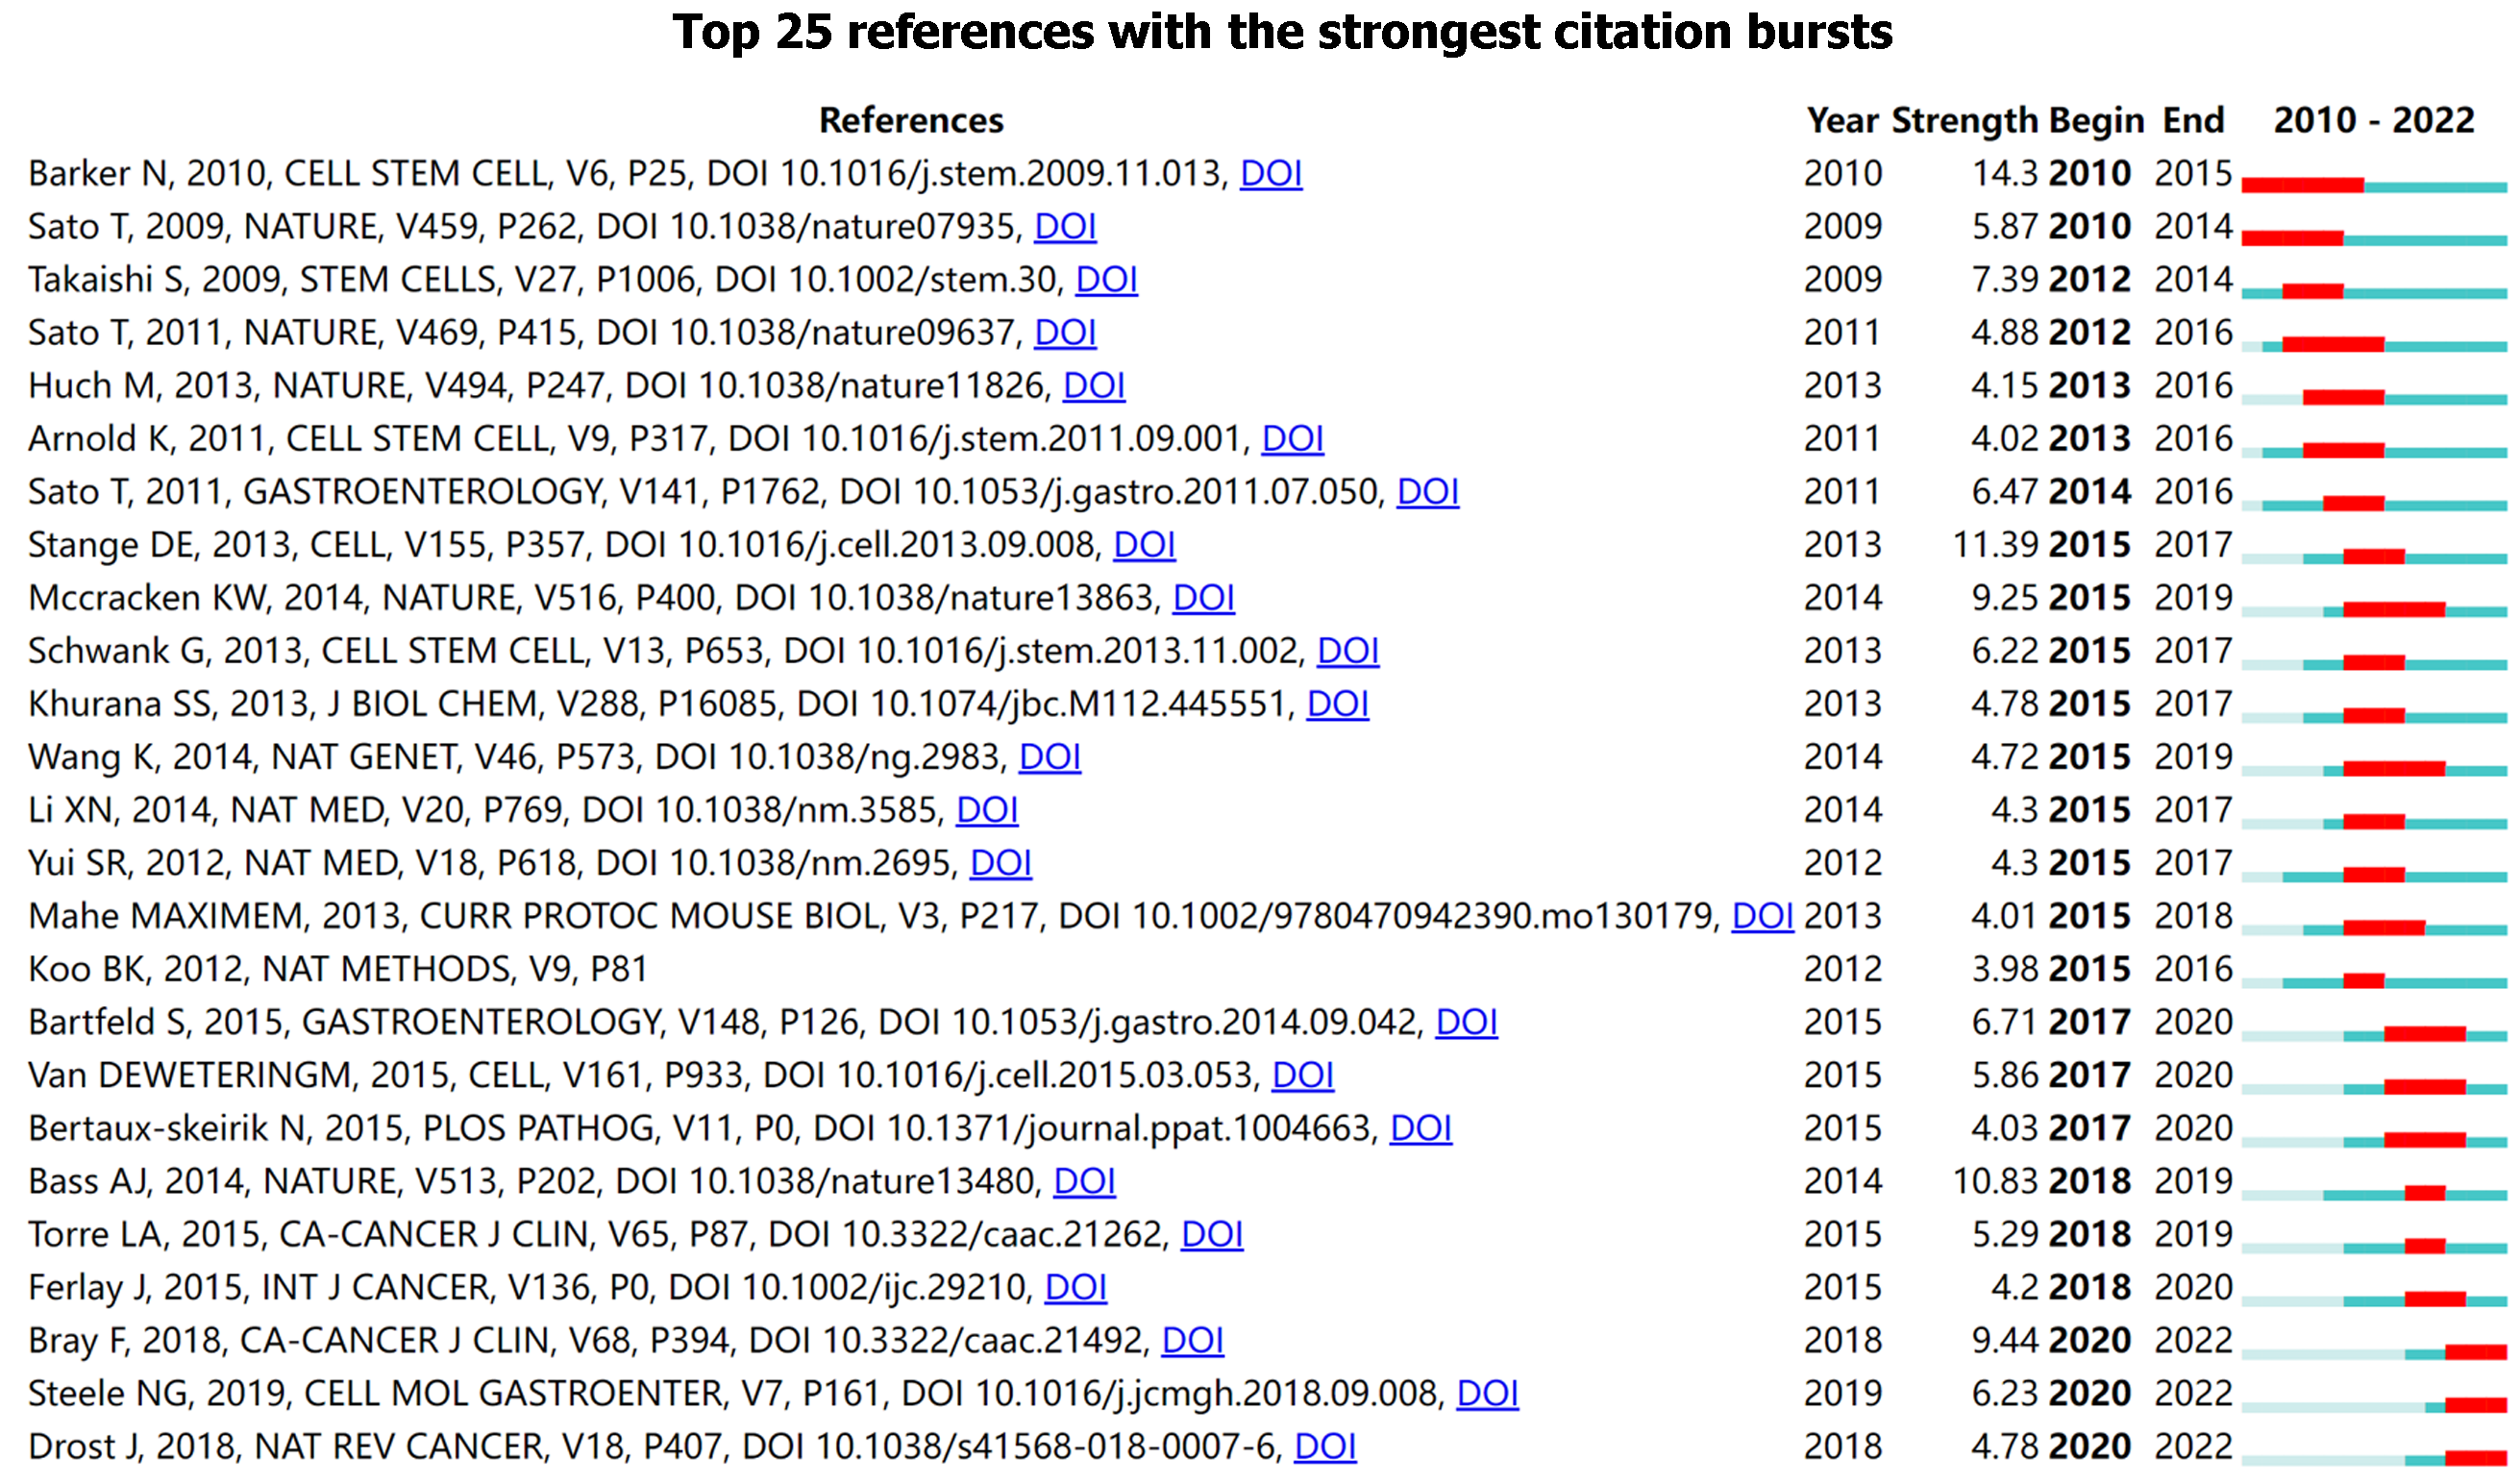
Figure 7 Top 25 references with the strongest citation bursts.
This list showcases the most influential publications in gastric organoid research, with the strength of the citation bursts providing a quantitative measure of their impact over the years indicated.
- Citation: Jiang KL, Jia YB, Liu XJ, Jia QL, Guo LK, Wang XX, Yang KM, Wu CH, Liang BB, Ling JH. Bibliometrics analysis based on the Web of Science: Current trends and perspective of gastric organoid during 2010-2023. World J Gastroenterol 2024; 30(8): 969-983
- URL: https://www.wjgnet.com/1007-9327/full/v30/i8/969.htm
- DOI: https://dx.doi.org/10.3748/wjg.v30.i8.969


