Copyright
©The Author(s) 2024.
World J Gastroenterol. Feb 28, 2024; 30(8): 919-942
Published online Feb 28, 2024. doi: 10.3748/wjg.v30.i8.919
Published online Feb 28, 2024. doi: 10.3748/wjg.v30.i8.919
Figure 1 Differentially expressed lipid metabolism-related and prognosis-related long non-coding RNAs.
A: Flow chart of the analysis process in our study; B and C: Heatmap and volcano plot demonstrating differentially expressed lipid metabolism-related long non-coding RNAs (lncRNAs) between Hepatocellular carcinoma (HCC) tissues and nontumor tissues. Red, positive regulation; green, negative regulation; D: Forest plot of hazard ratios (HR) constrating the prognostic value of lncRNAs. The dashed line indicates that the location of the HR was 1; E: Construction and analysis of the prognostic risk model. Plots for Least absolute shrinkage and selection operator expression coefficients of 10 Lipid metabolism-related lncRNAs; F: Cross-validation plot for the penalty term; G: The HRs and P values from the multivariate Cox regression analysis are shown in the forest plot; H-J: Three differentially expressed lncRNAs between HCC and nontumor tissues in the GeneExpression Profiling Interactive Analysis database; K-M: Survival curves of patients with differential expression of three lncRNAs in GEPIA. HCC: Hepatocellular carcinoma; Lasso: Least absolute shrinkage and selection operator; KEGG: Kyoto Encyclopedia of Genes and Genomes; NRAV: Negative regulator of antiviral response; TMCC1-AS1: RNA transmembrane and coiled-coil domain family 1 antisense RNA 1; FC: Fold change; FDR: False discovery rate; TPM: Transcripts Per Kilobase of exon model per Million mapped reads; TCGA: The Cancer Genome Atlas; ROC: Receiver operating characteristic.
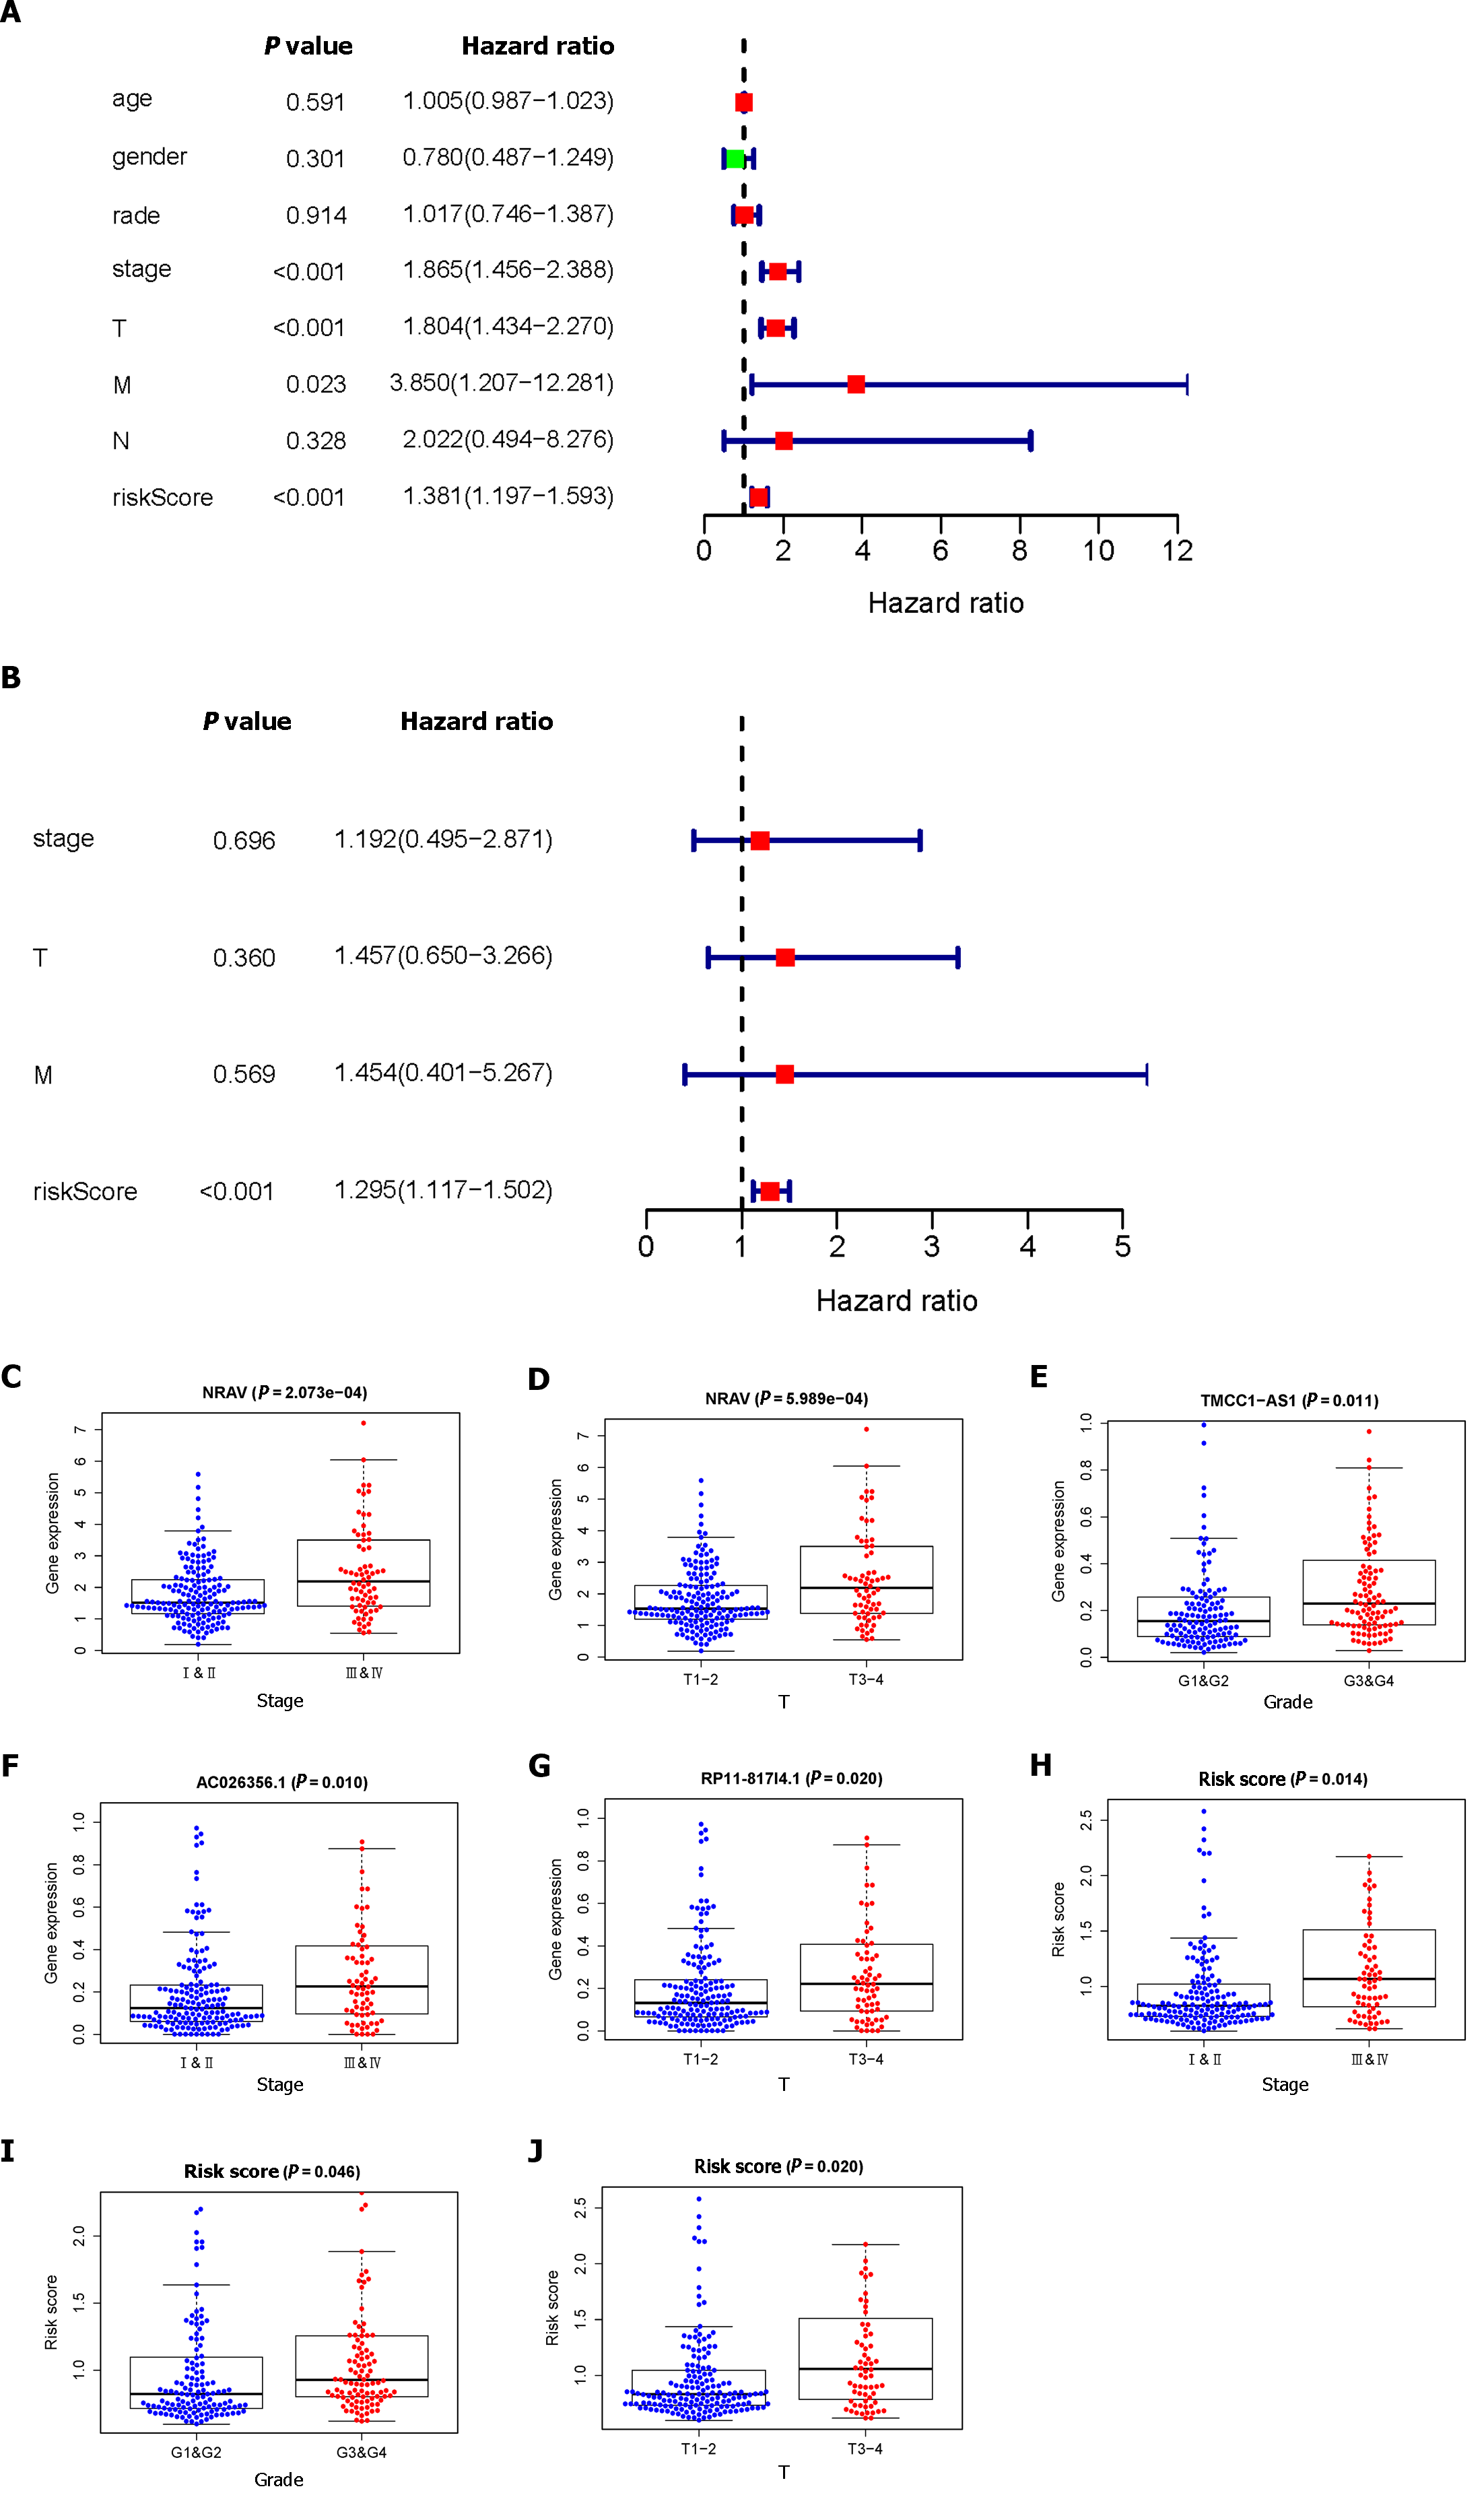
Figure 2 Analysis of the prognostic risk model.
A: Univariate regression analysis of hepatocellular carcinoma (HCC) incidence and the relationships between age, sex, grade, stage, T stage, M stage, N stage and the riskscore; B: Multiple regression analysis of HCC and the relationships between stage, T stage, M stage, and the riskscore; C-J: Correlation of the prognostic lipid metabolism-related signature with clinicopathological characteristics. NRAV: Negative regulator of antiviral response; TMCC1-AS1: RNA transmembrane and coiled-coil domain family 1 antisense RNA 1; NRAV: Negative regulator of antiviral response; TMCC1-AS1: RNA transmembrane and coiled-coil domain family 1 antisense RNA 1.
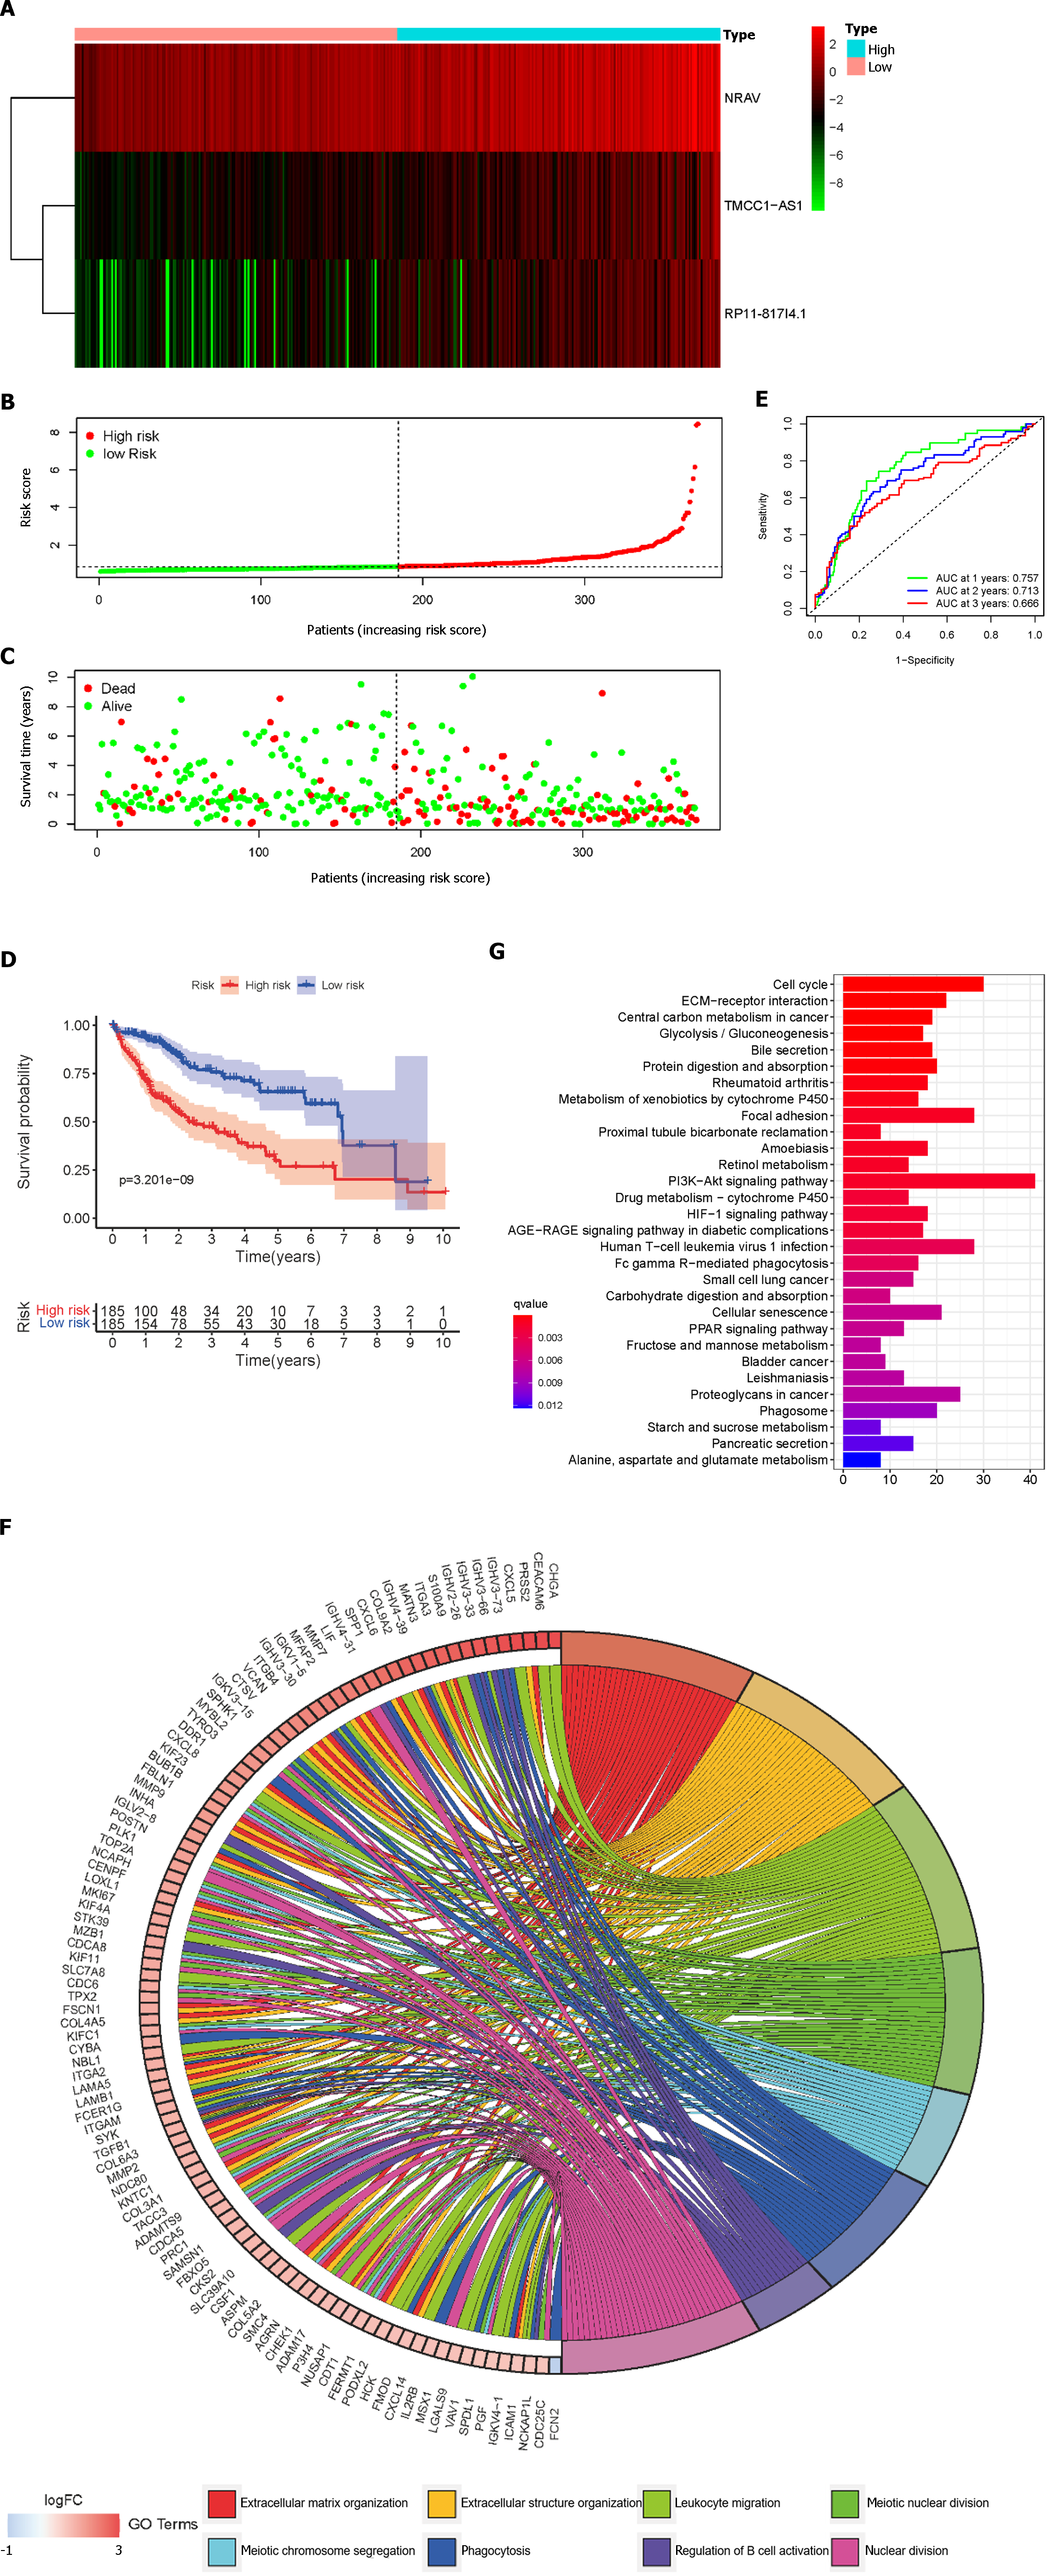
Figure 3 Lipid metabolism-related long noncoding RNAs in hepatocellular carcinoma patients from the The Cancer Genome Atlas cohort.
A: The distribution of patients in the high-risk group and low-risk group; B: Heatmap demonstrating the distribution of the expression of the three long non-coding RNAs in the The Cancer Genome Atlas (TCGA) cohort; C: Survival status of the high-risk and low-risk groups; D: Kaplan-Meier survival curve of overall survival in HCC patients in the TCGA cohort according to the median cutoff value; E: Receiver Operating Characteristic Curves at 1, 2, and 3 years in the TCGA cohort; F and G: Functional enrichment analysis of the lipid metabolism-related risk signatures: Gene Ontology-biological process analysis, Kyoto Encyclopedia of Genes and Genomes analysis. NRAV: Negative regulator of antiviral response; TMCC1-AS1: RNA transmembrane and coiled-coil domain family 1 antisense RNA 1; AUC: Area under curve.
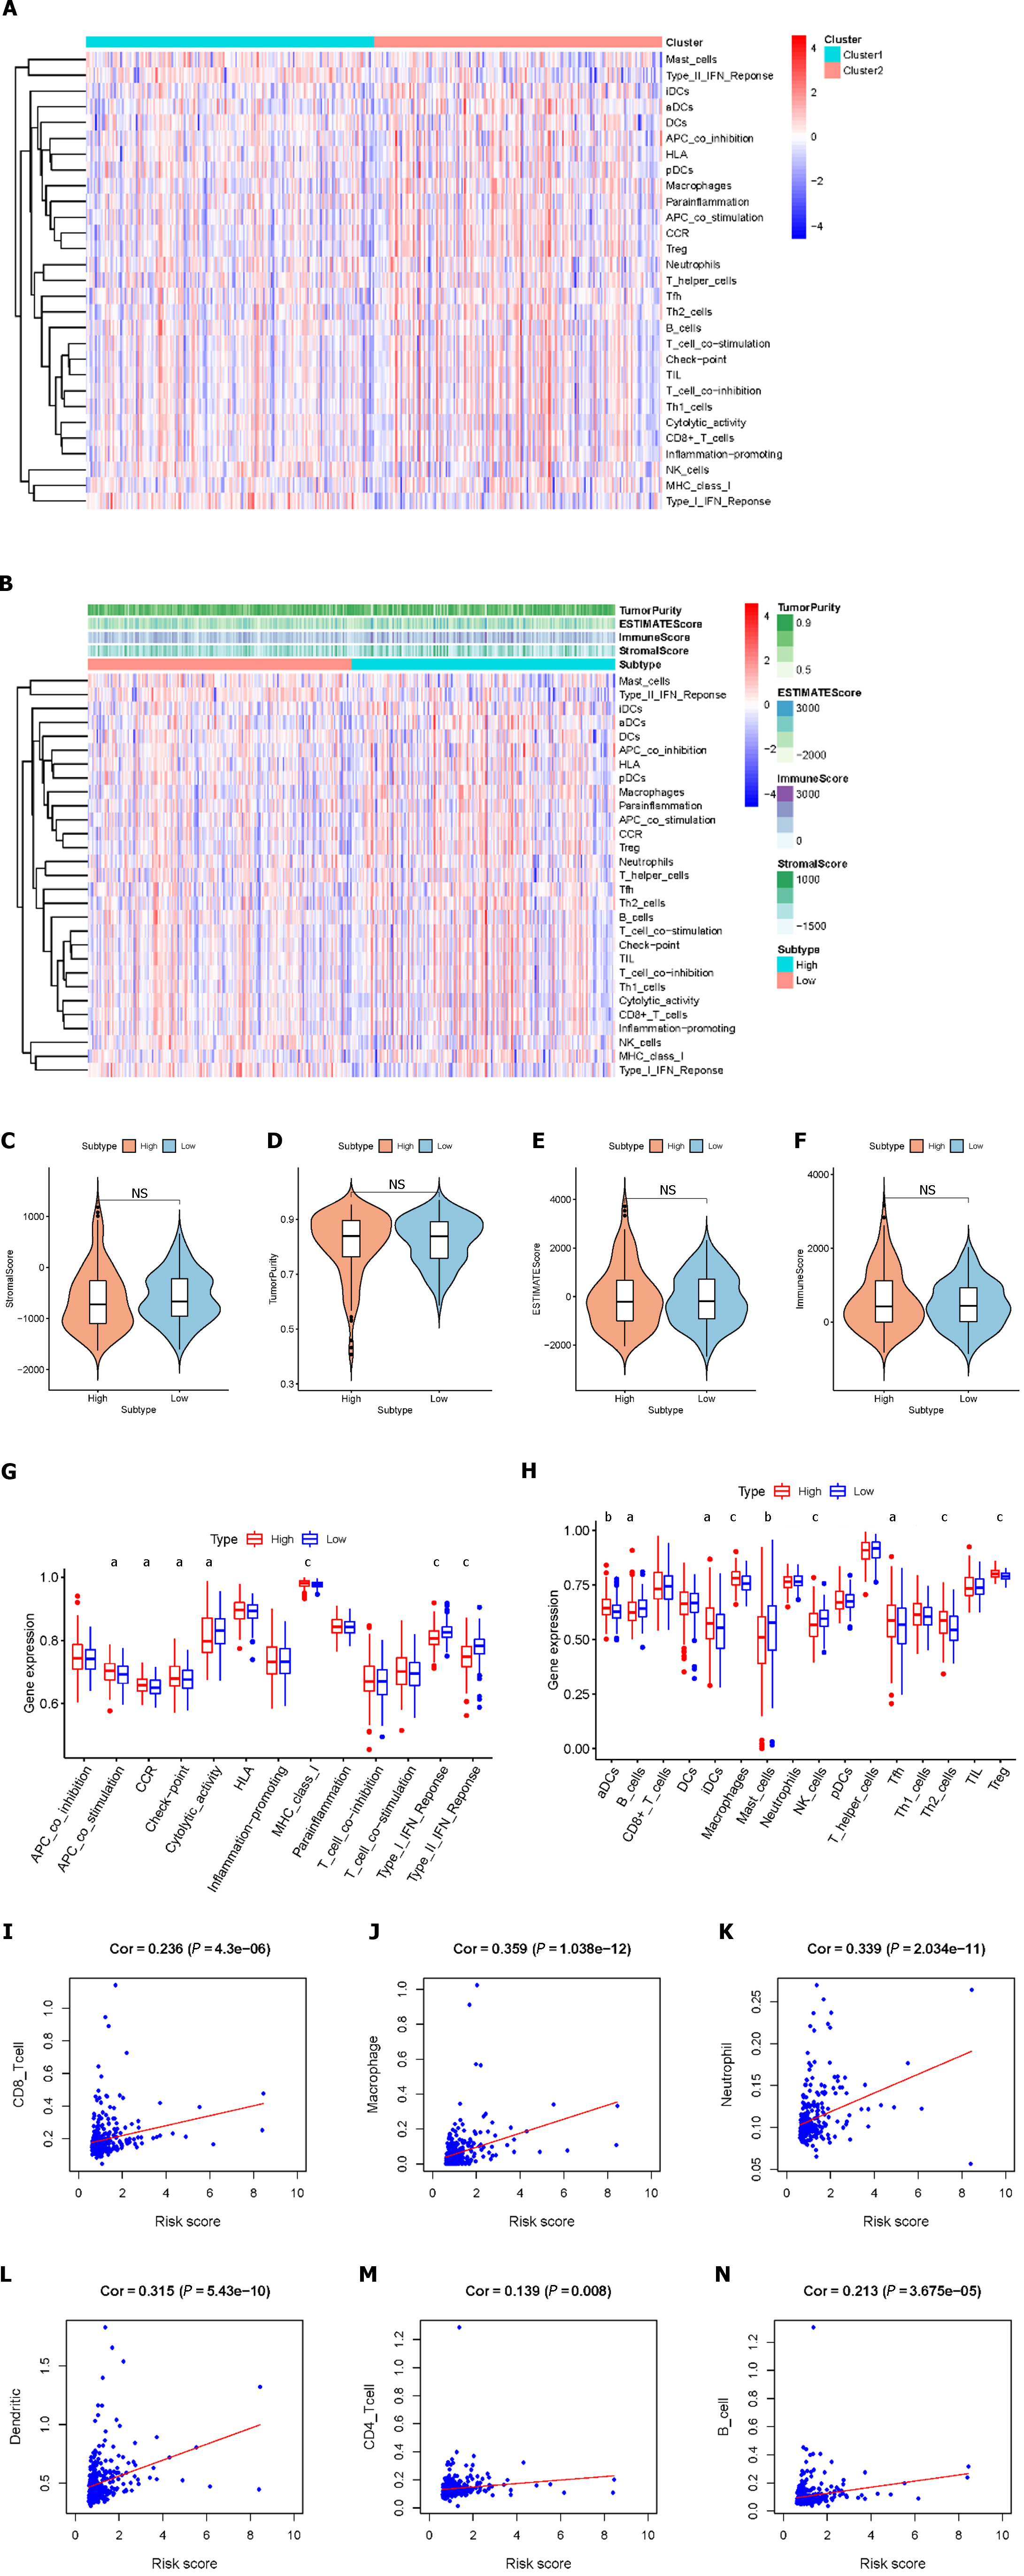
Figure 4 Lipid metabolism-related risk signatures are closely related to tumor environment characteristics and immune infiltration in hepatocellular carcinoma.
A: Immune-related risk signature component expression; B: The correlations between risk groups and the level of tumor immune infiltration are shown based on the immune score, stromal score, and tumor purity score; C-F: Comparison of the ESTIMATE score, stromal score, immune score, and tumor purity between the high-risk group and low-risk group; G: Comparison of immune cell abundances between the high-risk and low-risk groups of hepatocellular carcinoma (HCC) patients; H: Comparison of immune-related functions between the high-risk and low-risk groups of HCC patients; I-N: Relationships between the risk score and infiltration abundances of six types of immune cells. Cor: Correlation.
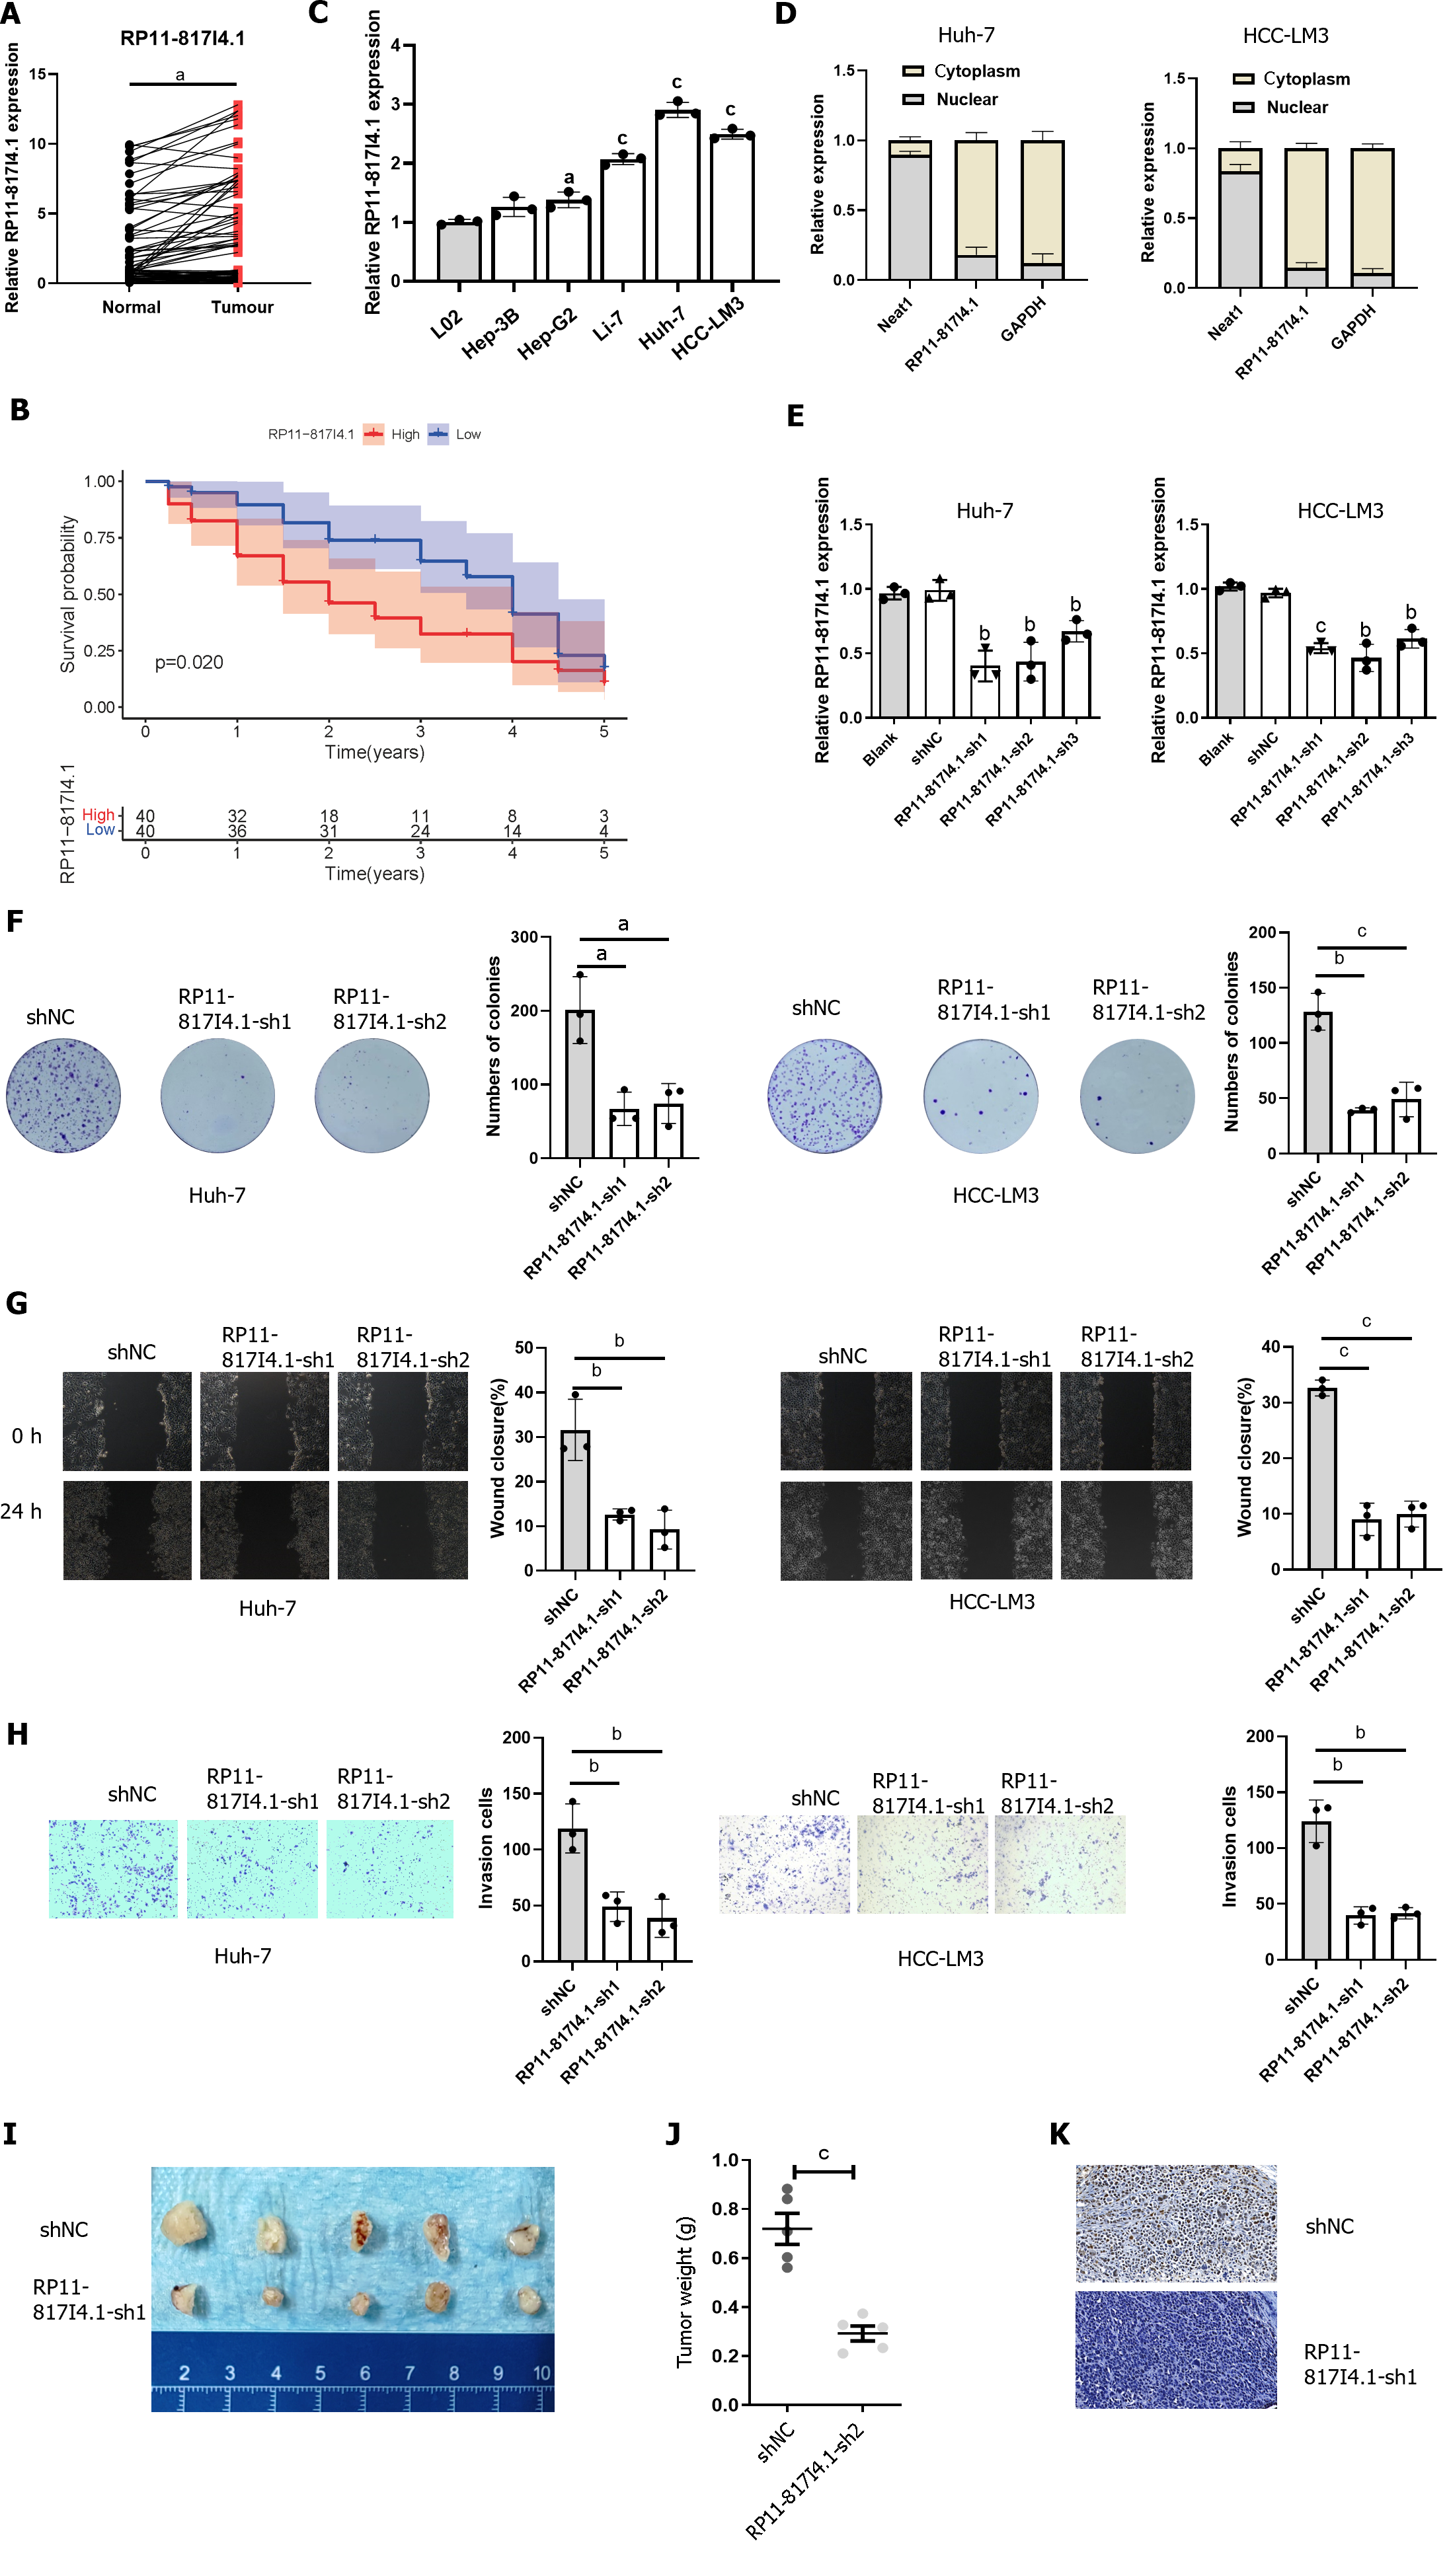
Figure 5 RP11-817I4.
1 is overexpressed in hepatocellular carcinoma tissues and cell lines and is correlated with poor survival. A: Quantitative real-time polymerase chain reaction (qRT-PCR) evaluation of RP11-817I4.1 expression in hepatocellular carcinoma (HCC) tissue samples compared with that in matched adjacent normal tissue samples; B: Kaplan-Meier analysis showed that high RP11-817I4.1 expression was associated with poor overall survival in HCC patients; C: Expression levels of RP11-817I4.1 in different HCC cell lines Hep-G2, Hep-3B, Li-7, Huh-7, and HCC-LM3: compared with those in the normal human hepatic cell line L02; D: The localization of RP11-817I4.1 was identified in Huh-7 and HCC-LM3 cells via a subcellular fractionation assay; E: RP11-817I4.1 expression levels were determined via qRT-PCR assays after Huh-7 and HCC-LM3 cells were transfected with empty vector, shNC, RP11-817I4.1-sh1, RP11-817I4.1-sh2, or RP11-817I4.1-sh3; F: The effects of RP11-817I4.1 knockdown on Huh-7 and HCC-LM3 cell proliferation were assessed via colony formation assays; G: A wound healing assay was performed to evaluate cell mobility; H: Cell invasion was assessed and quantified by performing Transwell invasion assays; I: HCC-LM3 cells were transfected with either shRNA or the RP11-817I4.1-sh1 plasmid to establish an HCC subcutaneous tumor model; J: We measured the weight of the HCC subcutaneous tumor model; K: Ki67 staining was performed in the HCC subcutaneous tumor model. The data are presented as the mean ± SD and are representative of three independent experiments. aP < 0.05, bP < 0.01, cP < 0.001. HCC: Hepatocellular carcinoma.
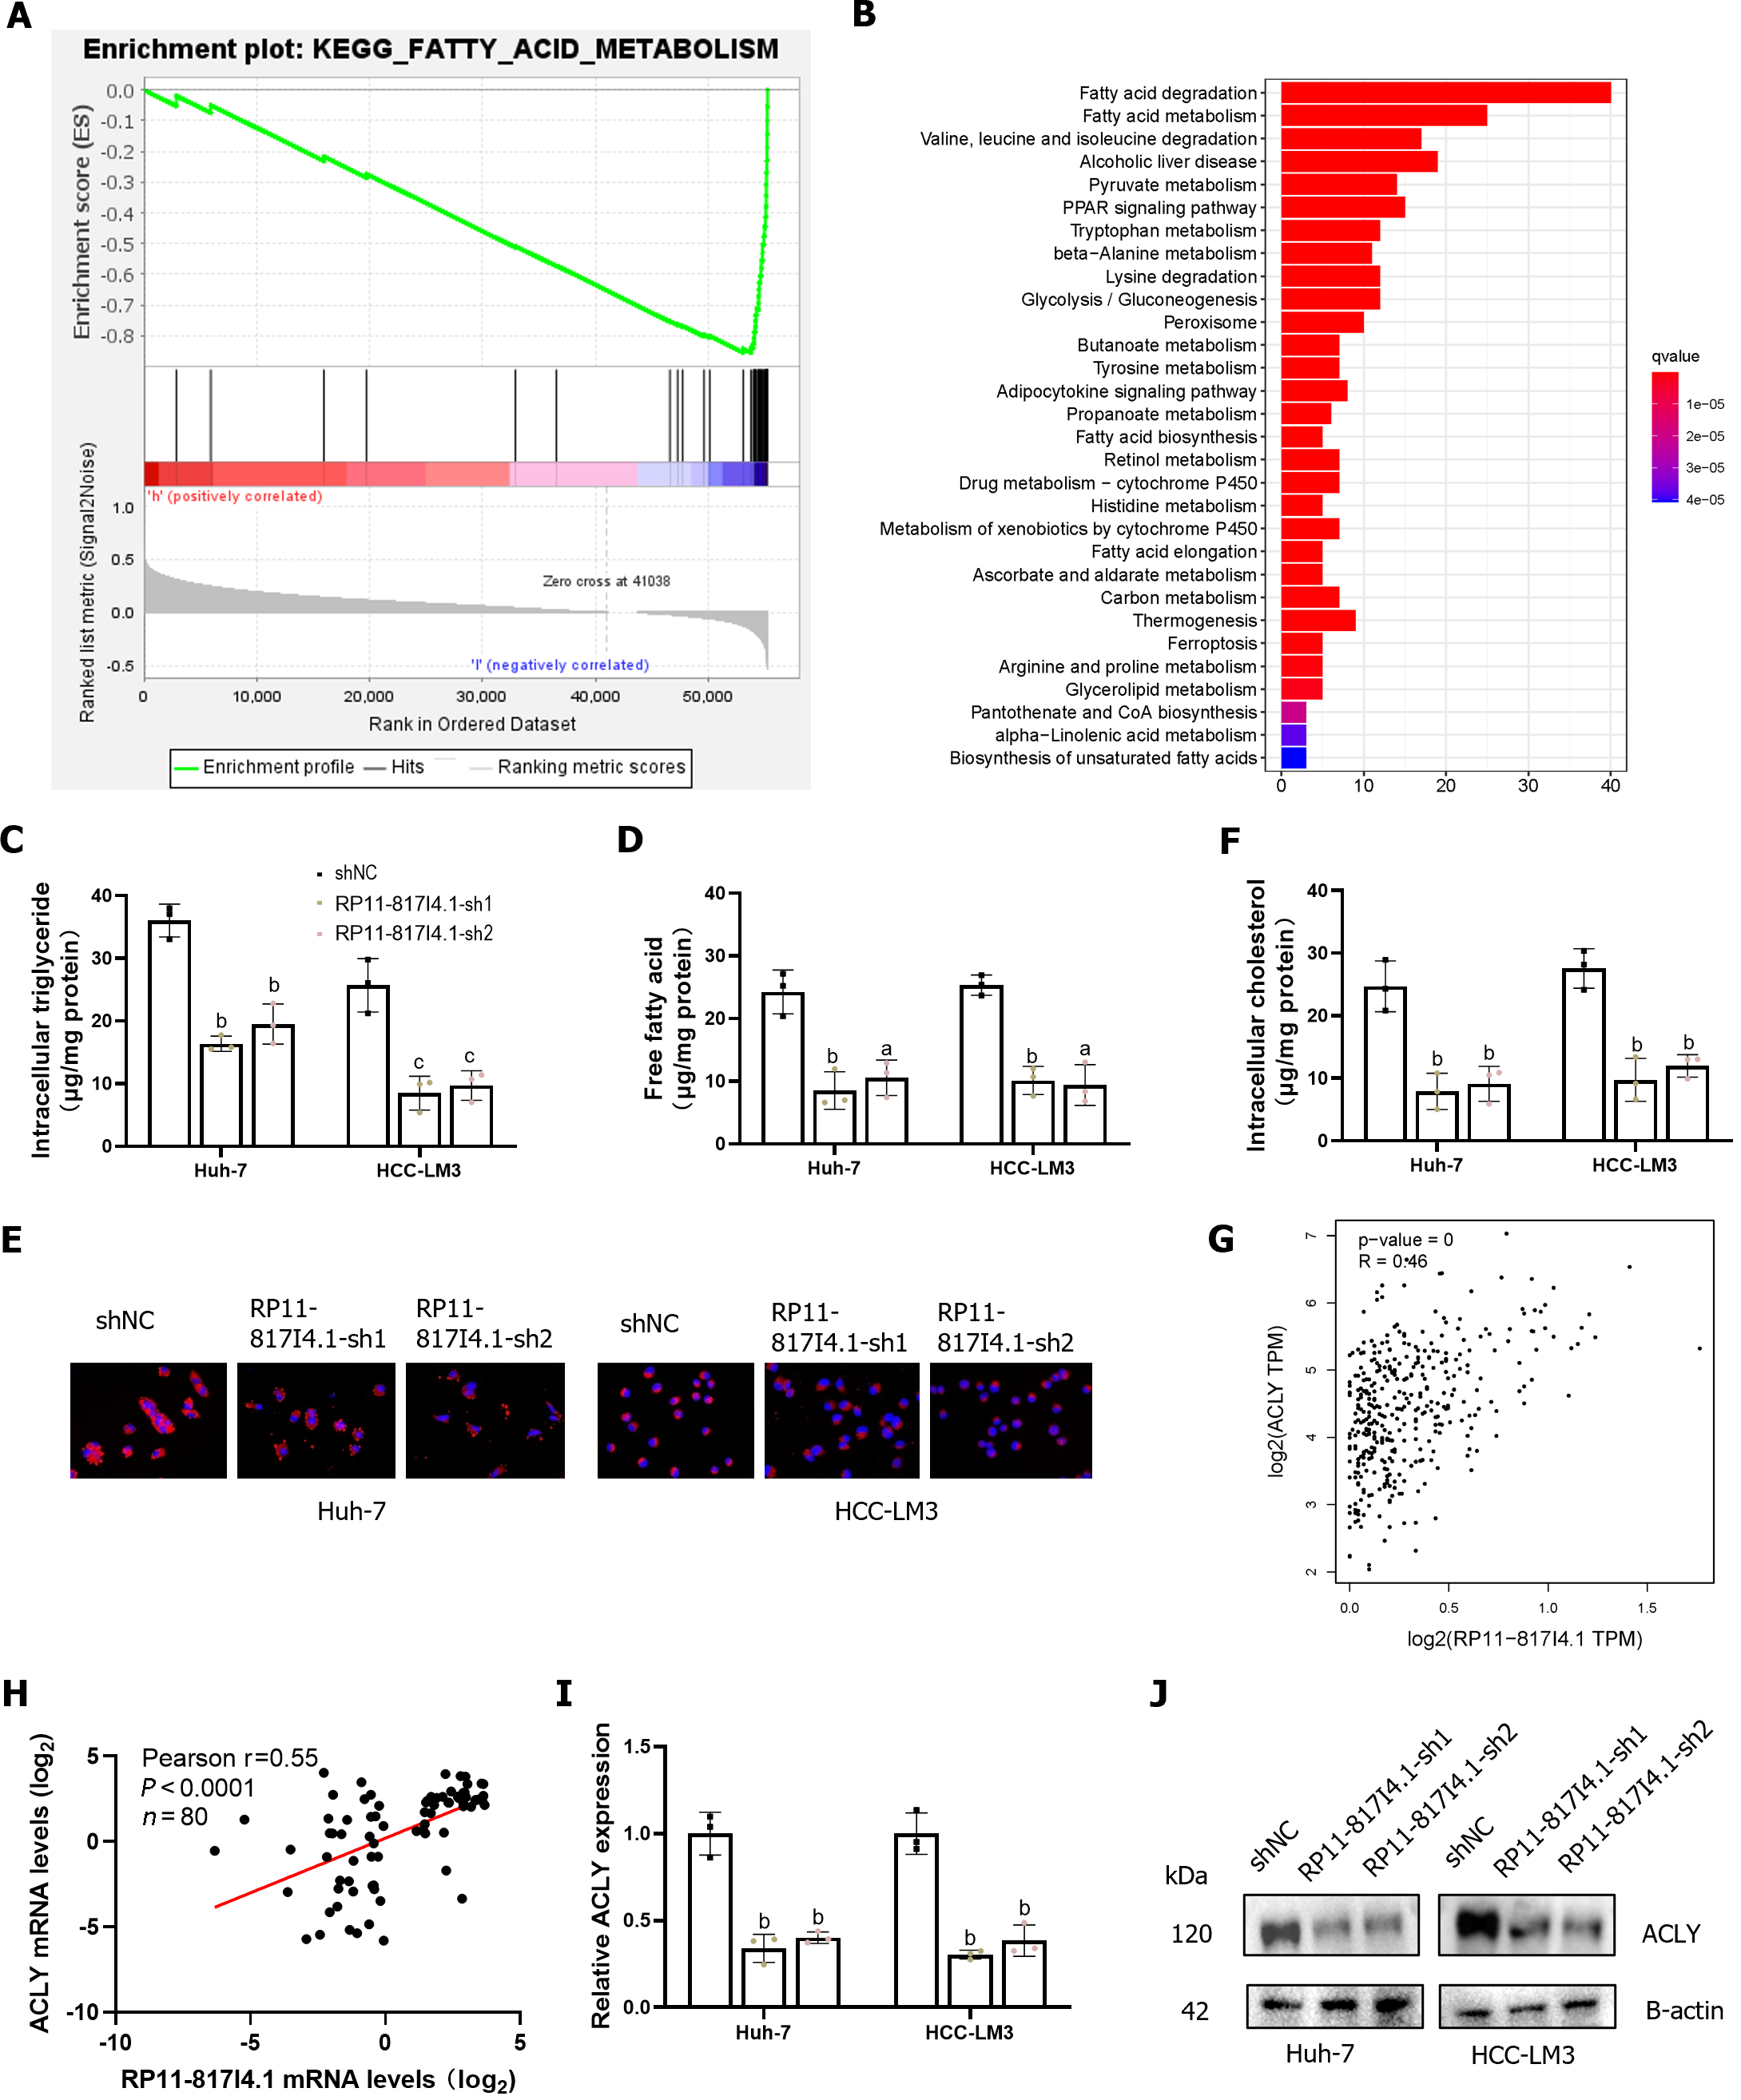
Figure 6 RP11-817I4.
1 is associated with fatty acid metabolism in hepatocellular carcinoma. A: Gene set enrichment analysis showed that the activity of the fatty acid metabolism signaling pathway was negatively correlated with the expression of RP11-817I4.1; B: Kyoto Encyclopedia of Genes and Genomes analysis of the transcriptomic analysis of hepatocellular carcinoma (HCC)-LM3 cells transfected with shNC or the RP11-817I4.1-sh1 plasmid revealed that the differentially expressed genes were enriched mainly in fatty acid degradation and fatty acid metabolism; C: Free fatty acid; D: Levels were measured in Huh7 and HCC-LM3 cells expressing shNC, RP11-817I4.1-sh1, or RP11-817I4.1-sh2; E: Cellular neutral lipids were measured in Huh7 and HCC-LM3 cells expressing shNC, RP11-817I4.1-sh1, or RP11-817I4.1-sh2 by double staining with Nile red and DAPI. Magnification, 320 ×; F: Cellular cholesterol levels were measured in Huh7 and HCC-LM3 cells expressing shNC, RP11-817I4.1-sh1, or RP11-817I4.1-sh2; G: Correlation analysis between RP11-817I4.1 and ATP citrate lyase (ACLY) in the The Cancer Genome Atla database; H: Correlation analysis between RP11-817I4.1 and ACLY at the Second Affiliated Hospital of Kunming Medical University; I: Changes in ACLY mRNA levels after RP11-817I4.1 knockdown; J: Changes in the ACLY protein level after RP11-817I4.1 knockdown. The data are presented as the mean ± SD and are representative of three independent experiments. aP < 0.05, bP < 0.01, cP < 0.001. ACLY: ATP citrate lyase; TPM: Transcripts Per Kilobase of exon model per Million mapped reads.
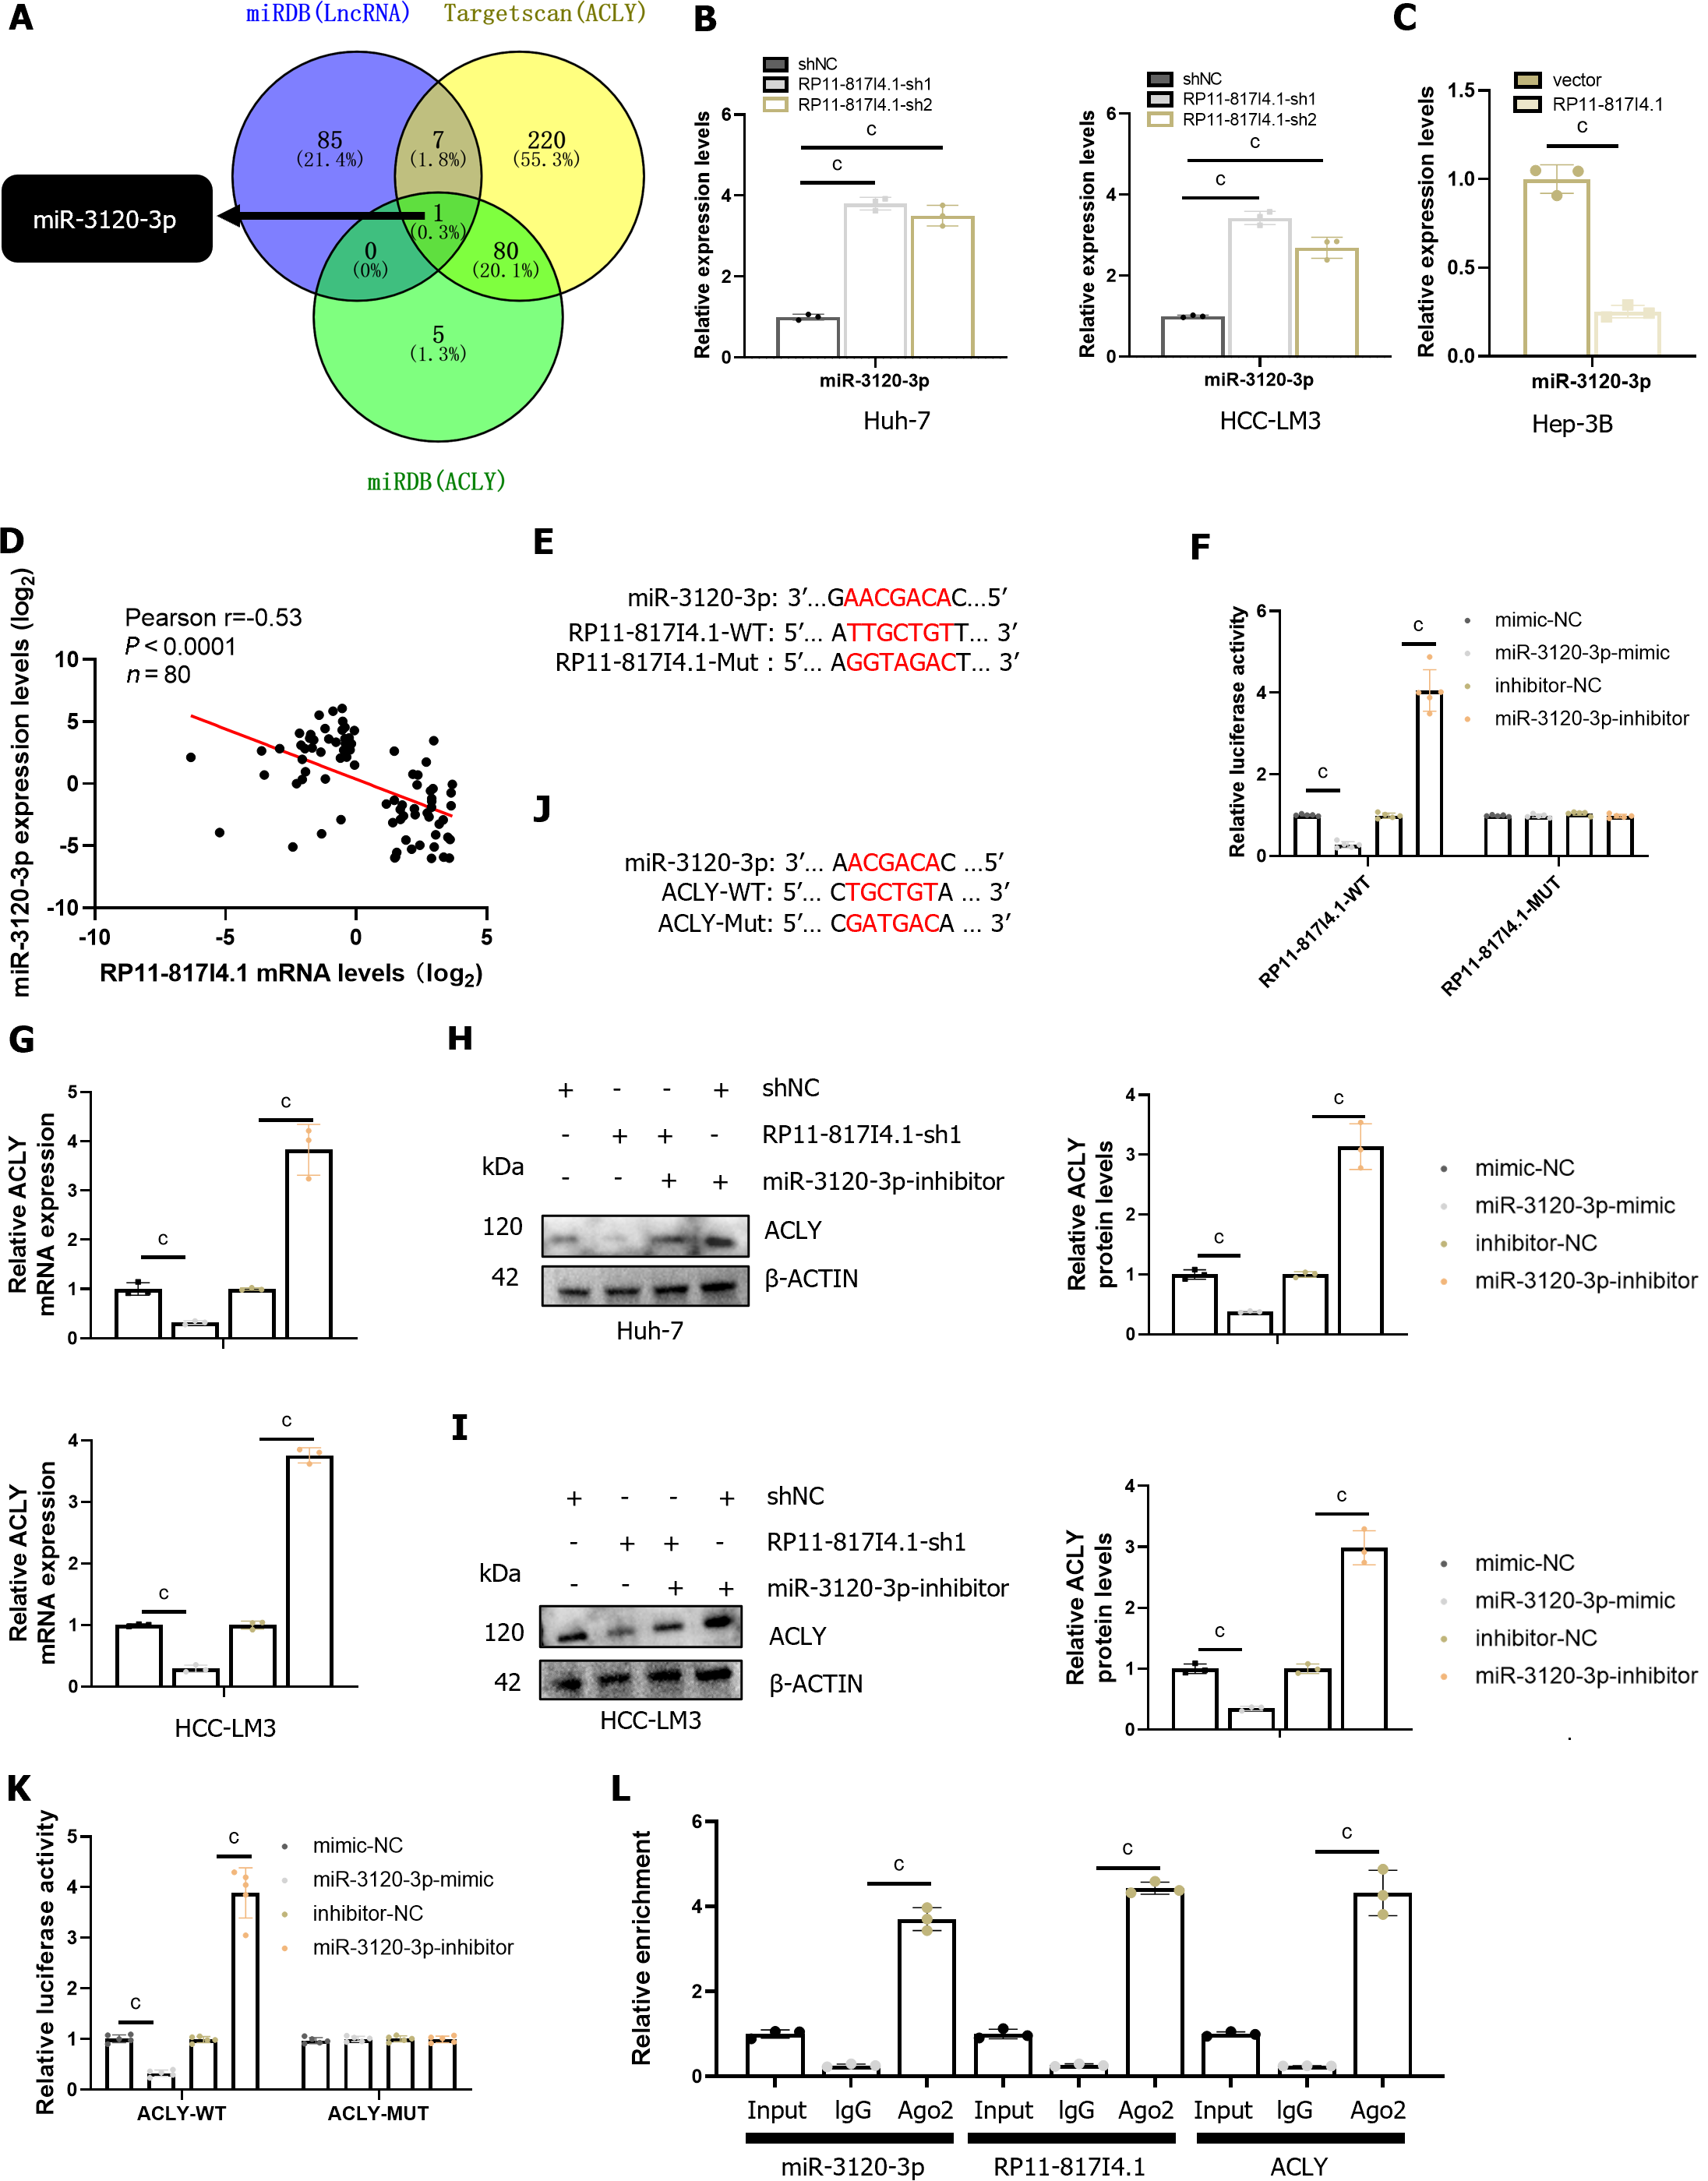
Figure 7 RP11-817I4.
1 promotes ATP citrate lyase expression by sponging miR-3120-3p. A: MiRNA analysis based on the miRDB and TargetScan databases; B: Changes in the expression of miR-3120-3p after knockdown of RP11-817I4.1; C: Changes in the expression of miR-3120-3p after the overexpression of RP11-817I4.1; D: Correlation analysis between RP11-817I4.1 and ATP citrate lyase (ACLY) at the Second Affiliated Hospital of Kunming Medical University; E: Design of the luciferase reporter gene plasmid for the binding site of RP11-817I4.1 and miR-3120-3p; F: Luciferase reporter gene experiment using the plasmid designed in E; G: The impact of miR-3120-3p expression intervention on ACLY mRNA levels; H and I: The impact of miR-3120-3p silencing on ACLY protein levels; J: Design of the luciferase reporter gene plasmid for the binding site of ACLY and miR-3120-3p; K: Luciferase reporter gene experiment using the plasmid designed in J; L: Immunoprecipitation of RP11-817I4.1, miR-3120-3p, and ACLY mRNA using an AGO-2 antibody. The data are presented as the mean ± SD and are representative of three independent experiments. aP < 0.05, bP < 0.01, cP < 0.001. WT: Wild-type; MUT: Mutant; ACLY: ATP citrate lyase.
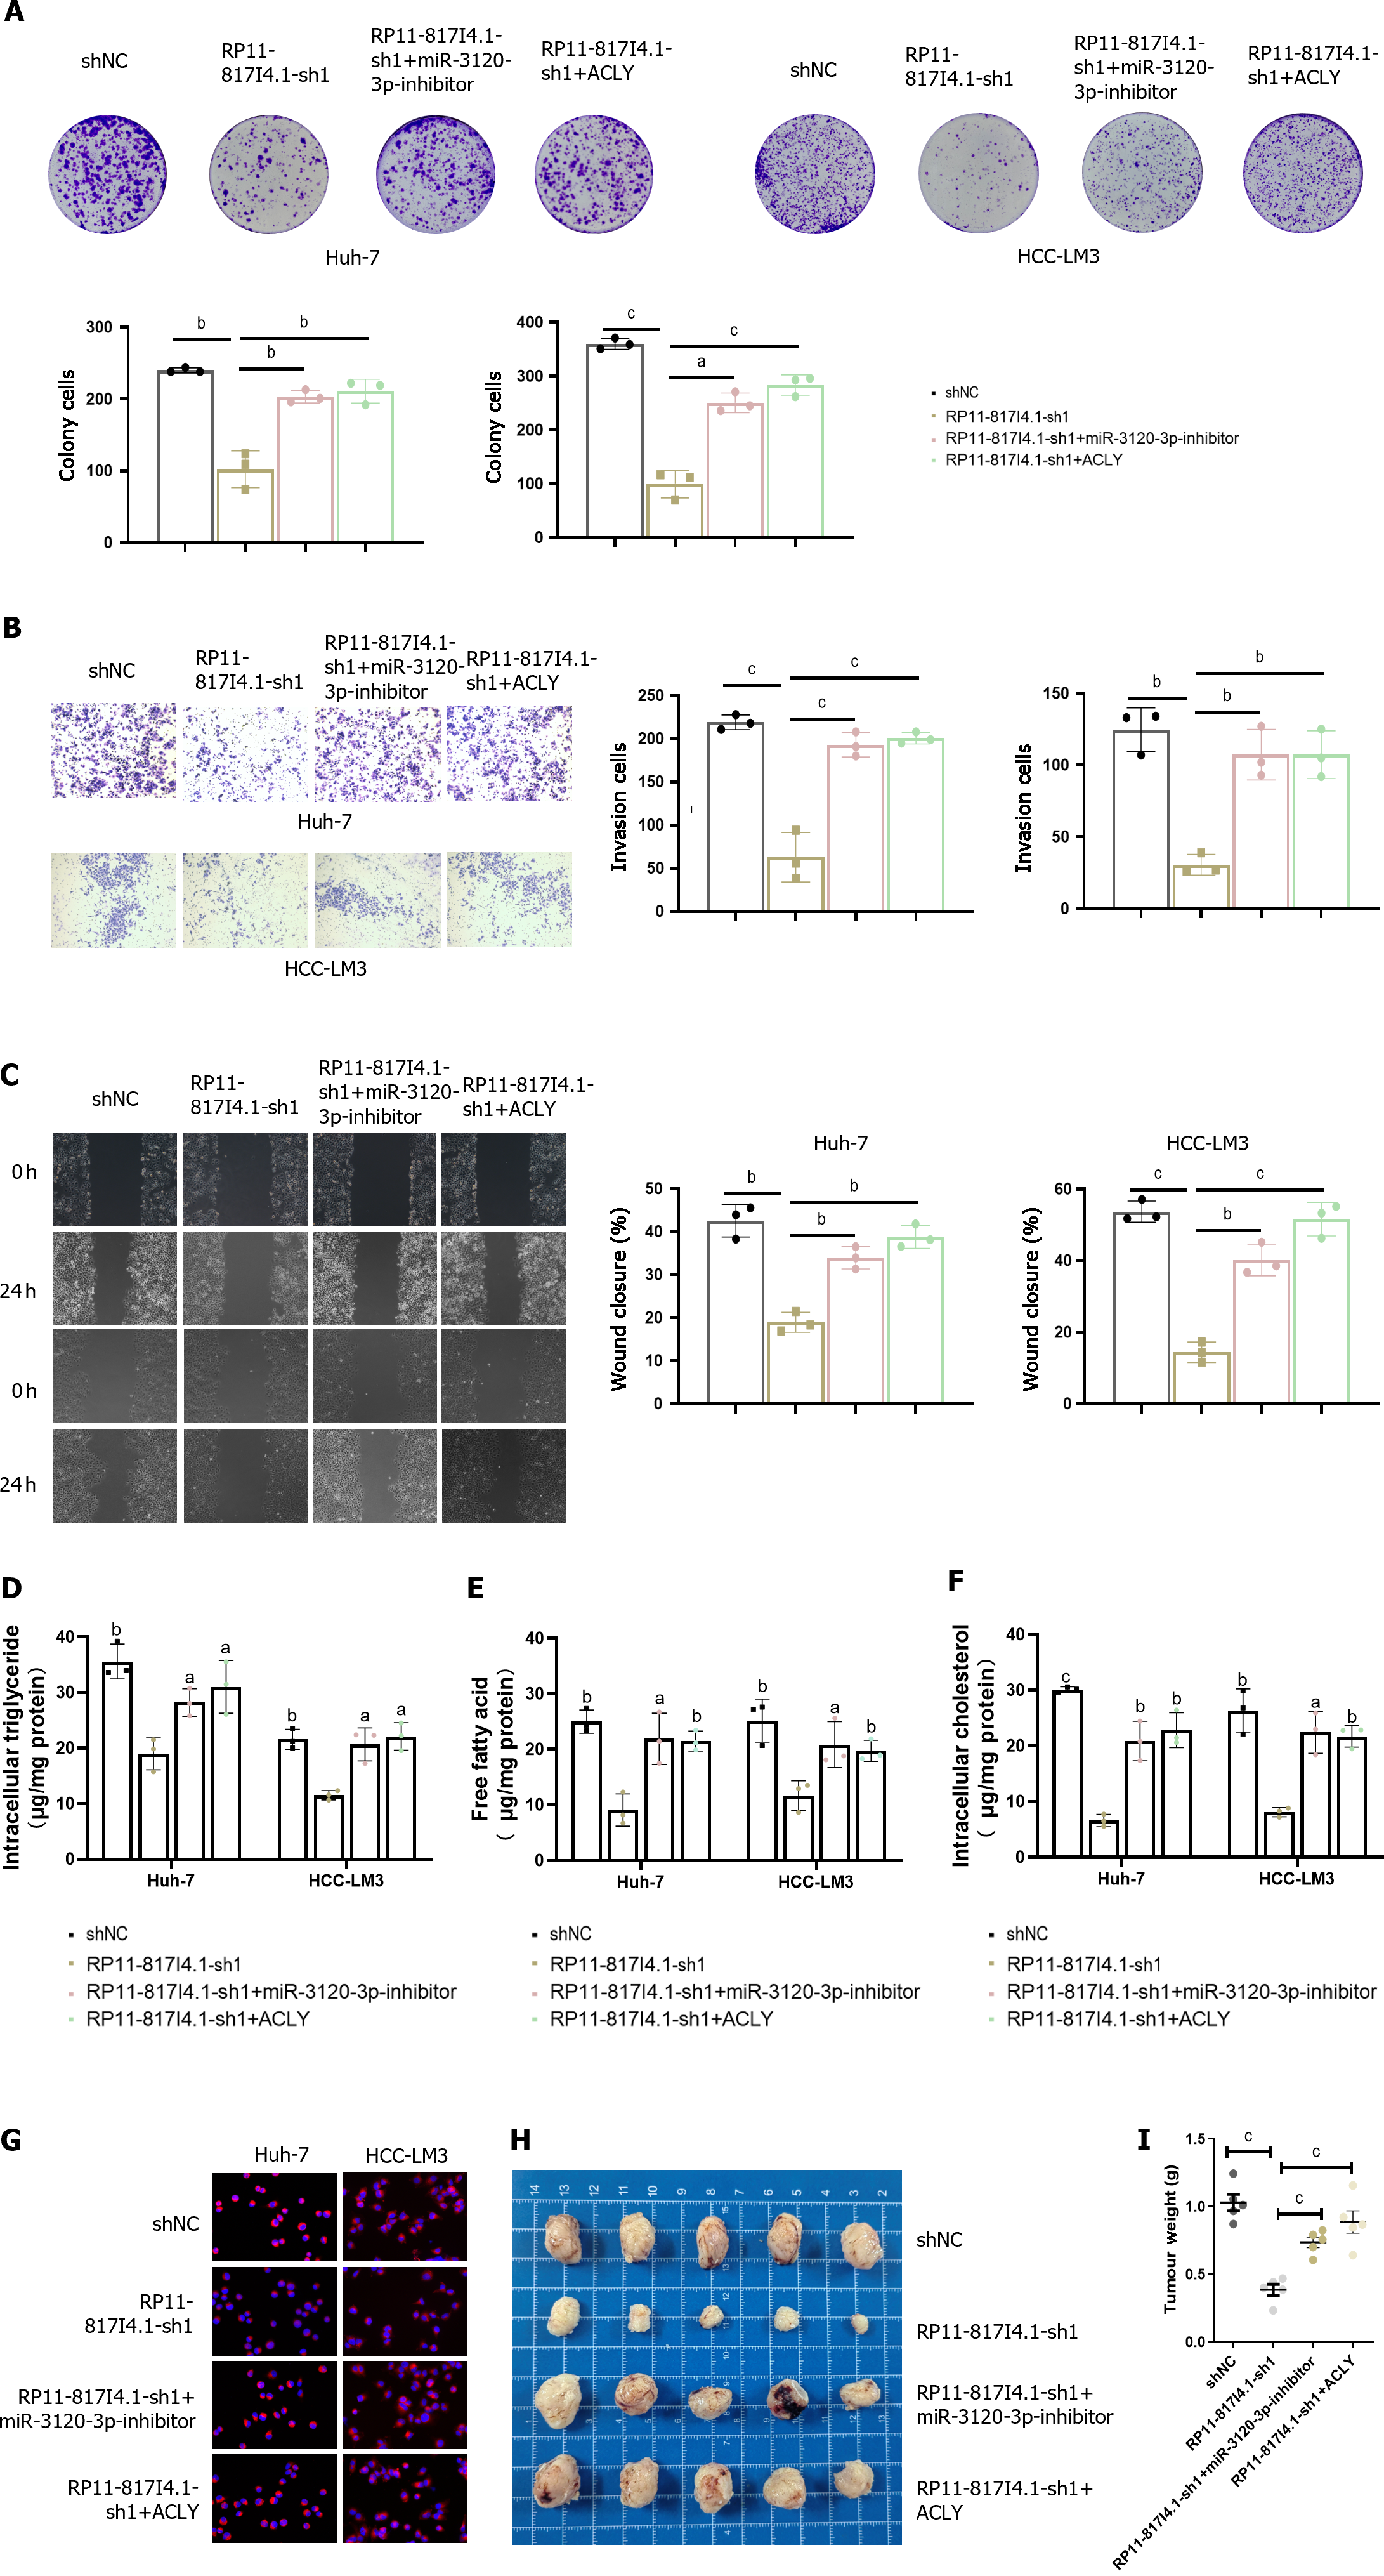
Figure 8 The RP11-817I4.
1/miR-3120-3p/ATP citrate lyase axis promotes lipid synthesis and tumor progression in HCC. A: Colony formation experiment showing the effect of miR-3120-3p and ATP citrate lyase (ACLY) on the change in hepatocellular carcinoma (HCC) proliferation caused by RP11-817I4.1; B: Transwell experiment showing the effect of miR-3120-3p and ACLY on HCC invasion caused by changes in RP11-817I4.1 cell ability; C: Scratch experiments showing the effect of miR-3120-3p and ACLY on the change in HCC cell migration caused by RP11-817I4.1; D-F: The effects of miR-3120-3p and ACLY on the changes in triglyceride; free fatty acid and cholesterol; levels in HCC cells caused by RP11-817I4.1; G: Nile red staining showing the effects of miR-3120-3p and ACLY on the changes in neutral lipid levels in HCC caused by RP11-817I4.1; H: The subcutaneous tumor model shows the effects of miR-3120-3p and ACLY on the changes in HCC growth caused by RP11-817I4.1 in vivo; I: Weight detection of HCC cells in the subcutaneous tumorigenesis model. The data are presented as the mean ± SD and are representative of three independent experiments. aP < 0.05, bP < 0.01, cP < 0.001. ACLY: ATP citrate lyase; HCC: Hepatocellular carcinoma.
- Citation: Wang RY, Yang JL, Xu N, Xu J, Yang SH, Liang DM, Li JZ, Zhu H. Lipid metabolism-related long noncoding RNA RP11-817I4.1 promotes fatty acid synthesis and tumor progression in hepatocellular carcinoma. World J Gastroenterol 2024; 30(8): 919-942
- URL: https://www.wjgnet.com/1007-9327/full/v30/i8/919.htm
- DOI: https://dx.doi.org/10.3748/wjg.v30.i8.919


