Copyright
©The Author(s) 2024.
World J Gastroenterol. Feb 28, 2024; 30(8): 901-918
Published online Feb 28, 2024. doi: 10.3748/wjg.v30.i8.901
Published online Feb 28, 2024. doi: 10.3748/wjg.v30.i8.901
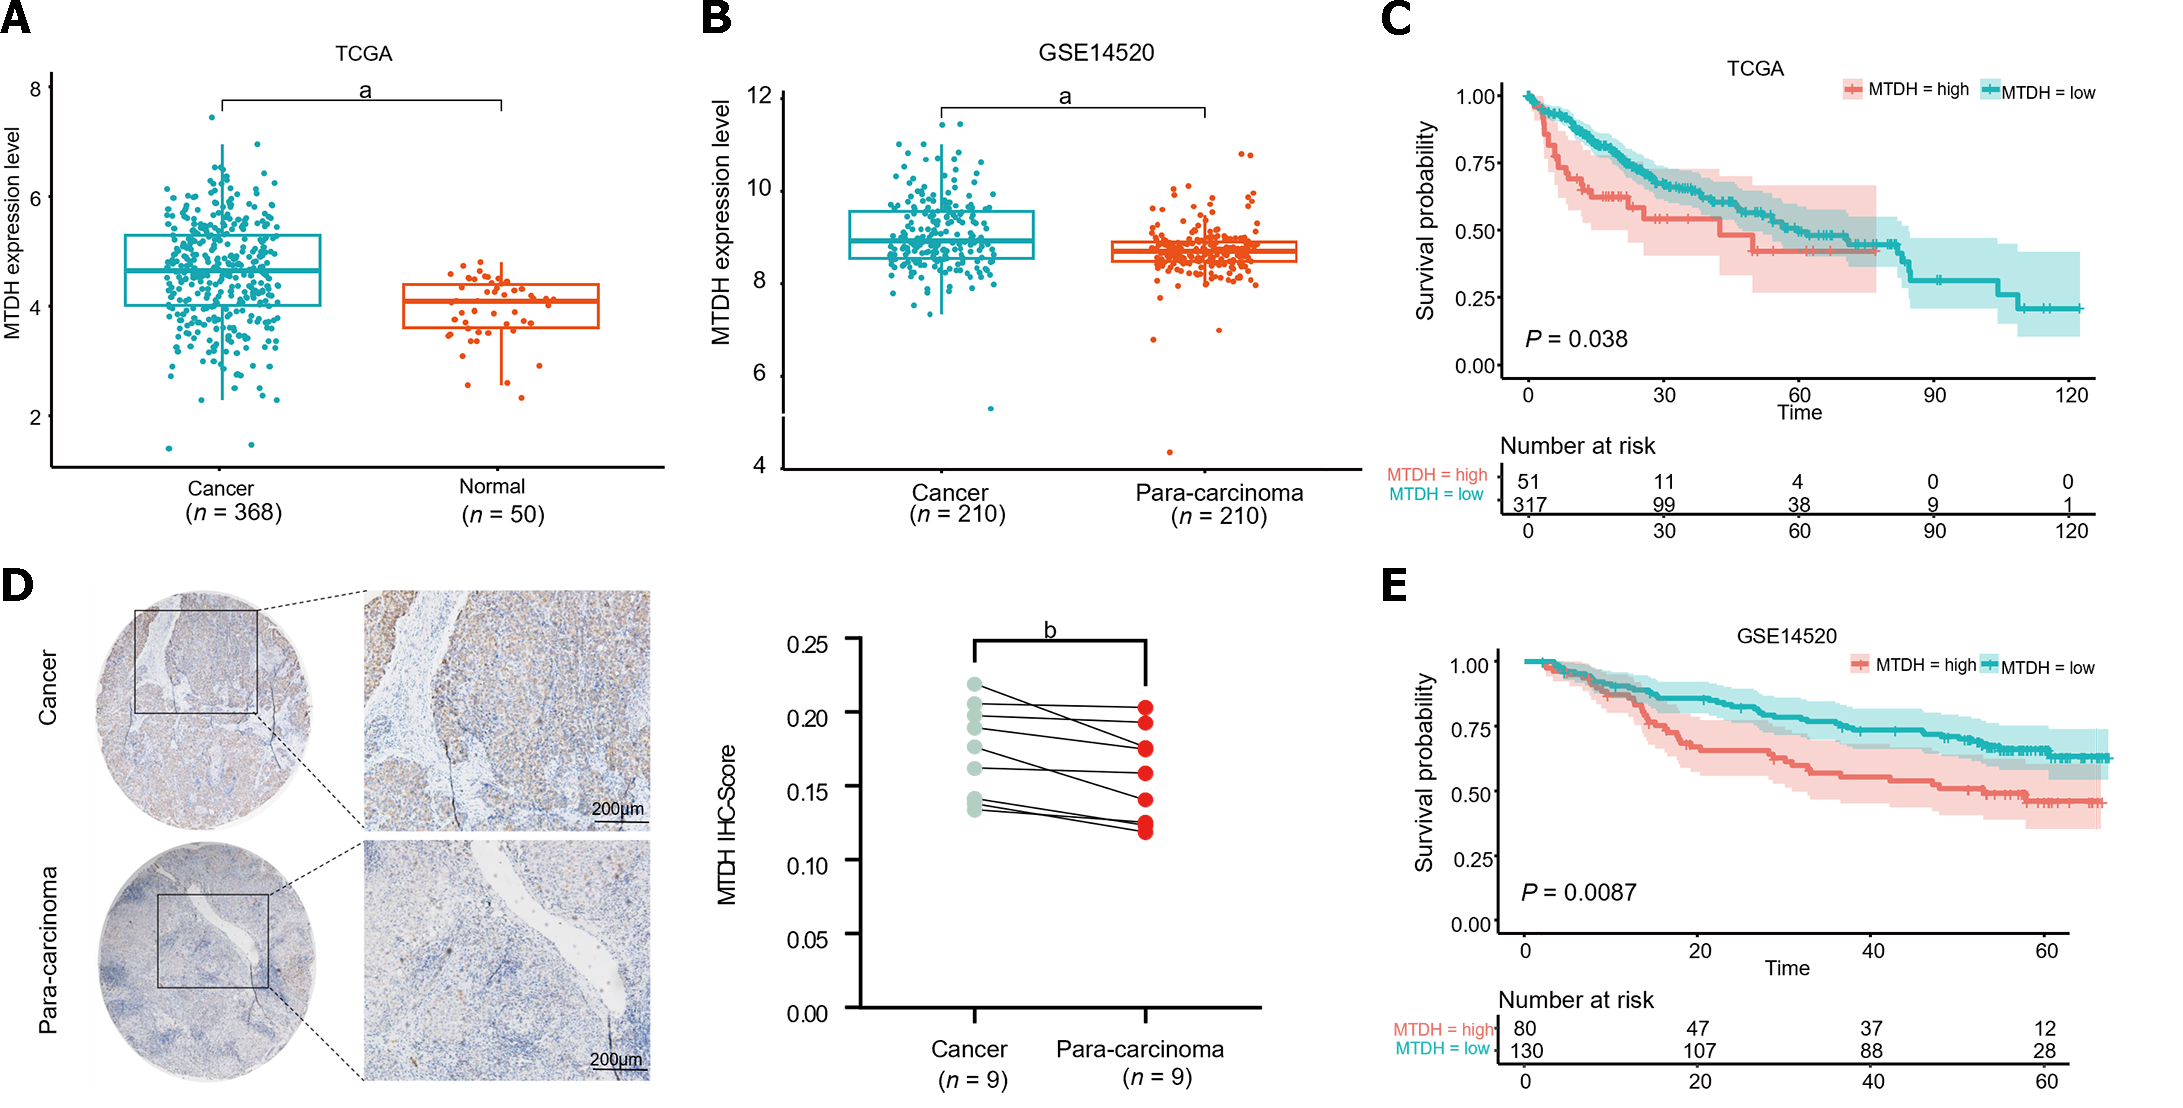
Figure 1 Metadherin overexpression has been linked to a worse prognosis in hepatocellular carcinoma.
A and B: Metadherin (MTDH) mRNA expression in normal liver tissues compared with liver cancer tissues; C: Images of para-carcinoma (n = 9) and cancer tissues (n = 9) stained with MTDH by Immunohistochemical staining (scale bar = 200 μm); D and E: Patient's overall survival curves according to MTDH expression. aP < 0.0001, bP < 0.01. Normal: Normal liver tissues; Cancer: Liver cancer tissues; Para-carcinoma: Para-cancerous tissue; MTDH: Metadherin; IHC: Immunohistochemical staining.
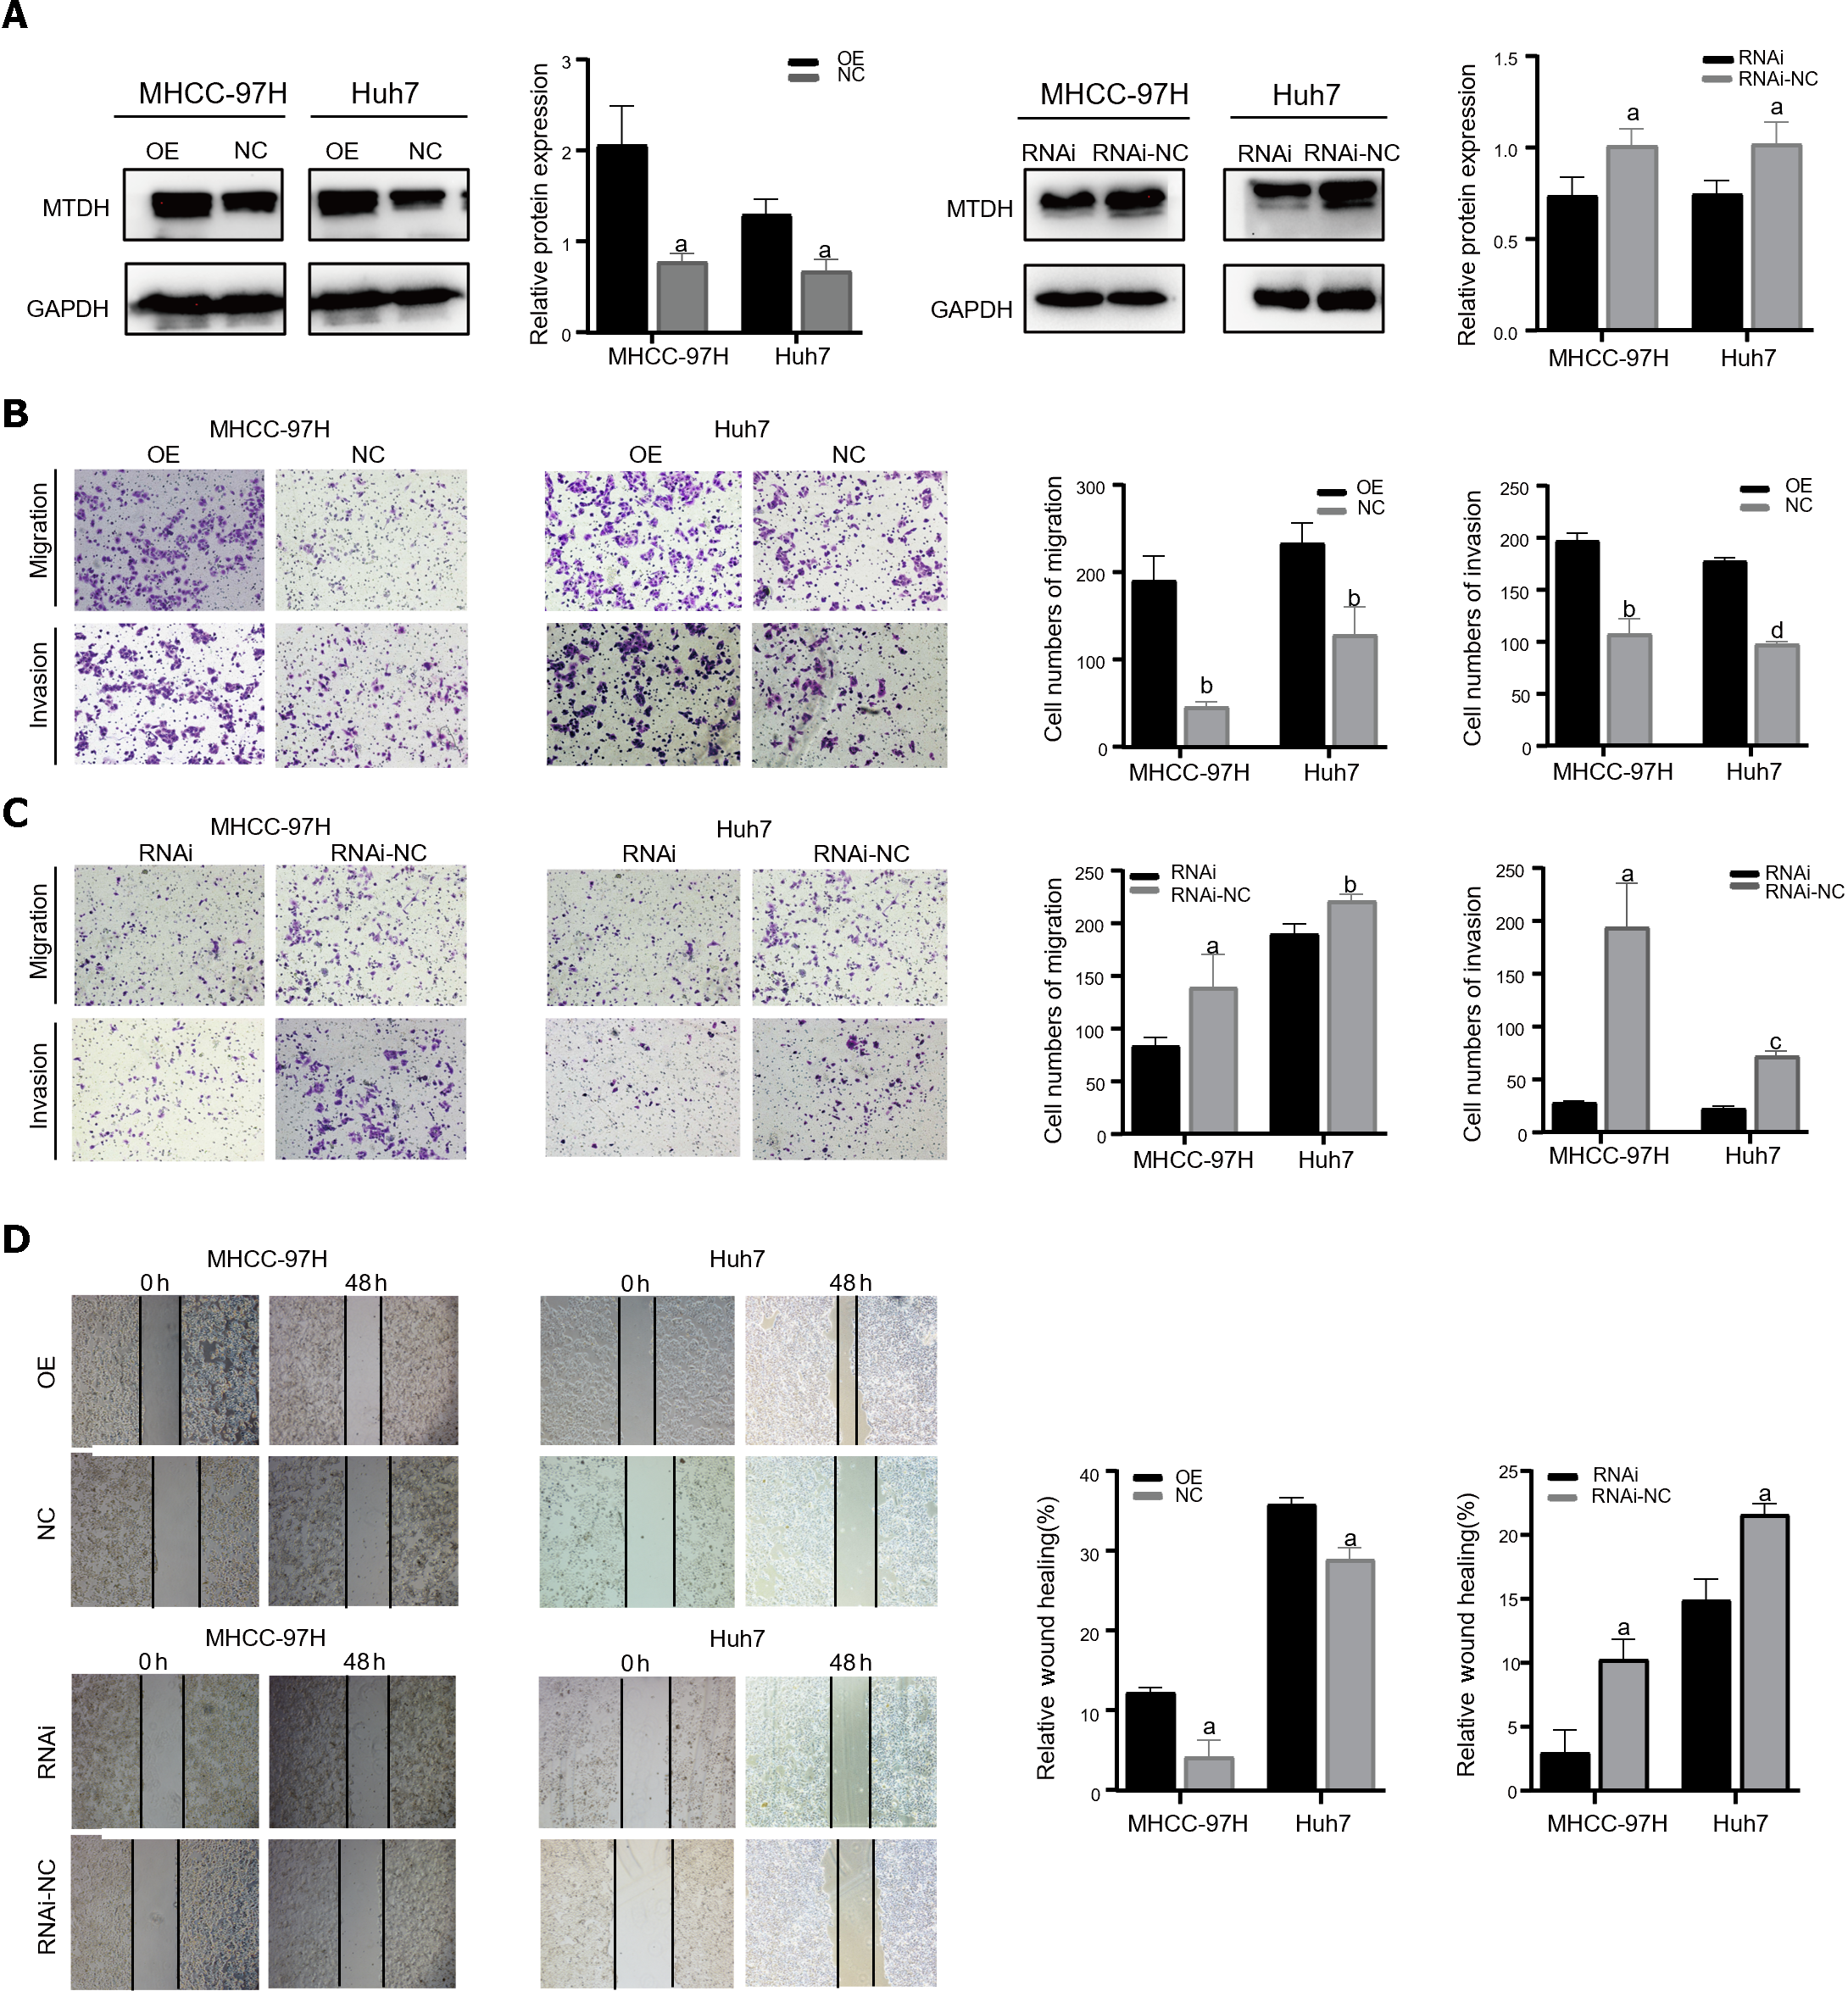
Figure 2 Metadherin promotes proliferation, migration, and invasion of hepatocellular carcinoma cells.
A: In Huh7 and MHCC-97H cells, Western blotting revealed the efficacy of Metadherin overexpression and knockdown; B and C: Characteristic images of trans-well invasion assays 24 h after culture; D: Images depicting scratch width at 0 h and 48 h post-scratch in cells captured using inverted microscopy. aP < 0.05, bP < 0.01, cP < 0.001, dP < 0.0001. OE: Metadherin overexpression group; NC: Overexpression control group; RNAi: Metadherin knockdown group; RNAi-NC: MTDH knockdown control group.
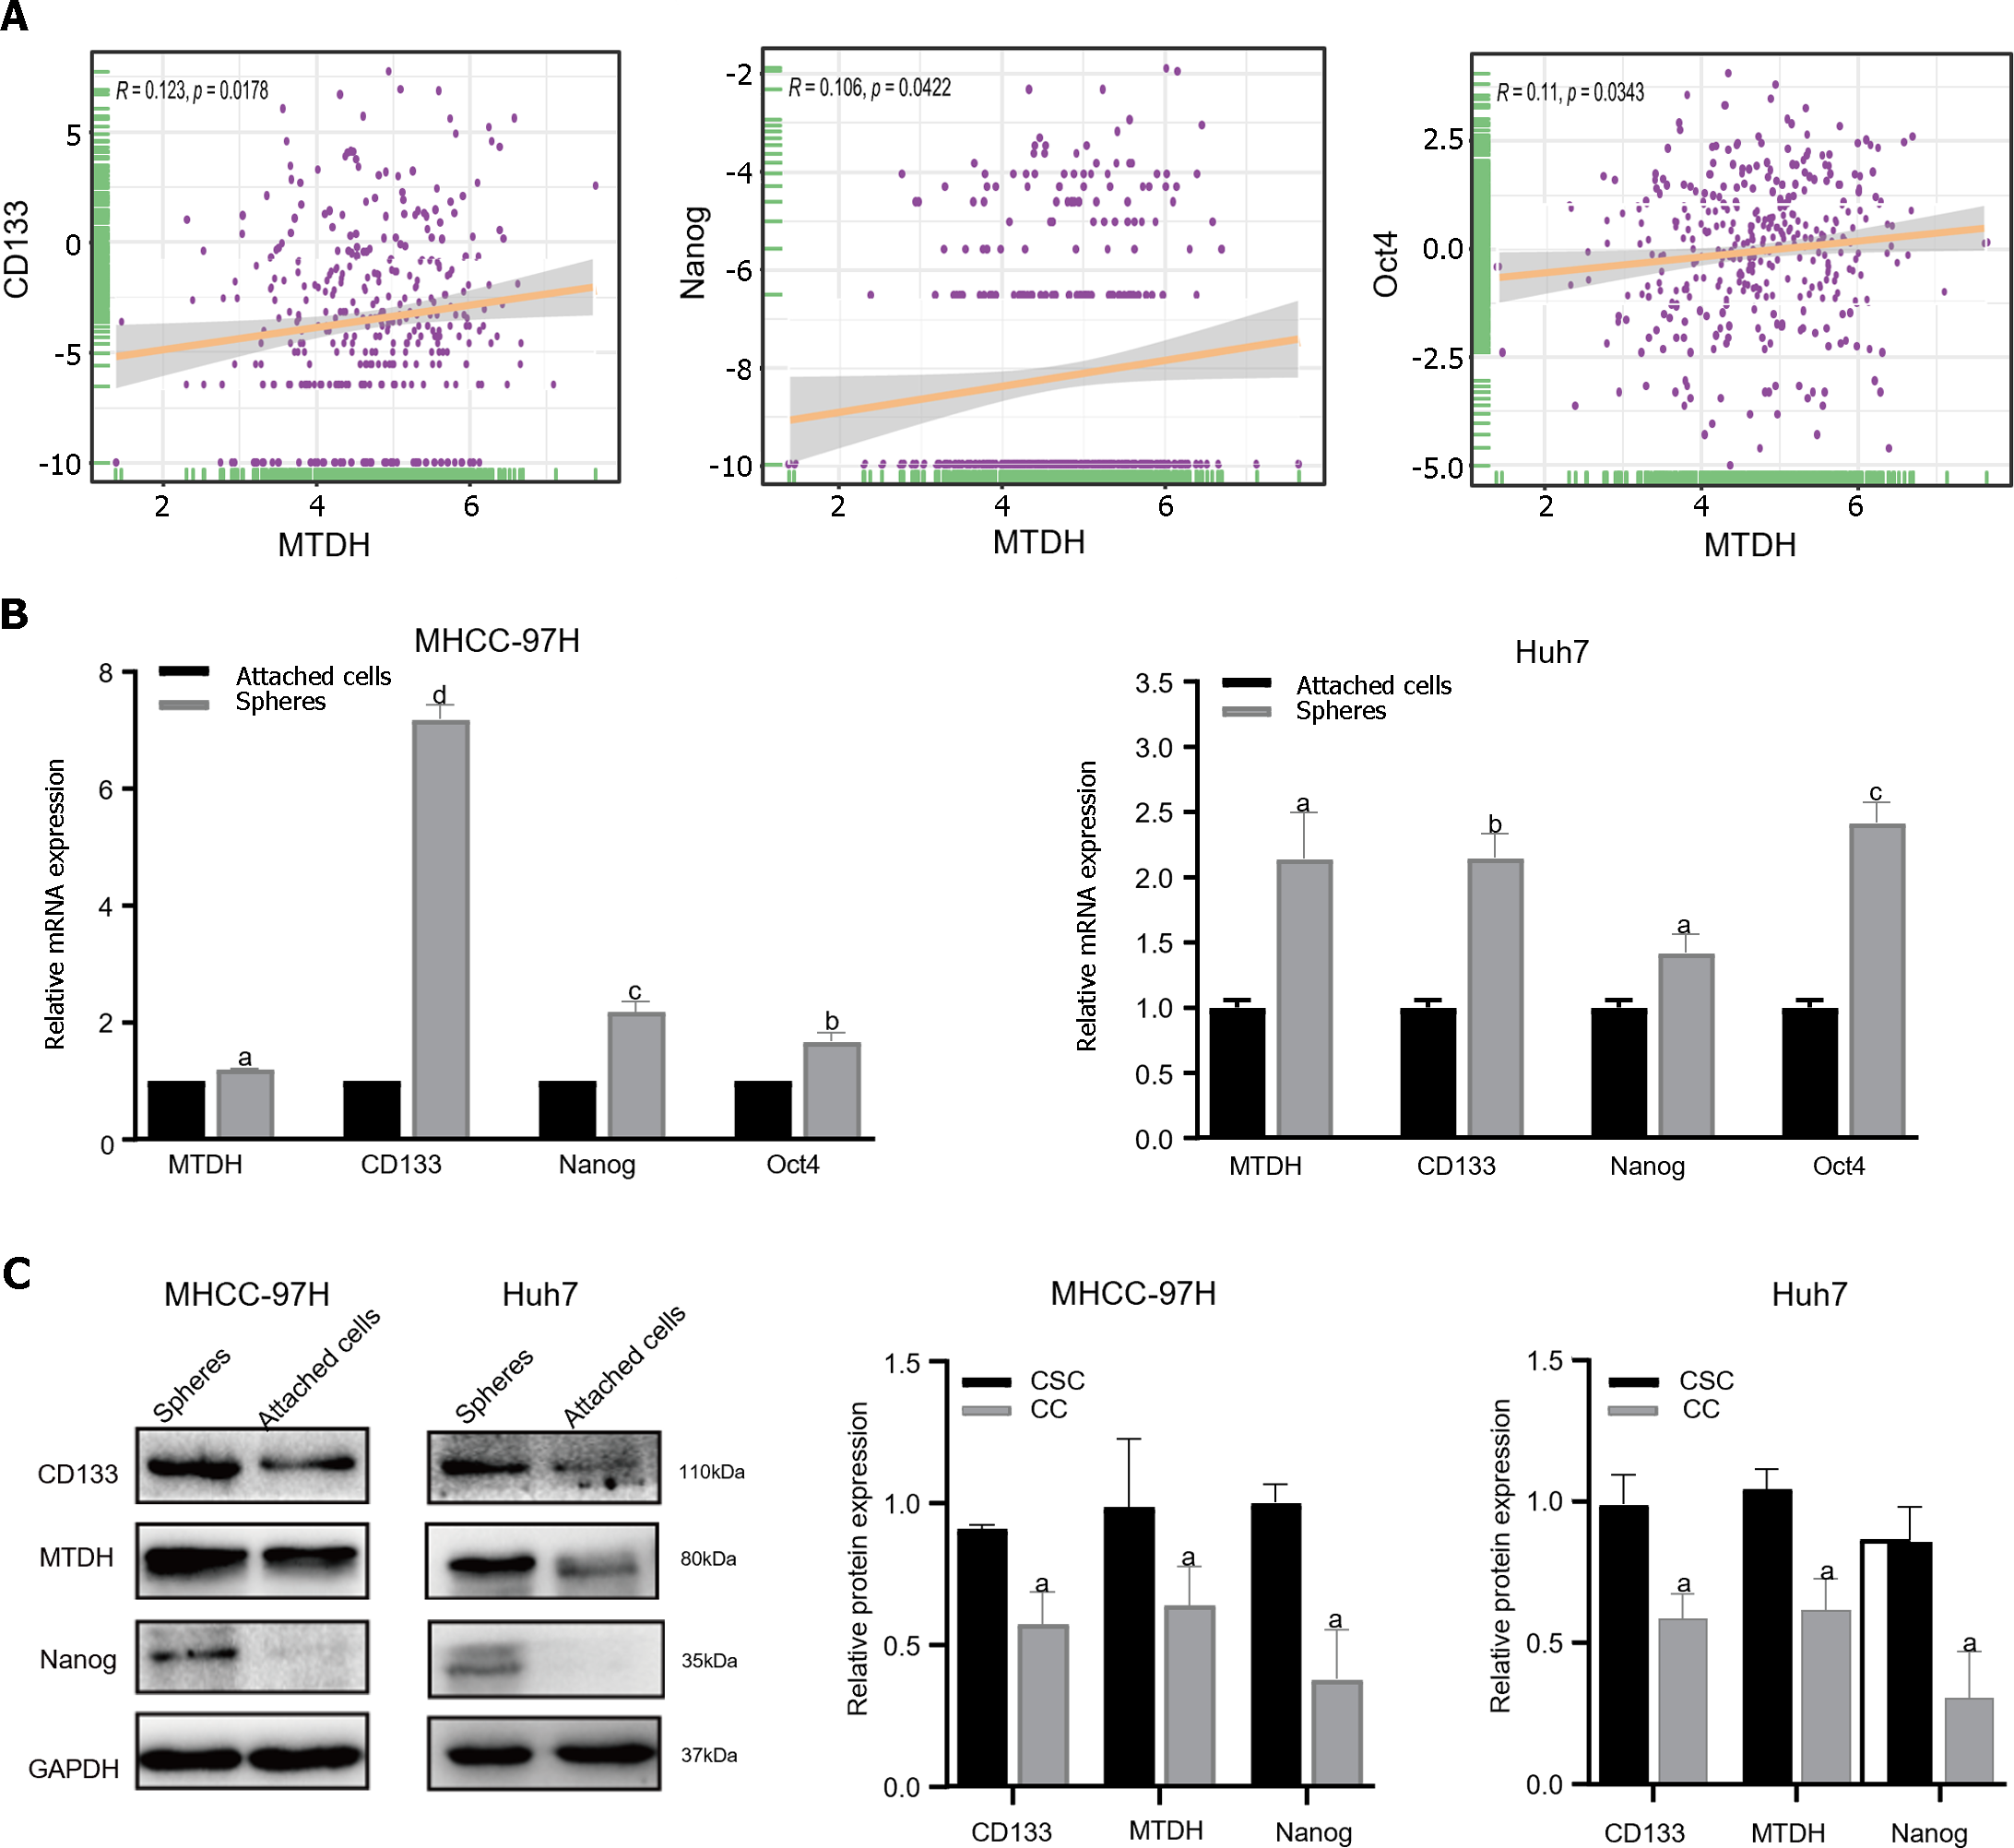
Figure 3 Metadherin correlates with the stemness properties in hepatocellular carcinoma.
A: Correlation between Metadherin (MTDH) and CD133, Nanog, Oct4 in TCGA; B: Through quantitative reverse transcription PCR, the expression levels of MTDH, CD133, Nanog, Oct4 were measured in attached cells and tumor spheres in 97H and Huh7 cell lines. In tumor spheres, all the four genes were expressed at increased levels; C: MTDH, CD133, and Nanog were higher in attached cells than in tumor spheres. Gene GAPDH served as the internal reference. aP < 0.05, bP < 0.01, cP < 0.001, dP < 0.0001.CSC: Cancer stem cells; CC: Cancer cells.
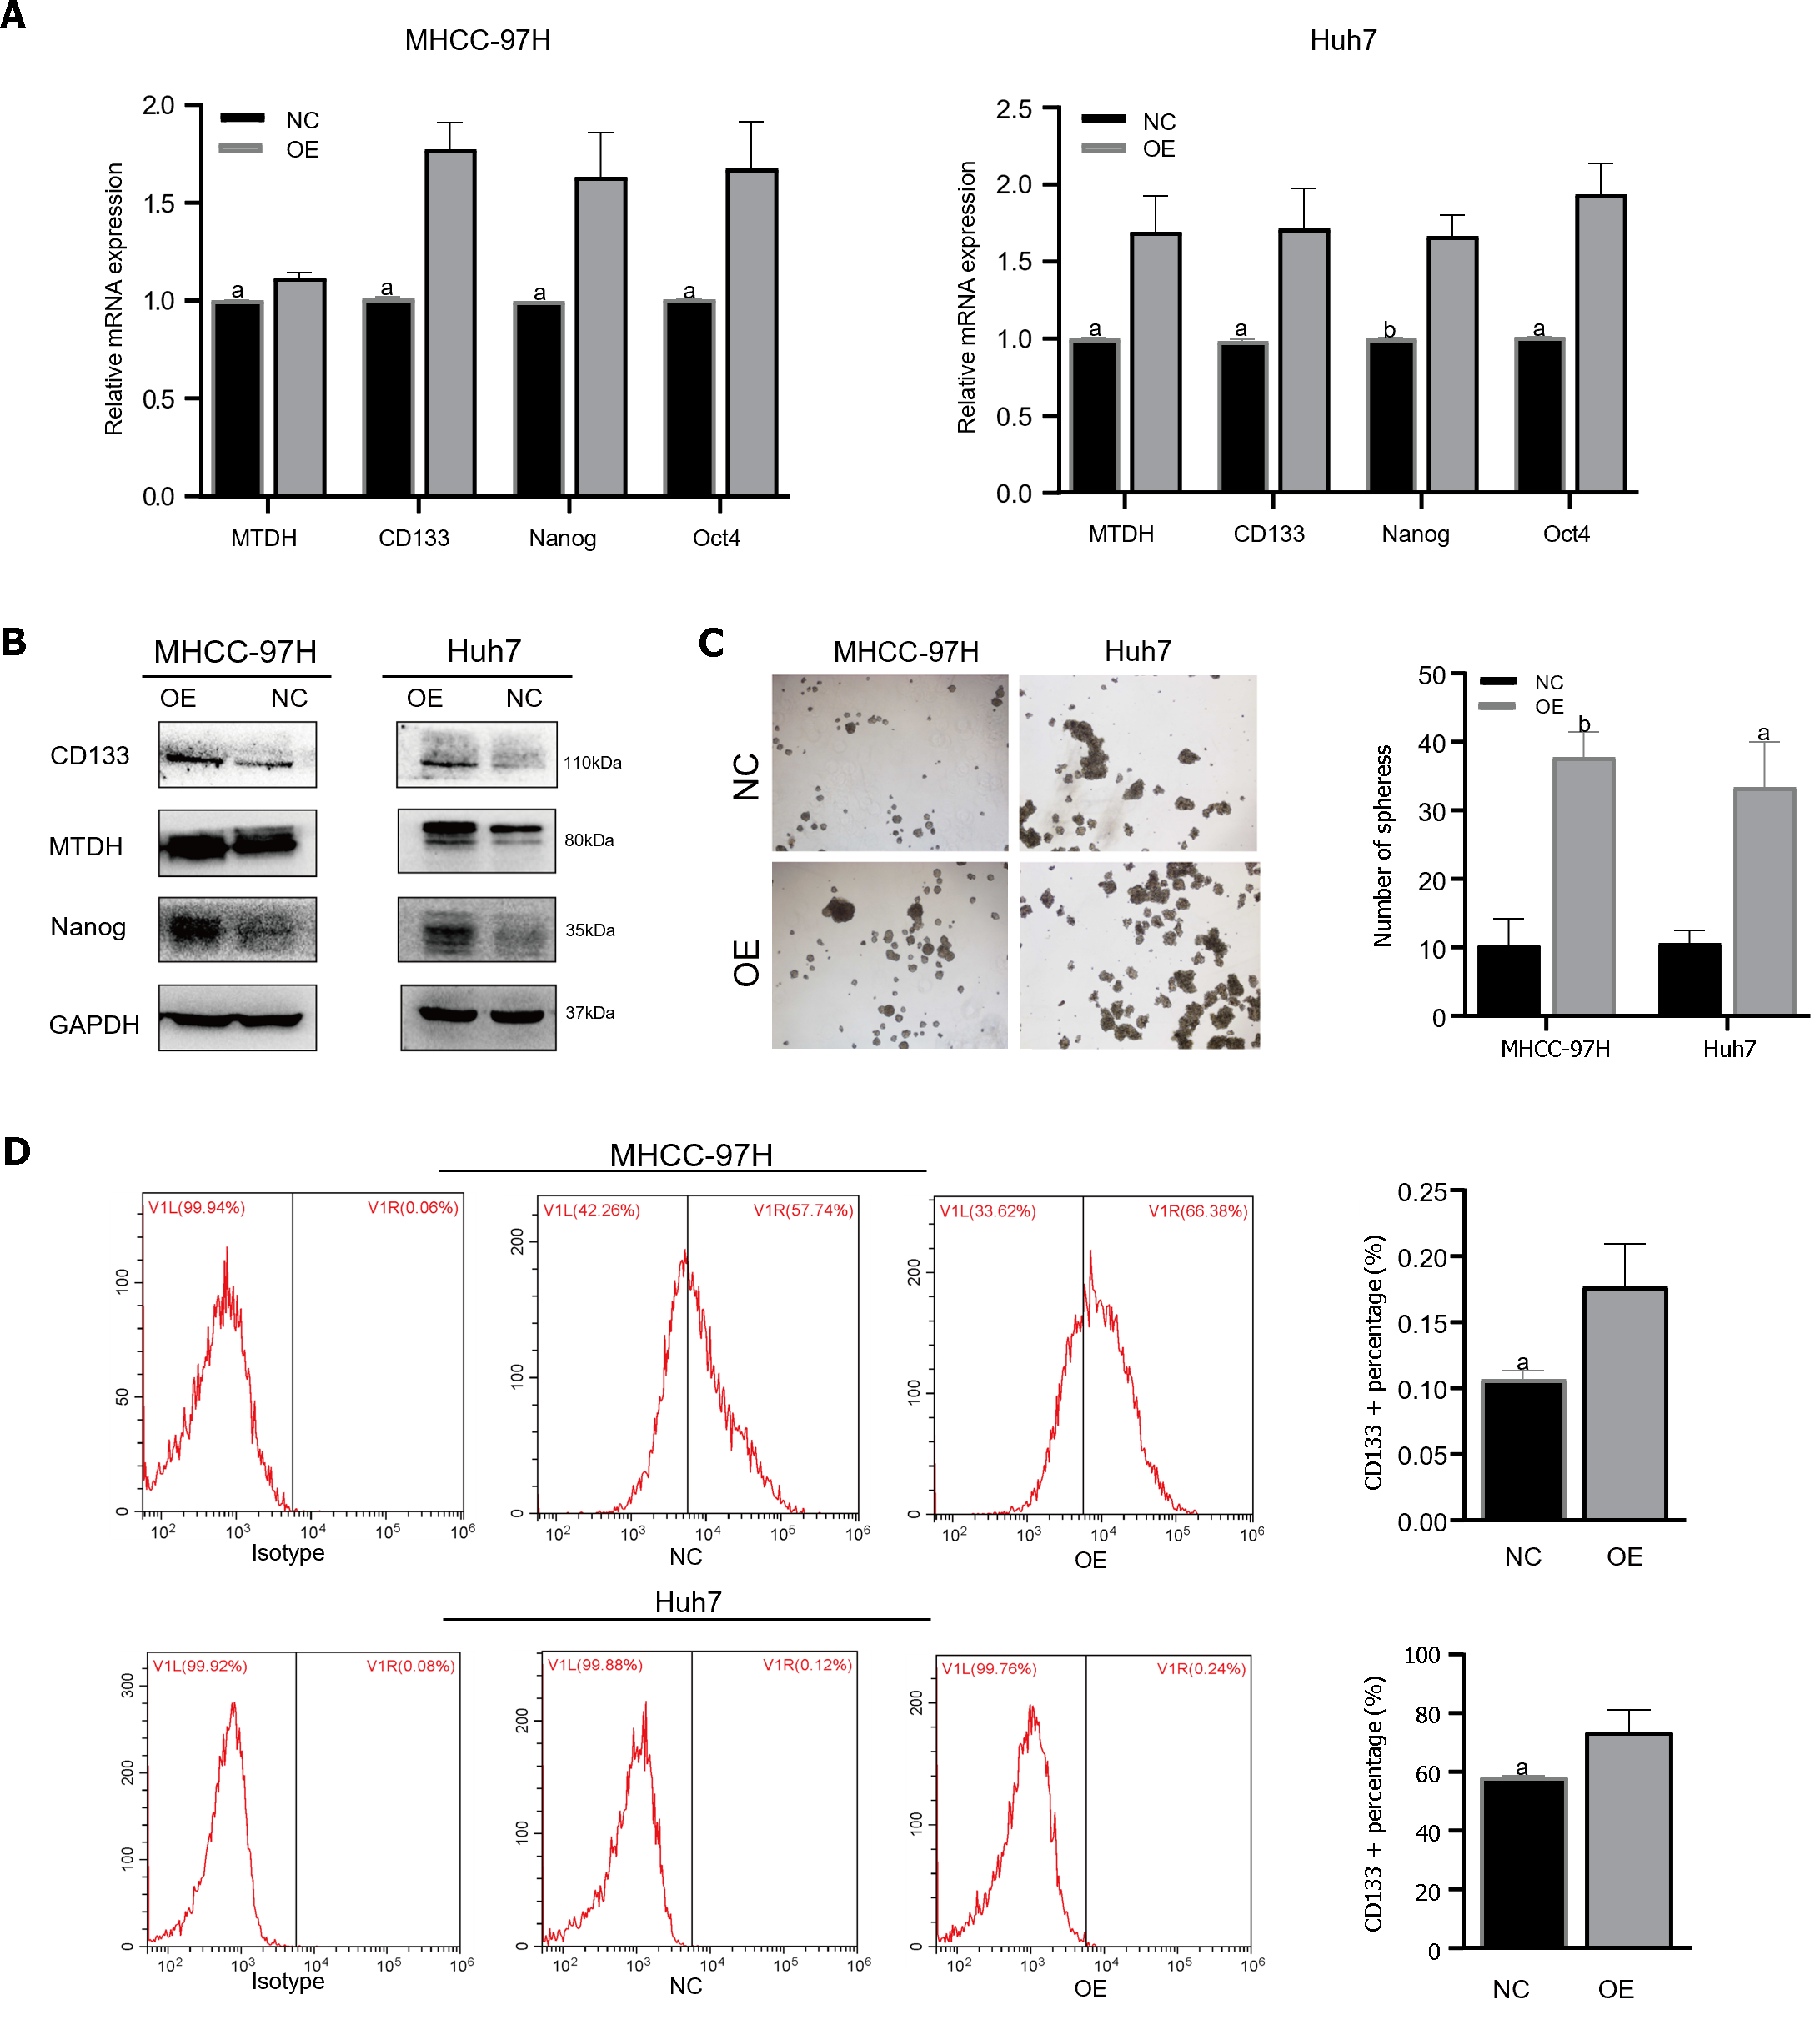
Figure 4 Metadherin overexpression promotes stem cell phenotypes and self- renewal in hepatocellular carcinoma cell lines.
A and B: Through quantitative reverse transcription PCR polymerase chain reaction and Western blot, we determined Metadherin expression and stemness markers; C: The typical pictures of sphere formation assays from 97H-overexpression and Huh7-overexpression cells; D: Flow cytometric analysis of CD133+ cells in 97H-overexpressing and Huh7-overexpressing cells. aP < 0.05, bP < 0.01. OE: Metadherin overexpression group; NC: Overexpression control group; MTDH: Metadherin.
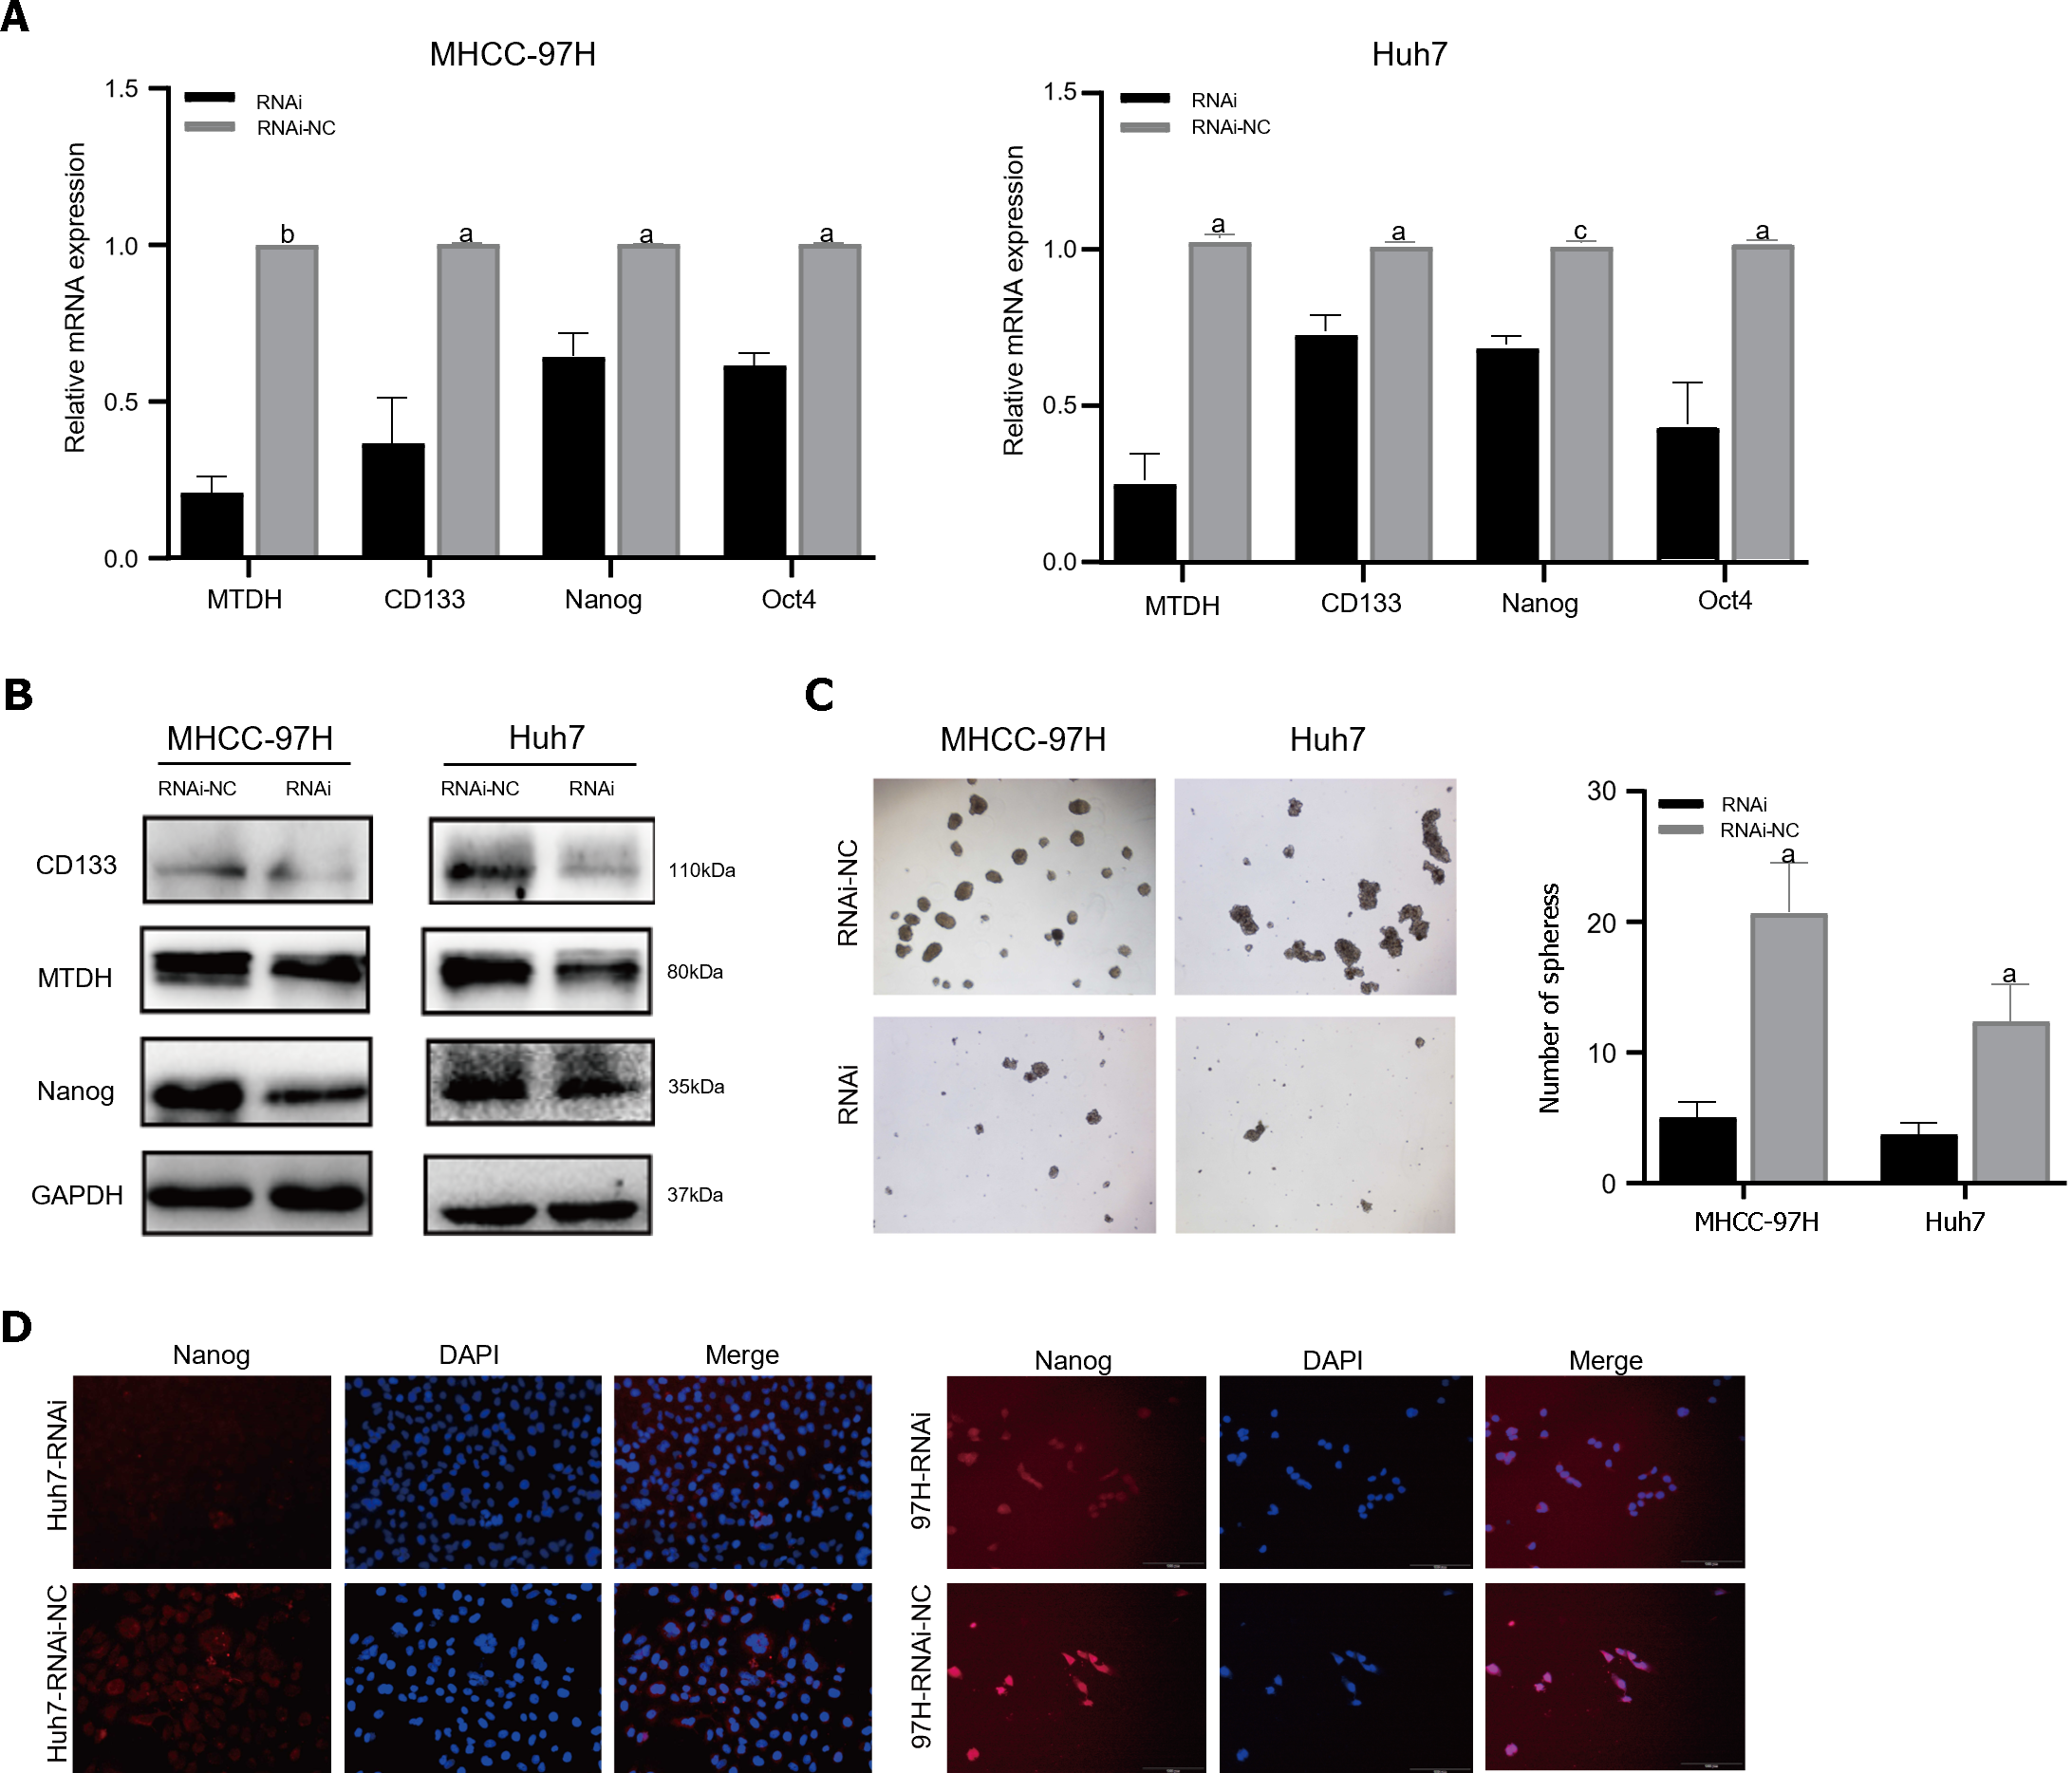
Figure 5 Metadherin downregulation inhibits hepatocellular carcinoma stem cell phenotypes.
A: mRNA expression of Metadherin (MTDH), CD133, Nanog, and Oct4 in 97H and Huh7-RNAi; B: In comparison with that of MTDH-LV-RNAi, the protein expression of CD133 and Nanog was elevated in MHCC-97H-NC and Huh7-NC cells; C: Images depicting sphere formation by 97H-RNAi and Huh7-RNAi cells; D: Immunofluorescence images of Nanog (red) in 97H-LV and Huh7-LV samples. DAPI (blue) was used to stain the nuclei. aP < 0.05, bP < 0.01, cP < 0.001. RNAi: Metadherin knockdown group; RNAi-NC: Metadherin knockdown control group.
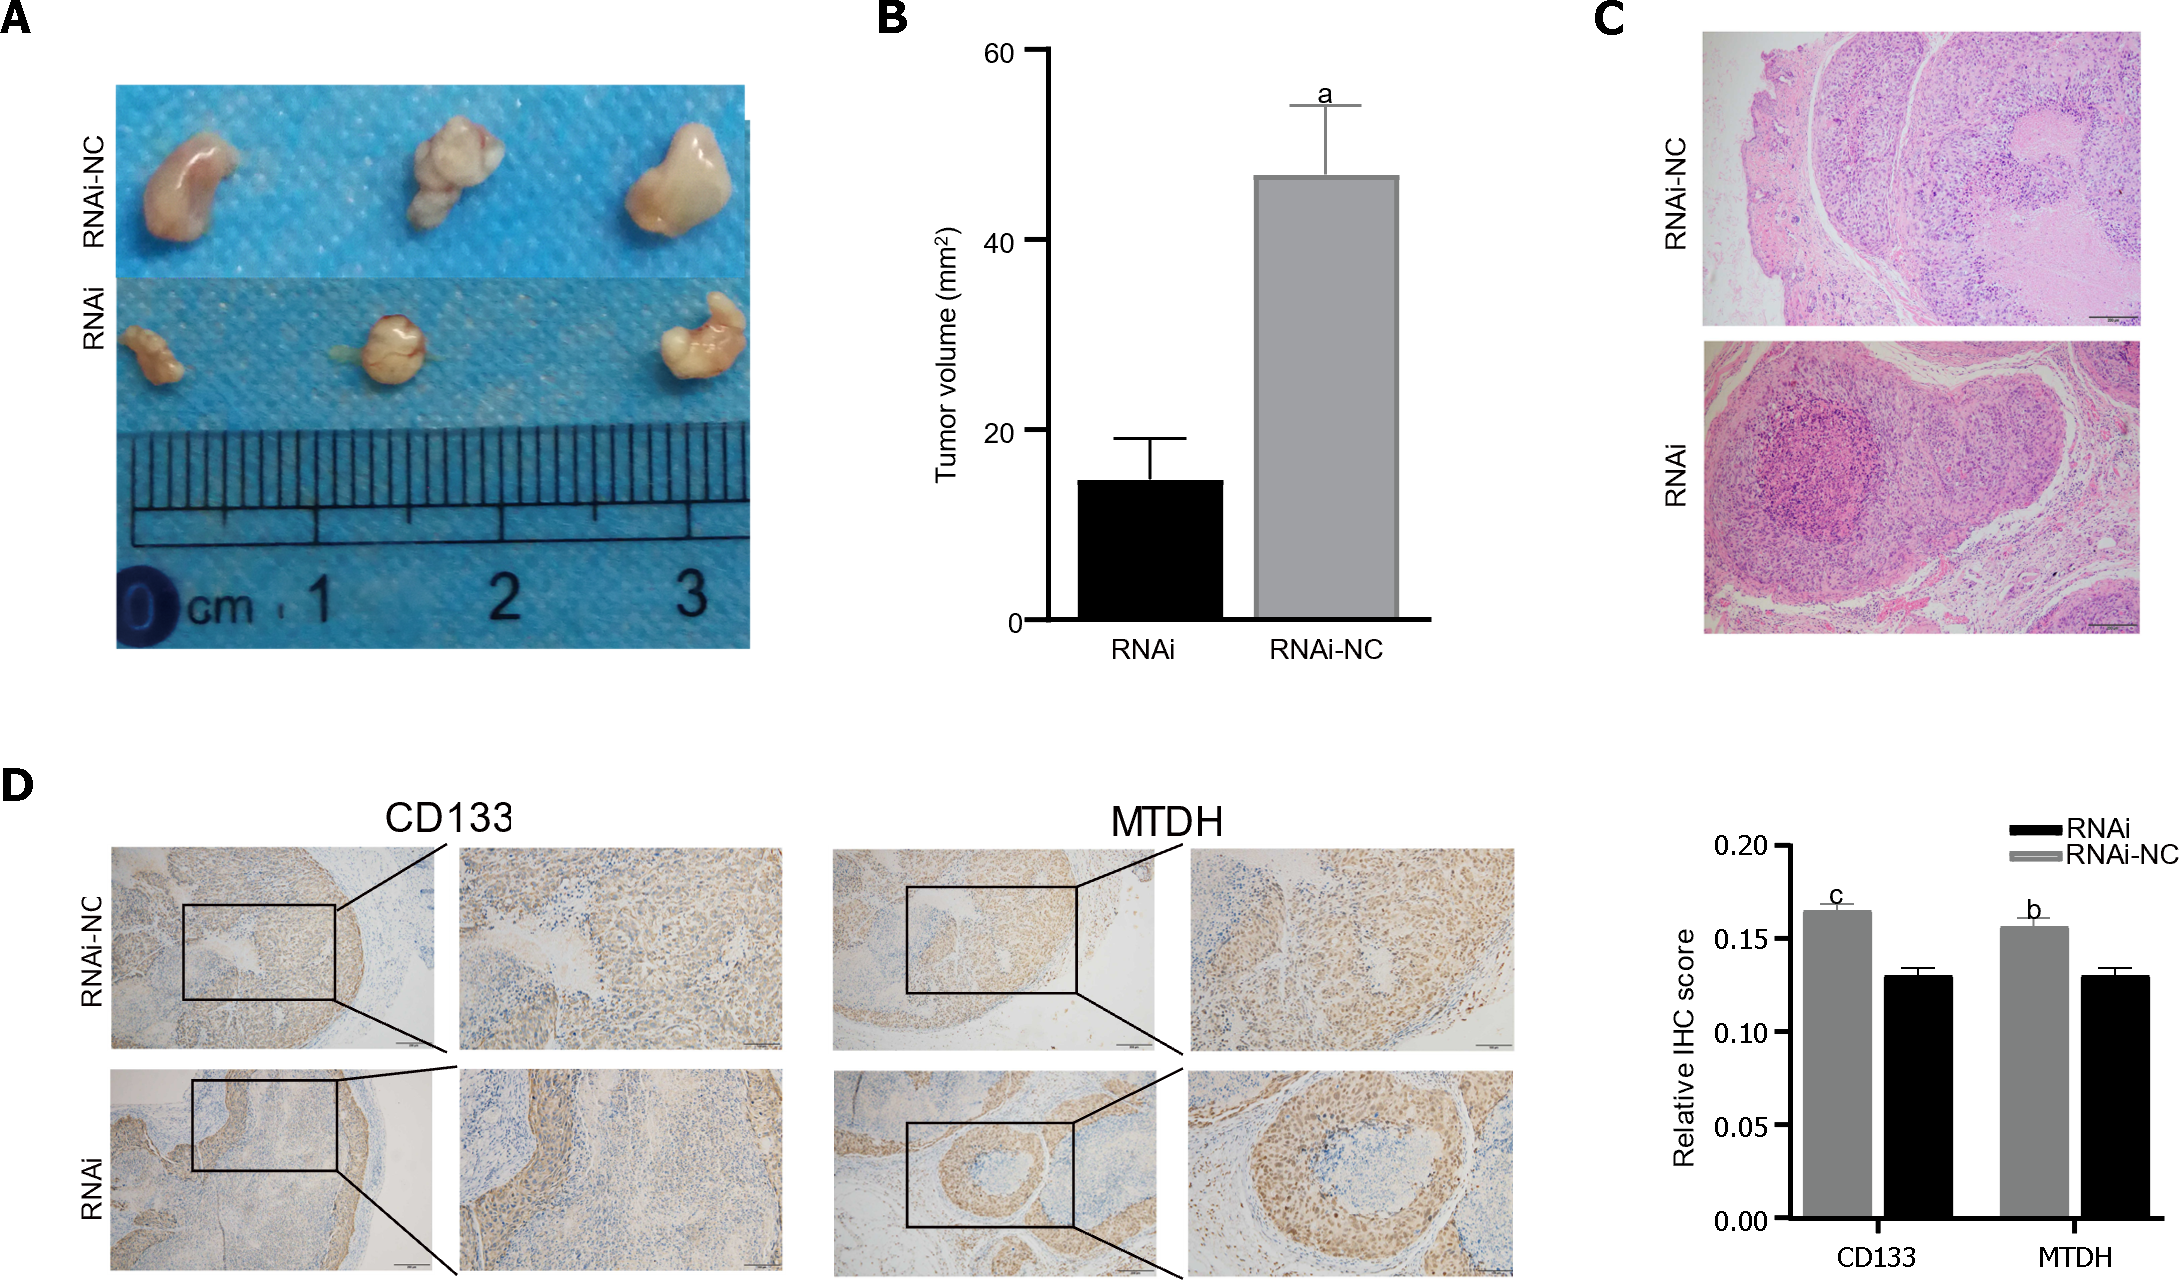
Figure 6 Metadherin stimulates tumorigenesis in vivo.
A: Tumors derived from nude mice injected with 97H-RNAi (n = 3), 97H-NC cell (n = 3); B: Tumor volume showed that the inhibition of Metadherin (MTDH) significantly inhibited tumor growth; C and D: Representative immunohistochemical staining (IHC) images of tumors from nude mice stained with CD133 and MTDH. Histograms show the IHC score. Histograms show the IHC score (scale bars = 200 μm). aP < 0.01, bP < 0.001, cP < 0.0001. RNAi: Metadherin knockdown group; RNAi-NC: Metadherin knockdown control group.
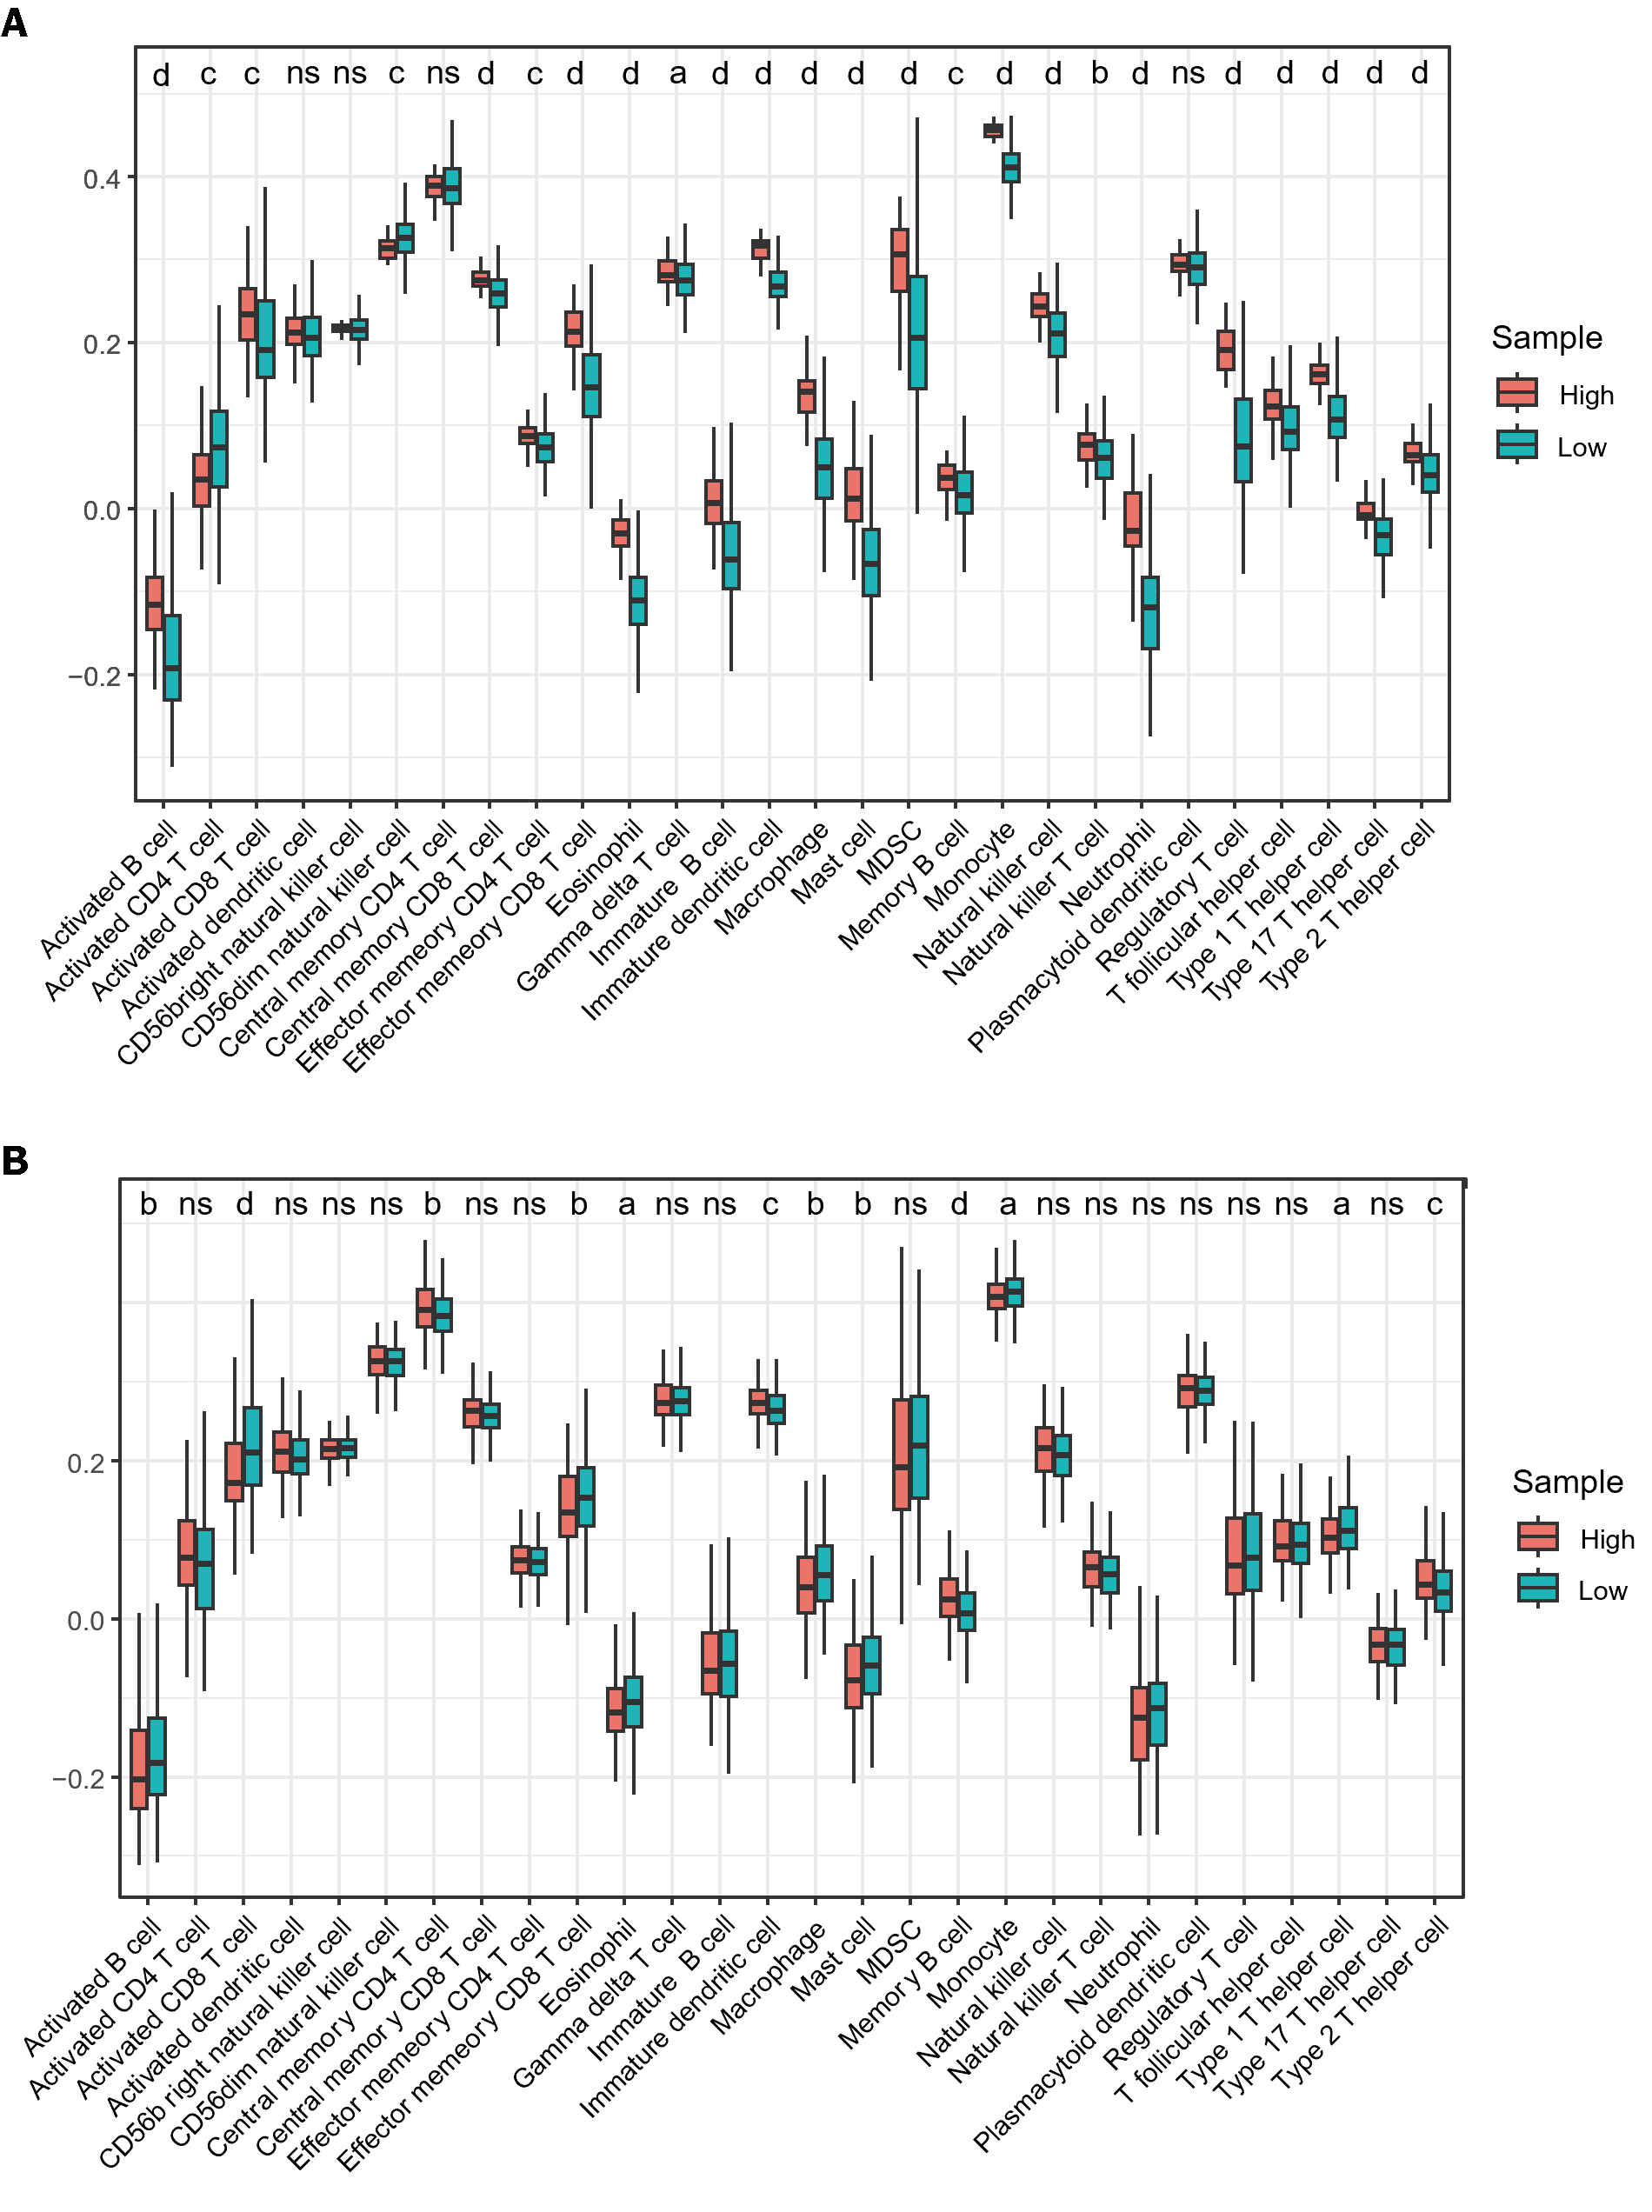
Figure 7 Infiltration of immune cells in TCGA samples using ssGSEA.
A: Immune cell infiltration between LIHC samples and normal samples; B: Different immune cell infiltration patterns in high and low expression samples of Metadherin. ns: Not significant. aP < 0.05; bP < 0.01; cP < 0.001, dP < 0.0001.
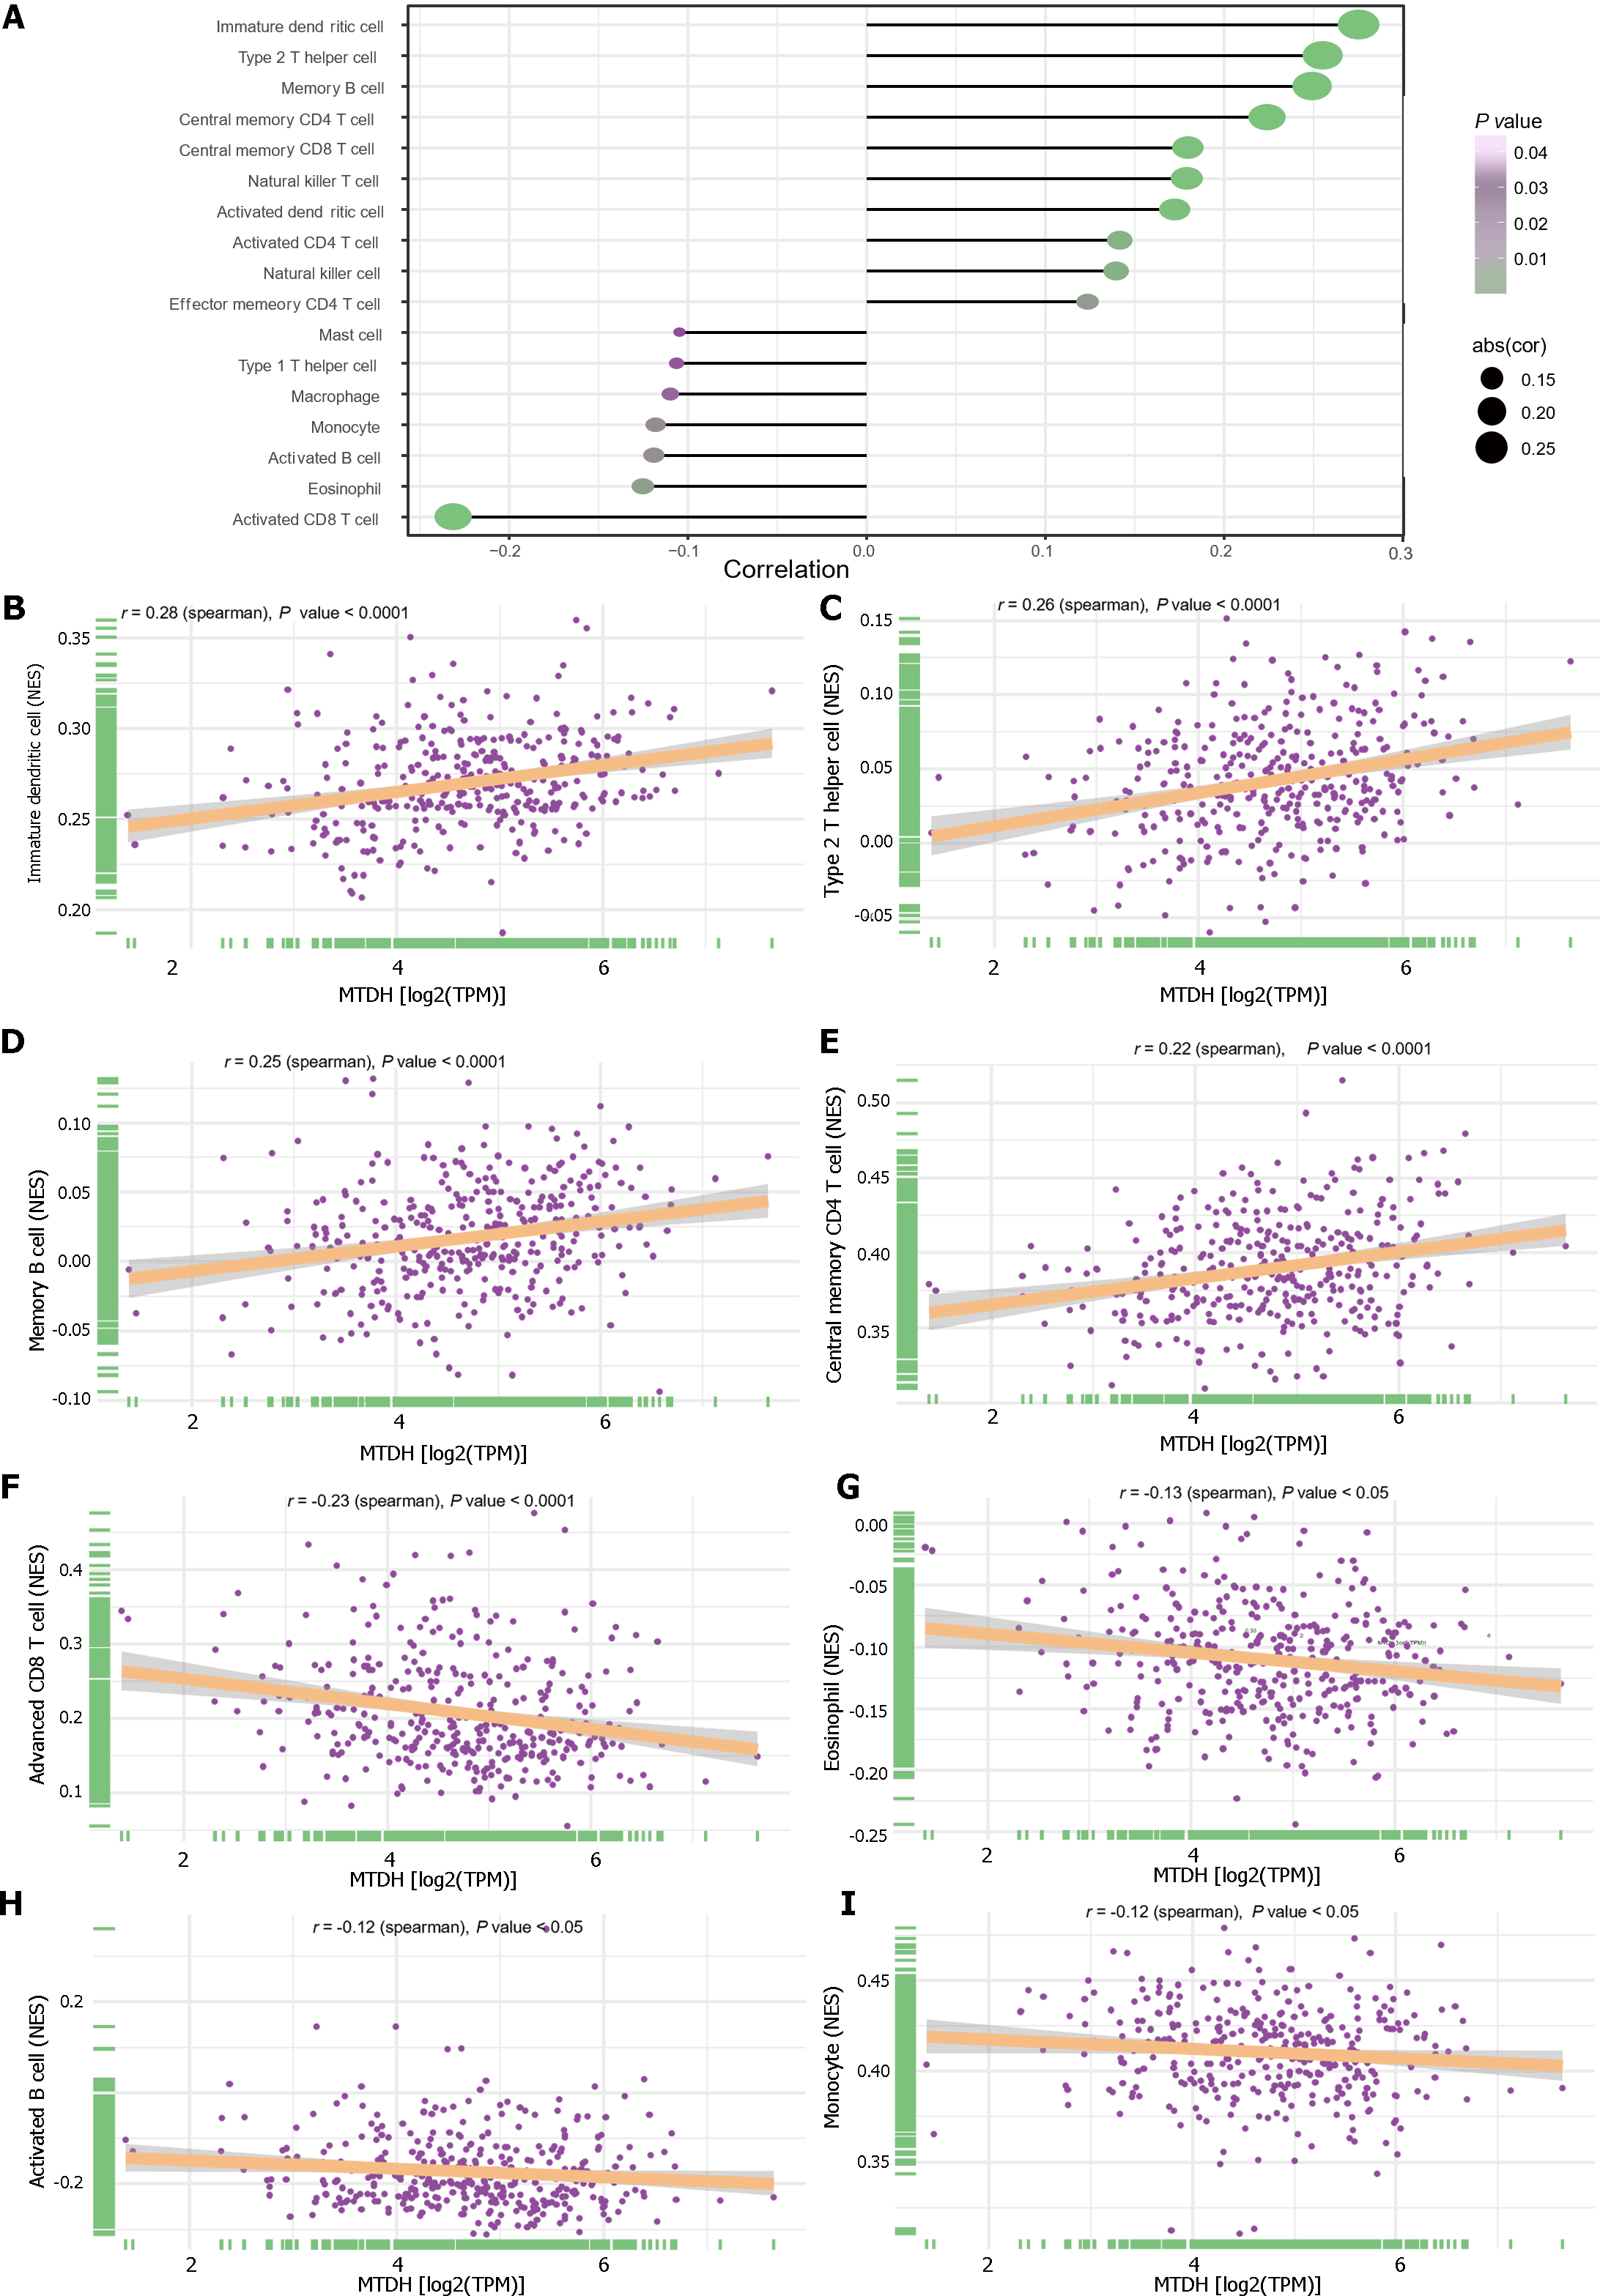
Figure 8 Immune infiltration and Metadherin expression levels.
A: Metadherin (MTDH) expression levels correlated with infiltration of immune cells; B: Correlations between MTDH and immature dendritic cells (r = 0.28, P < 0.0001); C: Correlations between MTDH and T helper 2 cells (r = 0.26, P < 0.0001); D: Correlations between MTDH and memory B cells (r = 0.25, P < 0.0001); E: Correlations between MTDH and central memory CD4 T cells (r = 0.22, P < 0.0001); F: Correlations between MTDH and activated CD8 T cell (r = -0.23, P < 0.0001); G: Correlations between MTDH and eosinophils (r = -0.13, P < 0.05); H: Correlations between MTDH and activated B cells (r =-0.12, P < 0.05); I: Correlations between MTDH and monocytes (r = -0.12, P < 0.05). MTDH: Metadherin.
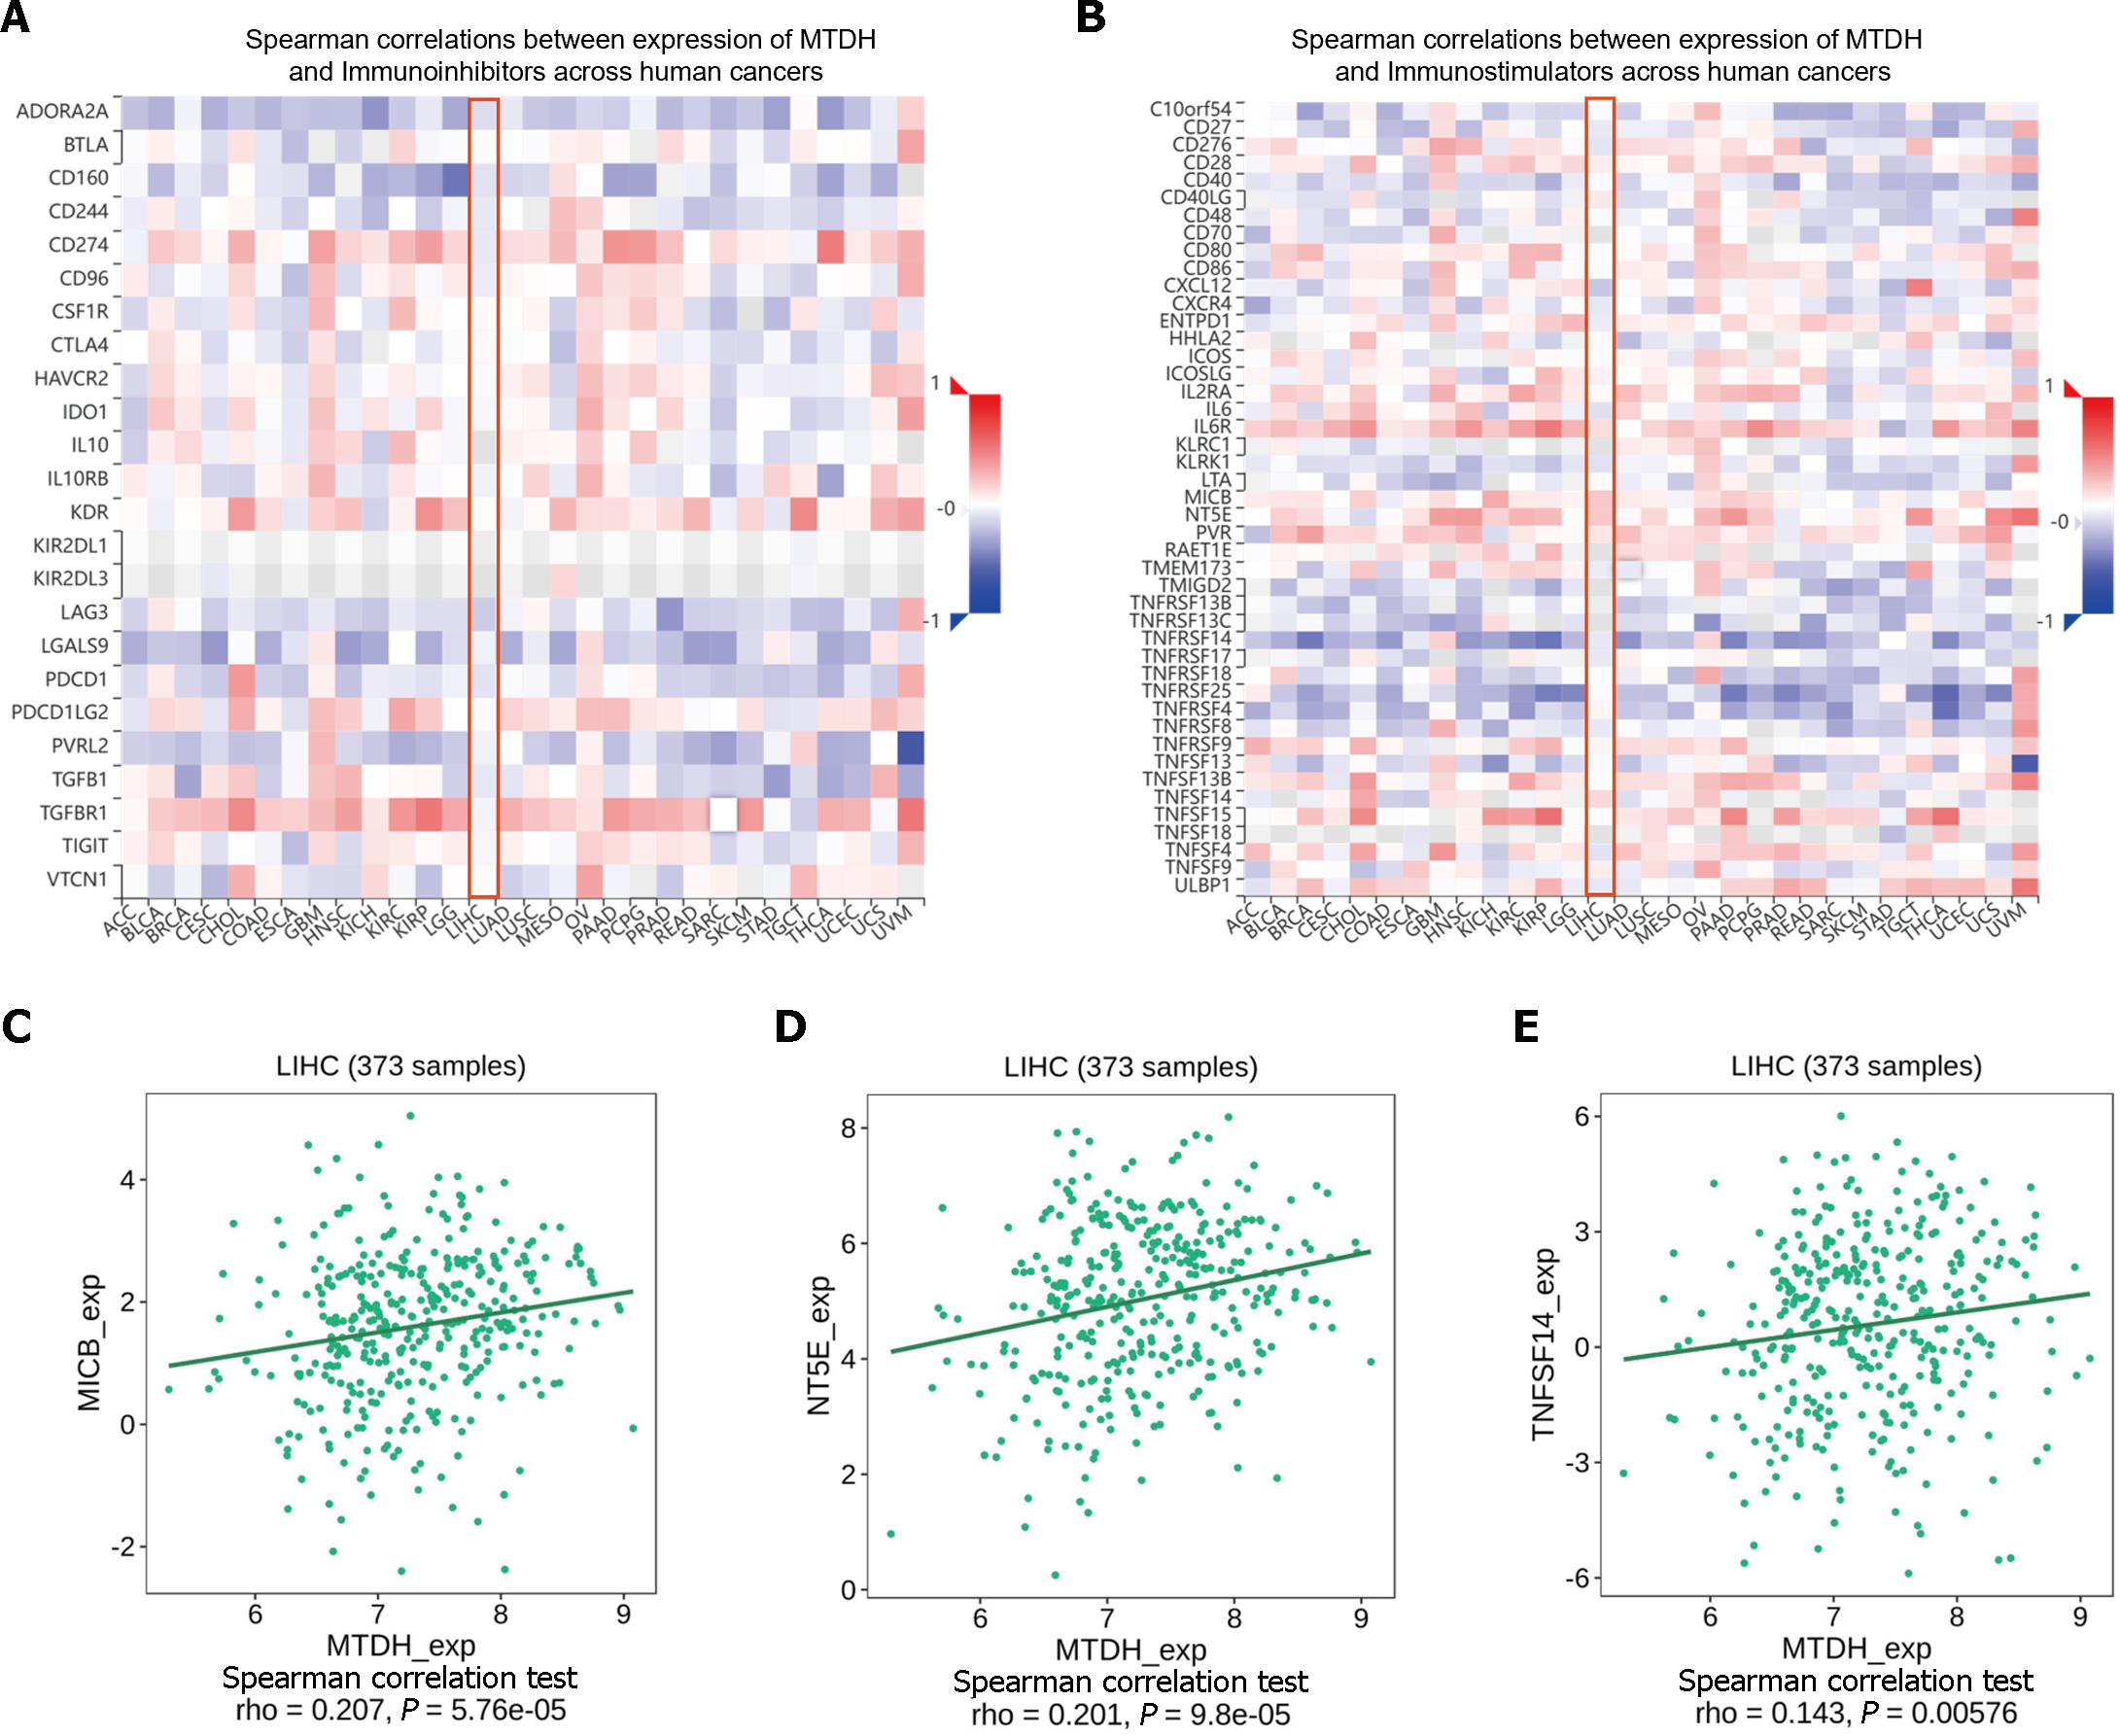
Figure 9 Correlation between Metadherin expression and immunomodulators.
A and B: Heat map showing the correlation between Metadherin (MTDH) and immunosuppressive agents and immunostimulants in hepatocellular carcinoma; C: Correlations between MTDH and MICB; D: Correlations between MTDH and NT5E; E: Correlations between MTDH and TNFSF14. MTDH: Metadherin.
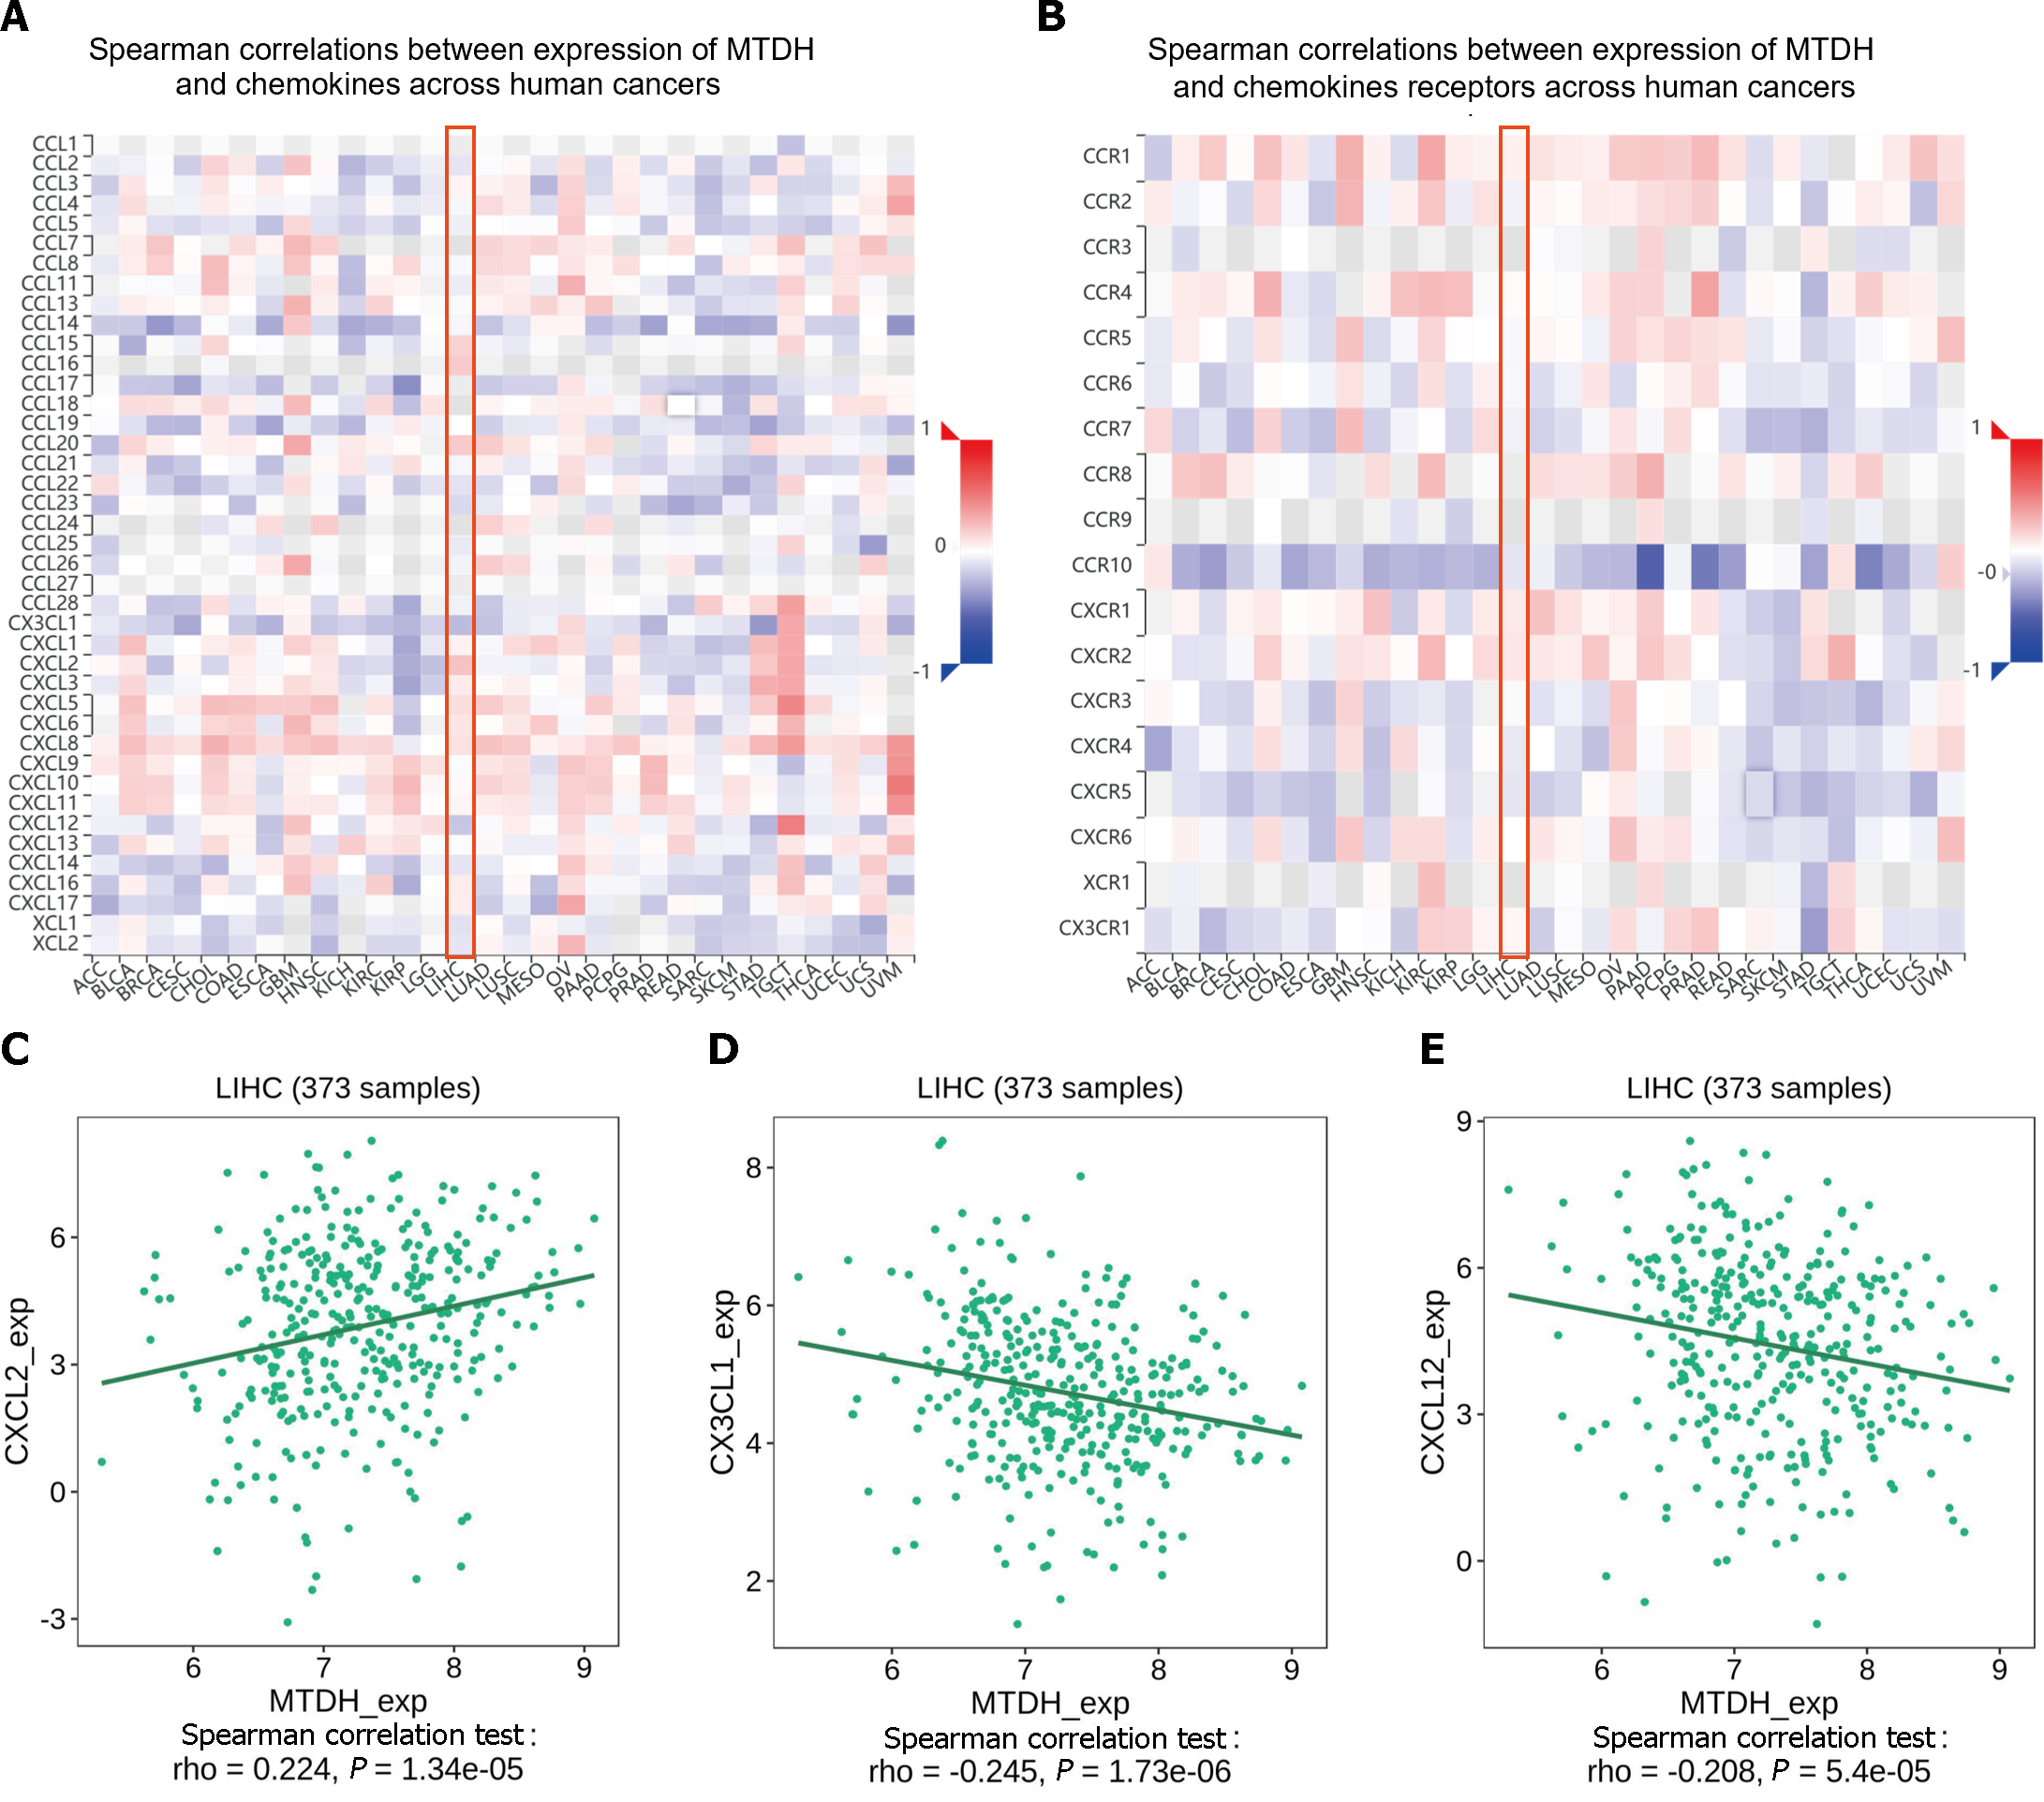
Figure 10 Chemokines and chemokine receptor correlates with Metadherin.
A and B: A correlation analysis of Metadherin (MTDH) and chemokines and the receptors in LIHC is presented as a heat map; C: Correlations between MTDH and CXCL2; D: Correlations between MTDH and CX3CL1; E: Correlations between MTDH and CXCL12. MTDH: Metadherin.
- Citation: Wang YY, Shen MM, Gao J. Metadherin promotes stem cell phenotypes and correlated with immune infiltration in hepatocellular carcinoma. World J Gastroenterol 2024; 30(8): 901-918
- URL: https://www.wjgnet.com/1007-9327/full/v30/i8/901.htm
- DOI: https://dx.doi.org/10.3748/wjg.v30.i8.901


