Copyright
©The Author(s) 2024.
World J Gastroenterol. Feb 21, 2024; 30(7): 770-773
Published online Feb 21, 2024. doi: 10.3748/wjg.v30.i7.770
Published online Feb 21, 2024. doi: 10.3748/wjg.v30.i7.770
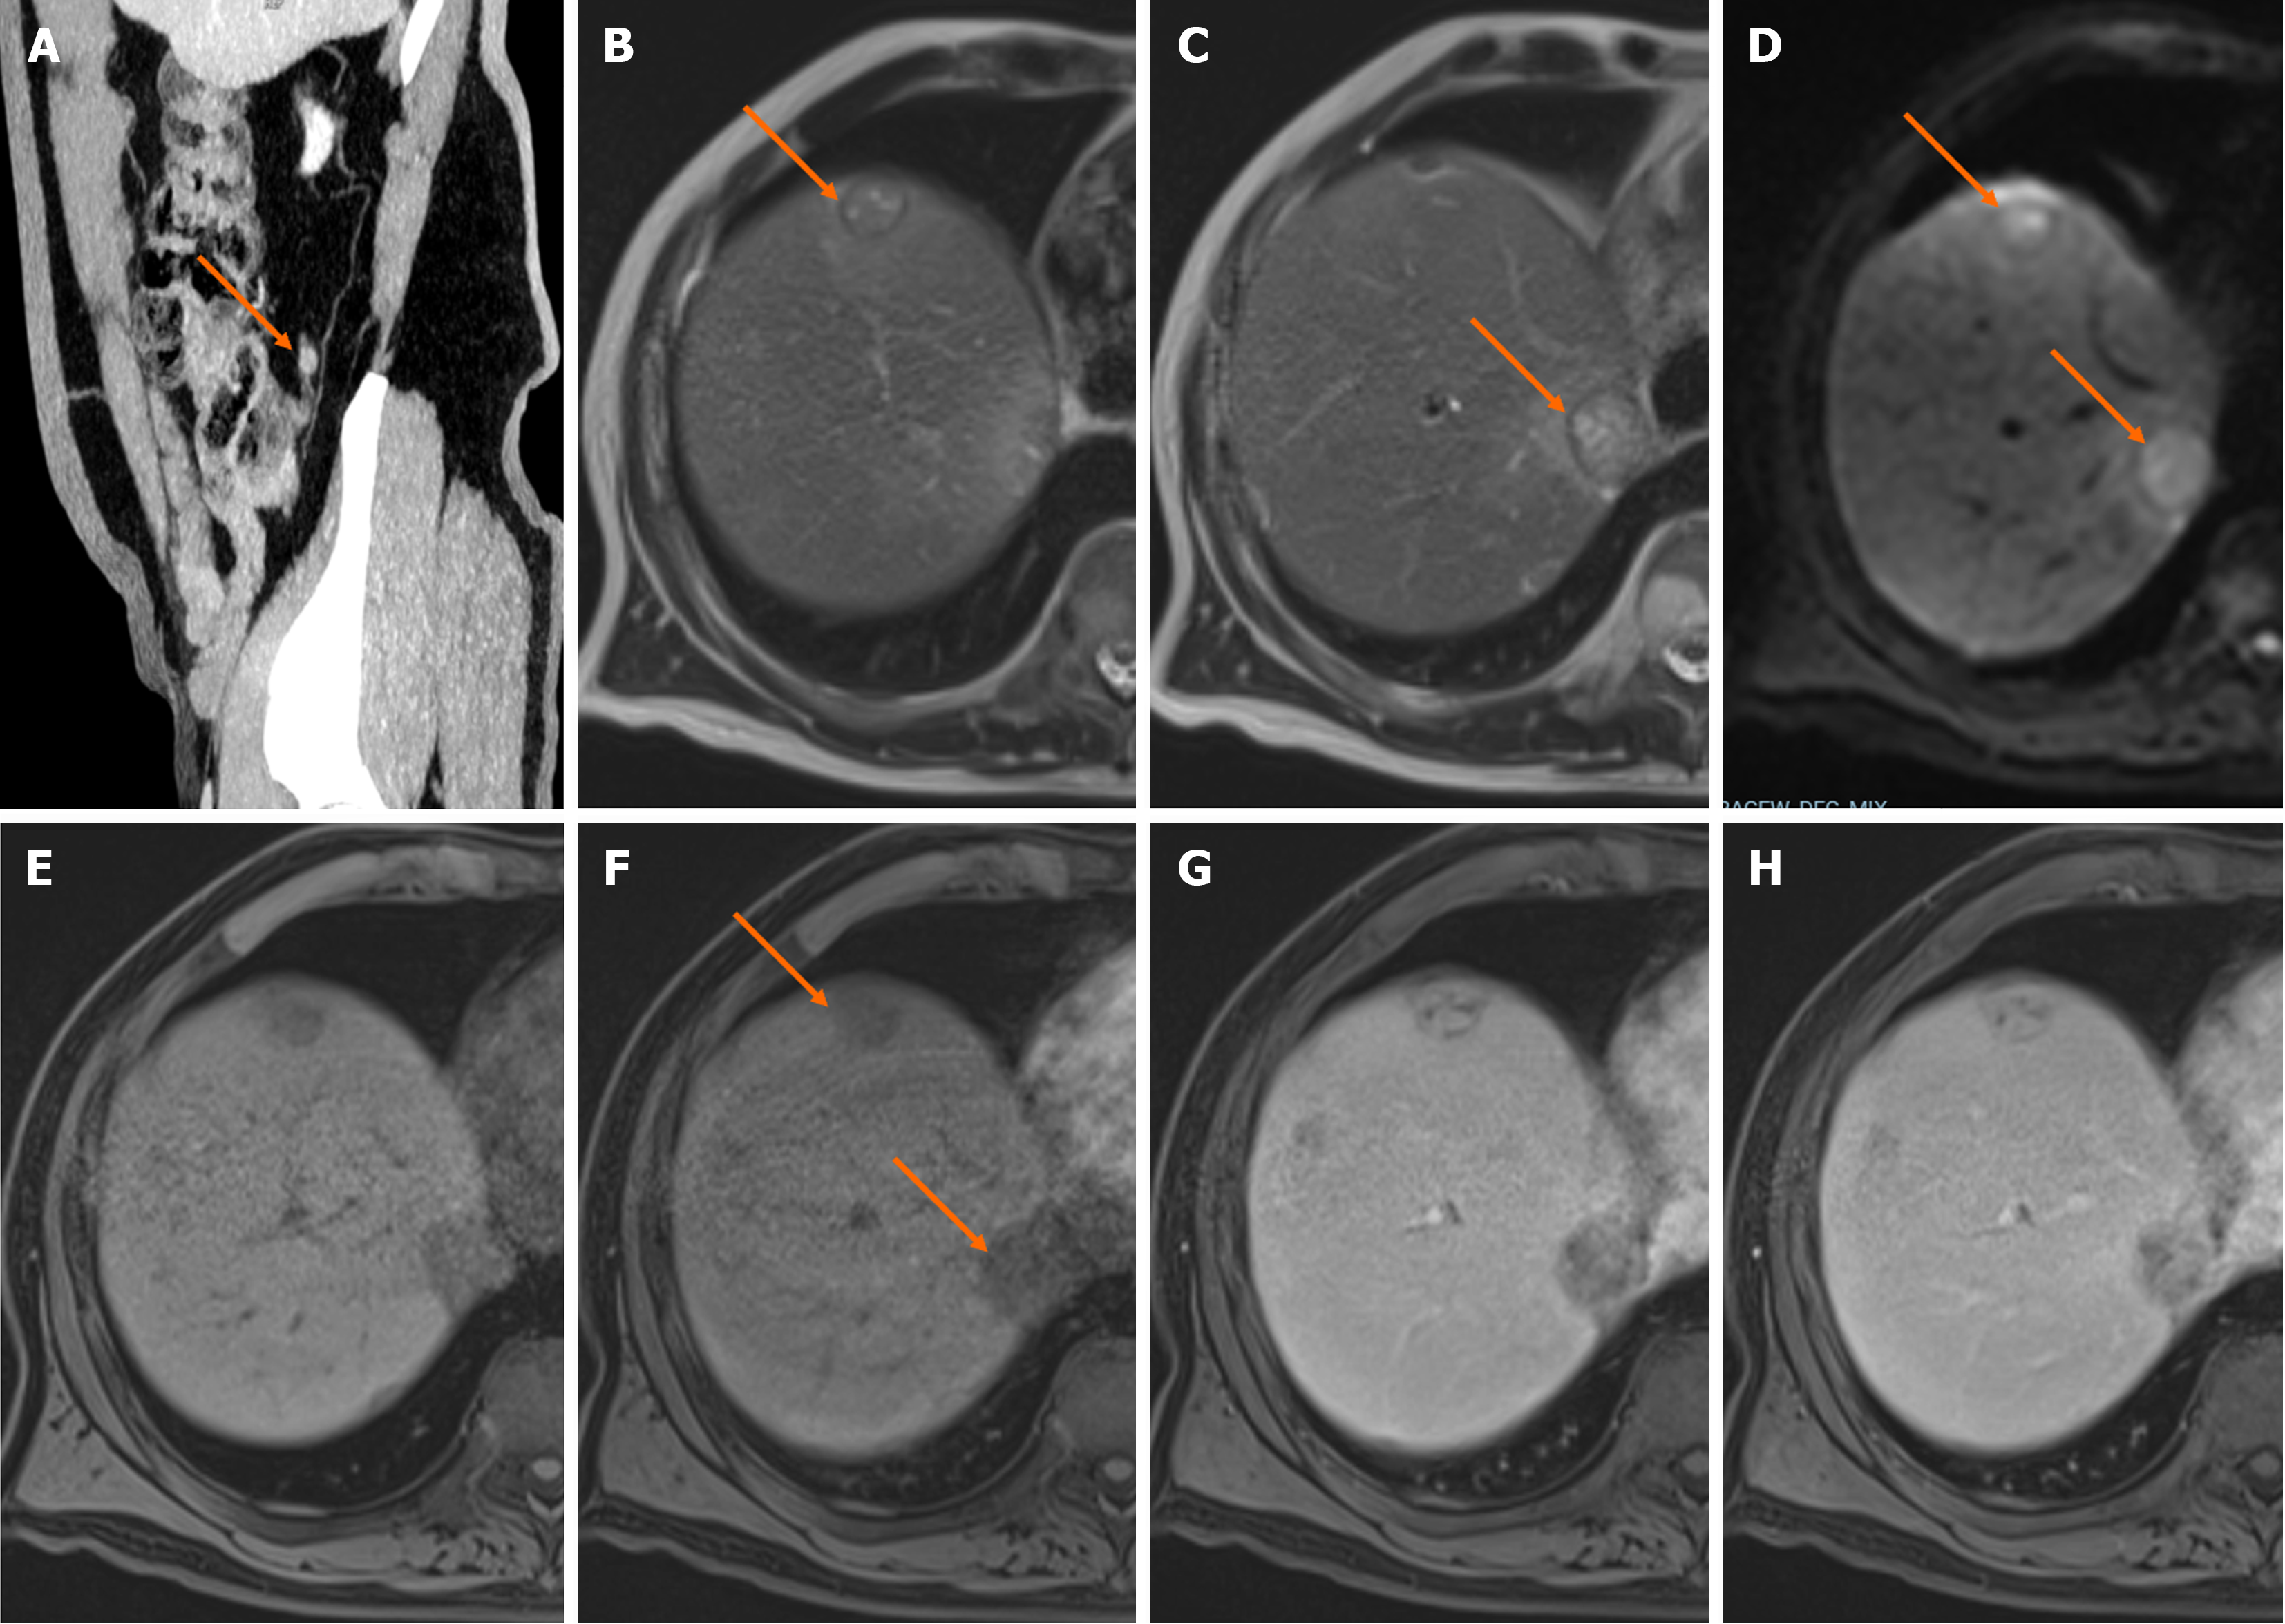
Figure 1 Liver metastases from an appendix neuroendocrine tumor.
In Gd-DOTA-magnetic resonance imaging of a 60-year-old male patient. A: On sagittal MIP computed tomography images, there is an enhancing lesion located at the tip of the appendix (orange arrow); B and C: On consecutive T2-weighted images, lesions appear slightly hyperintense (orange arrows); D: Diffusion restriction in lesions on diffusion weighted imaging (orange arrows); E: Before contrast administration, lesions are hypointense; F: During the post-contrast late hepatic arterial phase, lesions appear hypovascular (orange arrows); G and H: Lesions are hyperintense on the portal-venous and delayed post-contrast phase.
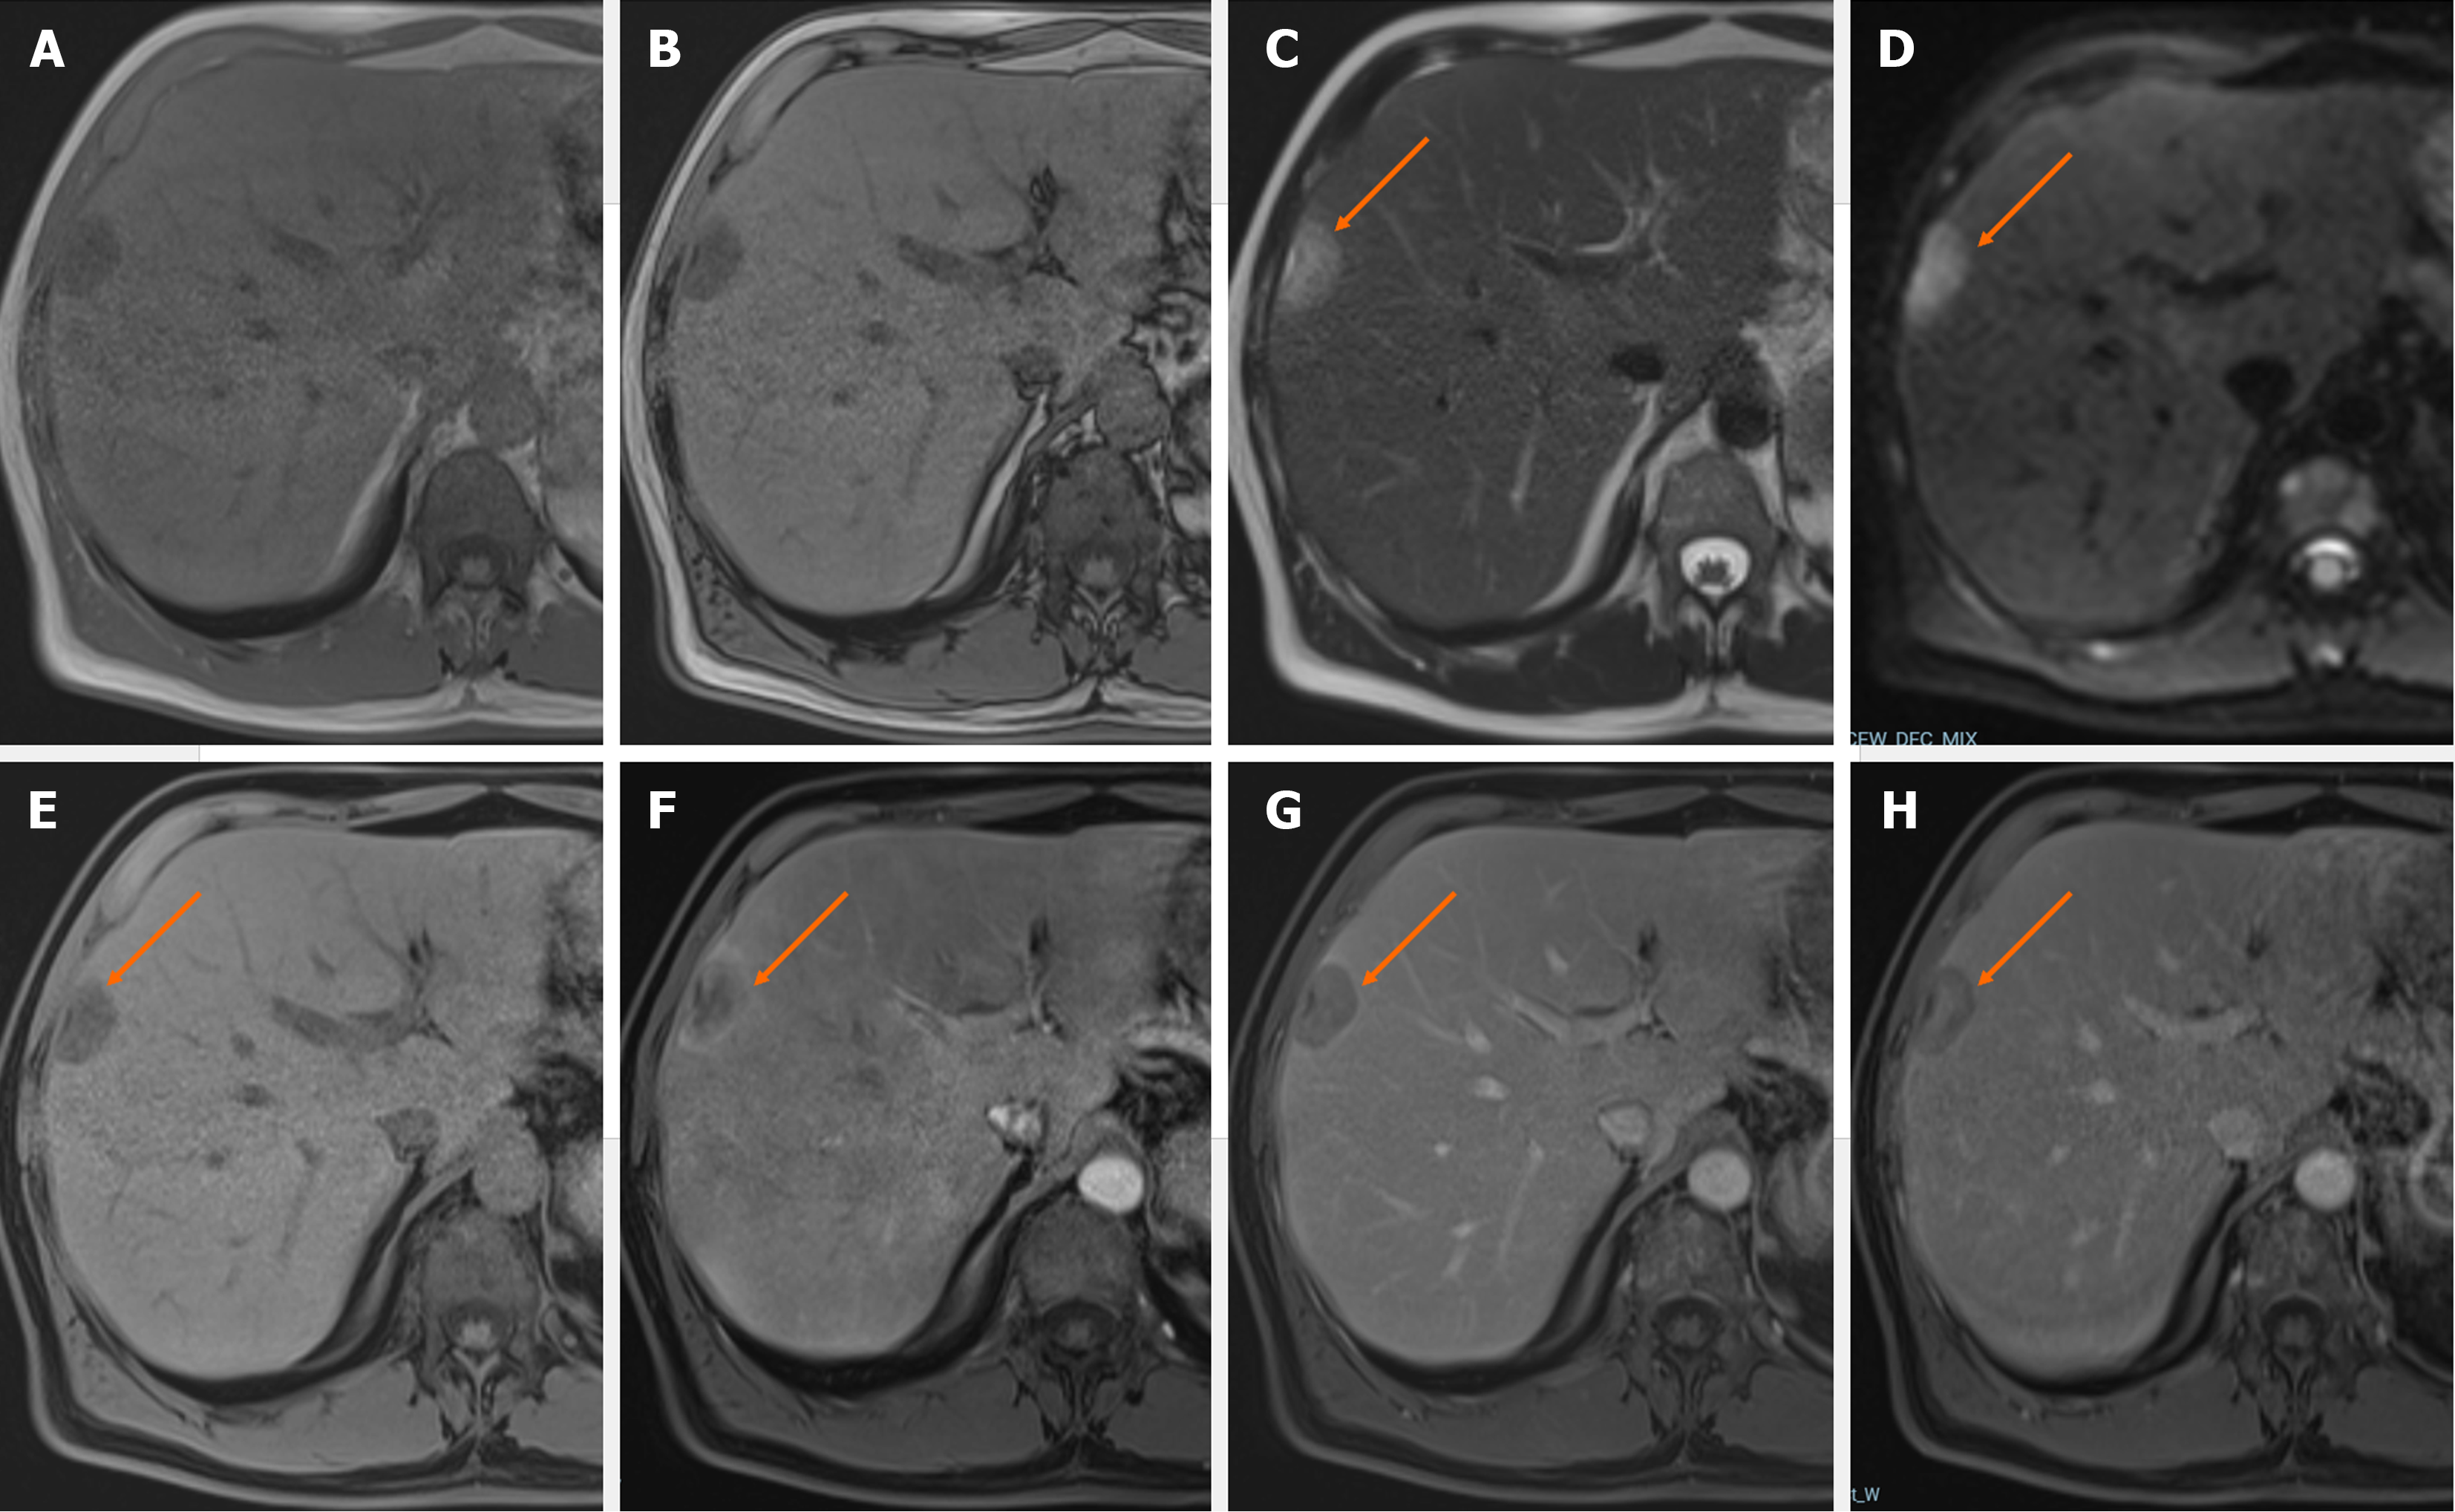
Figure 2 Liver metastases from prostate adenocarcinoma.
In Gd-EOB-magnetic resonance imaging of a 52-year-old male patient. A: On in-phase images, there is a focal hypointense liver lesion; B: On out-of-phase images, the lesion persists hypointense compared to the healthy liver parenchyma; C: On T2-weighted images, the lesion appears slightly hyperintense (orange arrow); D: Diffusion restriction in the lesion on diffusion-weighted imaging (orange arrow); E: Before contrast administration, the lesion is hypointense (orange arrow); F: The lesion appears hypervascular due to peripheral rim-like hyperenhancement during the post-contrast late hepatic arterial phase (orange arrow); G: The lesion is hypointense on the portal-venous phase compared to the healthy liver parenchyma (orange arrow); H: On the hepatobiliary phase, low signal intensity of the lesion due to washout is observed, especially in the peripheral areas (orange arrow).
Figure 3 A case of Echinococcus alveolaris in the liver.
In Gd-EOB-magnetic resonance imaging of a 69-year-old male patient. A and B: On with and without fat-suppressed T2-weighted images the lesions appear slightly hyperintense and hypointense areas in the central part of the largest lesion (orange arrows); C: Diffusion-weighted imaging reveals restriction of diffusion of the lesions (orange arrows); D: The lesions show peripheral rim-like enhancement on the hepatobiliary phase (orange arrows).
- Citation: Memis KB, Aydin S. Complementary comments on metastatic liver lesions with exceptional and rare cases. World J Gastroenterol 2024; 30(7): 770-773
- URL: https://www.wjgnet.com/1007-9327/full/v30/i7/770.htm
- DOI: https://dx.doi.org/10.3748/wjg.v30.i7.770


