Copyright
©The Author(s) 2024.
World J Gastroenterol. Feb 21, 2024; 30(7): 714-727
Published online Feb 21, 2024. doi: 10.3748/wjg.v30.i7.714
Published online Feb 21, 2024. doi: 10.3748/wjg.v30.i7.714
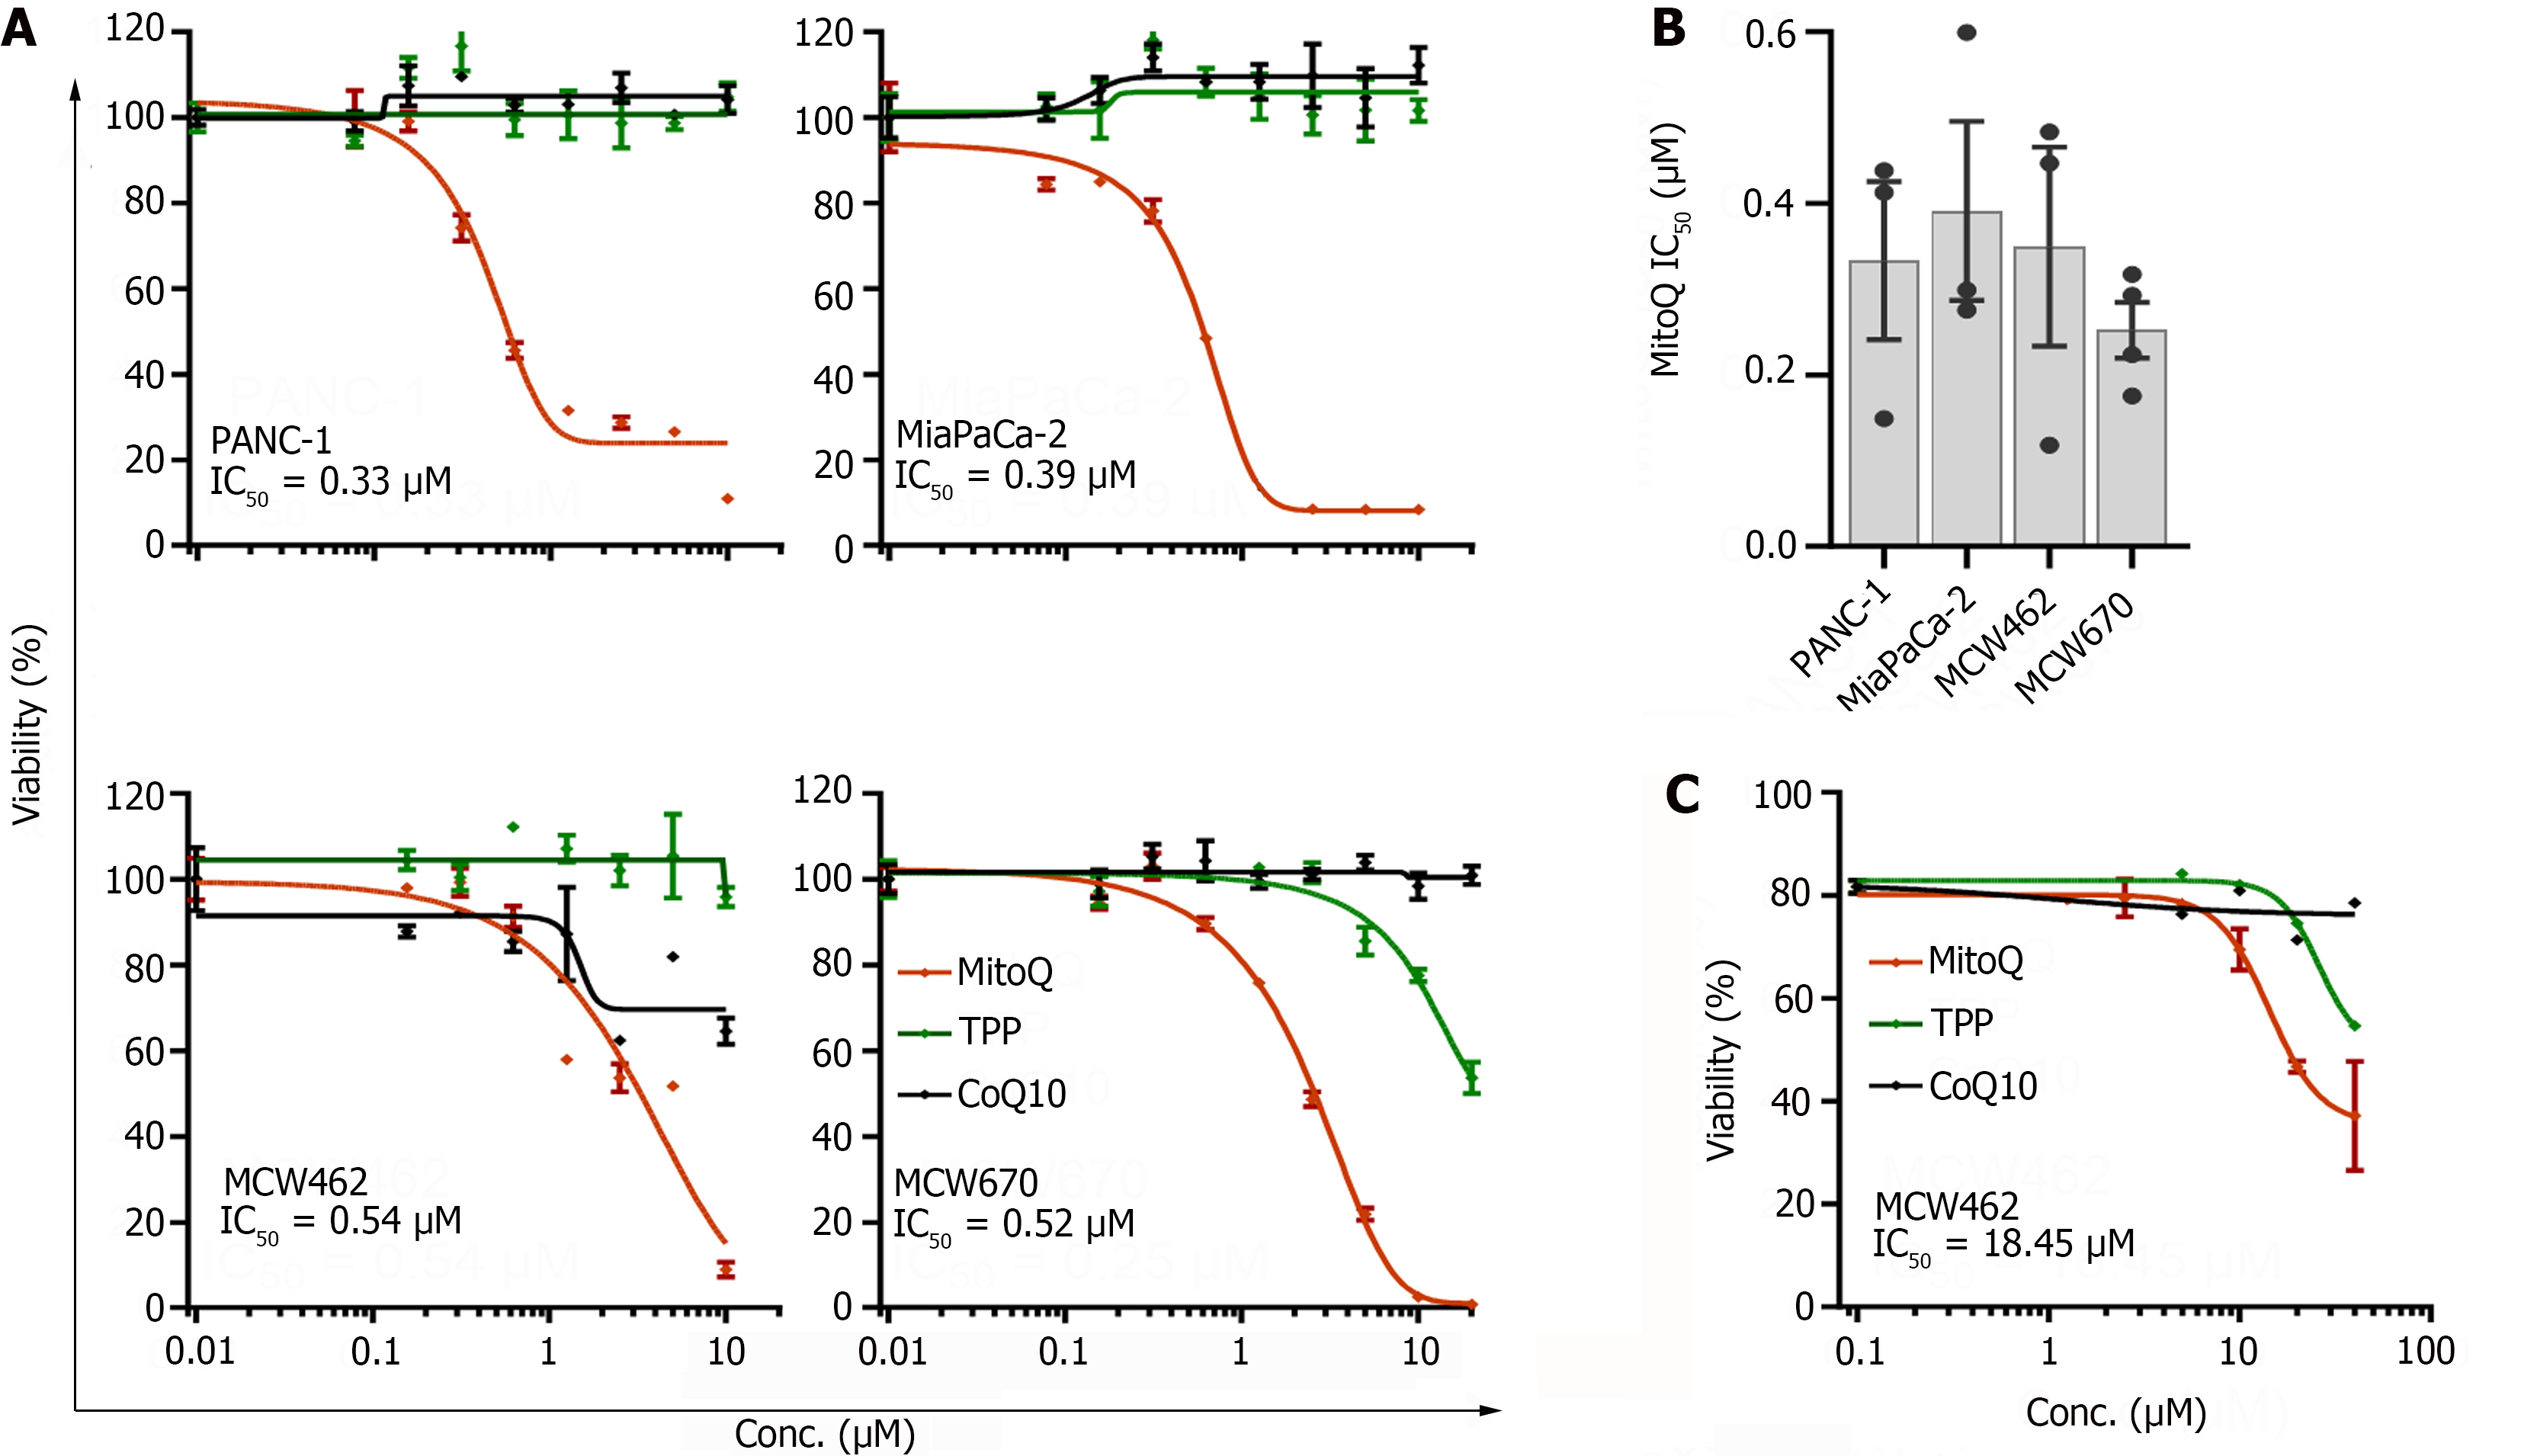
Figure 1 Mitochondria-targeted ubiquinone can suppress the viability of pancreatic adenocarcinoma cells.
A: pancreatic adenocarcinoma (PDAC) cells in 12 well plates were treated with increasing doses of mitochondria-targeted ubiquinone (MitoQ), CoQ10, and triphenyl-phosphonium (TPP) for 48 h prior to determining cell viability by crystal violet staining. CoQ10 is the functional moiety of MitoQ and TPP is the vehicle moiety. 462 and 670 denote MCW462 and MCW670 cell lines, respectively; B Summary of the half maximal inhibitory concentration values determined for different PDAC cells treated and analyzed as described; C: MCW462 cells in organoid cultures were treated with increasing doses of MitoQ, CoQ10, and TPP for 48 h prior to determining cell viability by Sytox Green assays. Data (mean ± SEM, n ≥ 3) are expressed as the percentage of untreated controls. TPP: Triphenyl-phosphonium; MitoQ: Mitochondria-targeted ubiquinone; IC50: Half maximal inhibitory concentration.
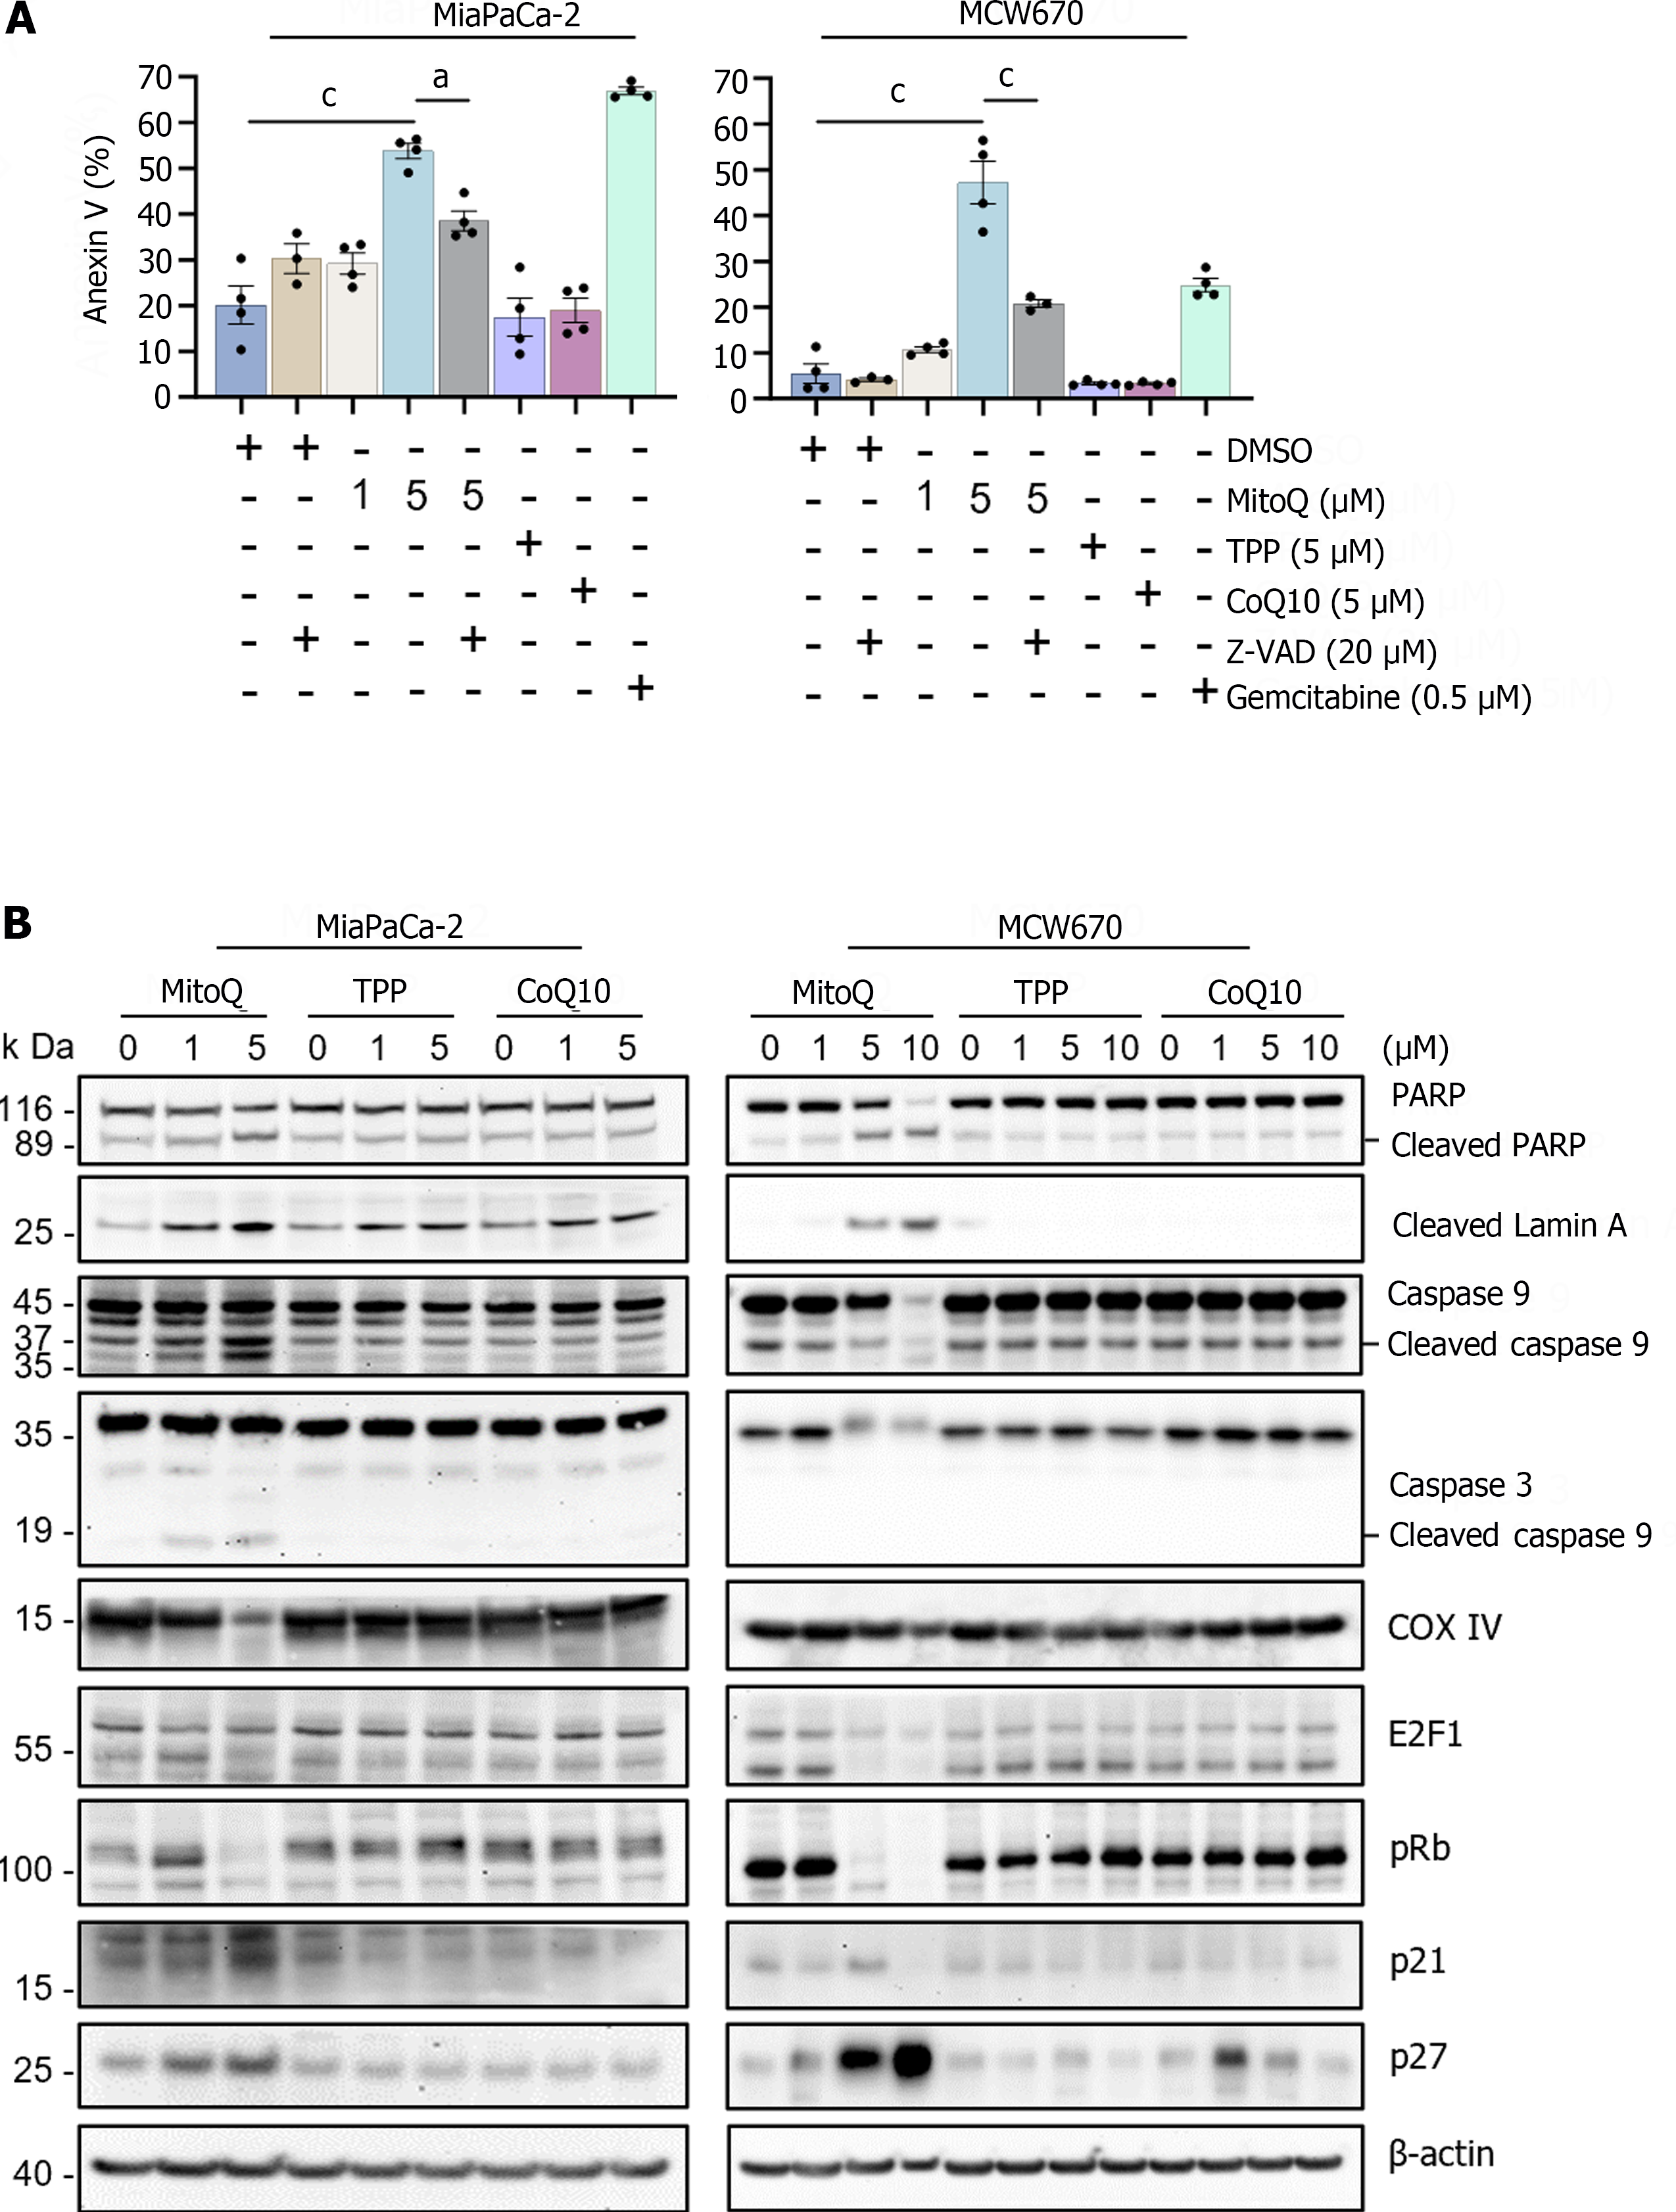
Figure 2 Mitochondria-targeted ubiquinone can induce caspase-dependent apoptosis in pancreatic adenocarcinoma cells.
A: Apoptosis analysis of cells treated with mitochondria-targeted ubiquinone (MitoQ), with or without Carbobenzoxy-valyl-alanyl-aspartyl-[O-methyl]-fluoromethylketone, for 24 h. CoQ10 is the functional moiety of MitoQ and triphenyl-phosphonium is the vehicle moiety. Gemcitabine is the positive control for apoptosis induction. Data (mean ± SEM, N ≥ 3) are expressed as the percentage of untreated controls. One-way ANOVA with Bonferroni post-tests; B: Western blot analysis of total lysates of cells treated as described. β-actin is the control for equal amounts of protein loading. aP < 0.05. cP < 0.001. MitoQ: Mitochondria-targeted ubiquinone; TPP: Triphenyl-phosphonium.
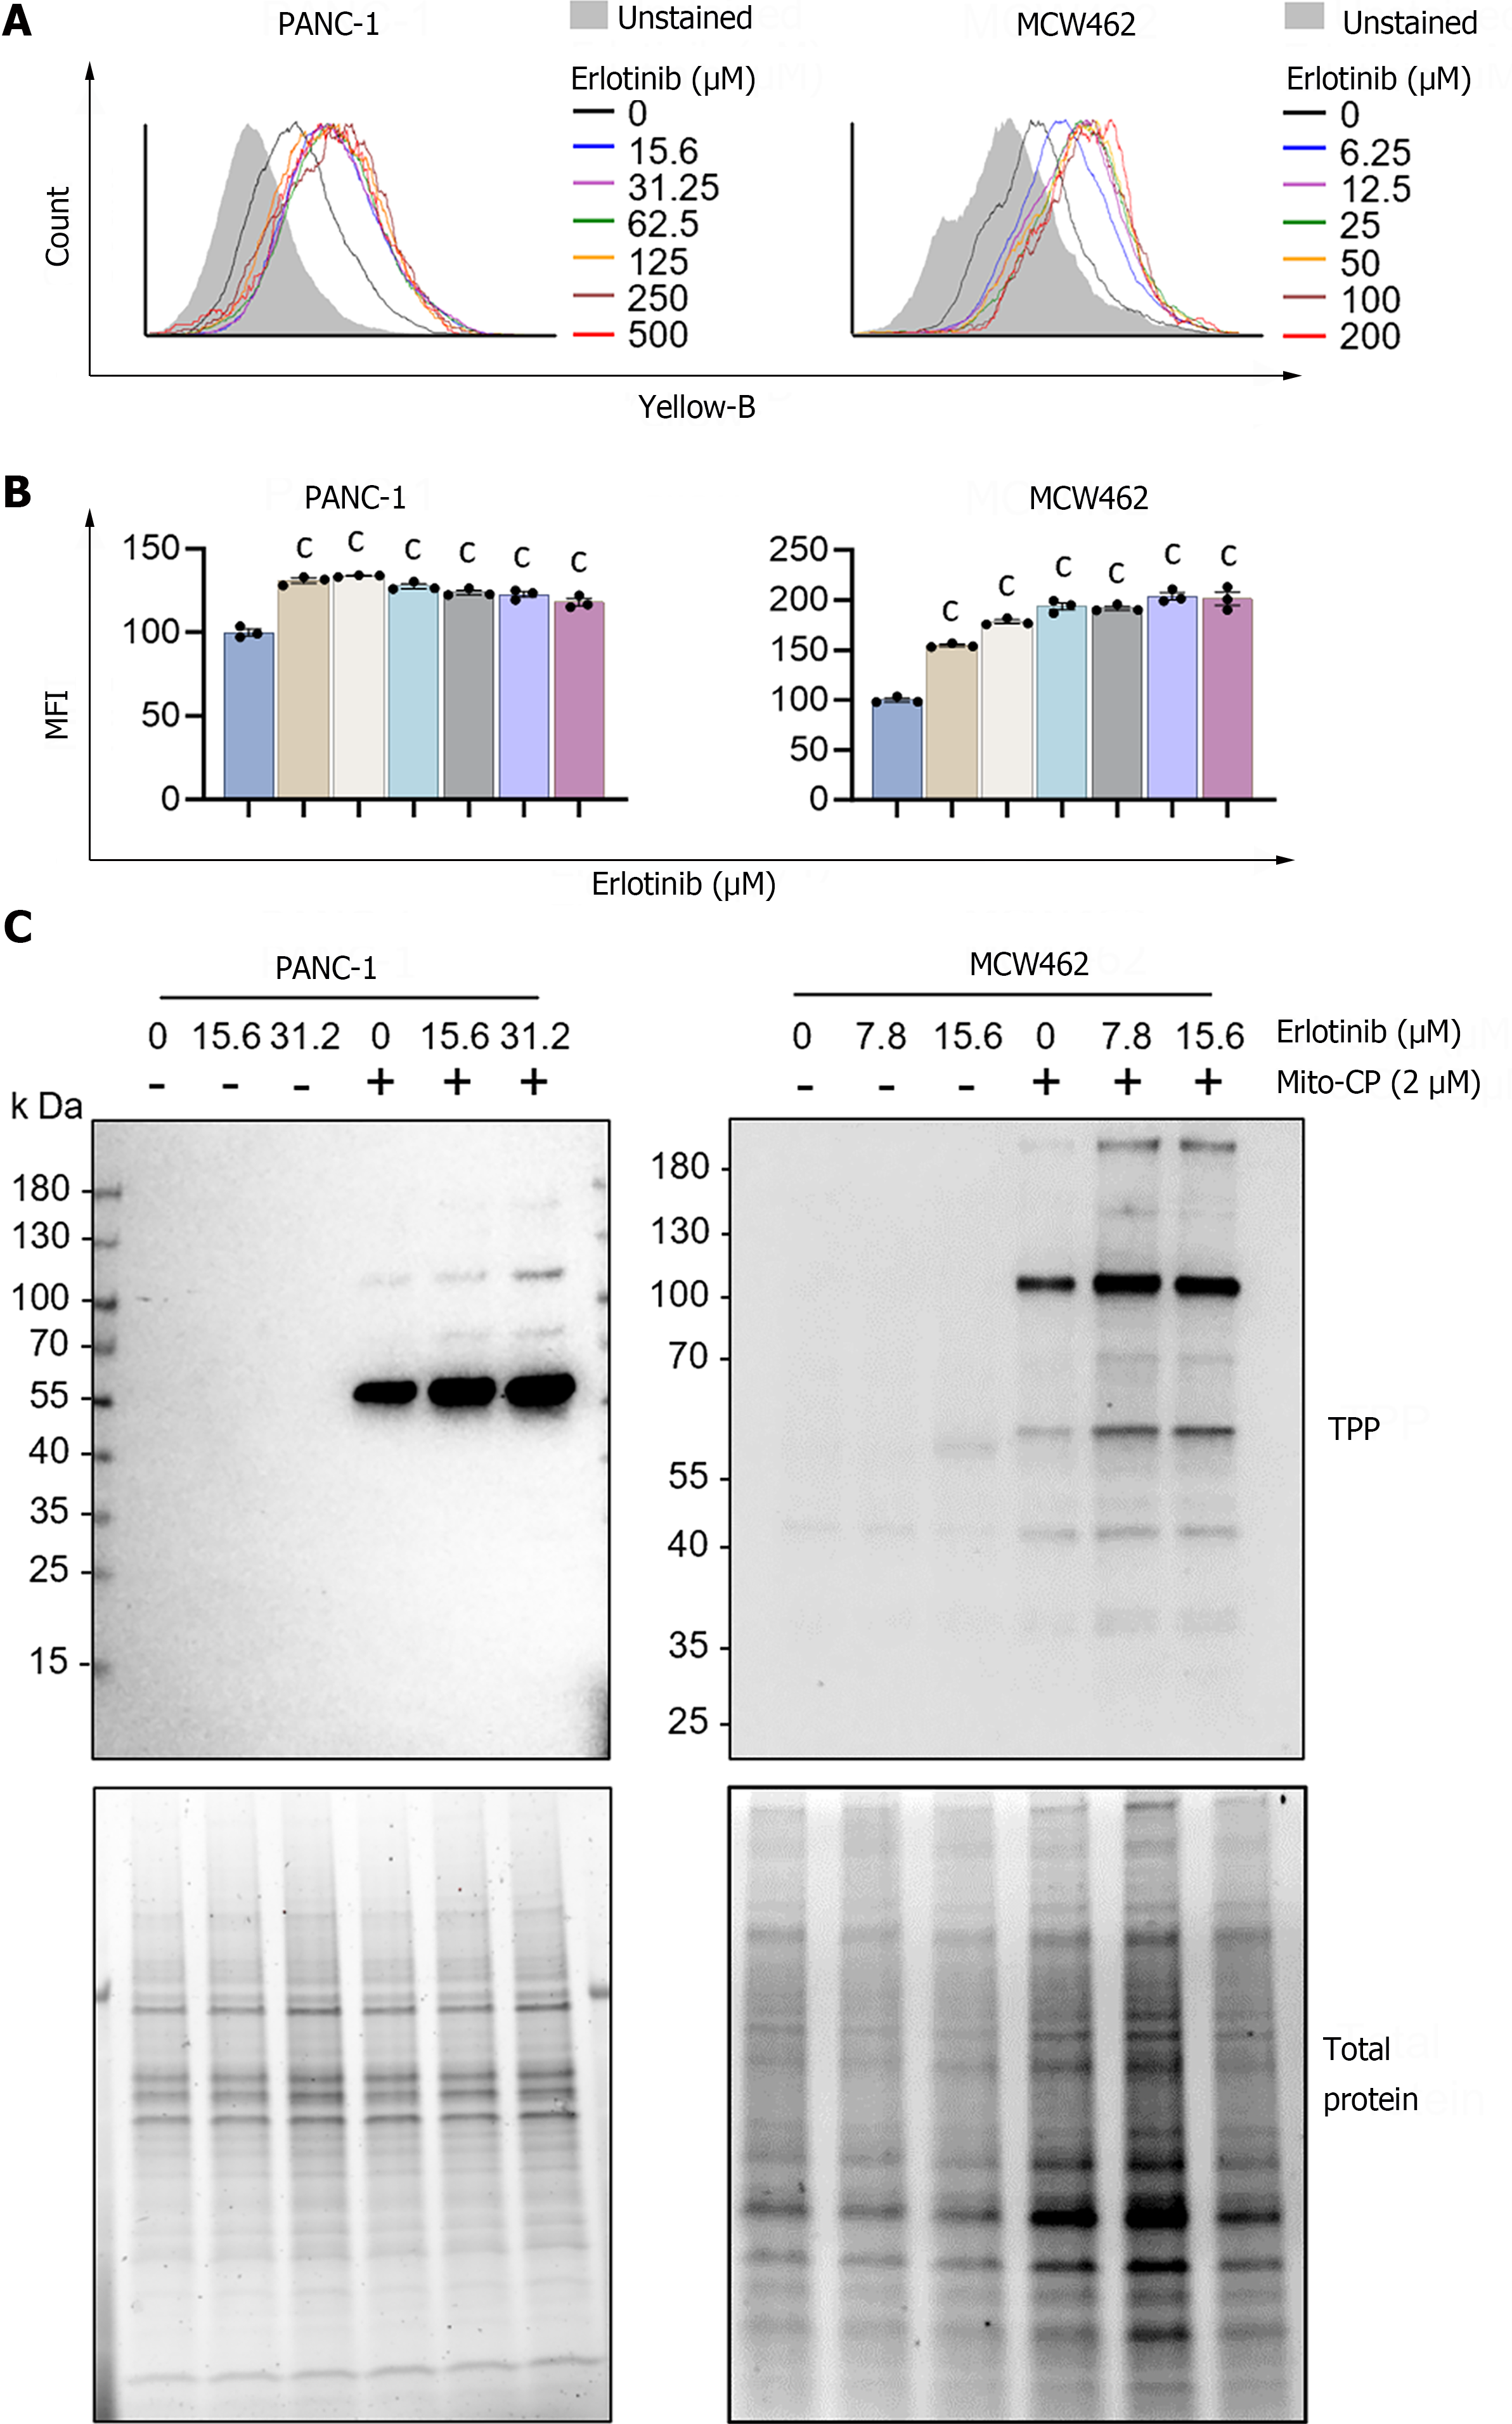
Figure 3 Erlotinib can increase mitochondrial membrane potential in pancreatic adenocarcinoma cells.
A: Cells were treated with increasing concentrations of erlotinib for 2 d prior to staining with tetramethyl-rhodamine methyl ester (TMRM). Cellular TMRM retention was analyzed by flow cytometry measuring yellow fluorescence; B: Mean fluorescence intensities of TMRM-stained cells quantified by FCS Express software. Data are mean ± SEM (n ≥ 3). One-way ANOVA with Bonferroni post-tests; C: Cells pretreated with erlotinib for 48 h were treated with 2 μM mitochondria-targeted carboxy-proxyl (MitoCP) for 1 h. Mitochondrial extracts of these cells were analyzed by Western blotting to detect the formation of MitoCP adducts using the antibody specific to the triphenyl-phosphonium moiety of MitoCP. Total proteins in the extracts were visualized in the stain-free gel as the control for equal protein loading. cP < 0.001. MitoCP: Mitochondria-targeted carboxy-proxyl; TPP: Triphenyl-phosphonium.
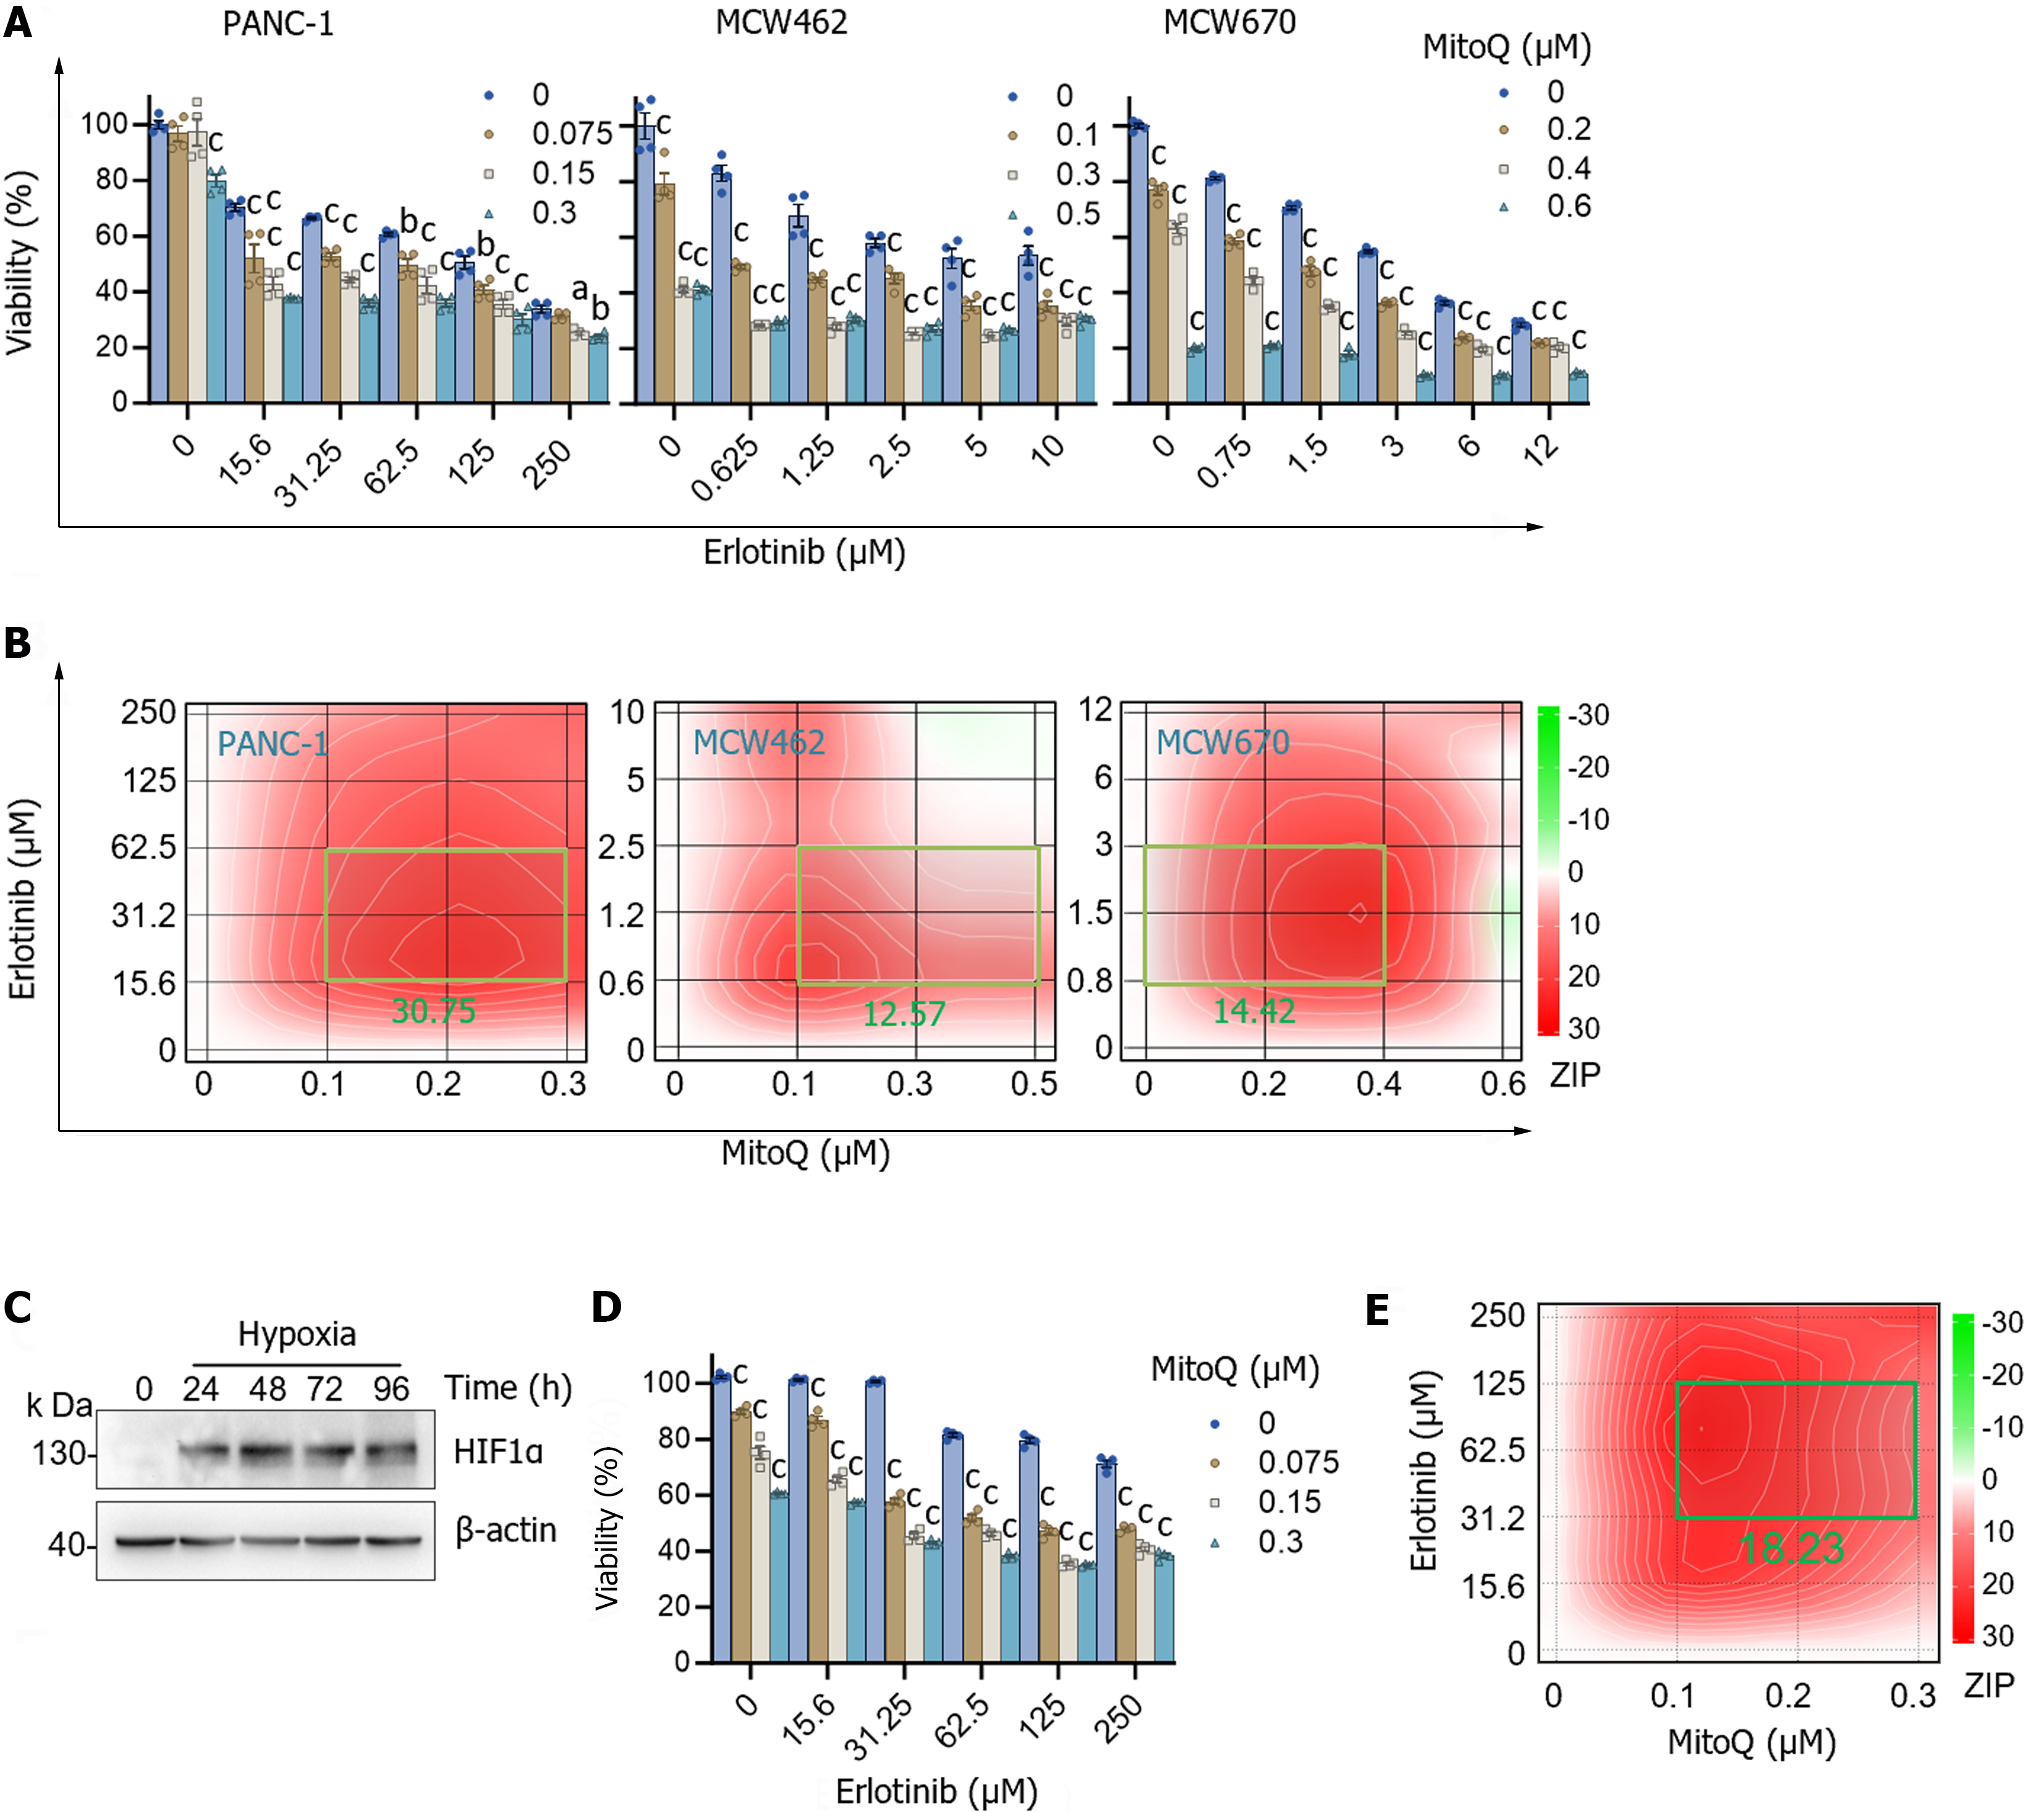
Figure 4 Erlotinib can synergize with mitochondria-targeted ubiquinone to suppress the viability of pancreatic adenocarcinoma cells.
A: Cells, pretreated with different concentrations of erlotinib, were treated with different doses of mitochondria-targeted ubiquinone (MitoQ) for 48 h prior to crystal violet viability assay. Data (mean ± SEM, n ≥ 3) are expressed as the percentage of untreated controls; B: SynergyFinder plotting of the viability data. The ZIP (zero interaction potency) scores are indicated for the most synergistic areas; C: Western blot analysis of PANC-1 cells maintained in the human plasma-like medium with 1% O2. β-actin is the control for equal protein loading; D: PANC-1 cells pretreated with erlotinib for 24 h were treated with MitoQ for 48 h in the human plasma-like medium with 1% O2 prior to crystal violet viability assay. Data (mean ± SEM, n ≥ 3) are expressed as the percentage of untreated controls; E: SynergyFinder plotting of the viability data. The ZIP score is indicated for the most synergistic area. aP < 0.05. bP < 0.005. cP < 0.001, Two-way ANOVA with Bonferroni post-tests. MitoQ: Mitochondria-targeted ubiquinone.
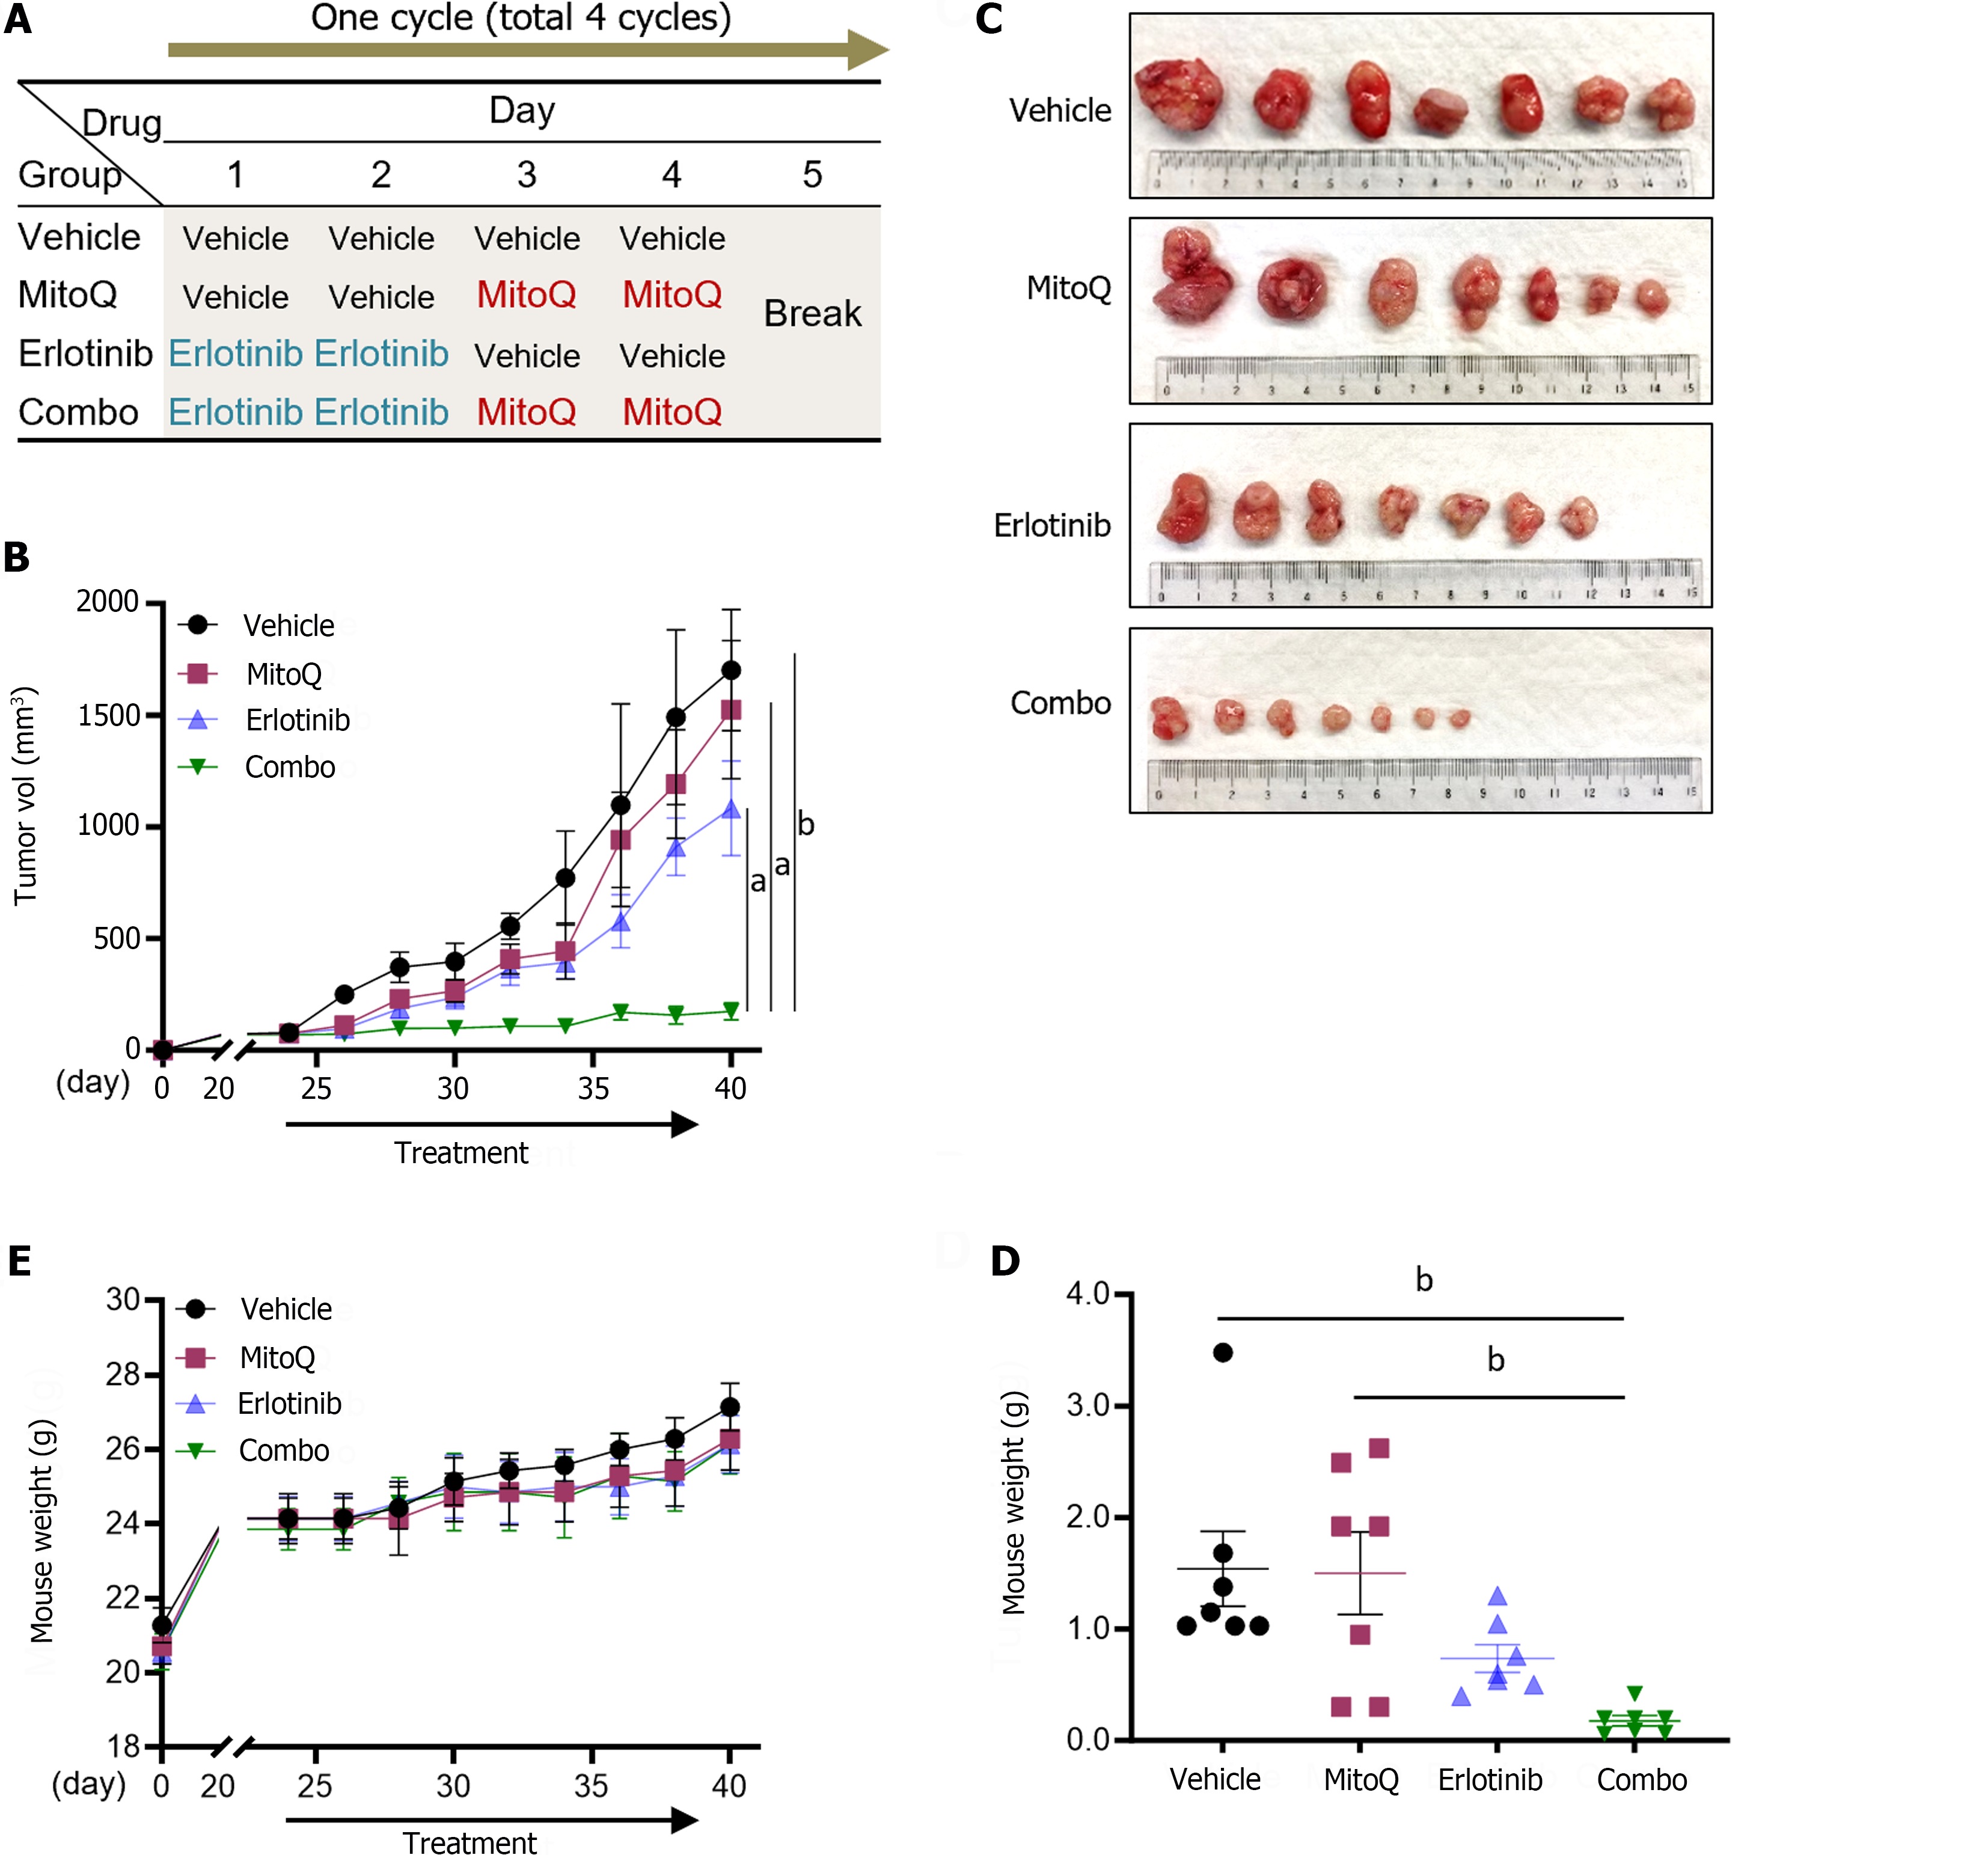
Figure 5 An erlotinib and mitochondria-targeted ubiquinone combination effectively suppresses PANC-1 xenografts in mice.
A: Treatment schedule. Detailed information is provided in Materials and Method; B: Changes in tumor size (mean ± SEM, N = 7). Two-way ANOVA with Bonferroni post-tests; C: Images of tumors collected at the end of treatment; D: Weights of tumors; E: Body weight changes (mean ± SEM, N = 7) monitored during the treatment. aP < 0.05. bP < 0.005. MitoQ: Mitochondria-targeted ubiquinone.
- Citation: Leung PY, Chen W, Sari AN, Sitaram P, Wu PK, Tsai S, Park JI. Erlotinib combination with a mitochondria-targeted ubiquinone effectively suppresses pancreatic cancer cell survival. World J Gastroenterol 2024; 30(7): 714-727
- URL: https://www.wjgnet.com/1007-9327/full/v30/i7/714.htm
- DOI: https://dx.doi.org/10.3748/wjg.v30.i7.714


