Copyright
©The Author(s) 2024.
World J Gastroenterol. Feb 14, 2024; 30(6): 542-555
Published online Feb 14, 2024. doi: 10.3748/wjg.v30.i6.542
Published online Feb 14, 2024. doi: 10.3748/wjg.v30.i6.542
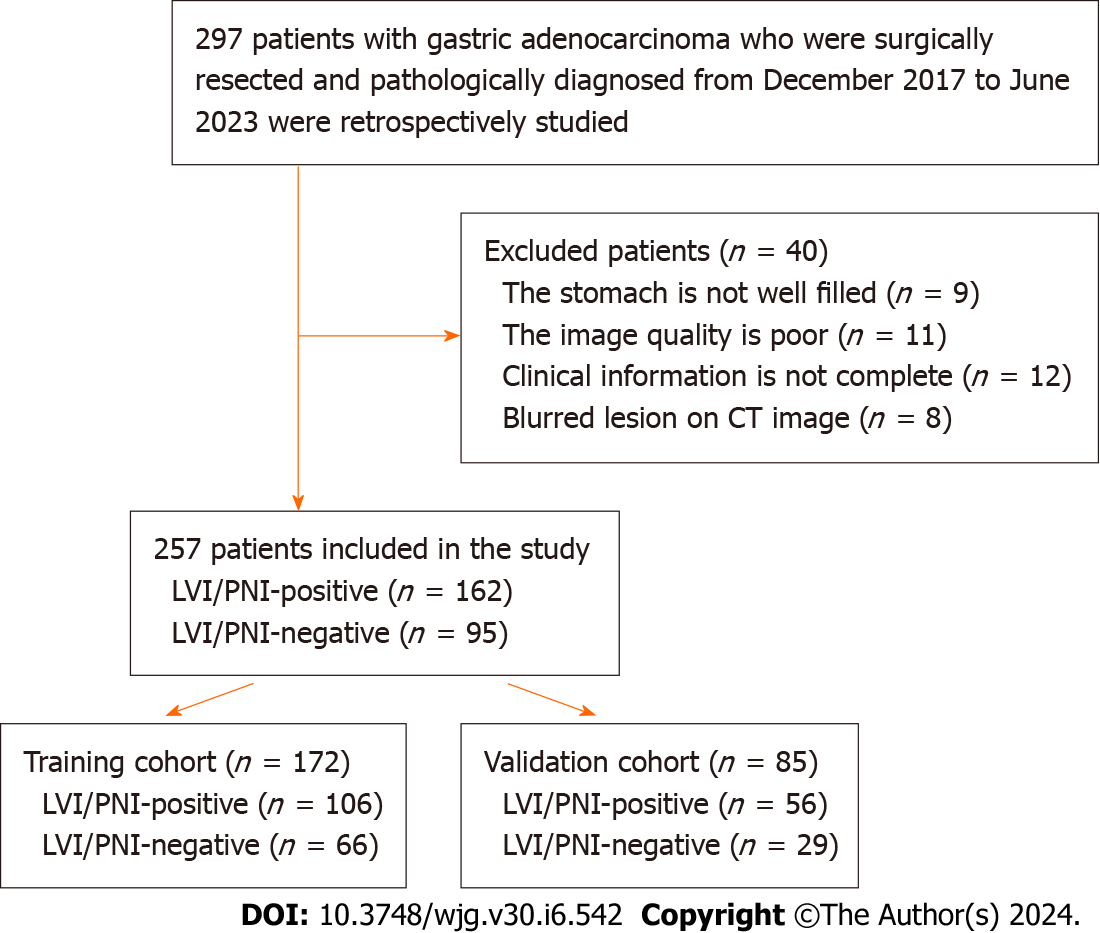
Figure 1 Flowchart of the inclusion and exclusion criteria.
LVI: Lymphovascular invasion; PNI: Perineural invasion; CT: Computed tomography.
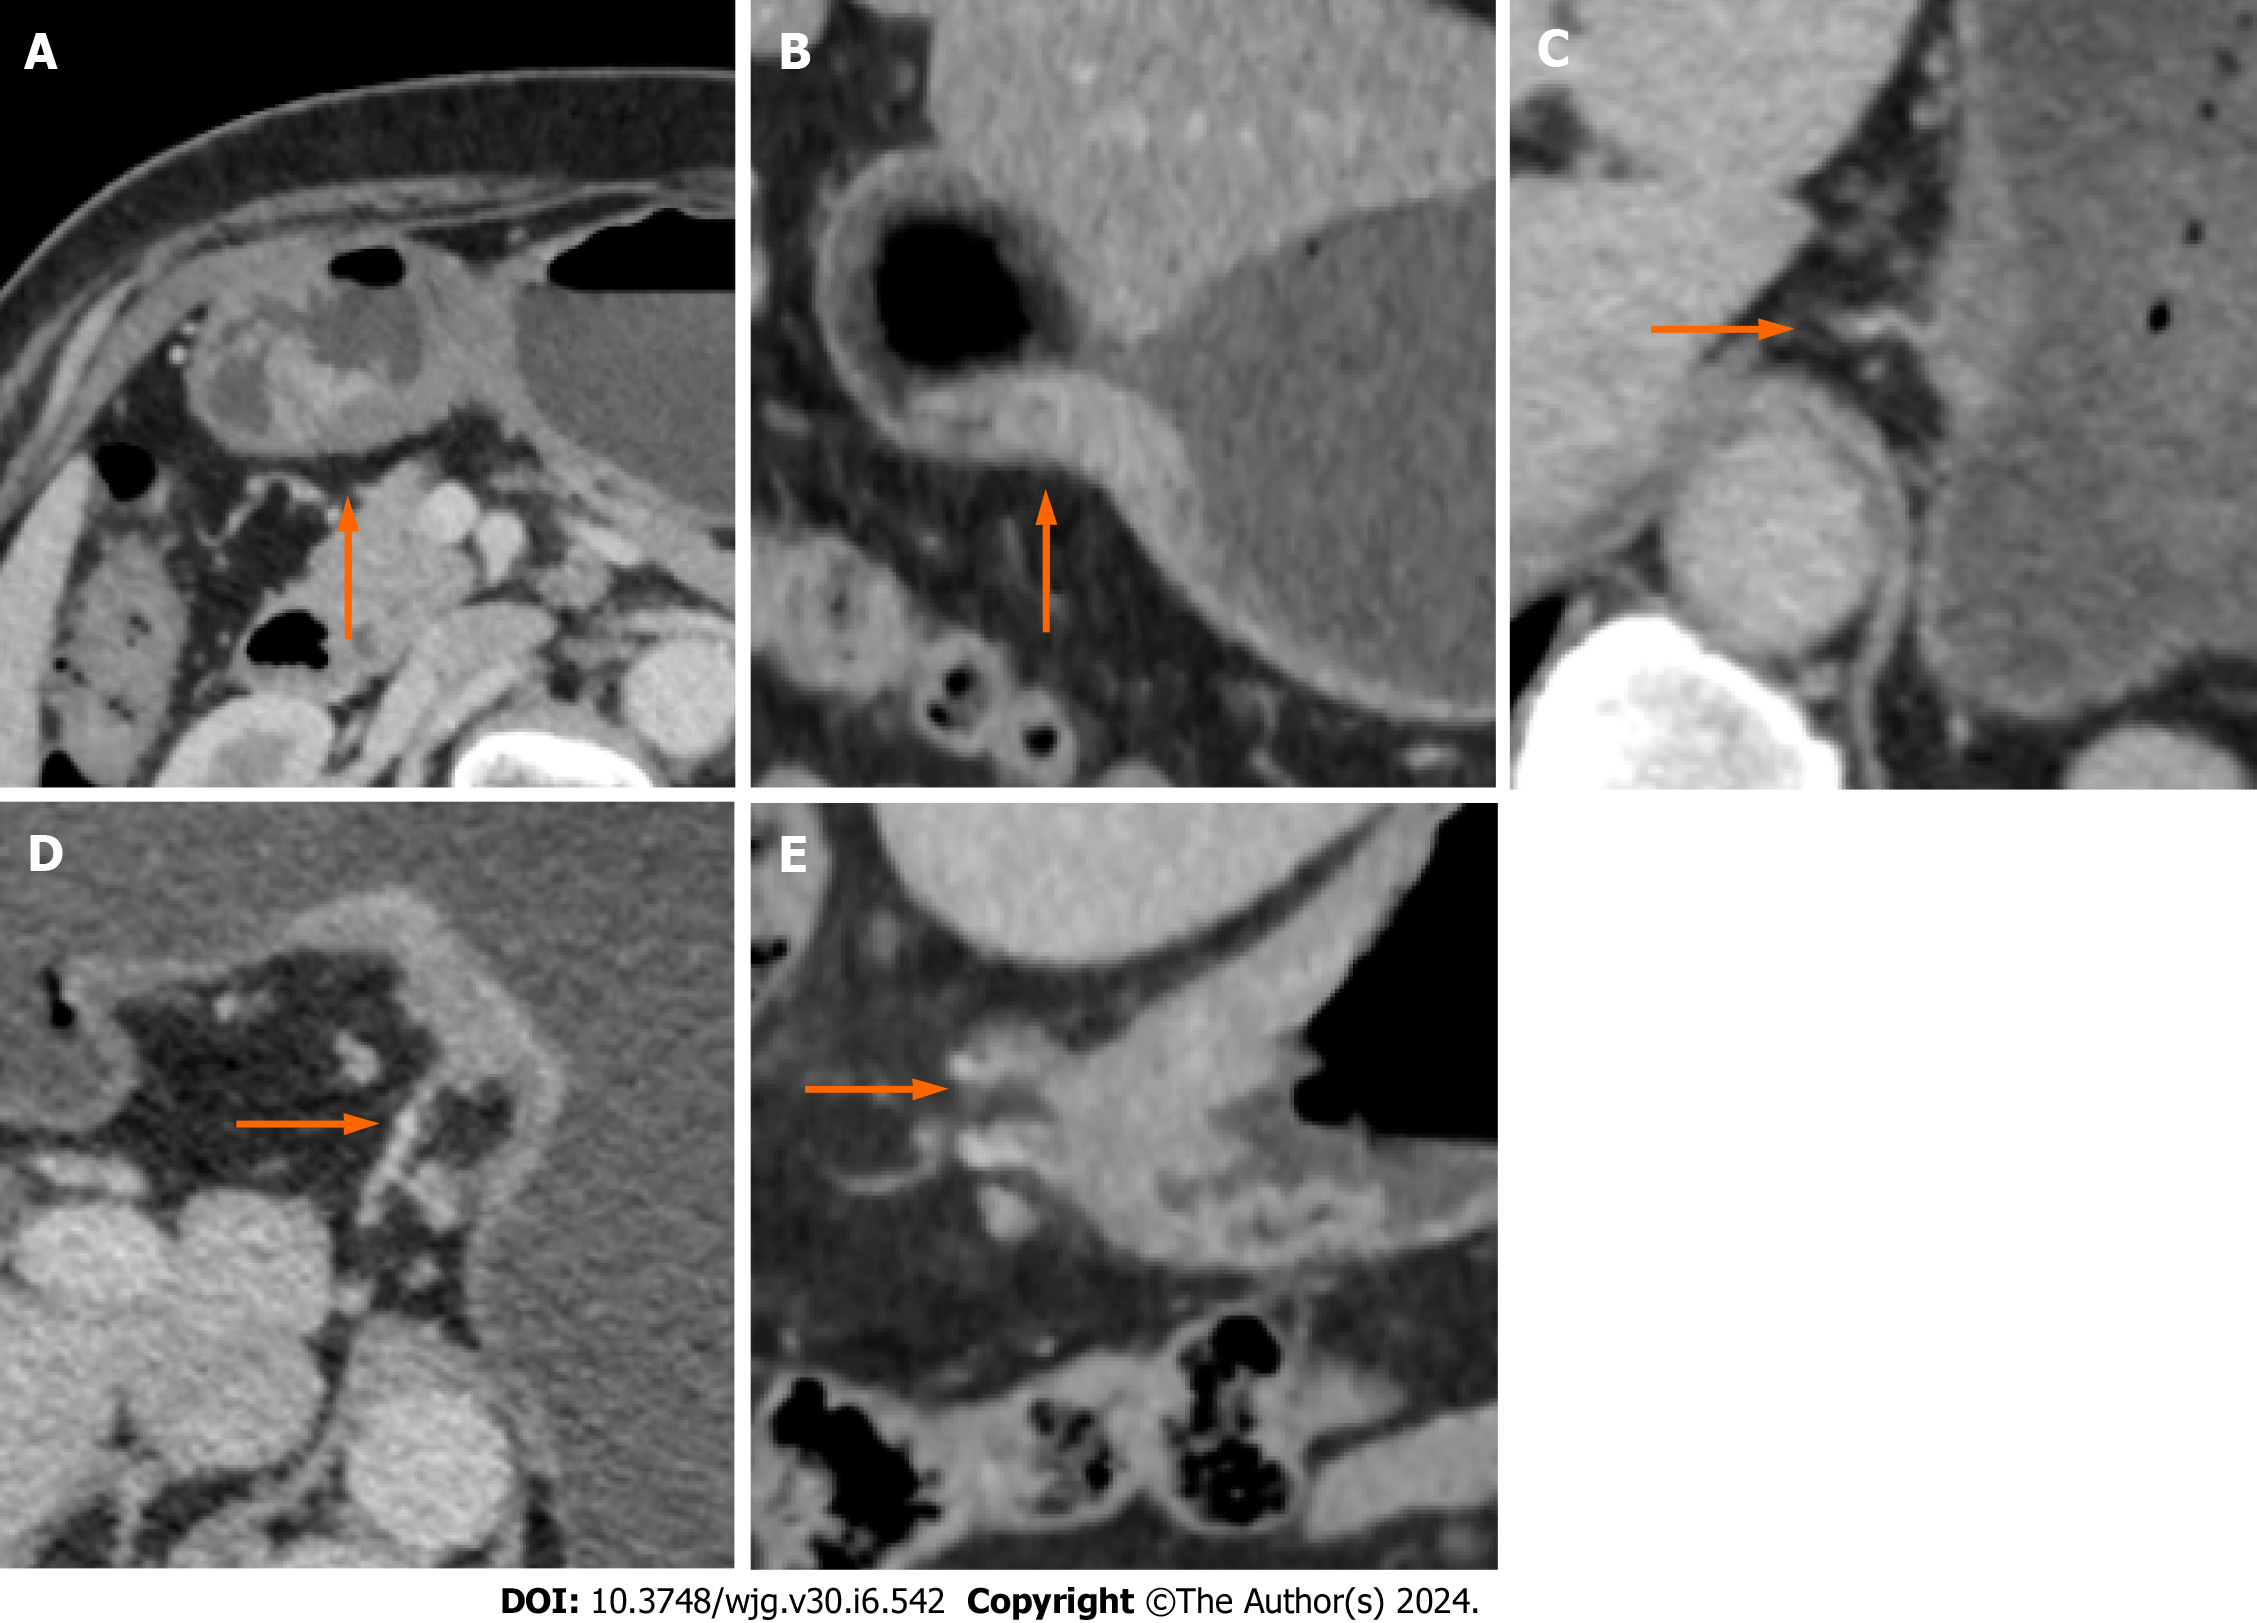
Figure 2 Example of a computed tomography-detected extramural vein invasion score on computed tomography images of gastric cancer patients.
A: Score 0: The tumor has not penetrated the gastric wall, and there are no extramural vessels beside the lesion (arrow) in the transverse position of the venous phase (VP); B: Score 1: The transverse view of the VP shows that the tumor has permeated the gastric wall, and there are no extramural vessels beside the lesion (arrow); C: Score 2: In the VP, the coronal lesion has penetrated the gastric wall, and there are tortuous blood vessels connected with the lesion (arrow), but no tumor density shadow is observed in the vascular lumen; D: Score 3: The transverse view of the VP shows that the mass has penetrated through the gastric wall, the involved blood vessels appear slightly tortuous and dilated, and the tumor density shadow is visible (arrow); E: Score 4: In the coronary view of the VP, the tumor permeated the gastric wall, the extramural vascular lumen was significantly dilated, and a slight low-density filling defect was visible inside (arrow).
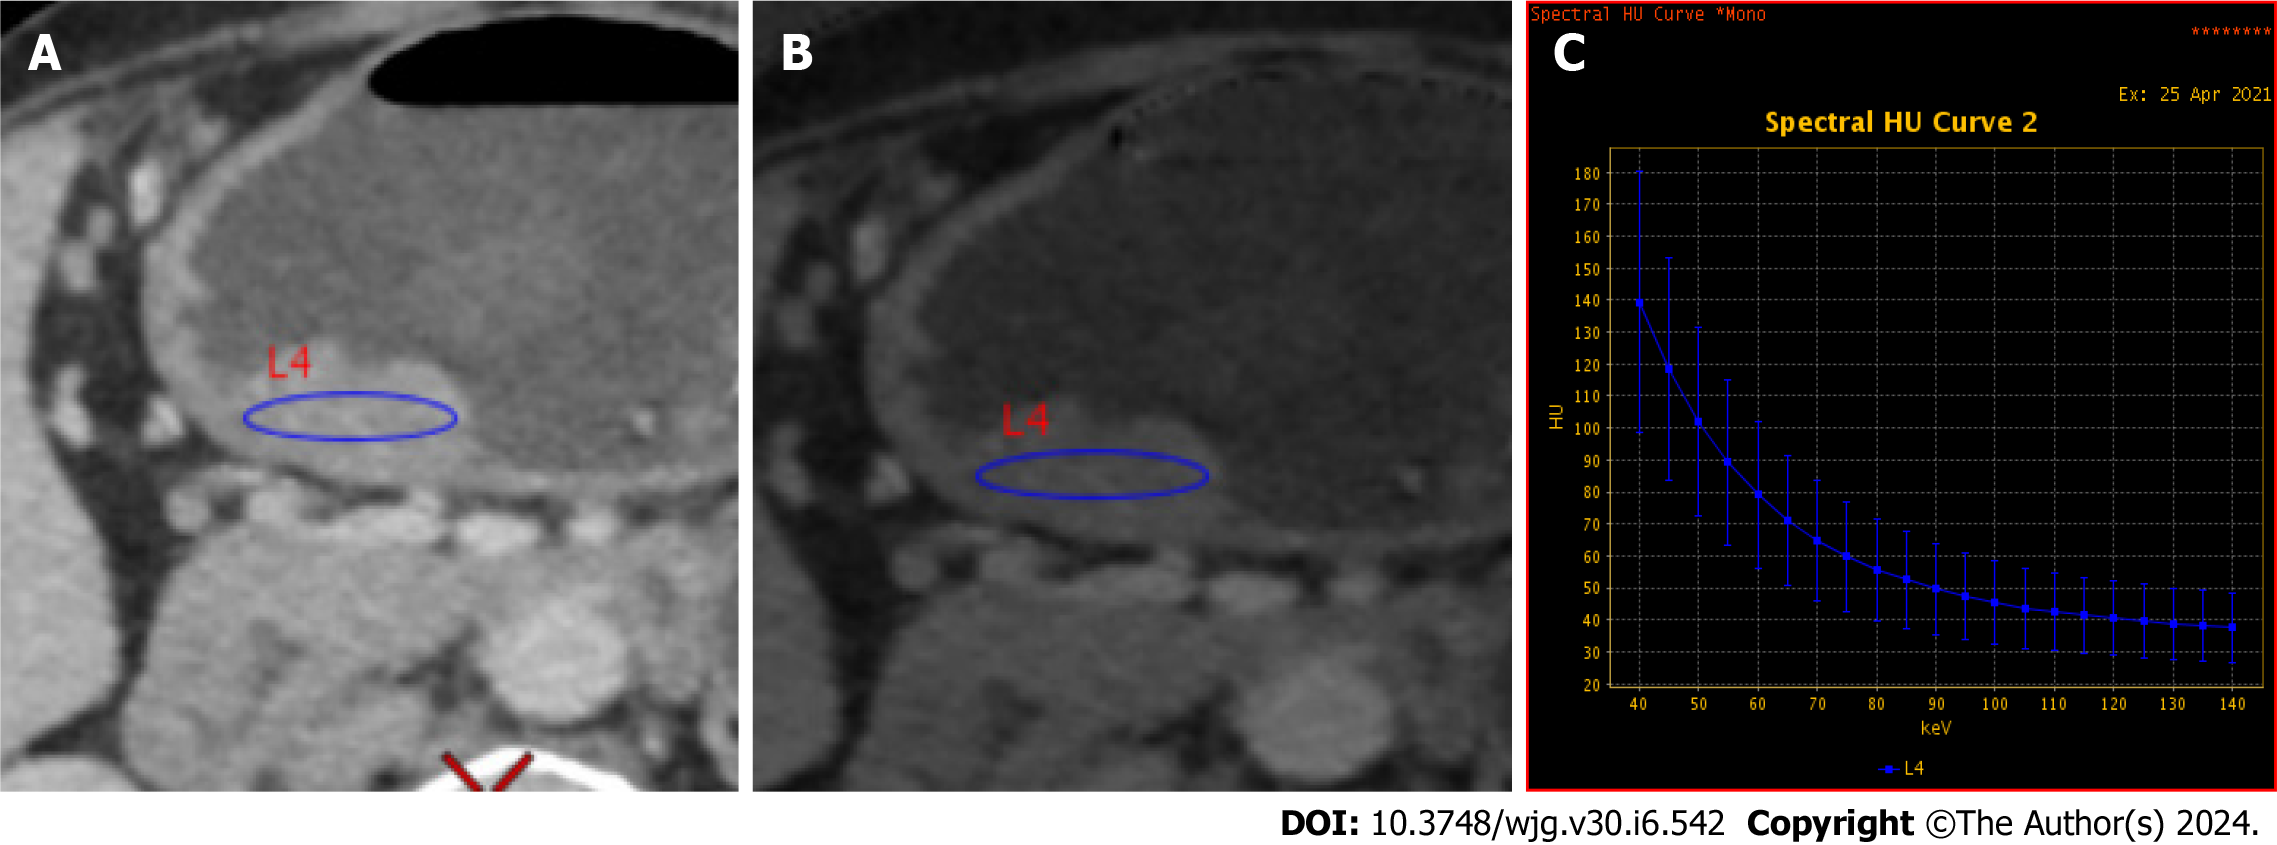
Figure 3 Example of the energy spectrum data measurement.
A: 70 keV single-energy image; B: The iodine base image; C: The energy spectrum curve. Elliptical regions of interests were drawn at the largest level of the lesion in the lesser curvature of the gastric horn, as shown in A and B.
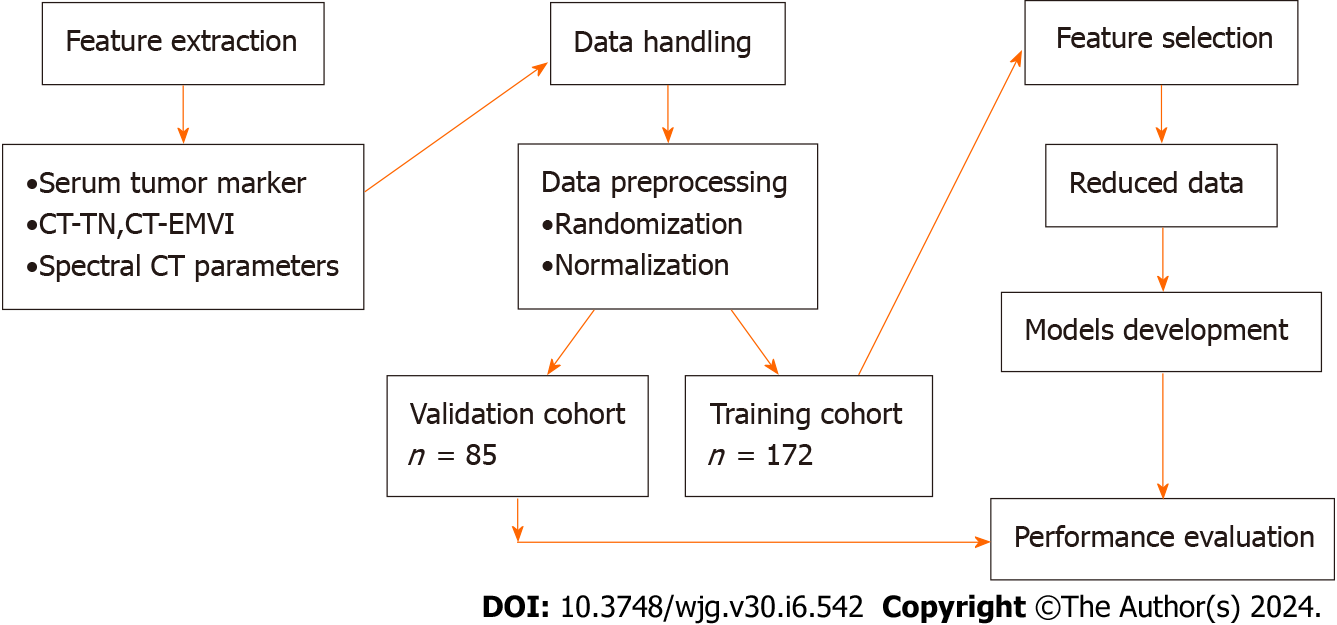
Figure 4 Technical study pipeline.
CT-EMVI: Computed tomography-detected extramural vein invasion; CT: Computed tomography.
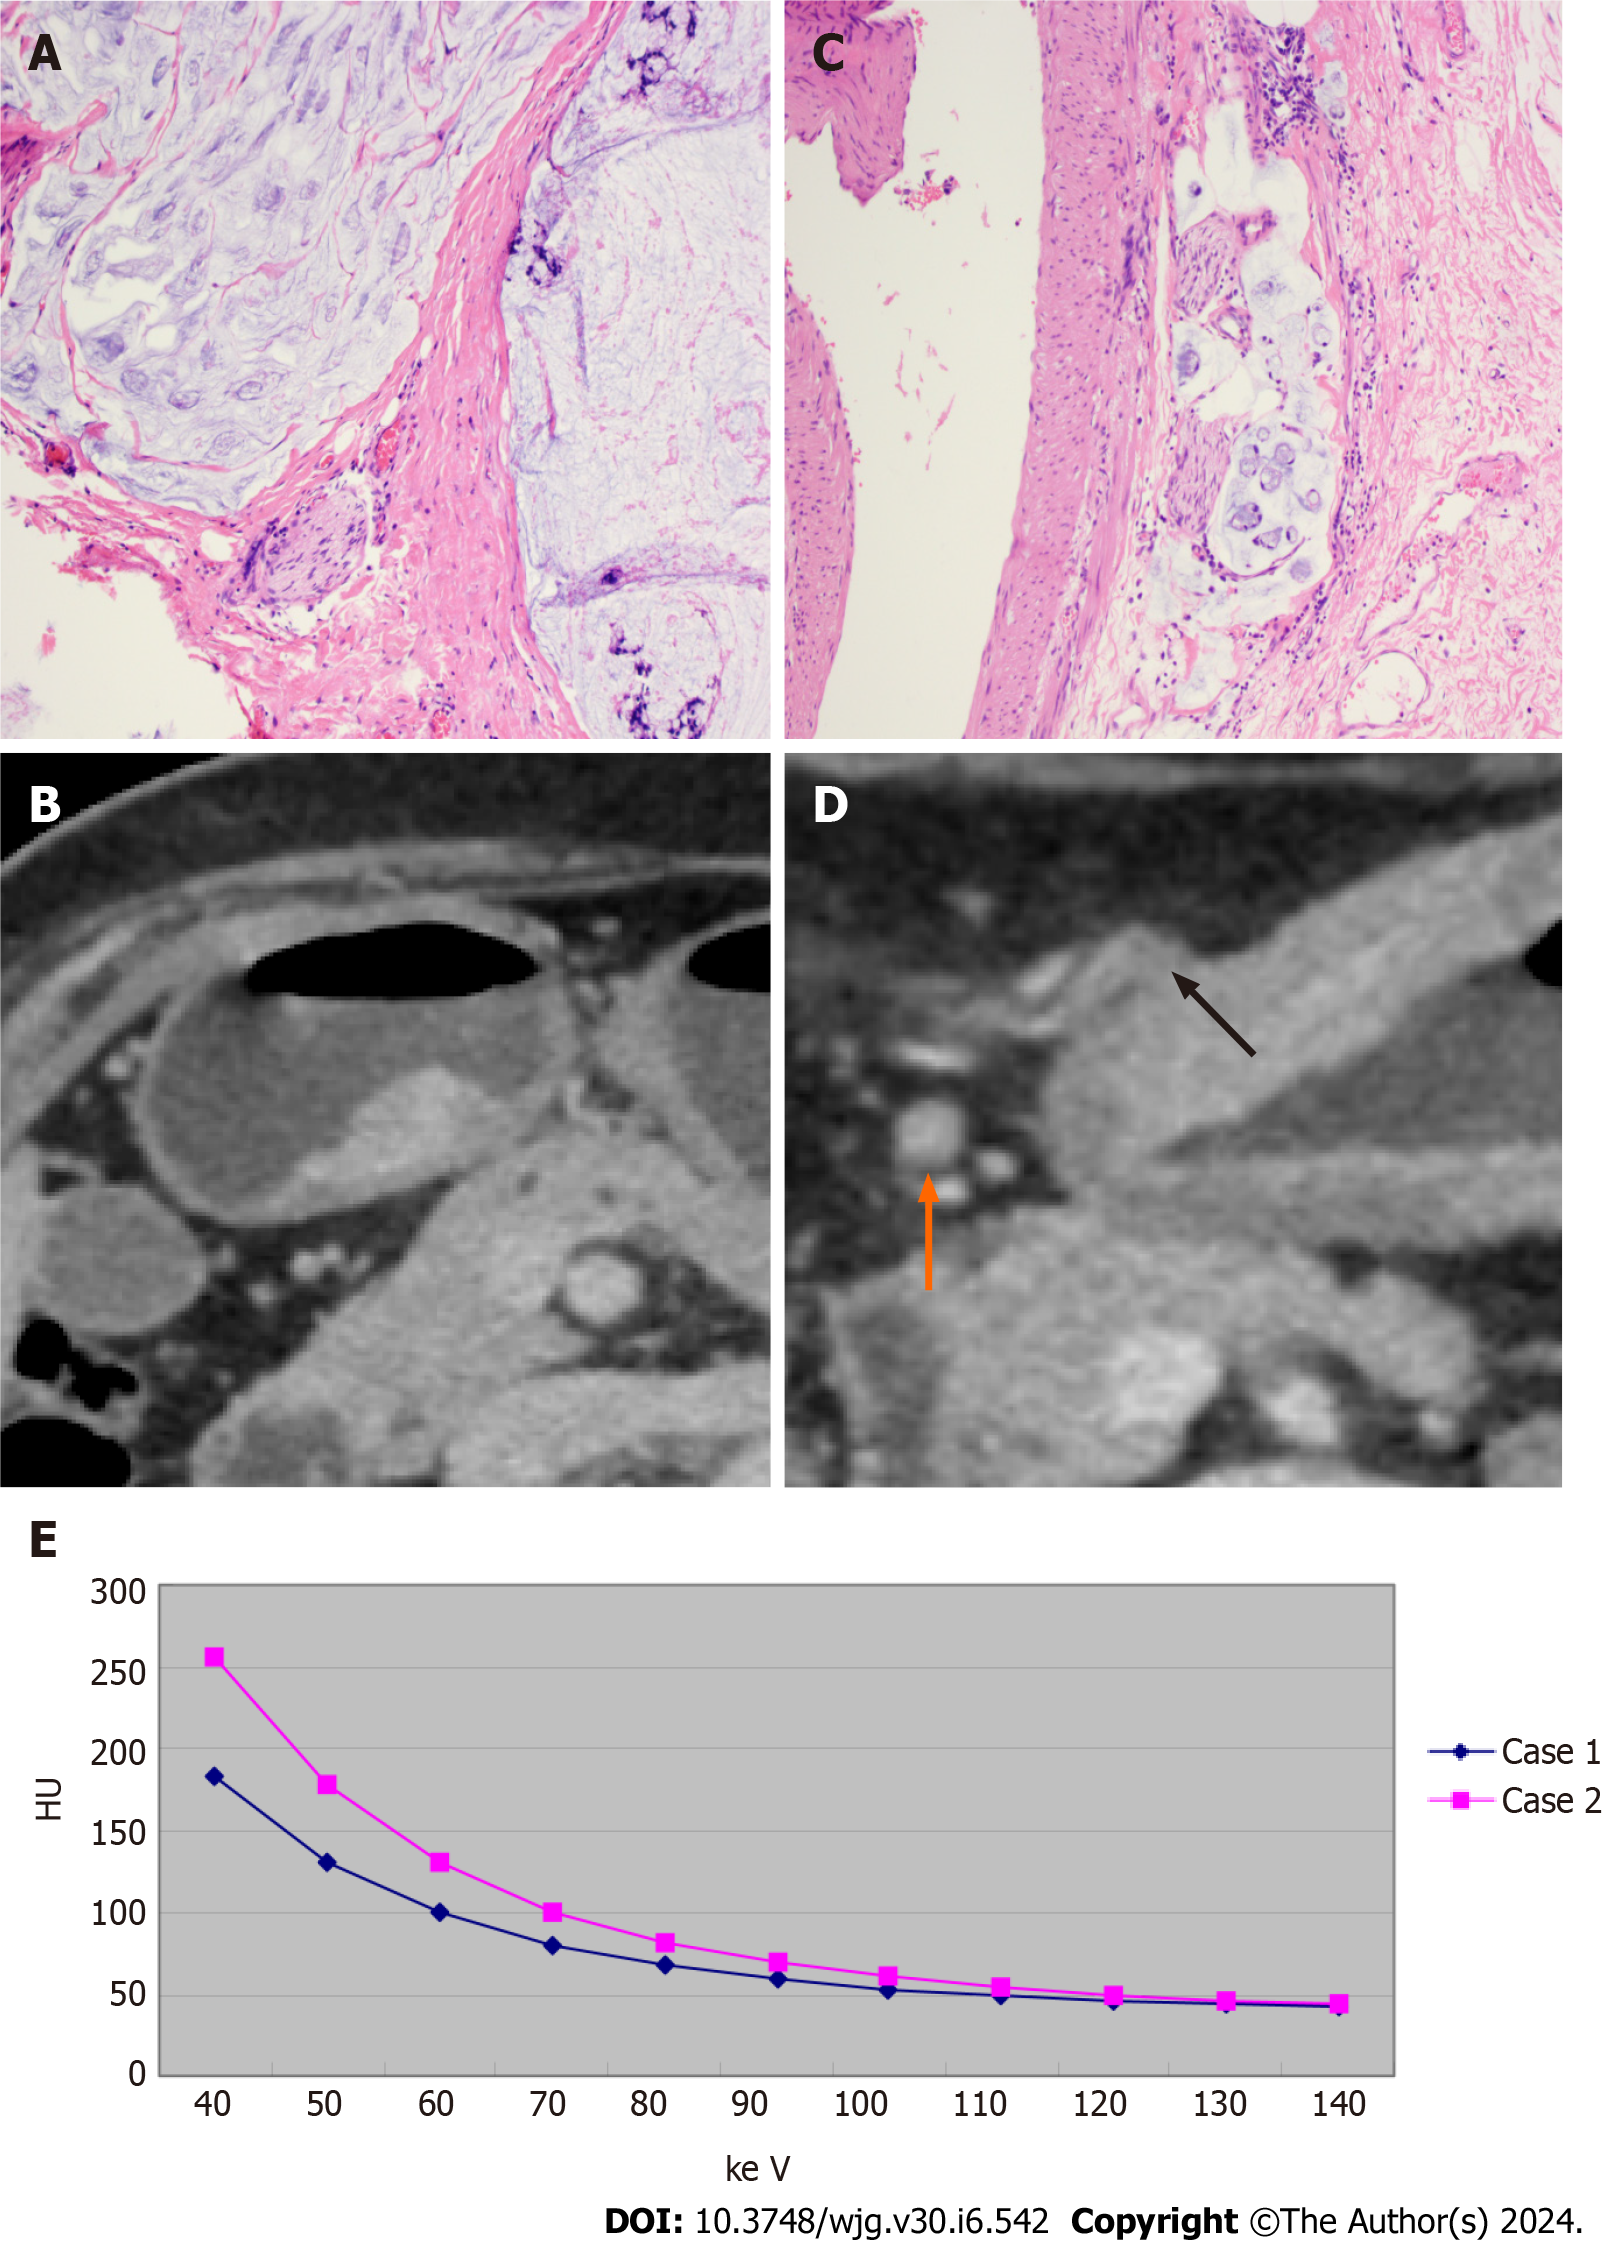
Figure 5 Comparative imaging and spectral analysis of pathological gastric adenocarcinoma in two patients with different lympho
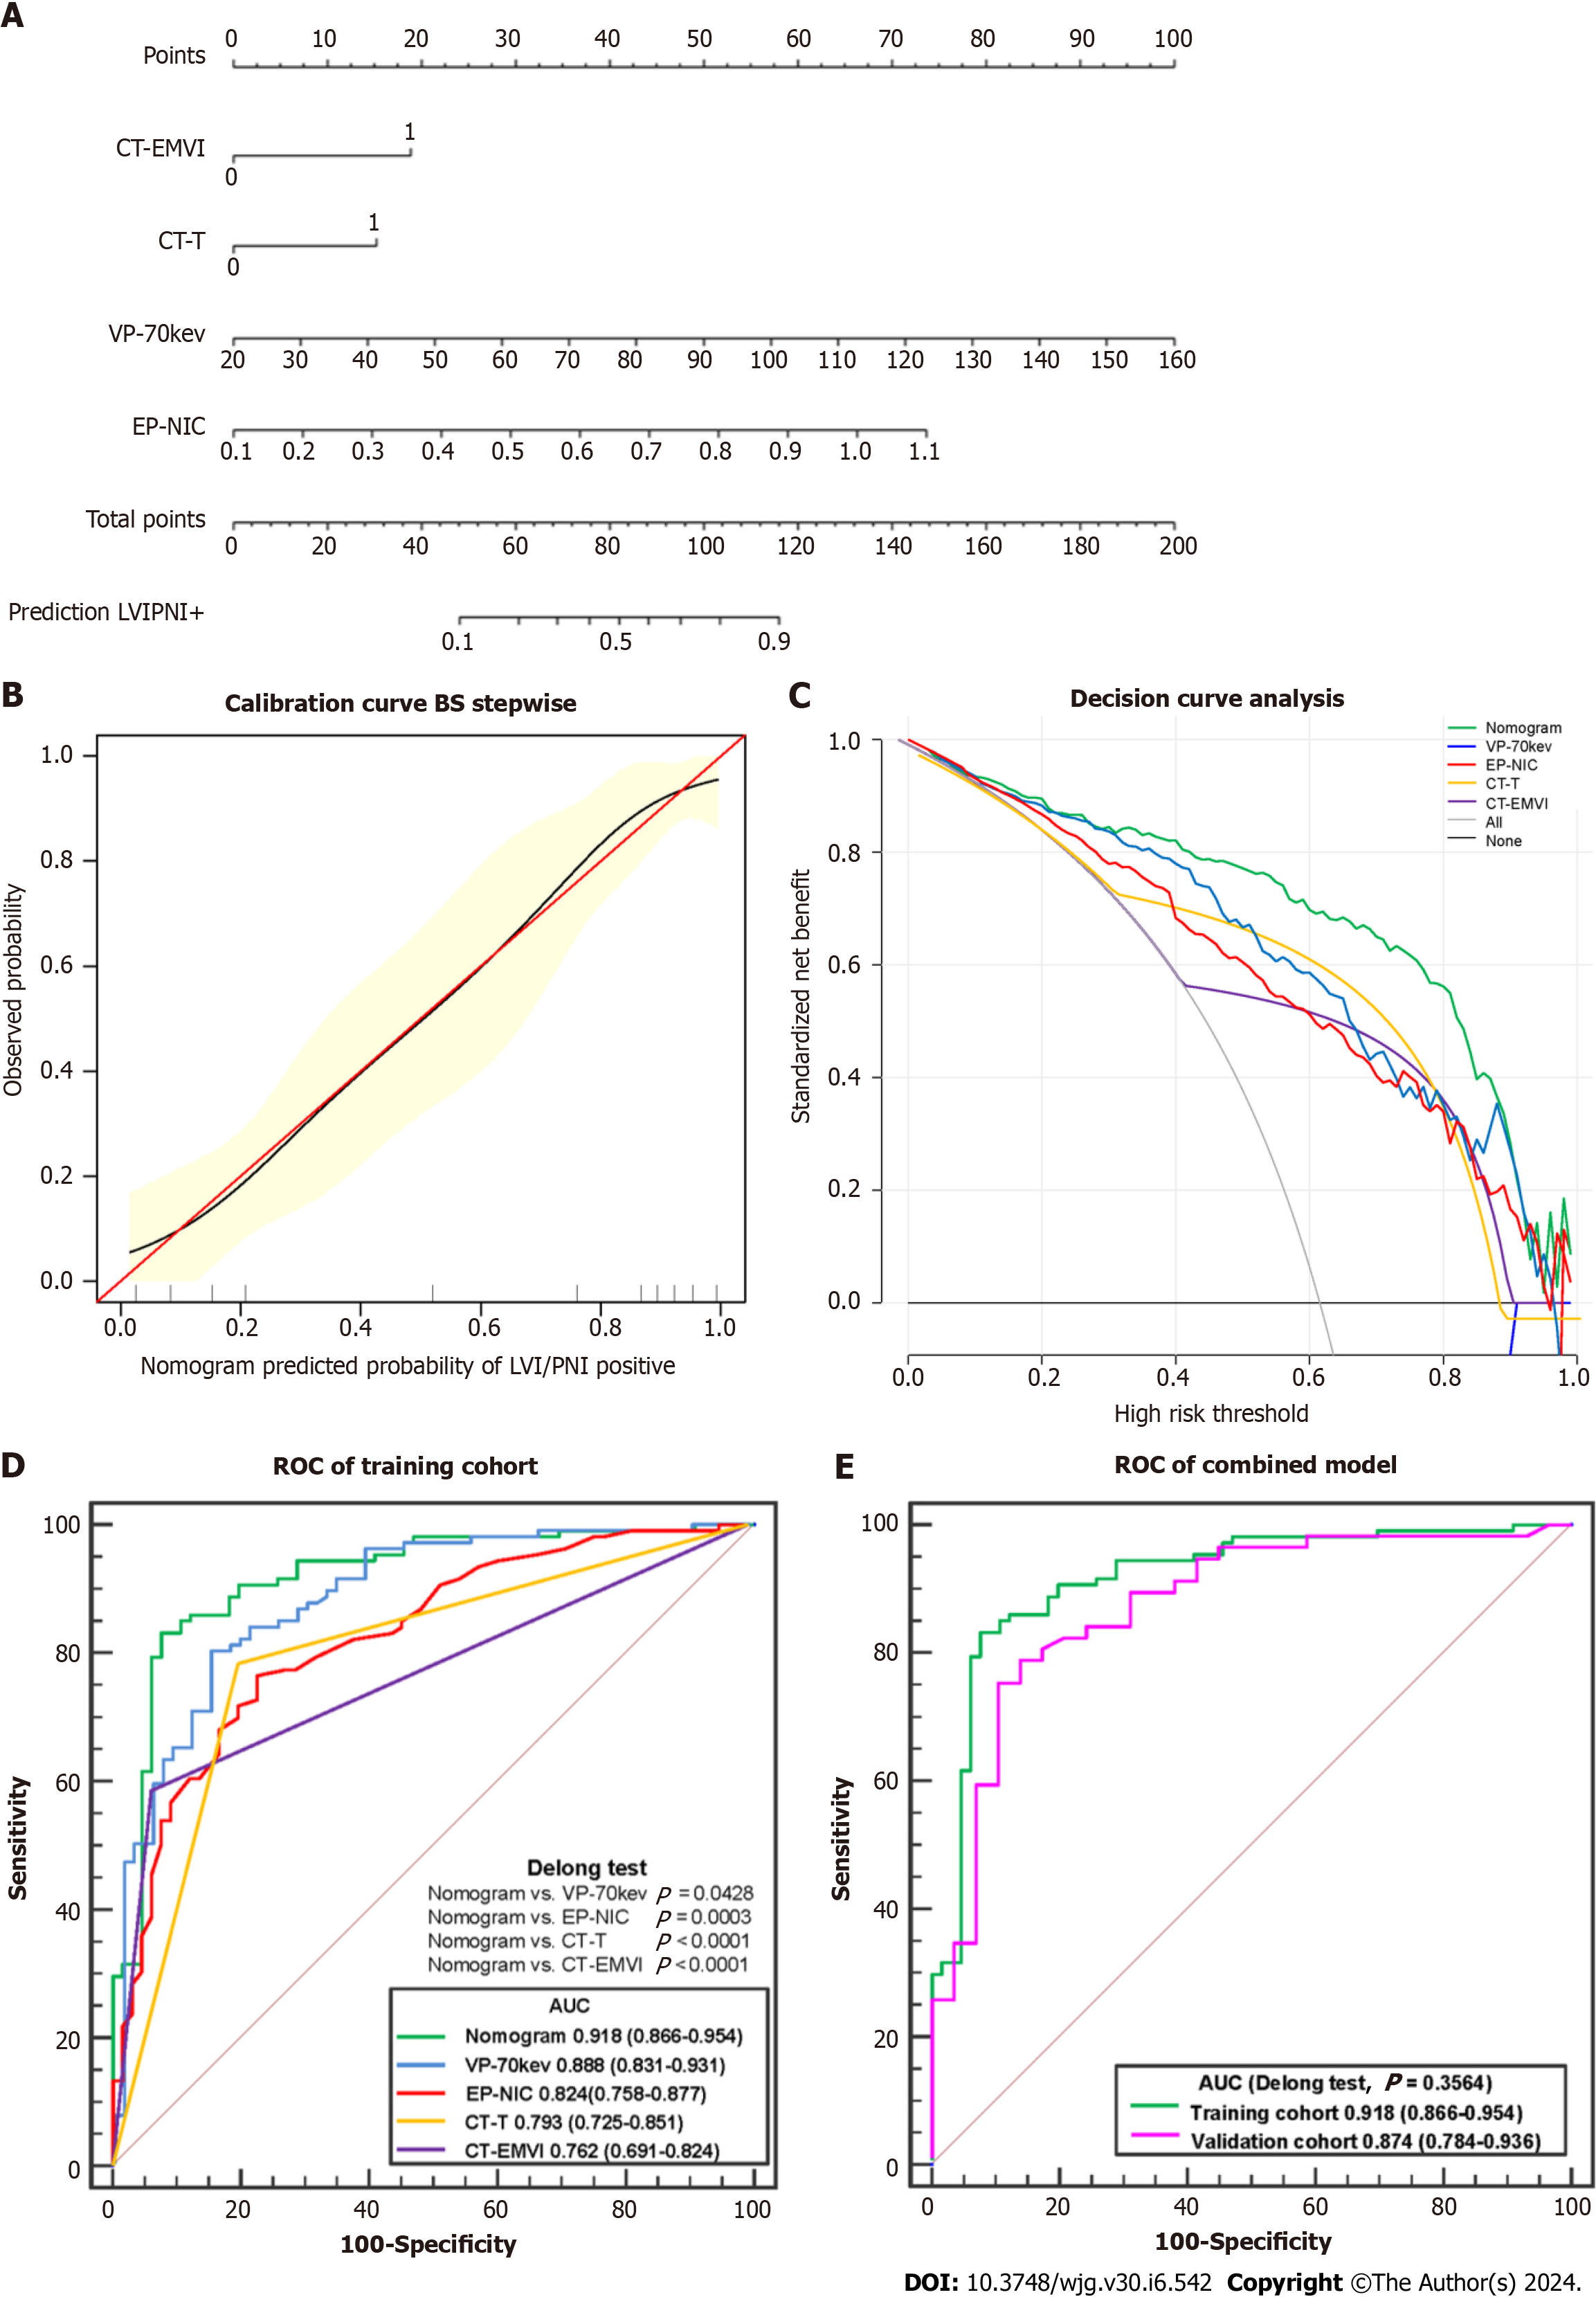
Figure 6 Comprehensive analysis of predictive models.
A: Individual nomogram; B: Calibration curve; C: Decision curve analysis of the training cohort; D: Receiver operating characteristic (ROC) curves of the application of the nomogram, VP-70 keV, EP-NIC, CT-T and CT-EMVI to the training cohort. The DeLong test showed that the differences were significant between the nomogram and each single independent factor; E: ROC curve of the application of the nomogram to the training cohort and the validation cohort. CT-EMVI: Computed tomography-detected extramural vein invasion; VP-70 keV: Single-energy computed tomography value of 70 keV in the venous phase; EP-NIC: Ratio of the standardized iodine concentration in the equilibrium phase; ROC: Receiver operating characteristic; AUC: Area under the receiver operating characteristic curve.
- Citation: Ge HT, Chen JW, Wang LL, Zou TX, Zheng B, Liu YF, Xue YJ, Lin WW. Preoperative prediction of lymphovascular and perineural invasion in gastric cancer using spectral computed tomography imaging and machine learning. World J Gastroenterol 2024; 30(6): 542-555
- URL: https://www.wjgnet.com/1007-9327/full/v30/i6/542.htm
- DOI: https://dx.doi.org/10.3748/wjg.v30.i6.542


