Copyright
©The Author(s) 2024.
World J Gastroenterol. Feb 7, 2024; 30(5): 485-498
Published online Feb 7, 2024. doi: 10.3748/wjg.v30.i5.485
Published online Feb 7, 2024. doi: 10.3748/wjg.v30.i5.485
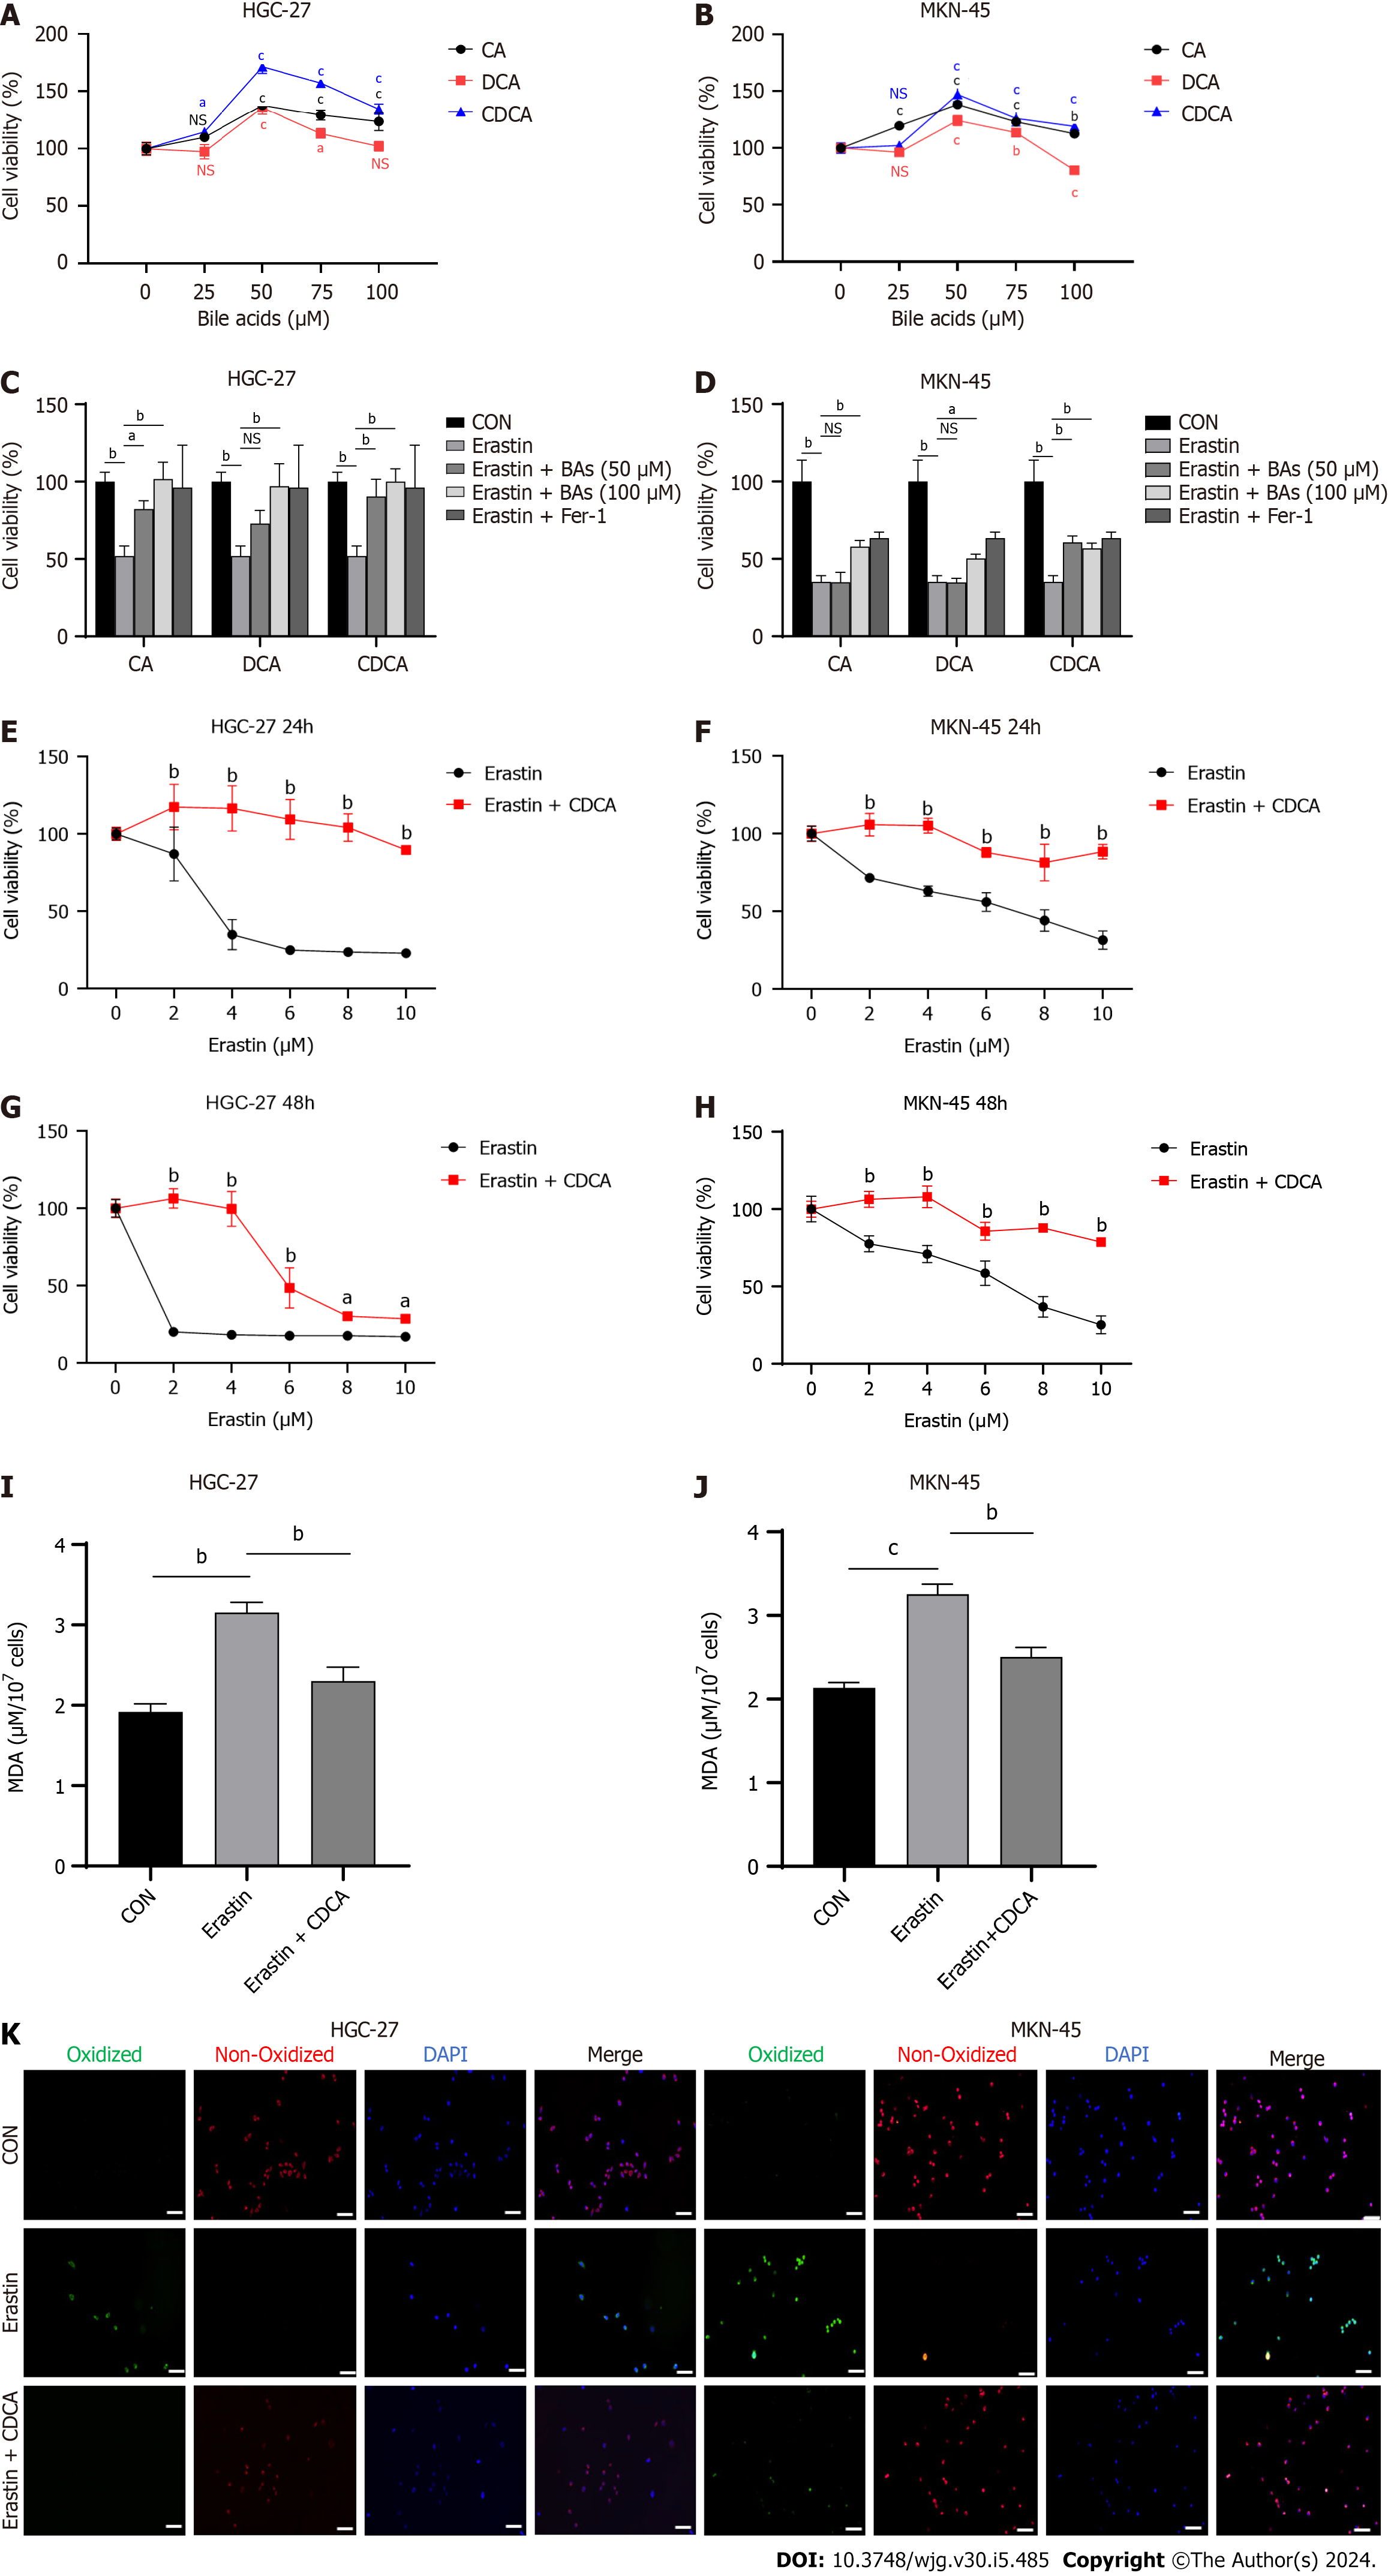
Figure 1 Bile acids enhanced proliferation and inhibited erastin-induced ferroptosis sensitivity in gastric cancer cells.
A and B: Cell viability assay for HGC-27 and MKN-45 cells treated with three Bas; C and D: Cell viability assay for HGC-27 and MKN-45 cells treated with different concentration of BAs together with erastin (5 μM); E-H: Cell viability assay for two gastric cancer cell lines stimulated with erastin followed by chenodeoxycholic acid (50 μM) or control for 24 and 48 h; I and J: Malondialdehyde production in HGC-27 and MKN-45 cells; K: BODIPY-589/591 C11 staining to identify lipid reactive oxygen species in the cell lines under different treatments. Scale bar: 100 μm. aP < 0.05, bP < 0.01, cP < 0.001. These experiments were repeated three times. BAs: Bile acids; CA: Cholic acid; DCA: Dehydrocholic acid; CDCA: Chenodeoxycholic acid; MDA: Malondialdehyde; NS: Not significant.
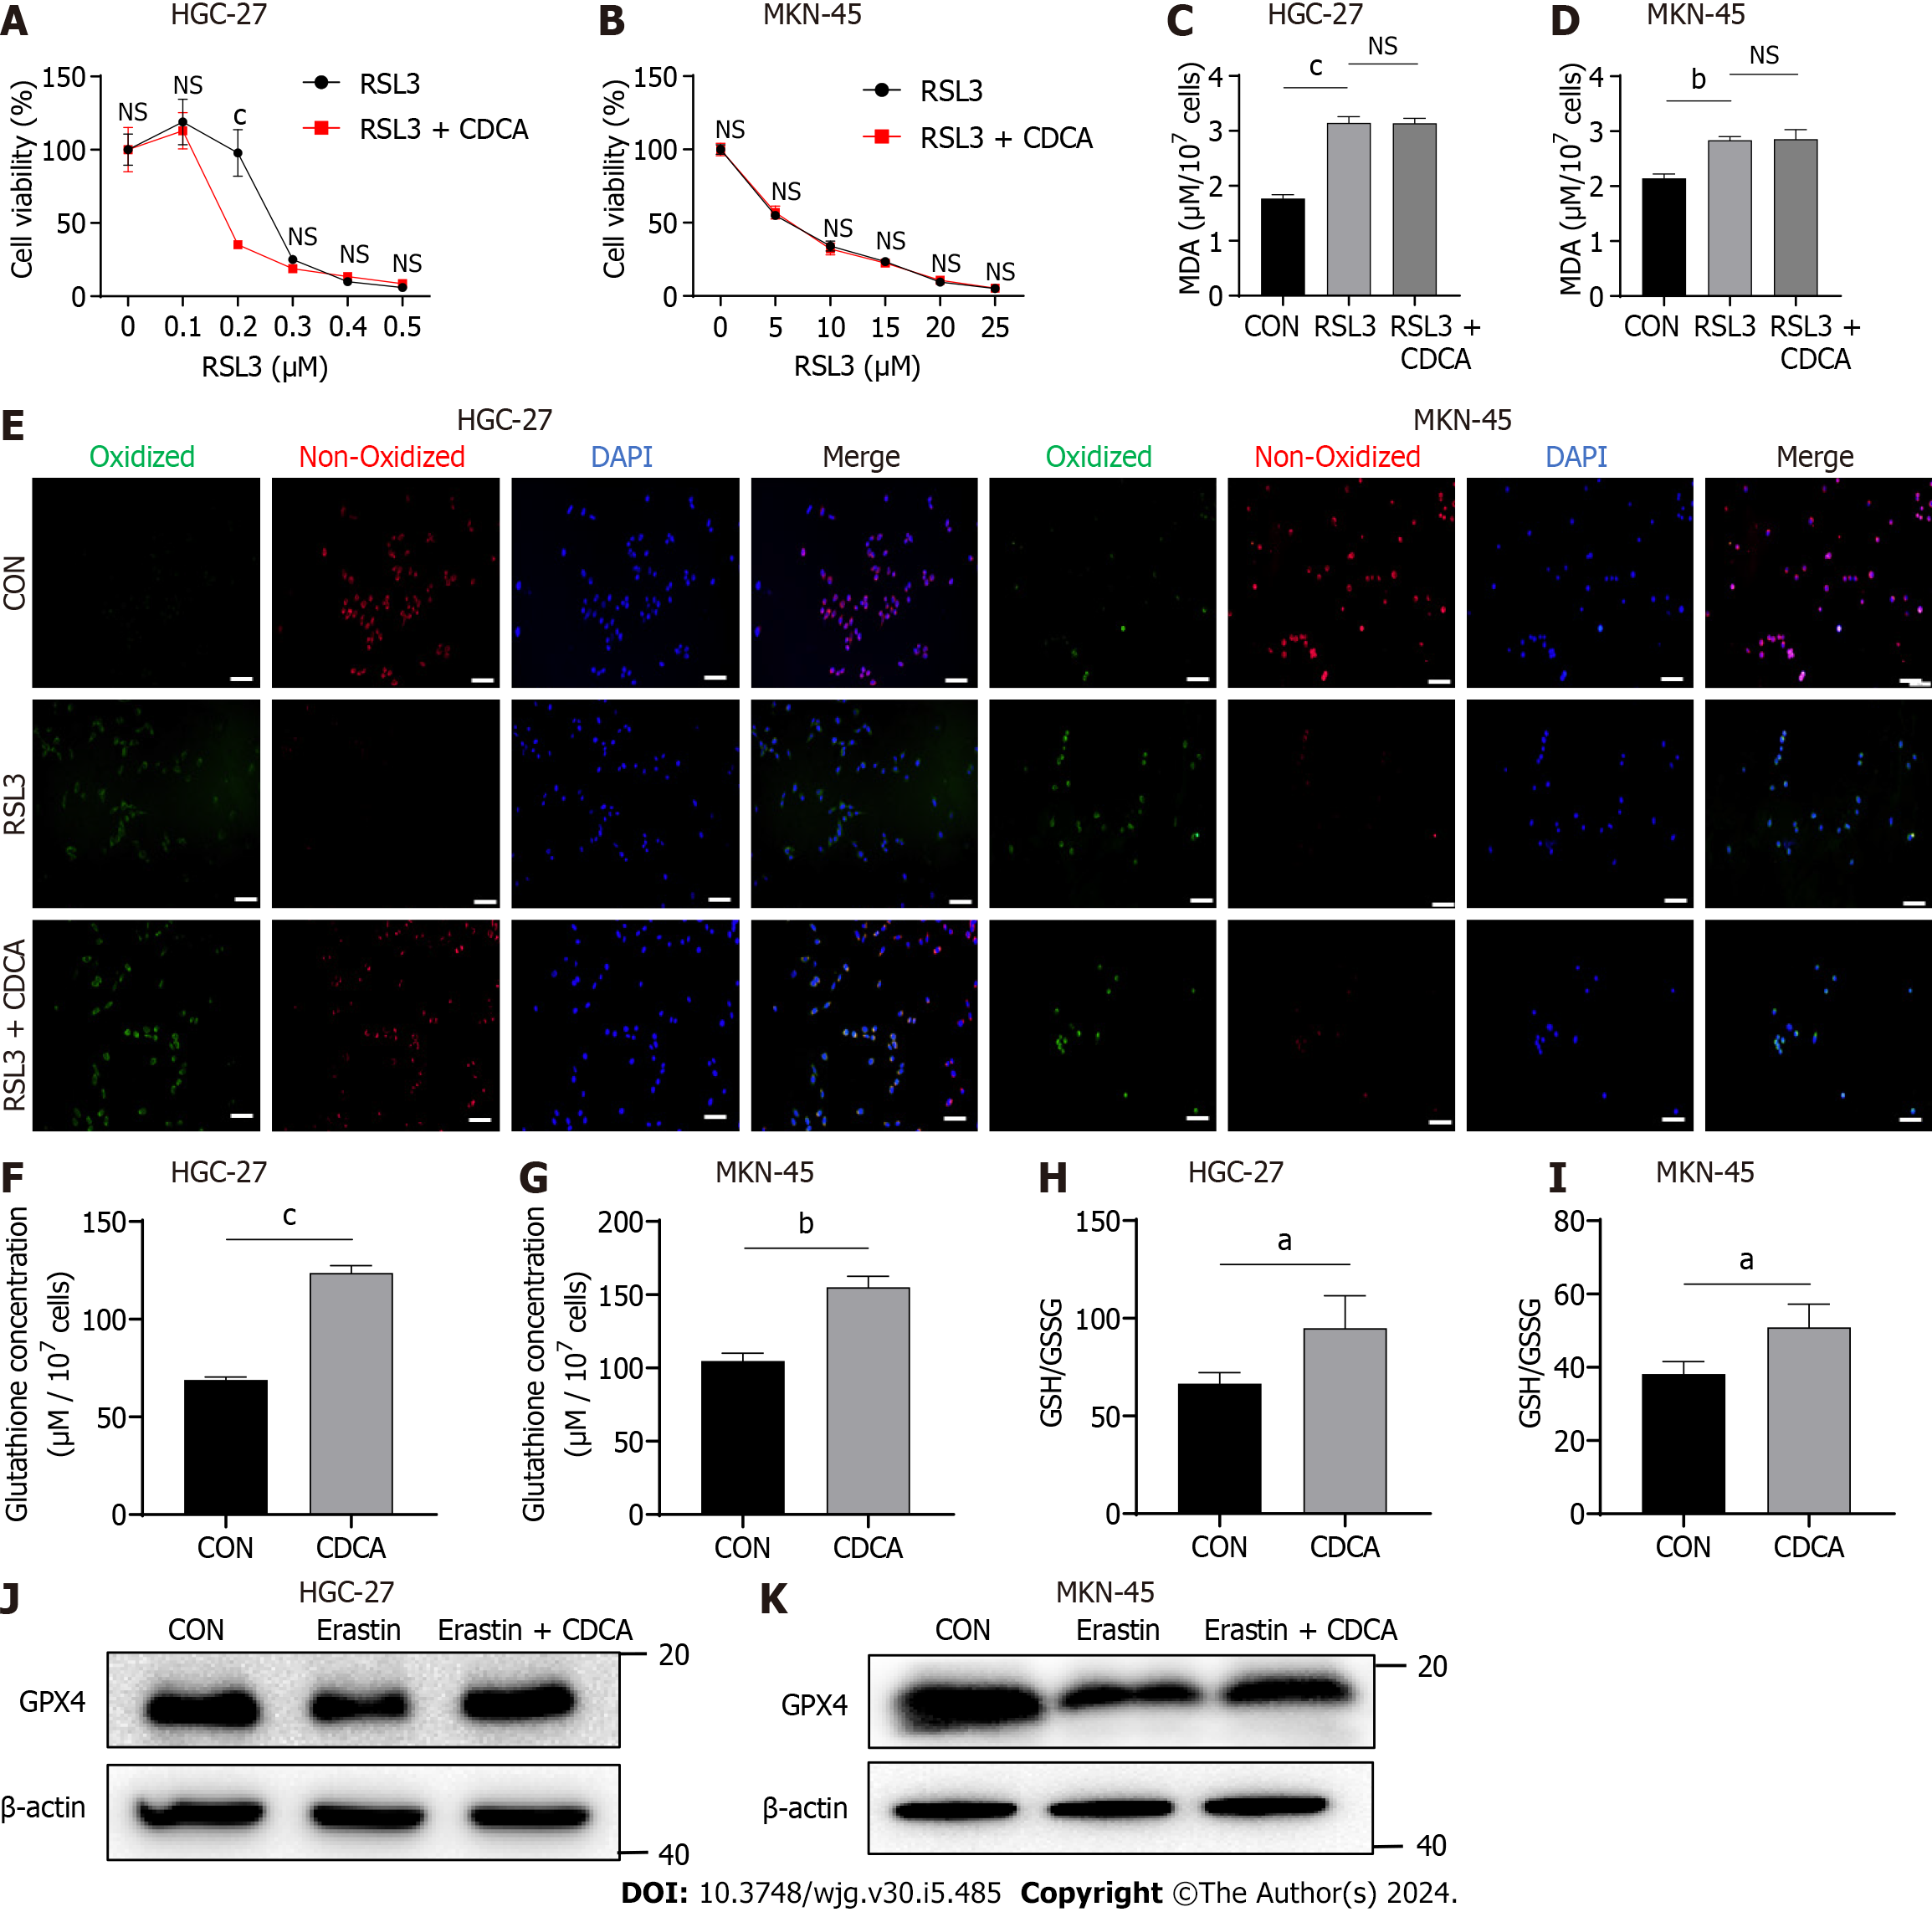
Figure 2 Bile acids significantly upregulated glutathione and glutathione peroxidase 4 in gastric cancer cells.
A and B: Cell viability assay of two gastric cancer cell lines treated with RSL3 together with chenodeoxycholic acid (CDCA) or control; C and D: Malondialdehyde production in HGC-27 and MKN-45 cells treated with RSL3 (0.2 μM for HGC-27, 10 μM for MKN-45) followed by CDCA or control; E: BODIPY-589/591 C11 staining to identify lipid reactive oxygen species in the cell lines treated with RSL3 (0.2 μM for HGC-27, 10 μM for MKN-45) followed by CDCA or control; F and G: The glutathione (GSH) concentrations were measured in cells treated with CDCA; H and I: The GSH/oxidized GSH ratio was measured in cells treated with CDCA; J and K: Western blot analysis of GSH peroxidase 4 protein expression in HGC-27 and MKN-45 cells under different stimuli. Scale bar: 100 μm. aP < 0.05, bP < 0.01, cP < 0.001. These experiments were repeated three times. CDCA: Chenodeoxycholic acid; MDA: Malondialdehyde; GPX4: Glutathione peroxidase 4; NS: Not significant.
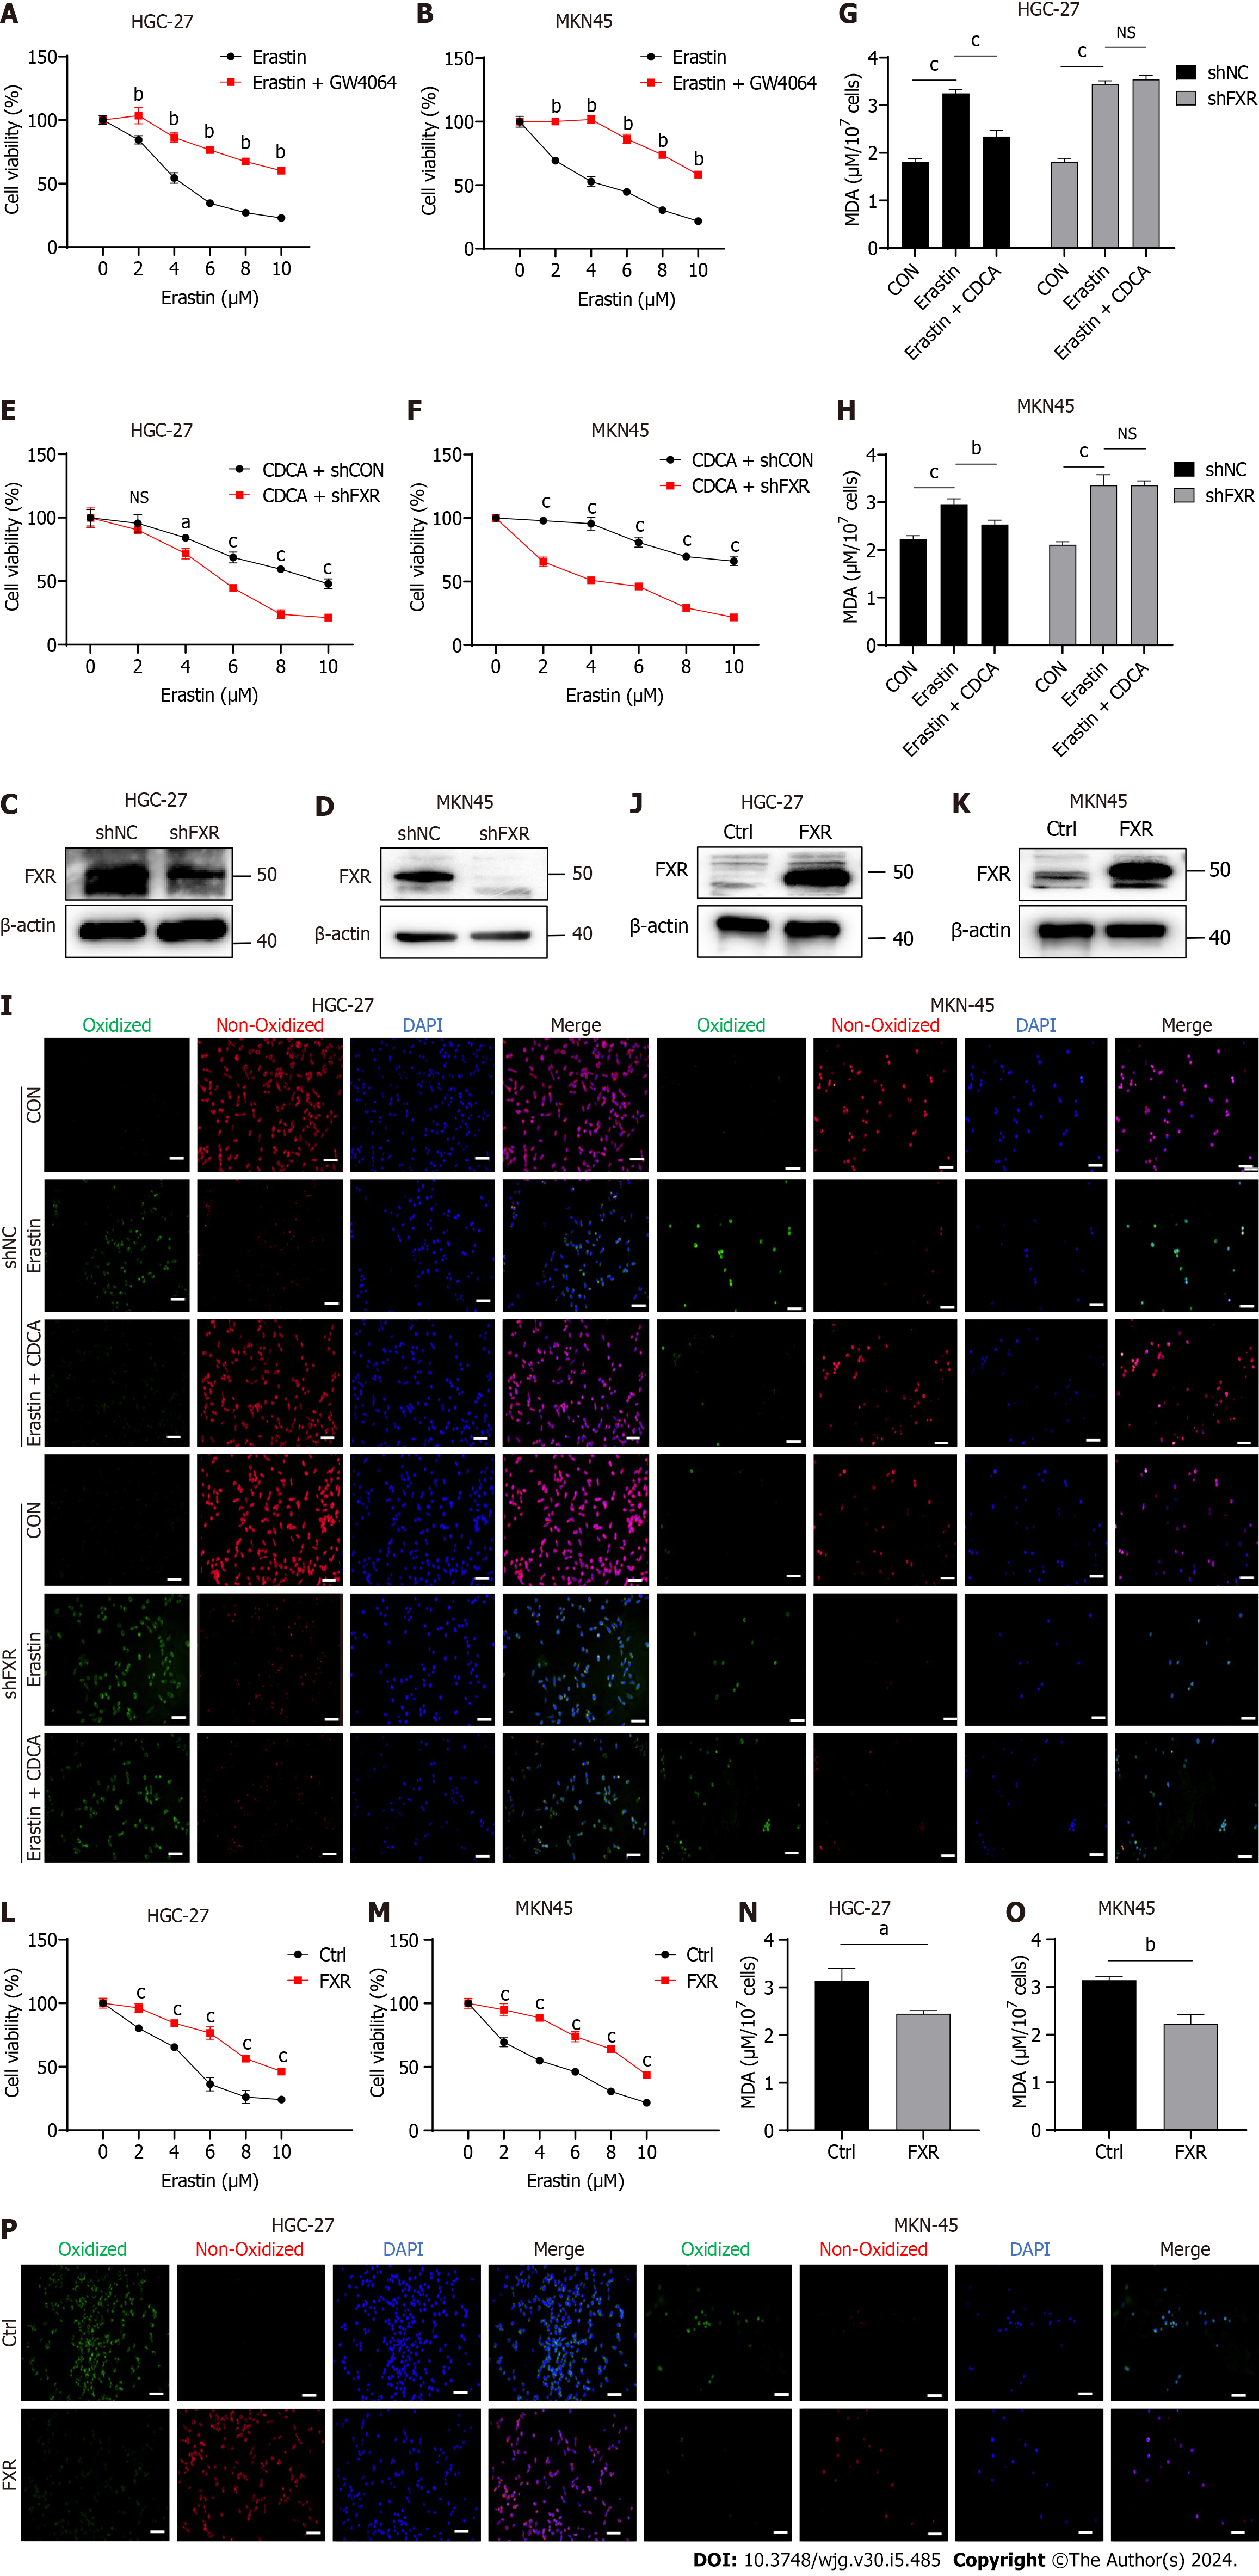
Figure 3 Bile acids inhibited ferroptosis sensitivity of gastric cancer cells by activating farnesoid X receptor.
A and B: Cell viability of erastin-treated HGC-27 and MKN-45 cells with or without GW4064 treatment; C and D: HGC-27 and MKN-45 cells were transfected with shFXR or shNC plasmid. Successful construction was confirmed by western blot analysis; E and F: Cell viability assay of GC cells treated with different concentrations of erastin and CDCA (50 μM) transfected with shFXR or shNC for 24 h; G-I: Malondialdehyde (MDA) production and BODIPY-589/591 C11 staining of GC cells transfected with shFXR or shNC plasmid and treated with erastin together with or without CDCA for 24 h; J and K: GC cells were transfected with control or FXR-coding plasmid and confirmed through western blot analysis; L and M: Cell viability assay of GC cells treated with different concentrations of erastin and CDCA (50 μM) transfected with control or FXR-coding plasmid for 24 h.; N-P: MDA production and BODIPY-589/591 C11 staining of GC cells transfected with control or FXR-coding plasmid and treated with erastin together with or without CDCA for 24 h. Scale bar: 100 μm. aP < 0.05, bP < 0.01, cP < 0.001. These experiments were repeated three times. FXR: Farnesoid X receptor; NC: Negative control; CDCA: Chenodeoxycholic acid; MDA: Malondialdehyde; NS: Not significant.
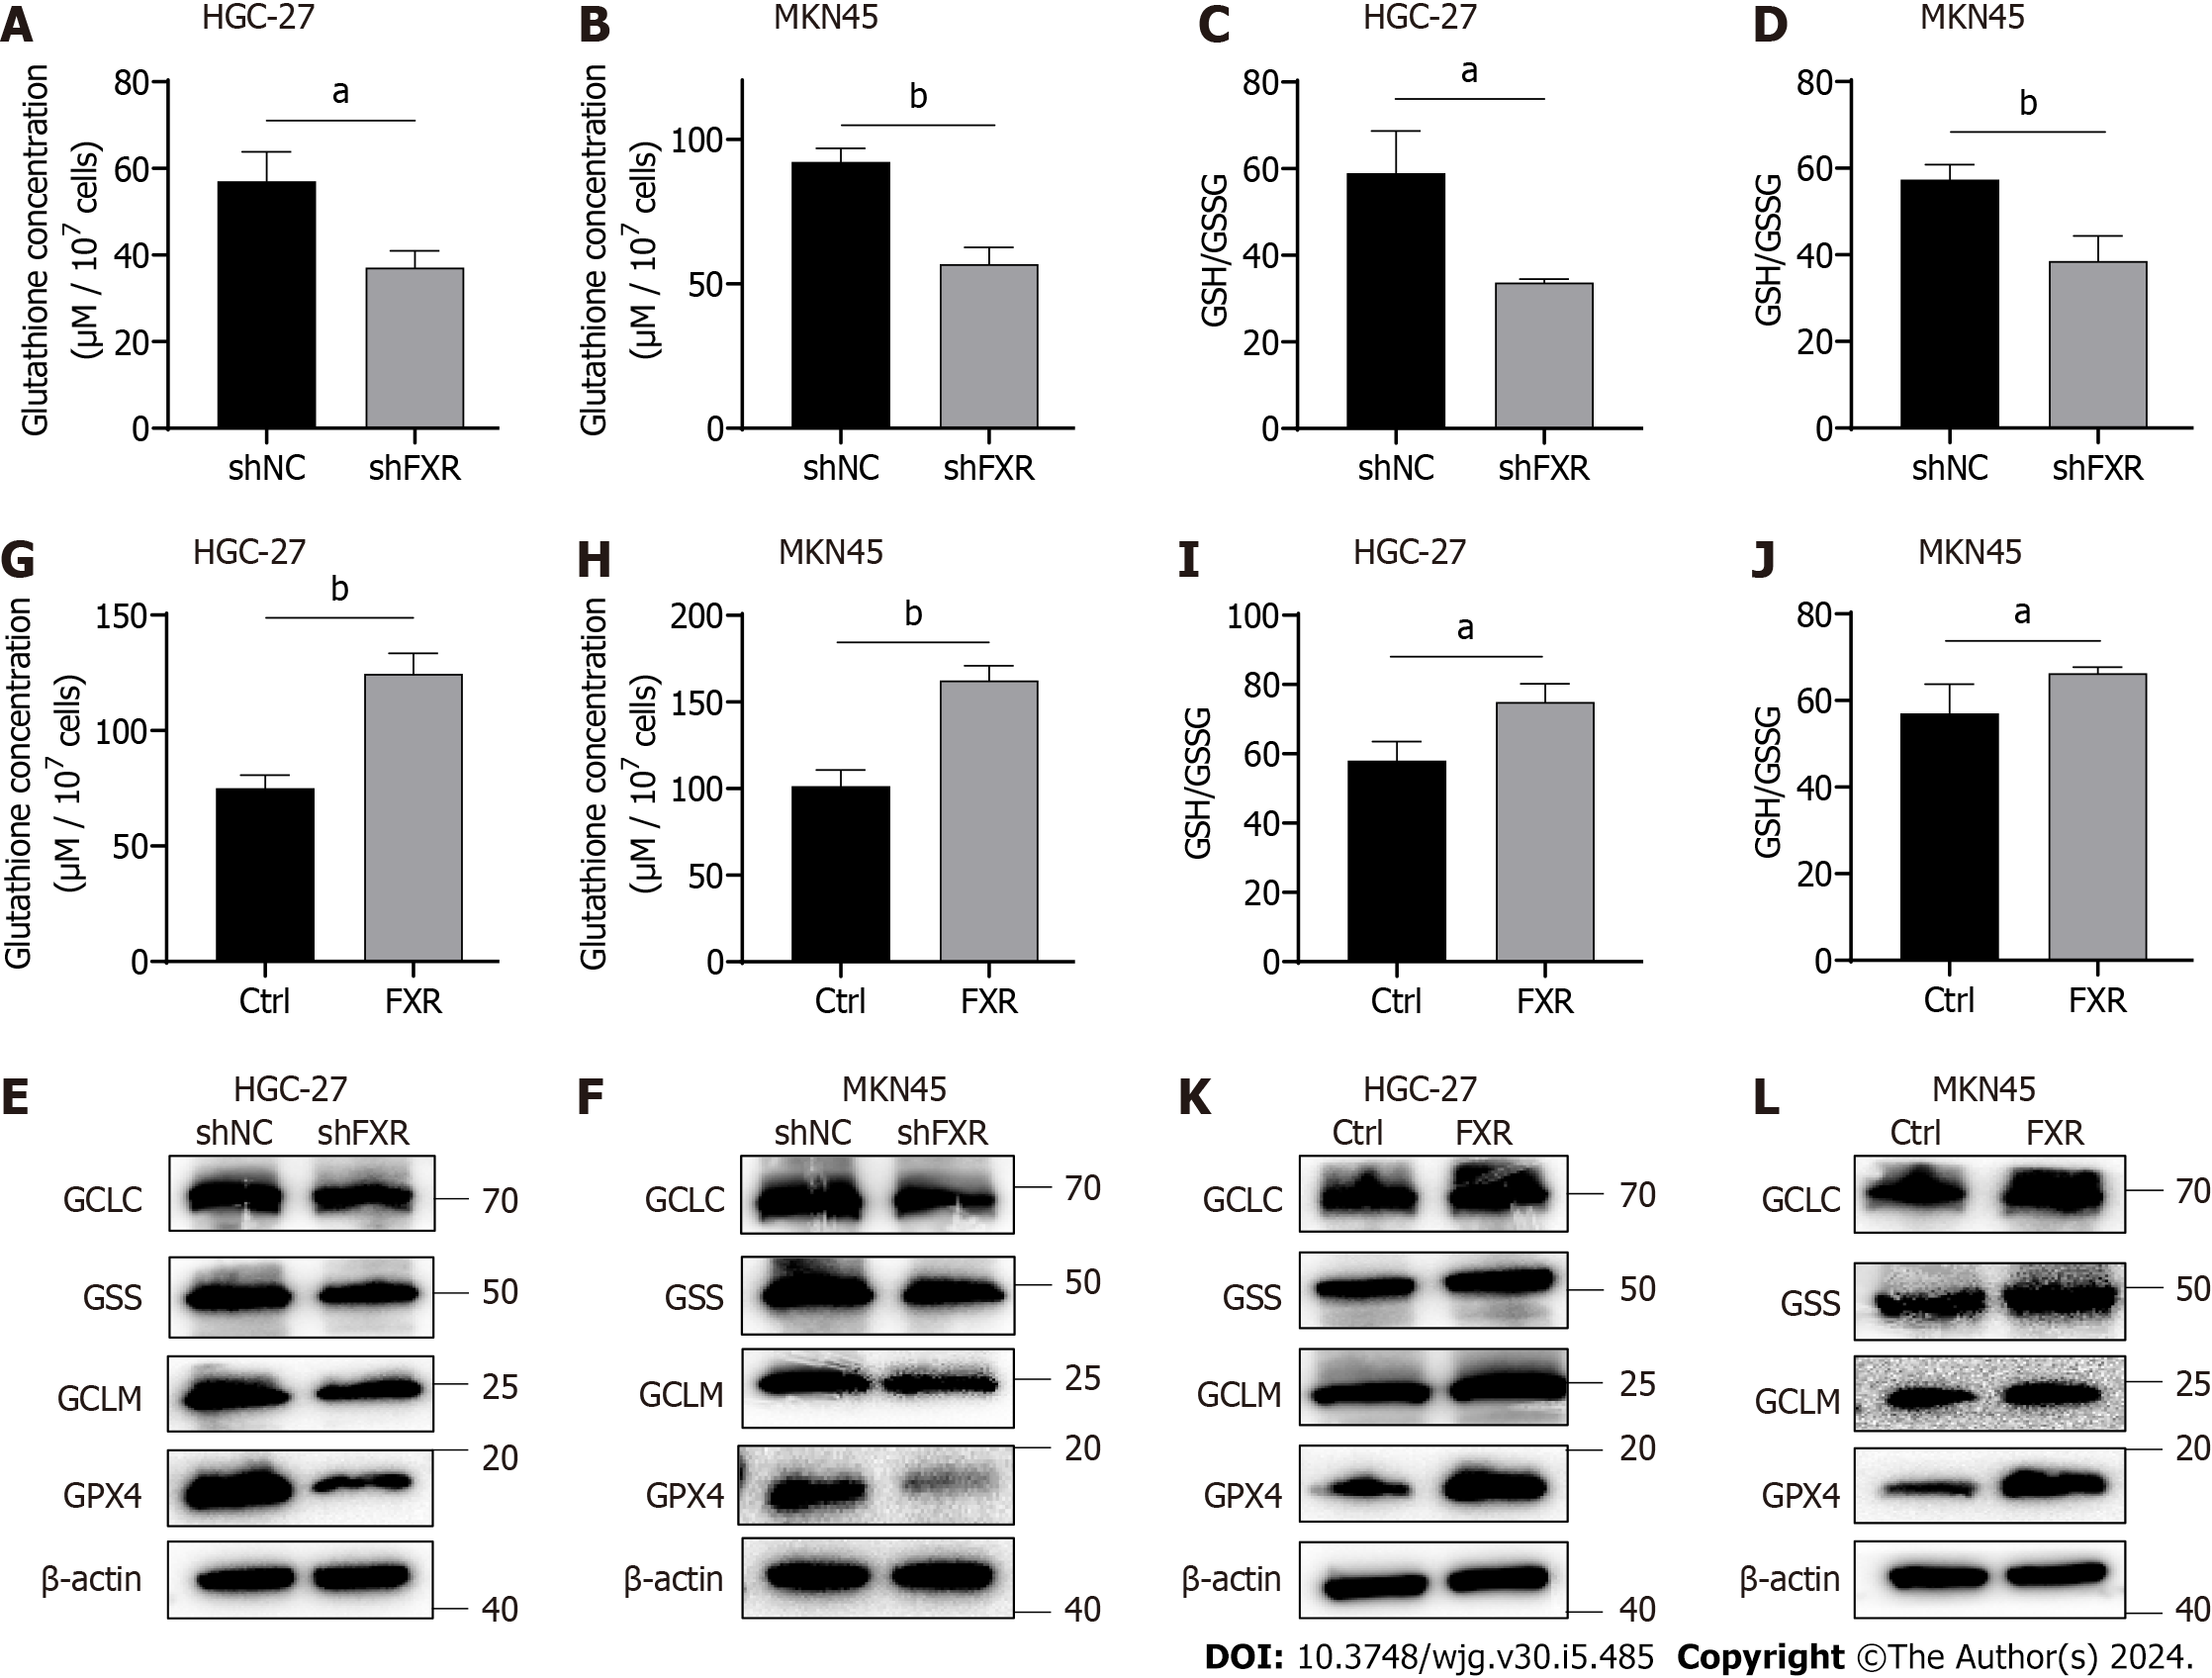
Figure 4 Farnesoid X receptor significantly promoted the synthesis of glutathione and the level of glutathione peroxidase 4 in gastric cancer cells.
A-D: Alterations of glutathione (GSH) concentrations and the GSH/oxidized GSH (GSSG) ratio in HGC-27 and MKN-45 cells transfected with the shNC or shFXR plasmid; E and F: Protein expression of GCLC, GSS, GCLM, and GSH peroxidase 4 (GPX4) in HGC-27 and MKN-45 cells transfected with the shNC or shFXR plasmid; G-J: Alterations of GSH concentrations and the GSH/GSSG ratio in HGC-27 and MKN-45 cells transfected with the control or farnesoid X receptor (FXR)-coding plasmid; K and L: Protein expression of GCLC, GSS, GCLM, and GPX4 in HGC-27 and MKN-45 cells transfected with the control or FXR-coding plasmid. aP < 0.05, bP < 0.01. These experiments were repeated three times. FXR: Farnesoid X receptor; GPX4: Glutathione peroxidase 4.
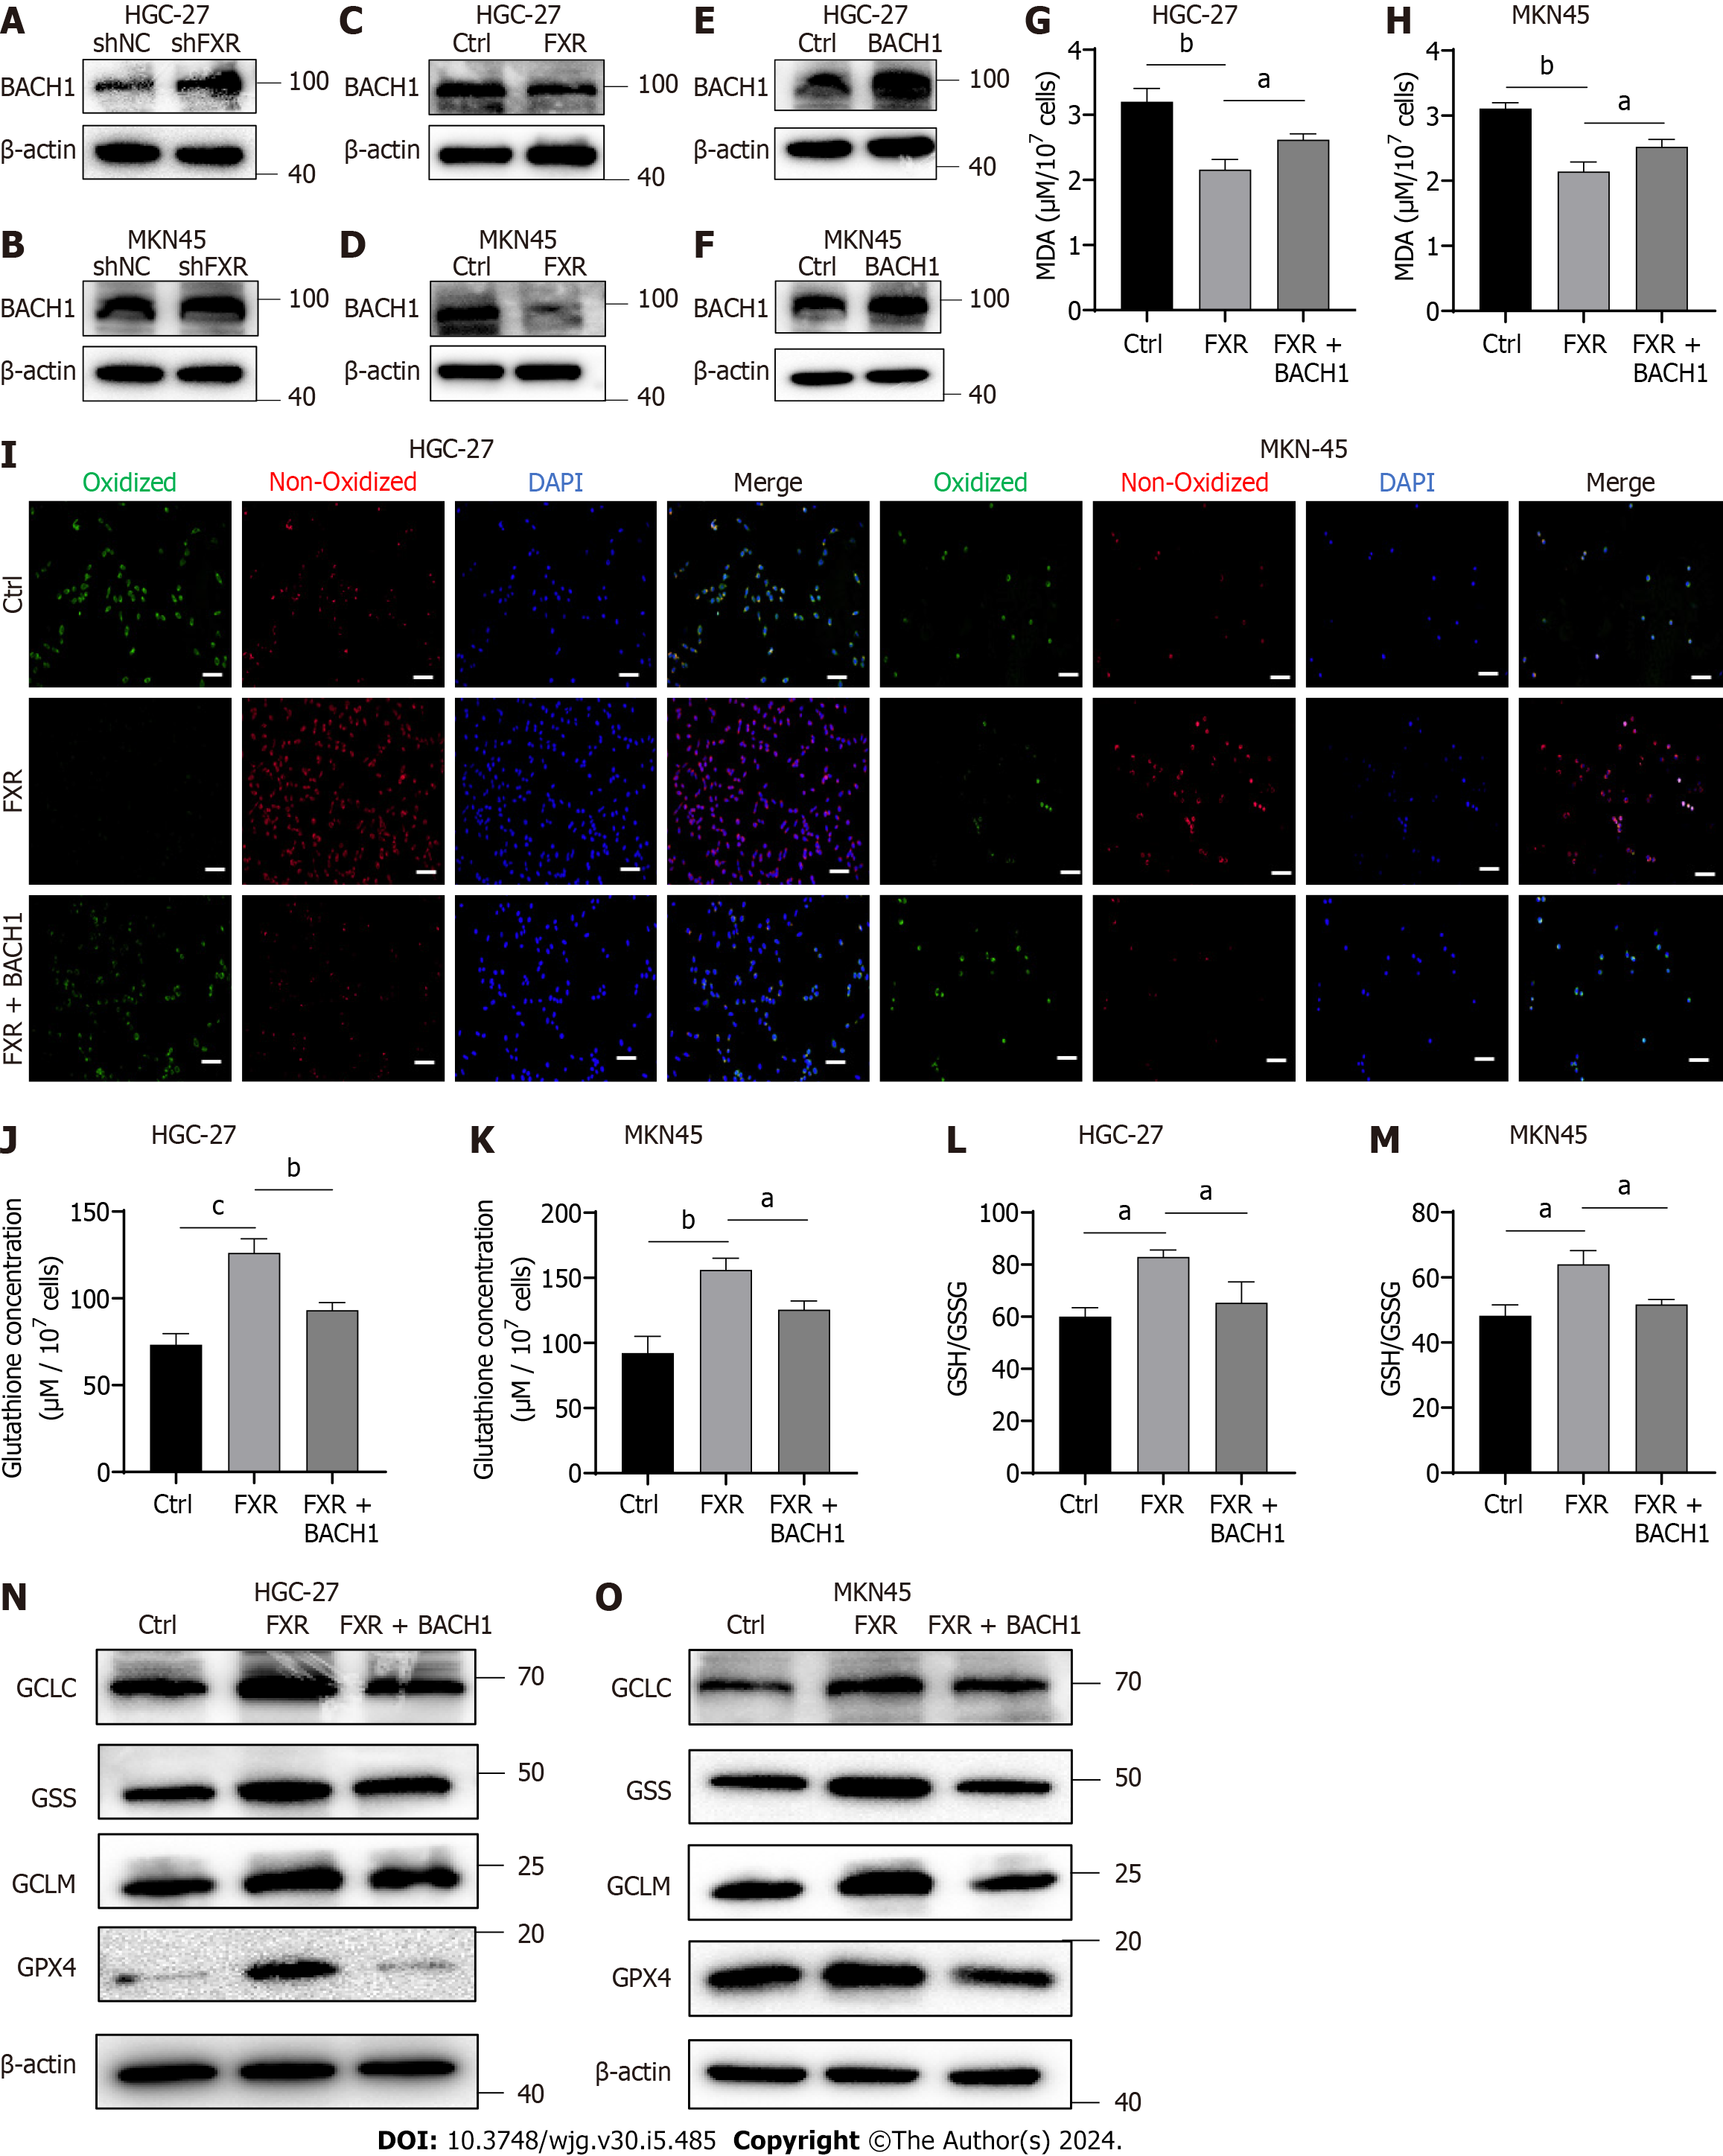
Figure 5 Farnesoid X receptor exerted anti-ferroptosis effects by inhibiting BTB and CNC homology 1.
A and B: Protein expression of BTB and CNC homology 1 (BACH1) in gastric cancer (GC) cells transfected with the shNC or shFXR plasmid for 24 h; C and D: Western blot (WB) analysis of BACH1 protein expression in GC cells transfected with the shNC or shFXR plasmid for 24 h; E and F: HGC-27 and MKN-45 cells were transfected with the control or BACH1-coding plasmid and confirmed through WB analysis; G-I: Malondialdehyde production and BODIPY-589/591 C11 staining of GC cells after transfection with the farnesoid X receptor (FXR)-coding plasmid together with or without the BACH1-coding plasmid and erastin treatment (5 μM) for 24 h; J-M: Alterations of glutathione (GSH) concentrations and the GSH/oxidized GSH ratio in HGC-27 and MKN-45 cells after transfection with the FXR-coding plasmid together with or without the BACH1-coding plasmid; N and O: WB analysis of GCLC, GSS, GCLM, and GSH peroxidase 4 protein expression after transfection with the FXR-coding plasmid together with or without the BACH1-coding plasmid. Scale bar: 100 μm. aP < 0.05, bP < 0.01, cP < 0.001. These experiments were repeated three times. FXR: Farnesoid X receptor; BACH1: BTB and CNC homology 1; GSH: Glutathione; GSSG: Oxidized glutathione; GPX4: Glutathione peroxidase 4.
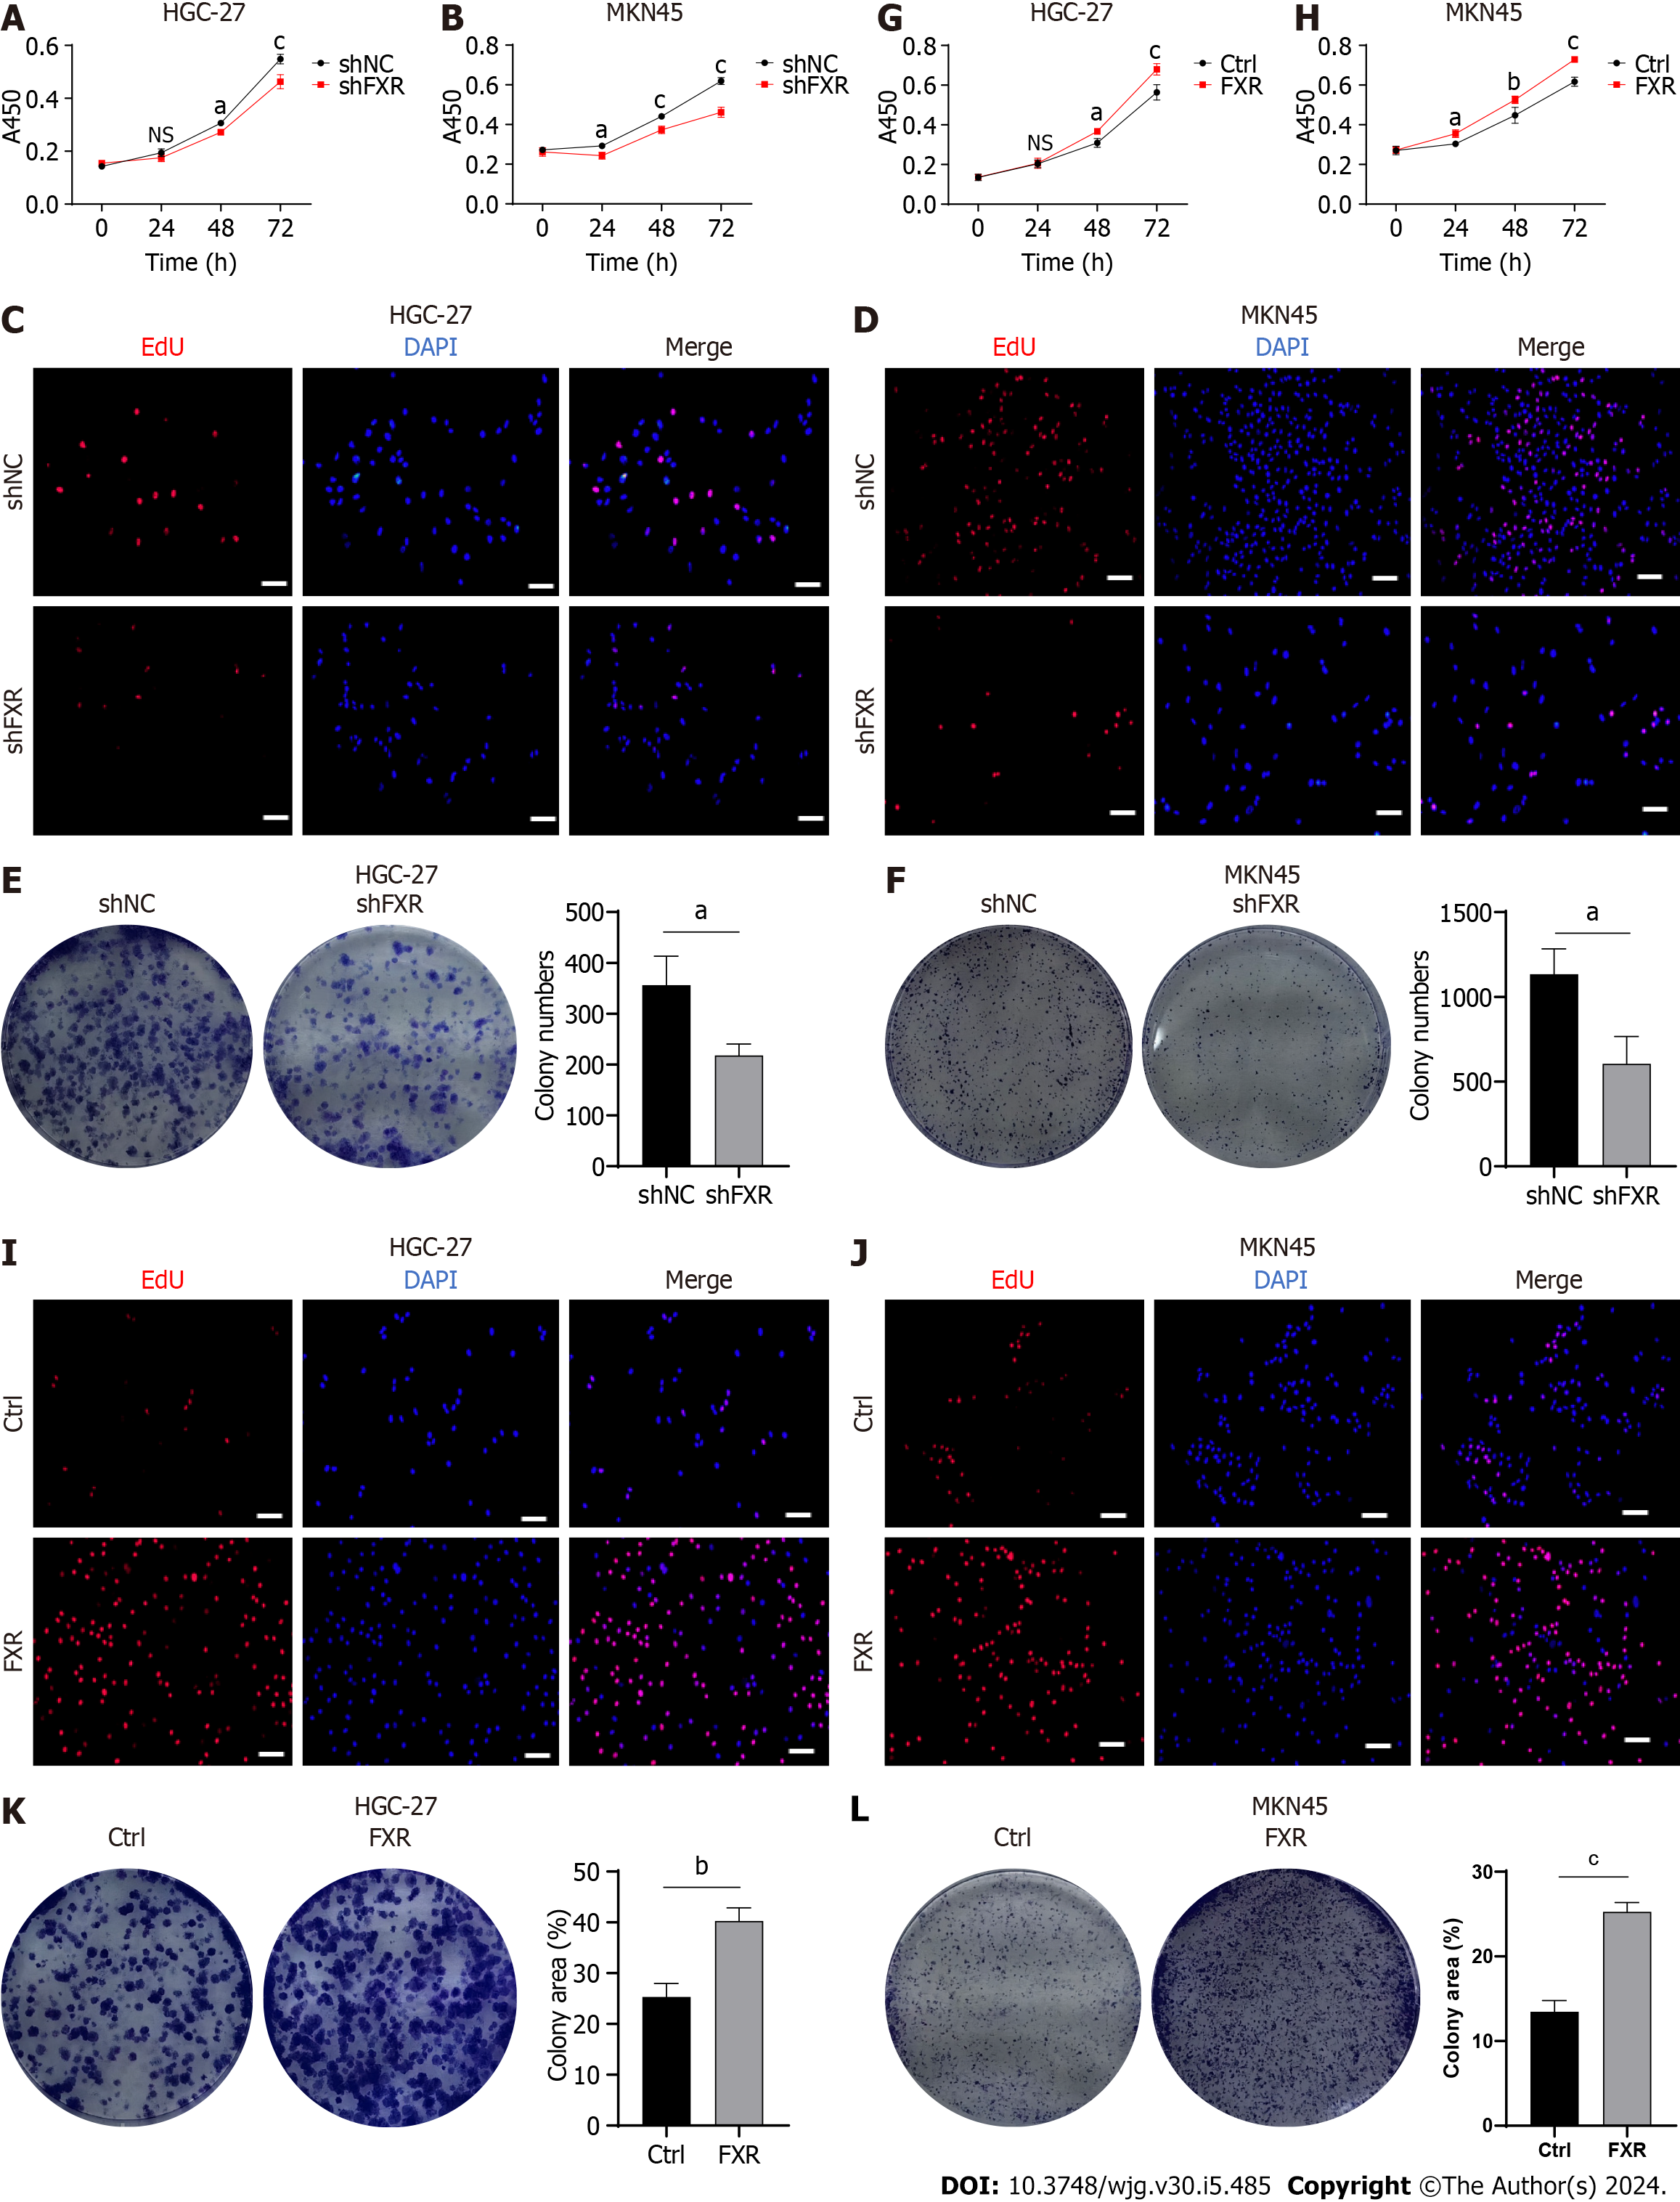
Figure 6 Farnesoid X receptor promoted proliferation of gastric cancer cells.
A-F: Malignant proliferation assays, including cell viability (A and B), 5-ethynyl-2′-deoxyuridine (Edu) staining (C and D), andcolony formation assays (E and F), were performed in gastric cancer (GC) cells after transfection with the shNC or shFXR plasmid; G-L: Cell viability (G and H); Edu staining (I and J), andcolony formation assays (K and L) were performed in GC cells after transfection with the control or farnesoid X receptor-coding plasmid. Scale bar: 100 μm. aP < 0.05, bP < 0.01, cP < 0.001. These experiments were repeated three times. FXR: Farnesoid X receptor; Edu: 5-ethynyl-2′-deoxyuridine; NC: Negative control; NS: Not significant.
- Citation: Liu CX, Gao Y, Xu XF, Jin X, Zhang Y, Xu Q, Ding HX, Li BJ, Du FK, Li LC, Zhong MW, Zhu JK, Zhang GY. Bile acids inhibit ferroptosis sensitivity through activating farnesoid X receptor in gastric cancer cells. World J Gastroenterol 2024; 30(5): 485-498
- URL: https://www.wjgnet.com/1007-9327/full/v30/i5/485.htm
- DOI: https://dx.doi.org/10.3748/wjg.v30.i5.485


