Copyright
©The Author(s) 2024.
World J Gastroenterol. Feb 7, 2024; 30(5): 450-461
Published online Feb 7, 2024. doi: 10.3748/wjg.v30.i5.450
Published online Feb 7, 2024. doi: 10.3748/wjg.v30.i5.450
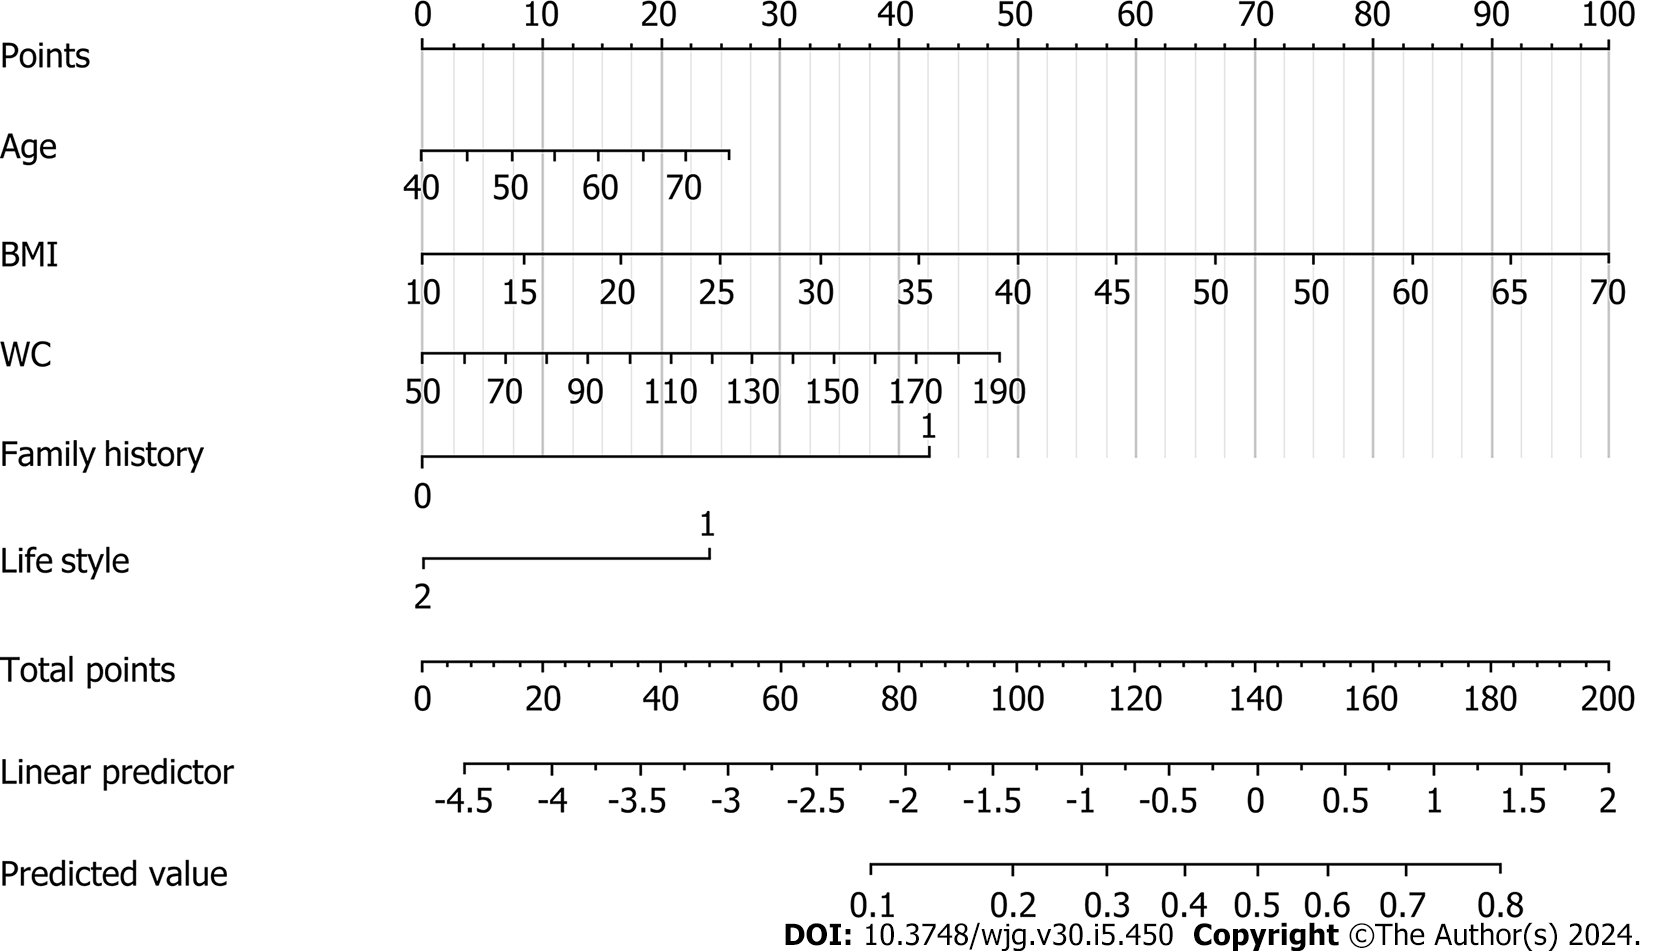
Figure 1 Nomogram for predicting early screening of individuals at high risk of colorectal cancer.
The value of each variable was scored on a point scale from 0 to 100, after which the scores for each variable were added together. The total sum was located on the total points axis, which enabled us to predict the probability of early screening of individuals at high risk of colorectal cancer. Age, body mass index, and waist circumference were used as continuous variables. The family history group 0 = no and 1 = yes, and lifestyle group 1 = unhealthy lifestyle and 2 = healthy lifestyle. BMI: Body mass index; WC: Waist circumference.
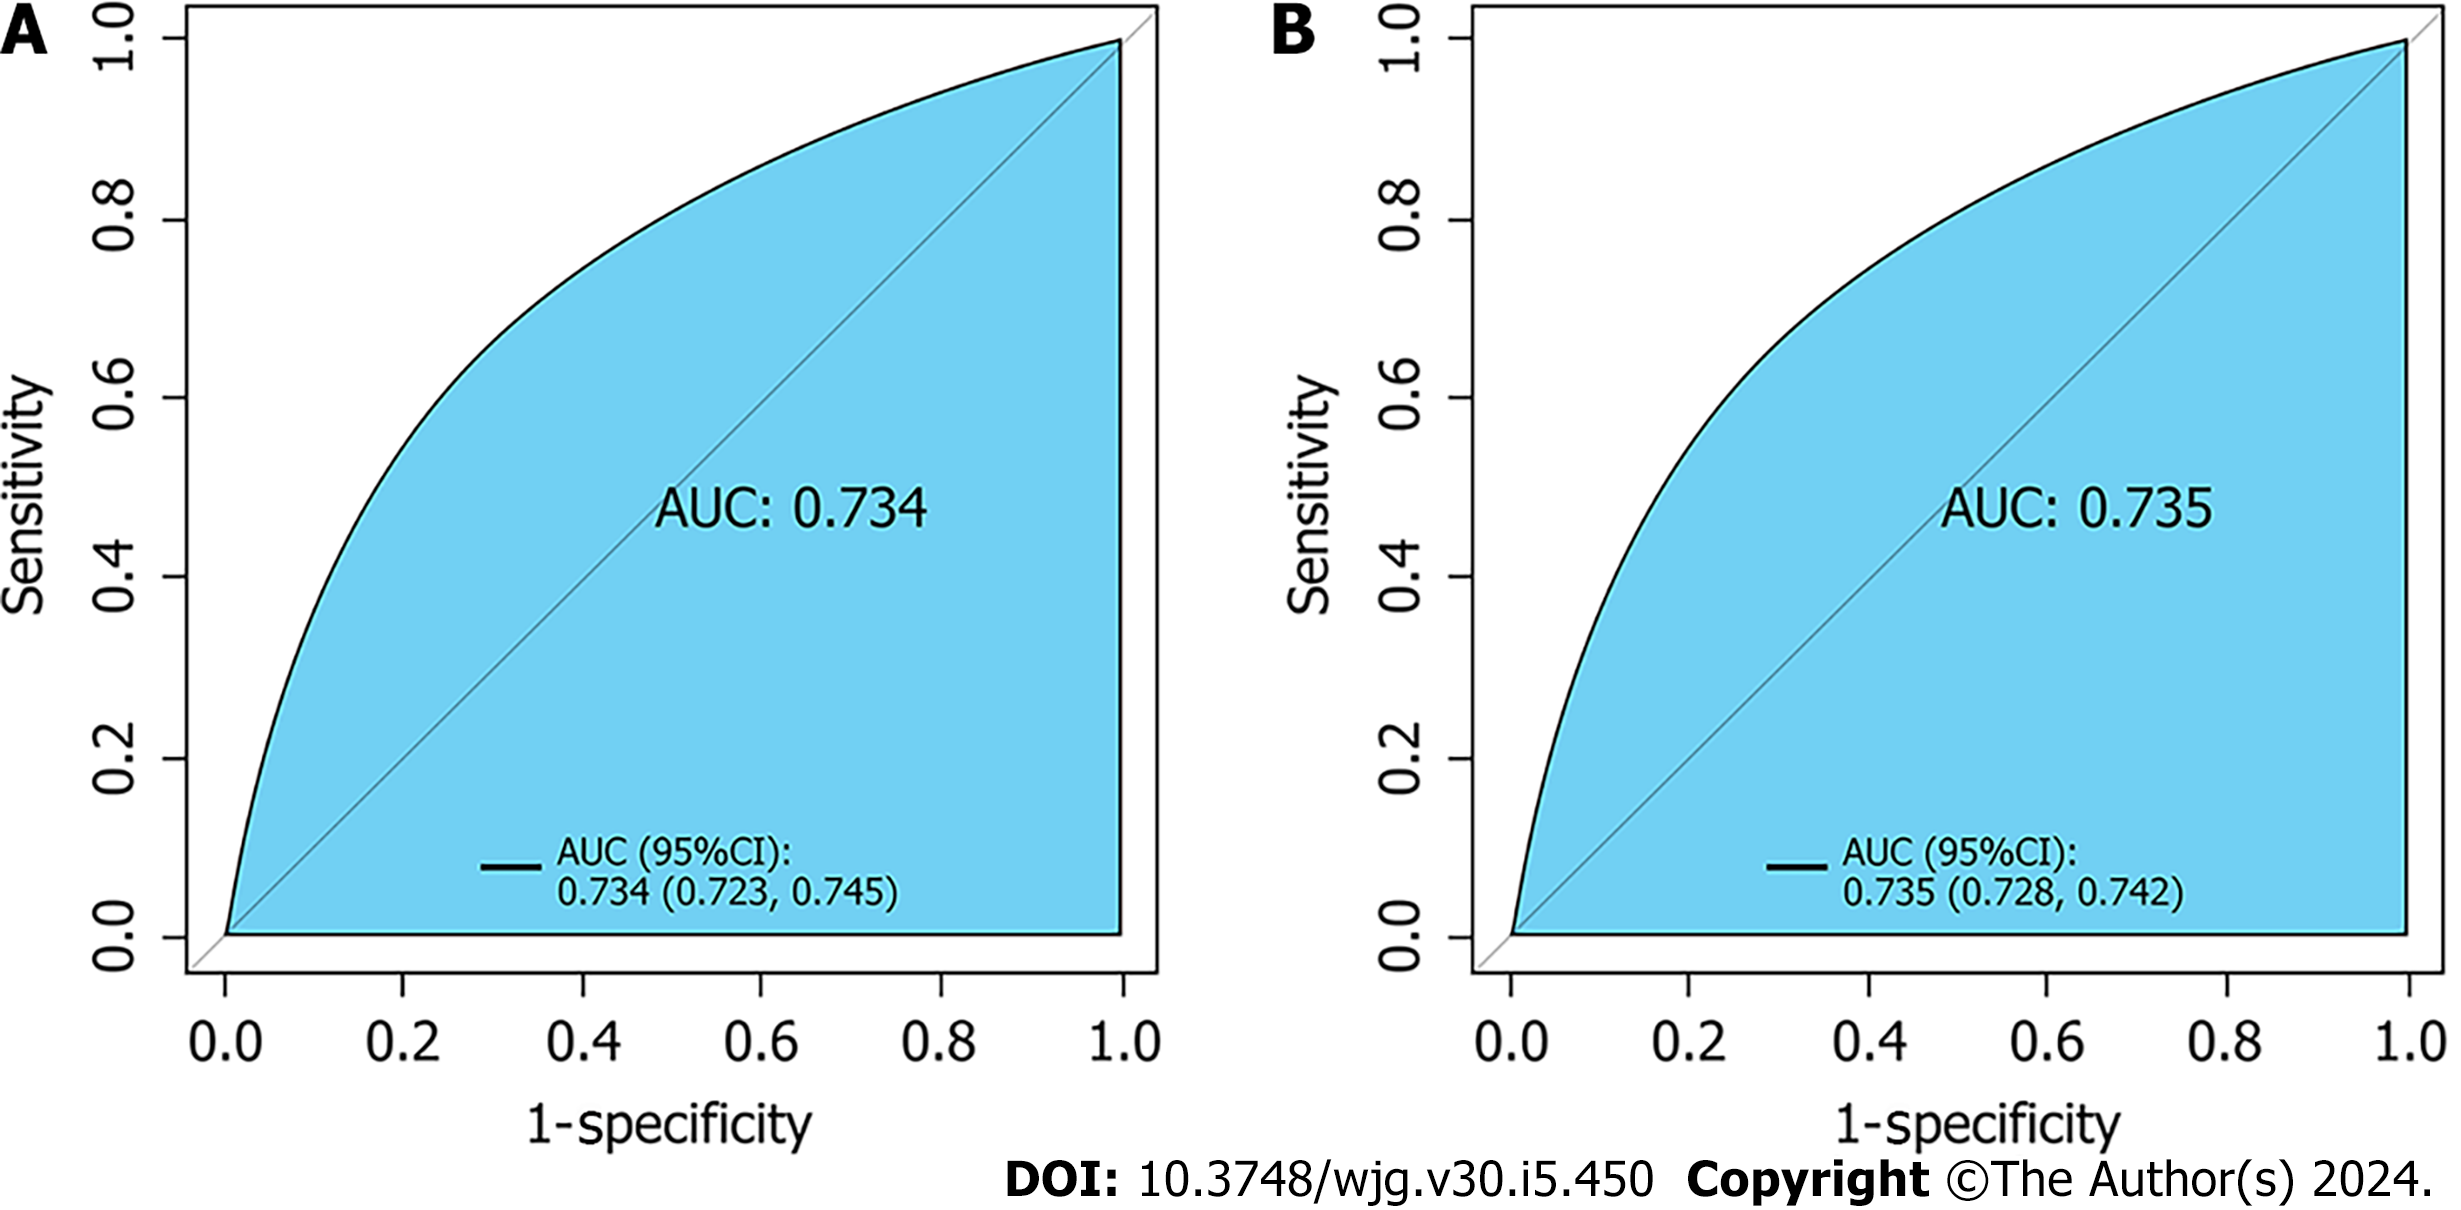
Figure 2 Receiver operating characteristic curves curve for predicting early screening of individuals at high risk of colorectal cancer.
A: Validation set: Receiver operating characteristic curves (ROC) curve for the nomogram generated using bootstrap resampling (500 times); B: Training set: ROC curve for the nomogram generated using bootstrap resampling (500 times). AUC: Area under the curve.
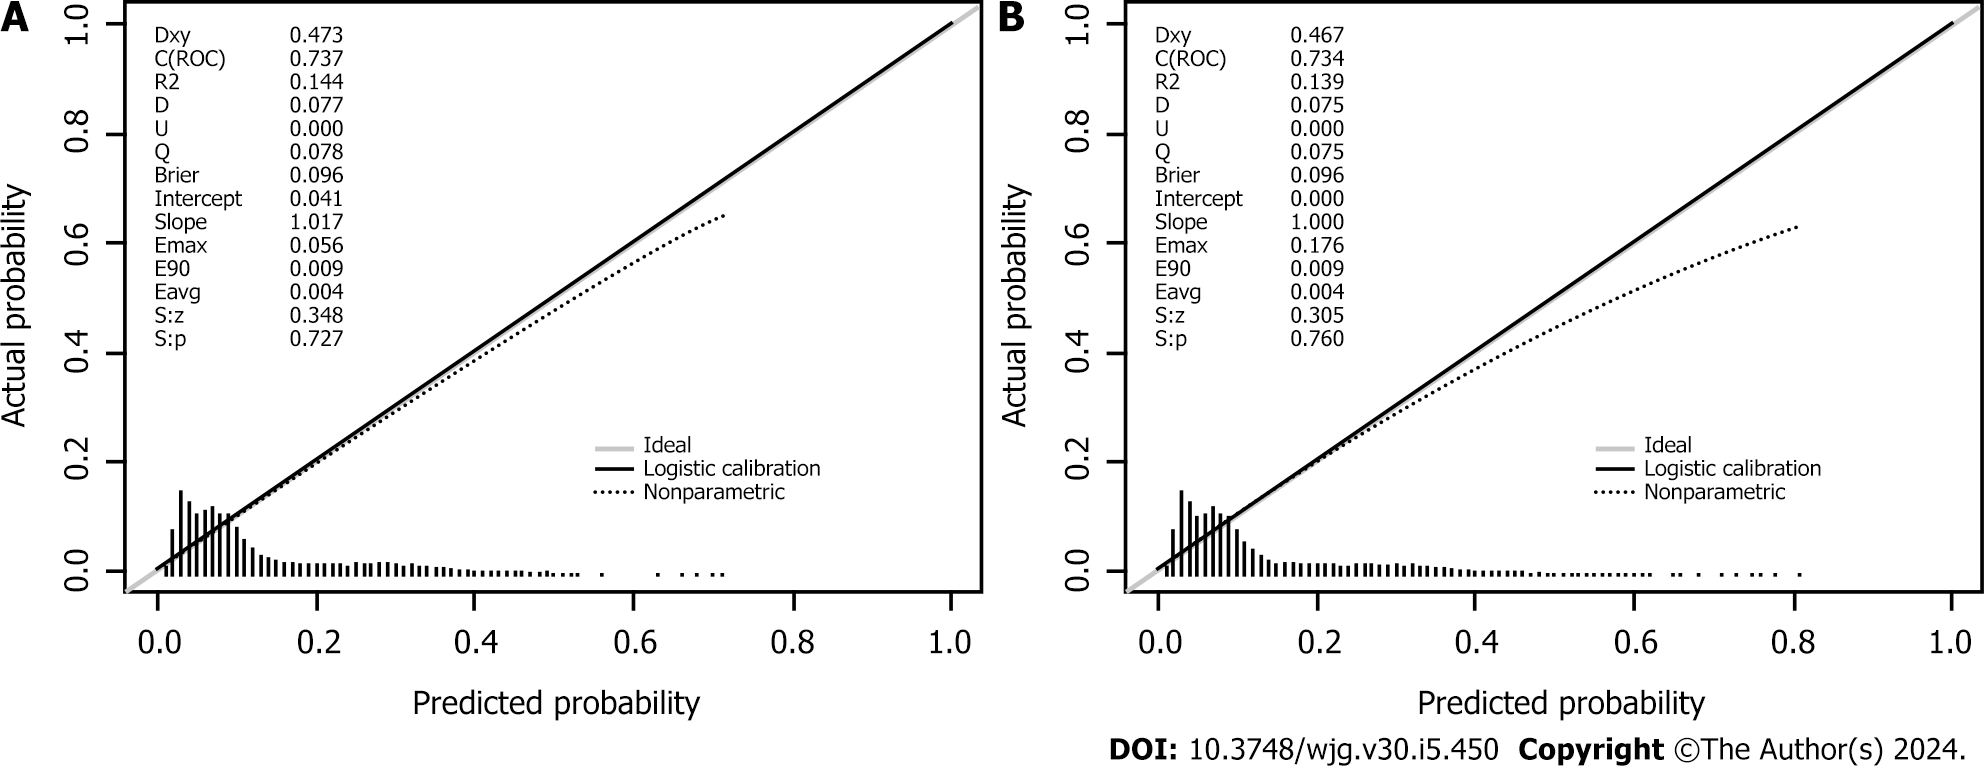
Figure 3 Calibration pot for predicting early screening of individuals at high risk of colorectal cancer.
A: Validation set nomogram calibration plot; B: Training set nomogram calibration plot. When the solid line (performance nomogram) is closer to the dotted line (ideal model), the prediction accuracy of the nomogram is better.
Figure 4 Decision curve analysis for predicting early screening of individuals at high risk of colorectal cancer.
A: Decision curve analysis (DCA) of the validation set prediction model; B: DCA of the training set prediction model. Red solid lines indicate the prediction models, gray solid lines indicate all populations at high risk for colorectal cancer (CRC), and solid horizontal lines indicate non-high-risk populations for CRC. The graph depicts the expected net gain for each individual relative to the high-risk CRC Nuo plot forecast. Net gain increases with the model curve.
- Citation: Xu LL, Lin Y, Han LY, Wang Y, Li JJ, Dai XY. Development and validation of a prediction model for early screening of people at high risk for colorectal cancer. World J Gastroenterol 2024; 30(5): 450-461
- URL: https://www.wjgnet.com/1007-9327/full/v30/i5/450.htm
- DOI: https://dx.doi.org/10.3748/wjg.v30.i5.450


