Copyright
©The Author(s) 2024.
World J Gastroenterol. Dec 21, 2024; 30(47): 5032-5054
Published online Dec 21, 2024. doi: 10.3748/wjg.v30.i47.5032
Published online Dec 21, 2024. doi: 10.3748/wjg.v30.i47.5032
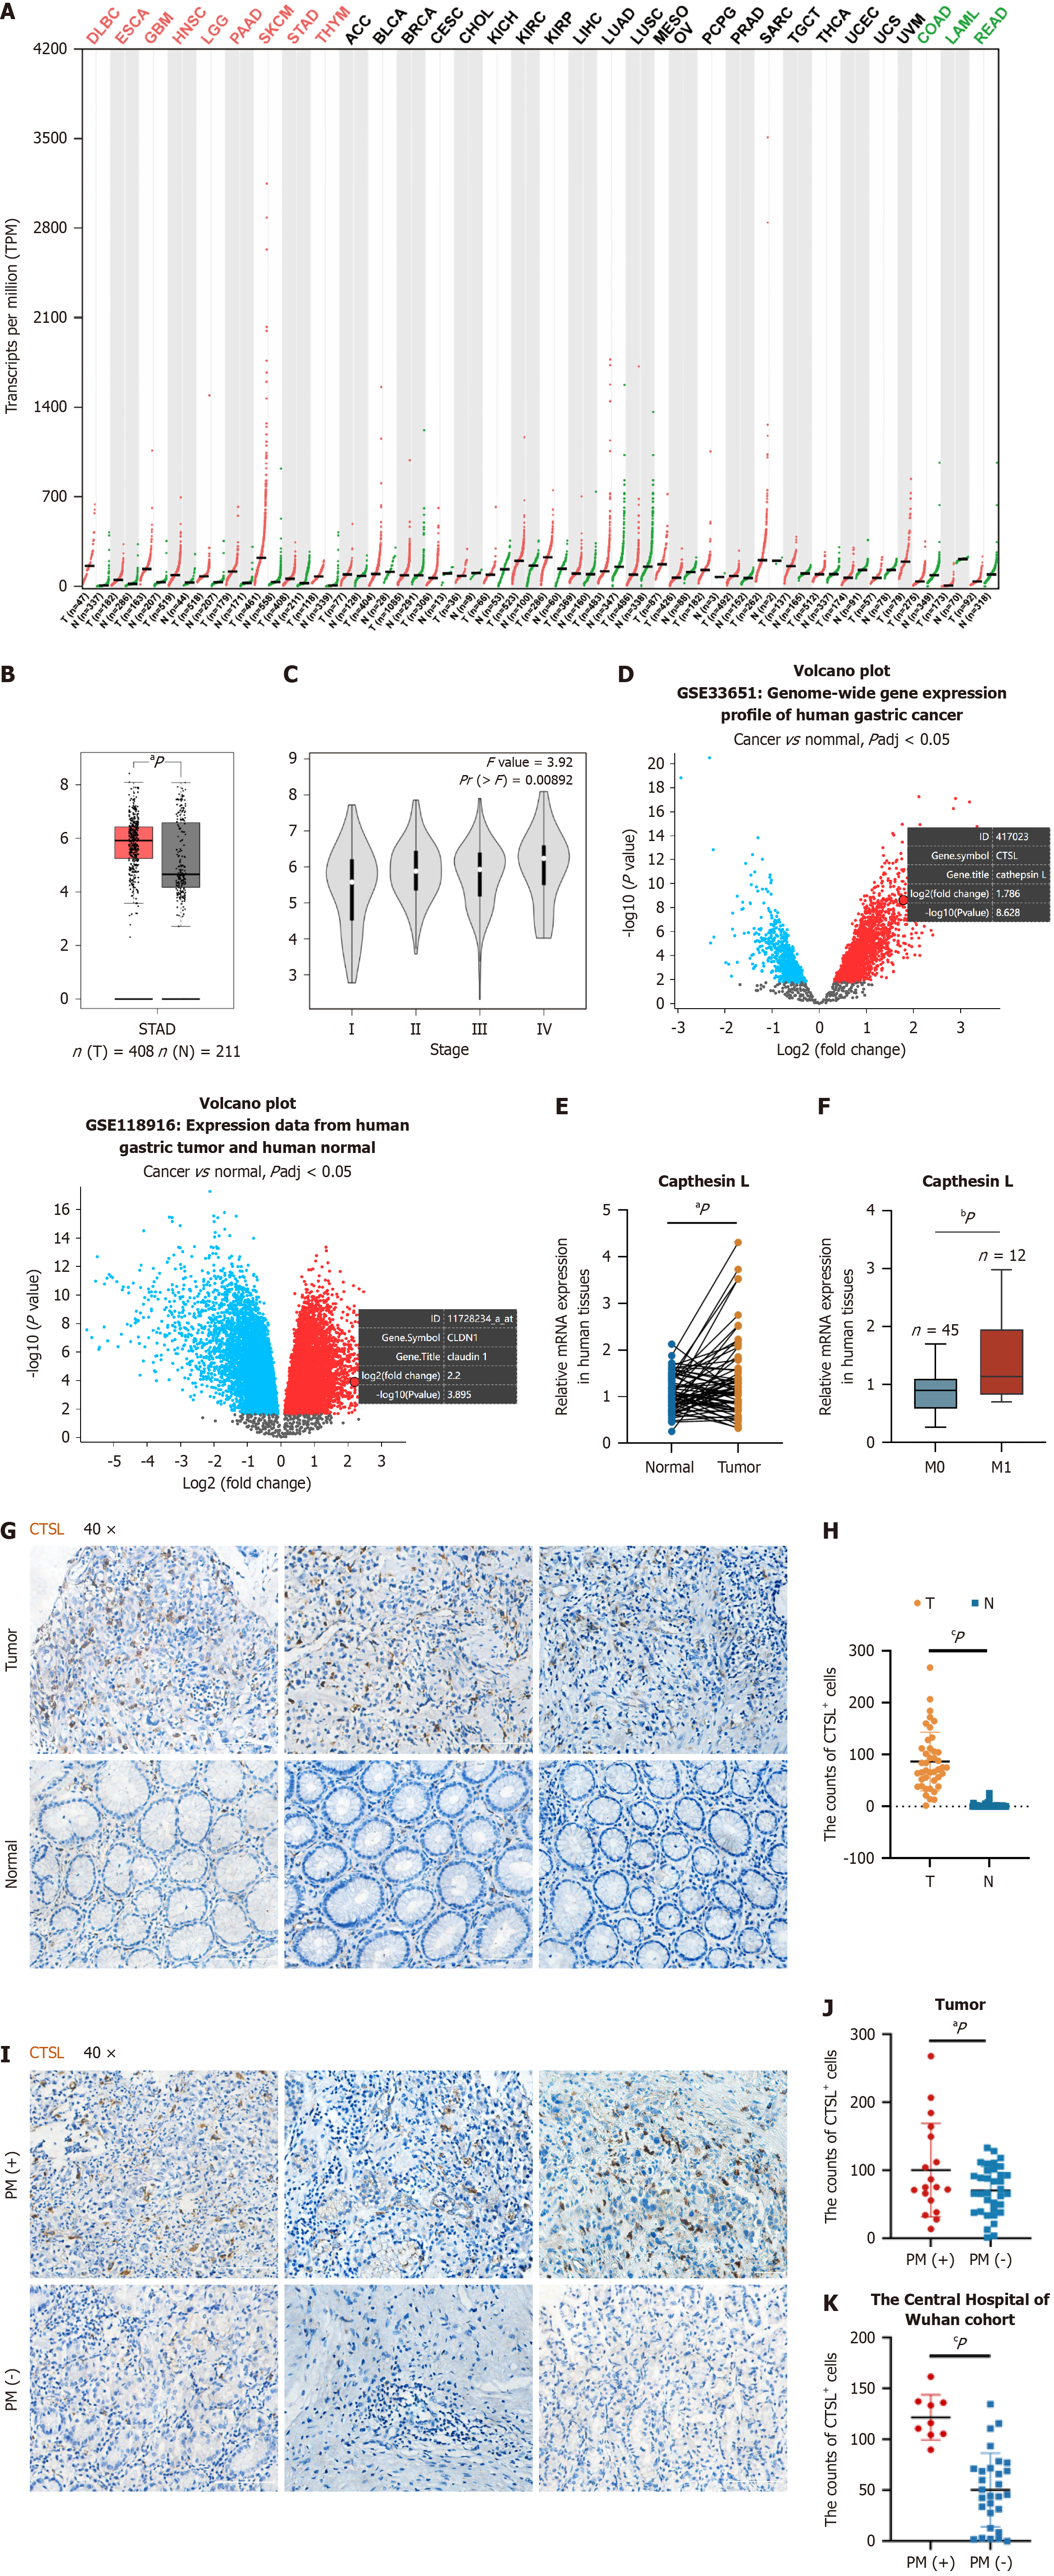
Figure 1 Upregulated expression of cathepsin L in gastric cancer patients with peritoneal metastasis.
A: The general level of cathepsin L (CTSL) expression among different cancers from the Gene Expression Profiling Interactive Analysis platform in The Cancer Genome Atlas database; B and C: CTSL expression in gastric tumors (n = 408) was significantly greater than that in normal gastric tissues (n = 211) and was associated with tumor stage in the STAD dataset. The error bars represent the SD, aP < 0.05 according to Student’s t test; D: As a differentially expressed gene, CTSL was upregulated in GSE33651 and GSE11896 (log2fc = 1.786, log2fc = 2.162) via GEO2R analysis; E and F: The qPCR analysis of mRNAs extracted from 64 paired gastric tissues from patients at Nanfang Hospital revealed a significant increase in CTSL expression in tumor tissues (n = 64), P = 0.0412, especially in the group with metastasis (n = 12), P = 0.0434. The data points are presented as the means ± SD. The error bars represent the SD. aP < 0.05 according to Student’s t test; bP < 0.01 according to Student’s t test; G and H: Representative immunohistochemistry (IHC) images of tumor and paracancerous normal sections stained for CTSL; scale bar, 100 μm. The quantification of positively stained cells in the sections via Image J was performed via the geometric mean of 3 representative views from each section; the 53 sections from Nanfang Hospital were used in total. The error bars represent the SD; cP < 0.001 according to Student’s t test; I-K: Representative IHC images of tumor sections from patients with or without peritoneal metastasis stained for CTSL; the error bars represent the SD; aP < 0.05; cP < 0.001 according to Student’s t test. The quantification of positively stained cells in the sections was the same as above for 53 sections from Nanfang Hospital (with metastasis: 18 cases; without metastasis: 35 cases) and 39 sections from the Central Hospital of Wuhan (with metastasis: 9 cases; without metastasis: 30 cases) were used for each group. T: Tumor; N: Normal; PM: Peritoneal metastasis; CTSL: Cathepsin L.
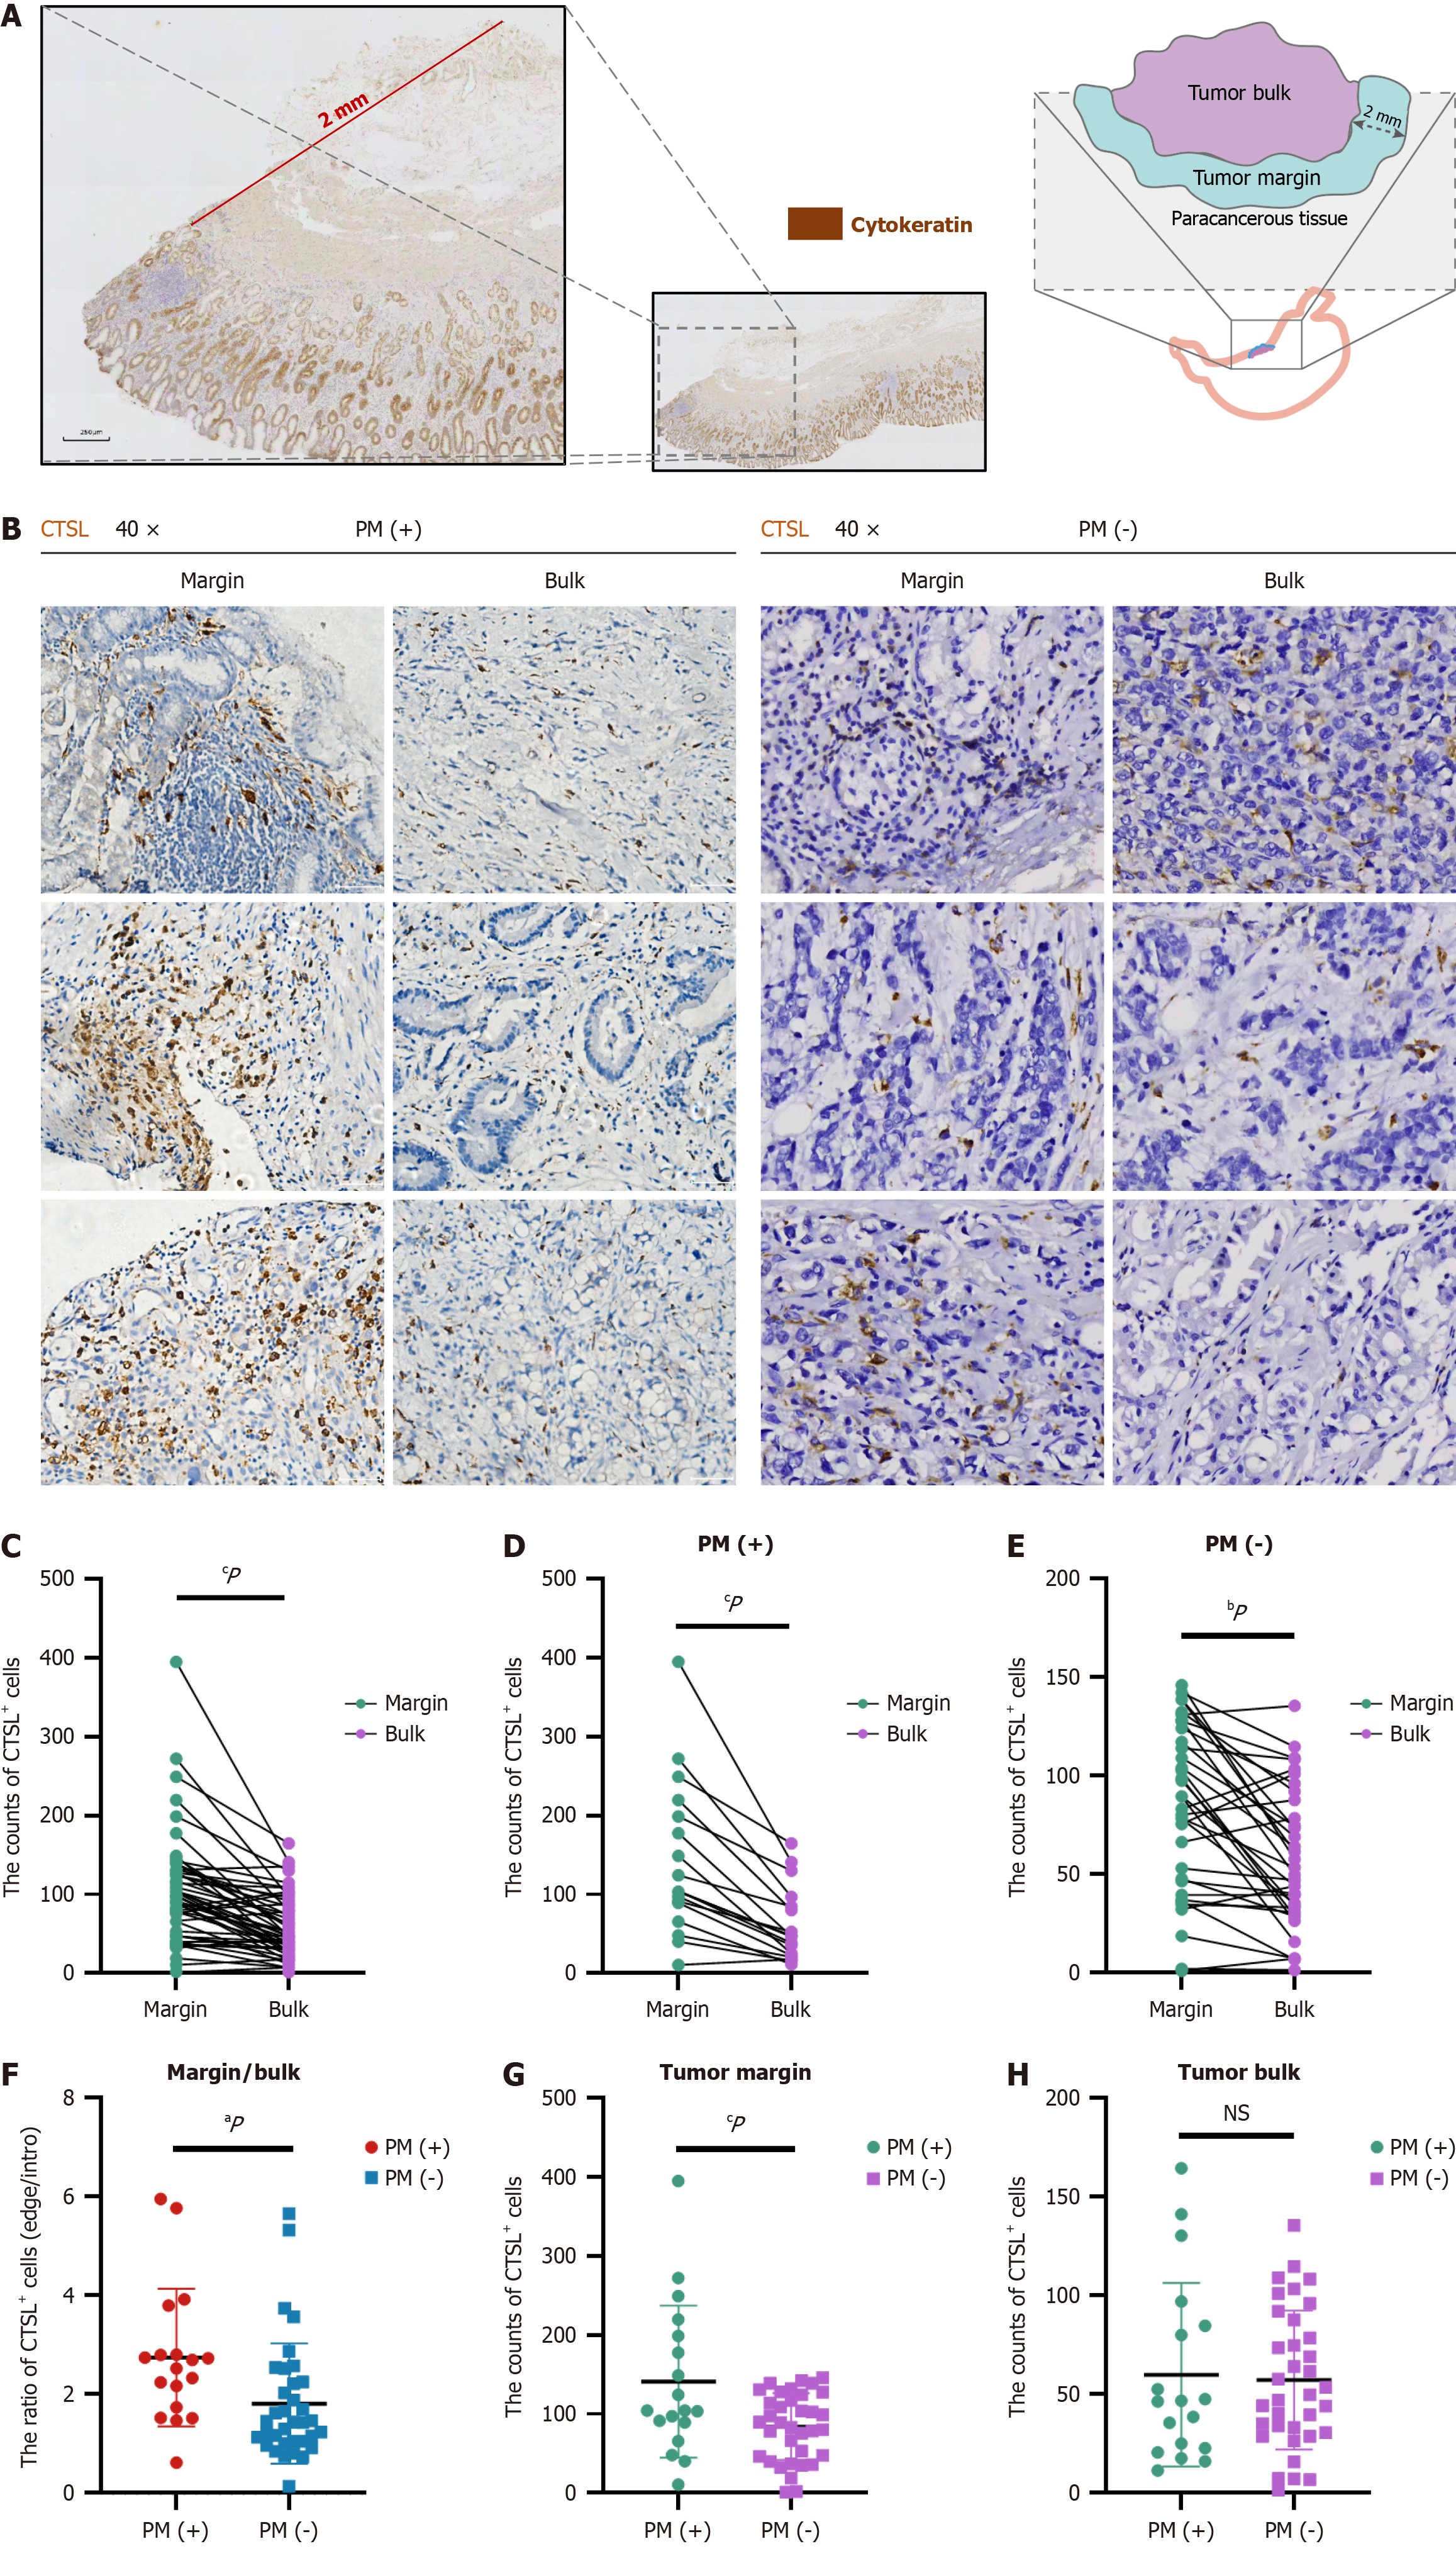
Figure 2 Cathepsin L is more localized in the gastric tumor margin than in the bulk.
A: Example diagram of the method for classifying tumor sections stained for cytokeratin, which defines the 2-mm-wide area away from the edge of the tumor as the tumor margin; scale bar, 500 μm; B-E: Representative immunohistochemistry images of the margin and bulk of each tumor section from patients with or without peritoneal metastasis stained for cathepsin L; scale bar, 50 μm. The number of positive cells in the tumor sections was quantified via Image J via the geometric mean of 3 representative views from each section. The data points are presented as the means ± SD. The error bars represent the SD; cP < 0.001; bP < 0.01 according to Student’s t test; F-H: Significant analysis of positive cell counts according to the metastasis state in the tumor margin or bulk region by Image J via the geometric mean of 3 representative views from each section. The data points are presented as the means ± SD. The error bars represent the SD; NS: Not significant, P > 0.05; aP < 0.05; cP < 0.001 according to Student’s t test. CTSL: Cathepsin L; PM: Peritoneal metastasis.
Figure 3 Cathepsin L is critical for macrophages to promote gastric tumor invasion and migration via epithelial-mesenchymal transition.
A: Representative immunohistochemistry images of multinucleated giant cells stained for cathepsin L (CTSL) in gastric tumor sections. Magnification, 40 ×; B: Immunofluorescence analysis of CTSL and CD68 in the tumor tissue of gastric cancer patients; scale bar, 20 mm; C: The qPCR and Western blot analysis of shCTSL-treated THP-1 cells. The error bars represent the SD; NS: P > 0.05; cP < 0.001; bP < 0.01 according to one-way analysis of variance (ANOVA); D: Invasion assay of the gastric cancer cell lines MKN45 and MGC803 cocultured with shCTSL or shNC THP-1 cells. Magnification, 20 ×. The chemotactic cells that migrated through the Matrigel in the five views of each group were quantified manually. The error bars represent the SD; bP < 0.01; cP < 0.001; dP < 0.0001 according to one-way ANOVA; E: Wound healing assay of the gastric cancer cell lines MKN45 and MGC803 cocultured with shCTSL or shNC THP-1 cells for 48 hours. Magnification, 4 ×. The wound closure area was quantified via Image J via data from 3 independent experiments. The error bars represent the SD; bP < 0.01; according to Student’s t test; F: Western blot analysis of E-cadherin levels in various gastric cancer cell lines; G: Western blot analysis of epithelial-mesenchymal transition-related proteins (E-cadherin, β-catenin, N-cadherin, and Snail) in MKN45 and MGC803 cells cocultured with shCTSL or shNC-transfected THP-1 cells for 48 hours. Blots from three independent experiments were quantified via Image J. The error bars represent the SD; cP < 0.001; bP < 0.01; aP < 0.05 according to one-way ANOVA. CTSL: Cathepsin L; DAPI: 4',6-diamidino-2-phenylindole.
Figure 4 Cathepsin L + macrophages exert orienting effects on polarization.
A: Multiplied immunohistochemistry (mIHC) analysis of cathepsin L (CTSL), CD68, and CDD163 in human gastric tumor sections; scale bar, 20 μm; B: Correlation analysis between CTSL and macrophage markers (CD68 or CD163) via Pearson’s R value measured by Image J; |R| ≤ 1; C and D: Representative mIHC images stained for CTSL, CD68, and CD163 in the tumor margin and bulk of human gastric tissues; magnification, 20 ×, 80 ×; E: Immunofluorescence analysis of CD163 and CD86 expression in shCTSL-transfected or shNC-transfected THP-1 cells; scale bar, 20 μm; F: Quantitative real-time polymerase chain reaction analysis of mRNAs extracted from shCTSL-treated or shNC-treated macrophages induced into the M0/M1/M2 state in vitro; the results revealed increased M1 and decreased M2 marker mRNA levels in shCTSL-treated macrophages. The error bars represent the SD; cP < 0.001; bP < 0.01; aP < 0.05 according to one-way analysis of variance. CTSL: Cathepsin L; DAPI: 4',6-diamidino-2-phenylindole; TNF-α: Tumor necrosis factor-α; IL: Interleukin; Arg-1: Arginase 1.
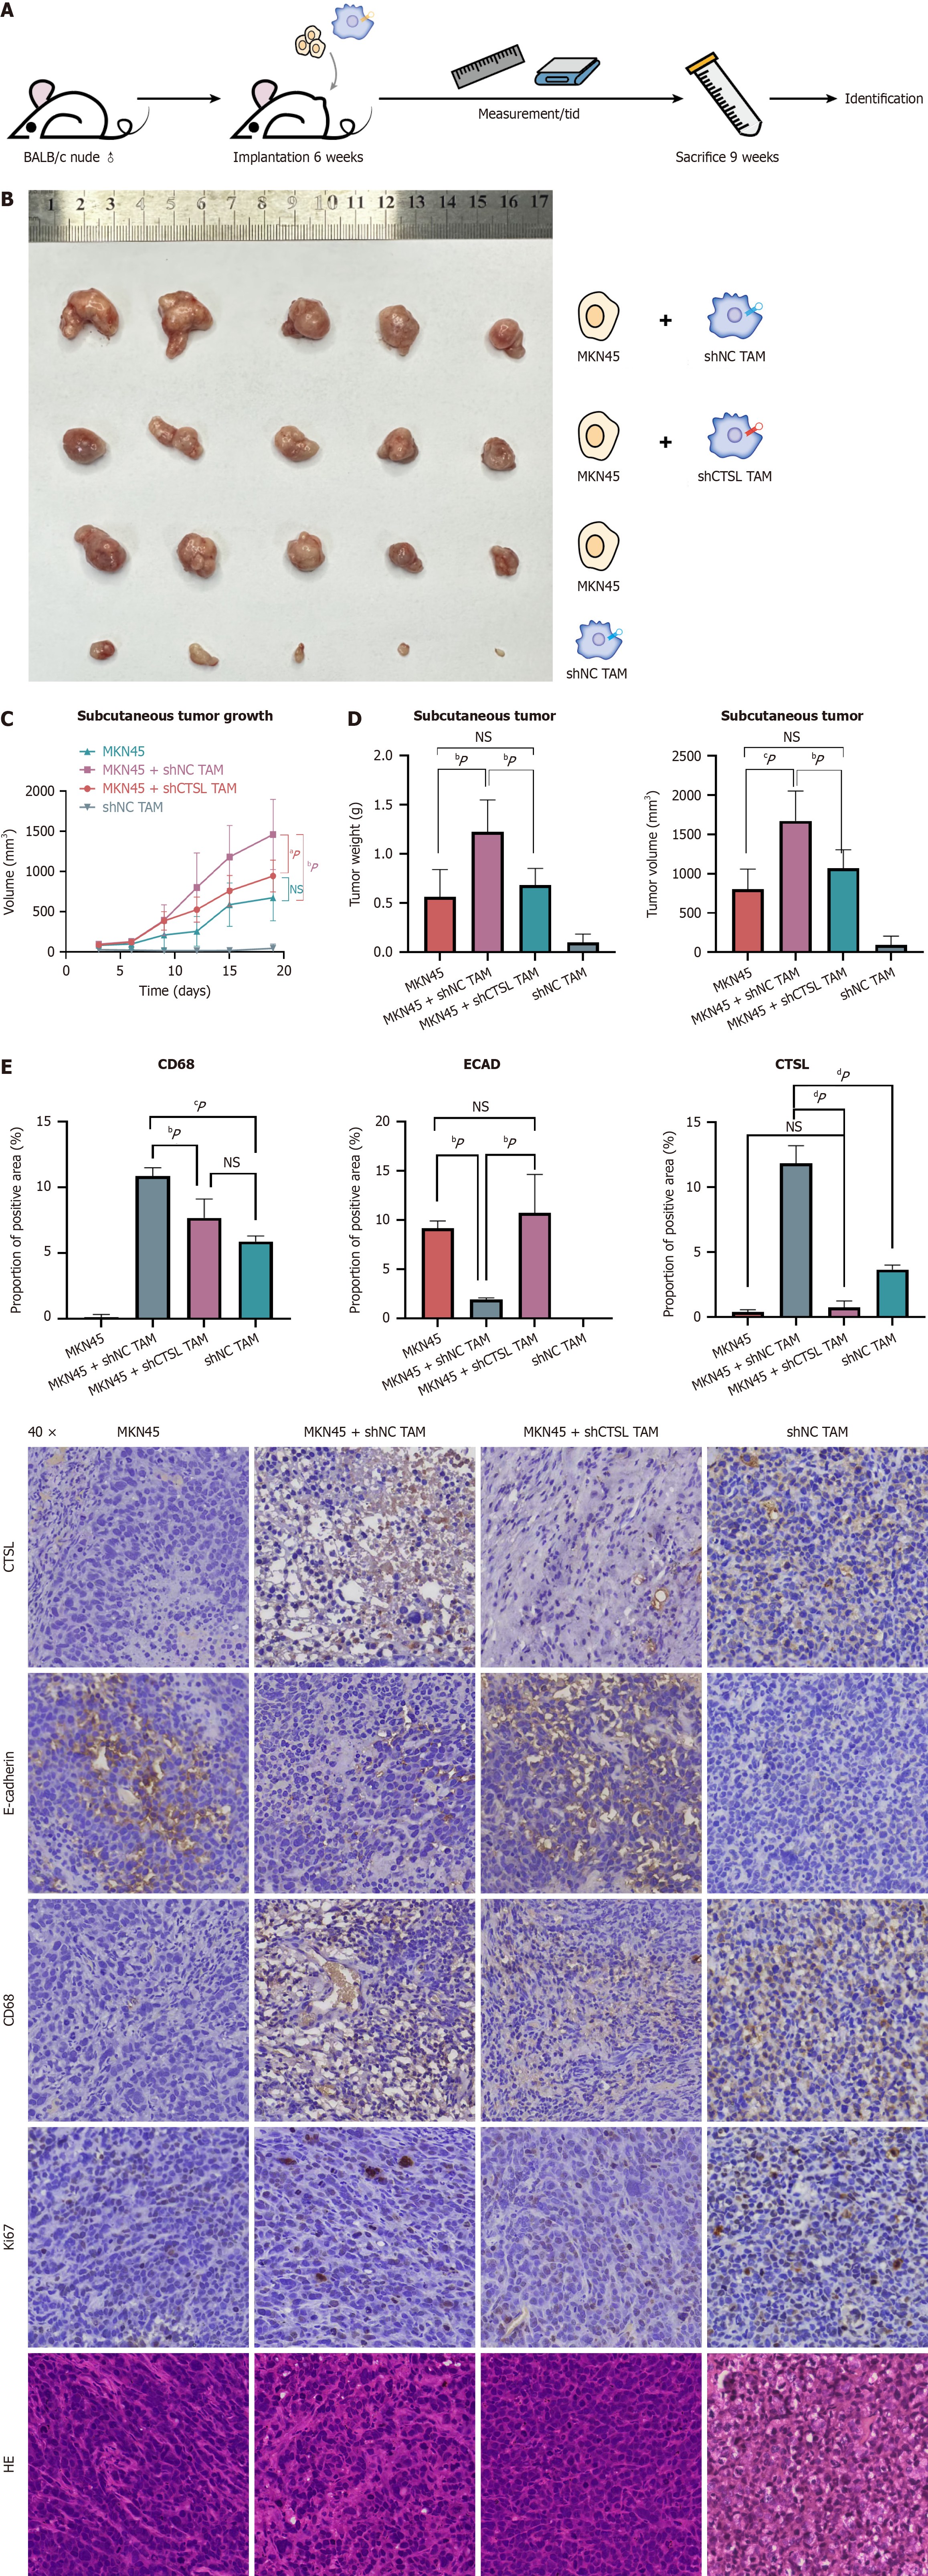
Figure 5 Cathepsin L knockdown impairs macrophage-induced gastric cancer tumorigenesis in vivo.
A: Experimental design of the animal study. Wild type male BALB/c nude mice had MKN45 cells implanted into the subcutaneous space and were mixed with either sh cathepsin L (CTSL) or shNC tumor-associated macrophage (TAM); B: Morphological characteristics of tumors in the MKN45 + shNC TAM, MKN45 + shCTSL TAM, MKN45 alone, and shNC TAM groups; C: Volume of tumor growth at the indicated time points over 3 days. The error bars represent the SD; D: Tumor weight and volume ex vivo. The error bars represent the SD. bP < 0.01; aP < 0.05 according to one-way analysis of variance (ANOVA); E: Immunohistochemistry analysis of mouse tumor sections from different groups stained for CTSL, E-cadherin, CD68, and Ki67 proteins. Magnification, 40 ×. Quantification of E-cadherin, CTSL, and CD68 protein expression was performed via Image J. The error bars represent the SD. NS: Not significant, P > 0.05; aP < 0.05; bP < 0.01; cP < 0.001 according to one-way ANOVA. TAM: Tumor-associated macrophage; HE: Haematoxylin and eosin; CTSL: Cathepsin L.
- Citation: Xiao LX, Li XJ, Yu HY, Qiu RJ, Zhai ZY, Ding WF, Zhu MS, Zhong W, Fang CF, Yang J, Chen T, Yu J. Macrophage-derived cathepsin L promotes epithelial-mesenchymal transition and M2 polarization in gastric cancer. World J Gastroenterol 2024; 30(47): 5032-5054
- URL: https://www.wjgnet.com/1007-9327/full/v30/i47/5032.htm
- DOI: https://dx.doi.org/10.3748/wjg.v30.i47.5032


