Copyright
©The Author(s) 2024.
World J Gastroenterol. Dec 21, 2024; 30(47): 4991-5006
Published online Dec 21, 2024. doi: 10.3748/wjg.v30.i47.4991
Published online Dec 21, 2024. doi: 10.3748/wjg.v30.i47.4991
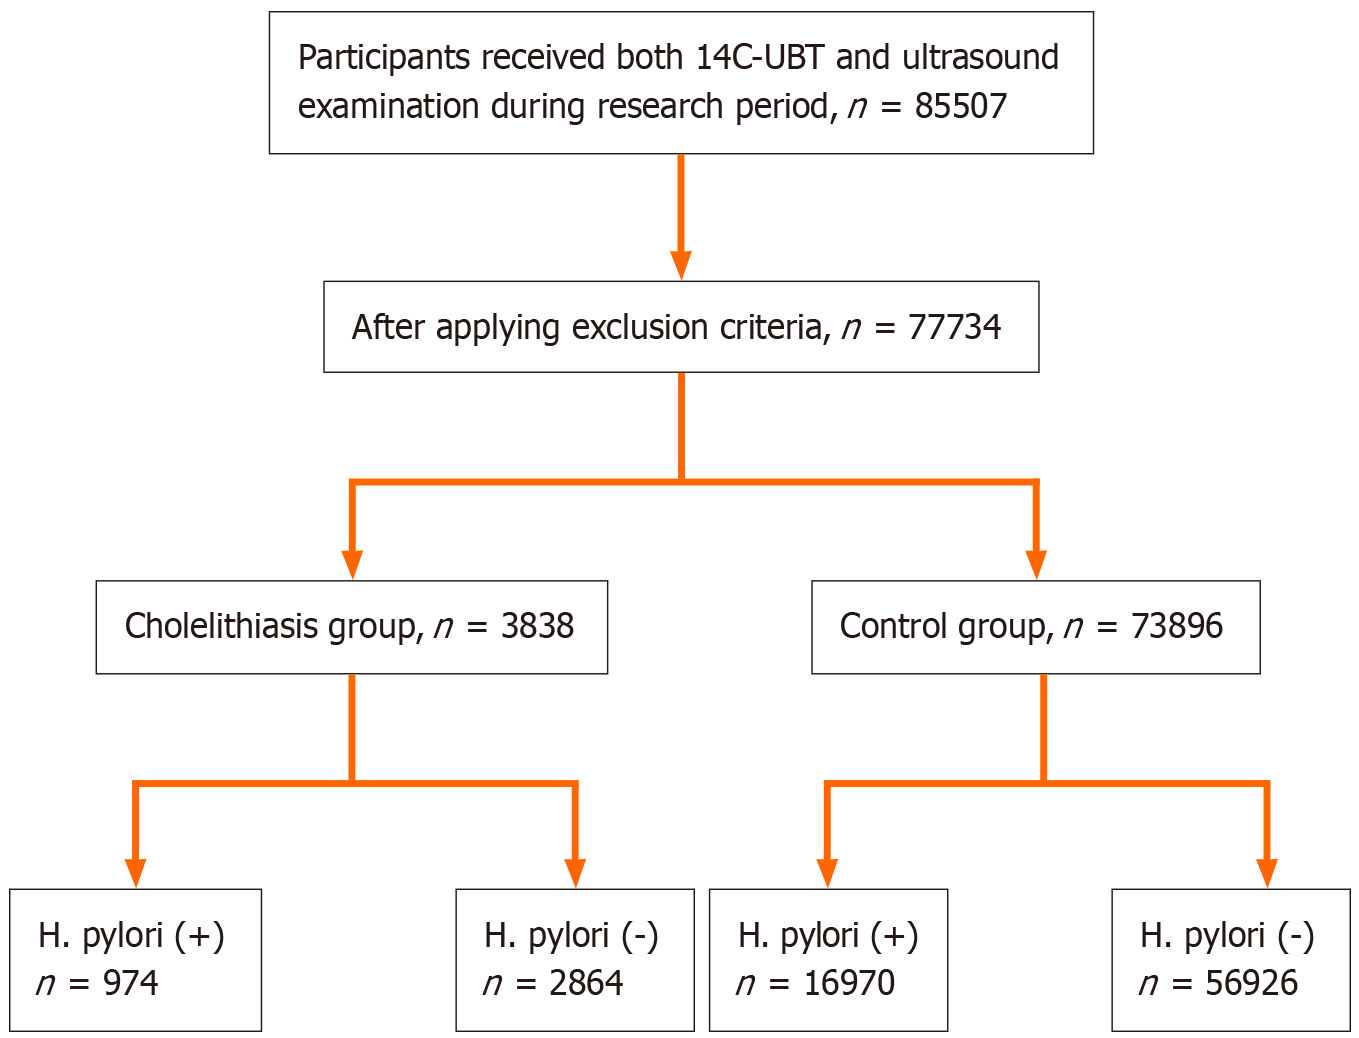
Figure 1 The flow chart of the study subjects screening process.
H. pylori: Helicobacter pylori; 14C-UBT: 14C urease breath test; H. pylori (+): Helicobacter pylori-positive; H. pylori (-): Helicobacter pylori-negative (detailed data shown in Table 1).
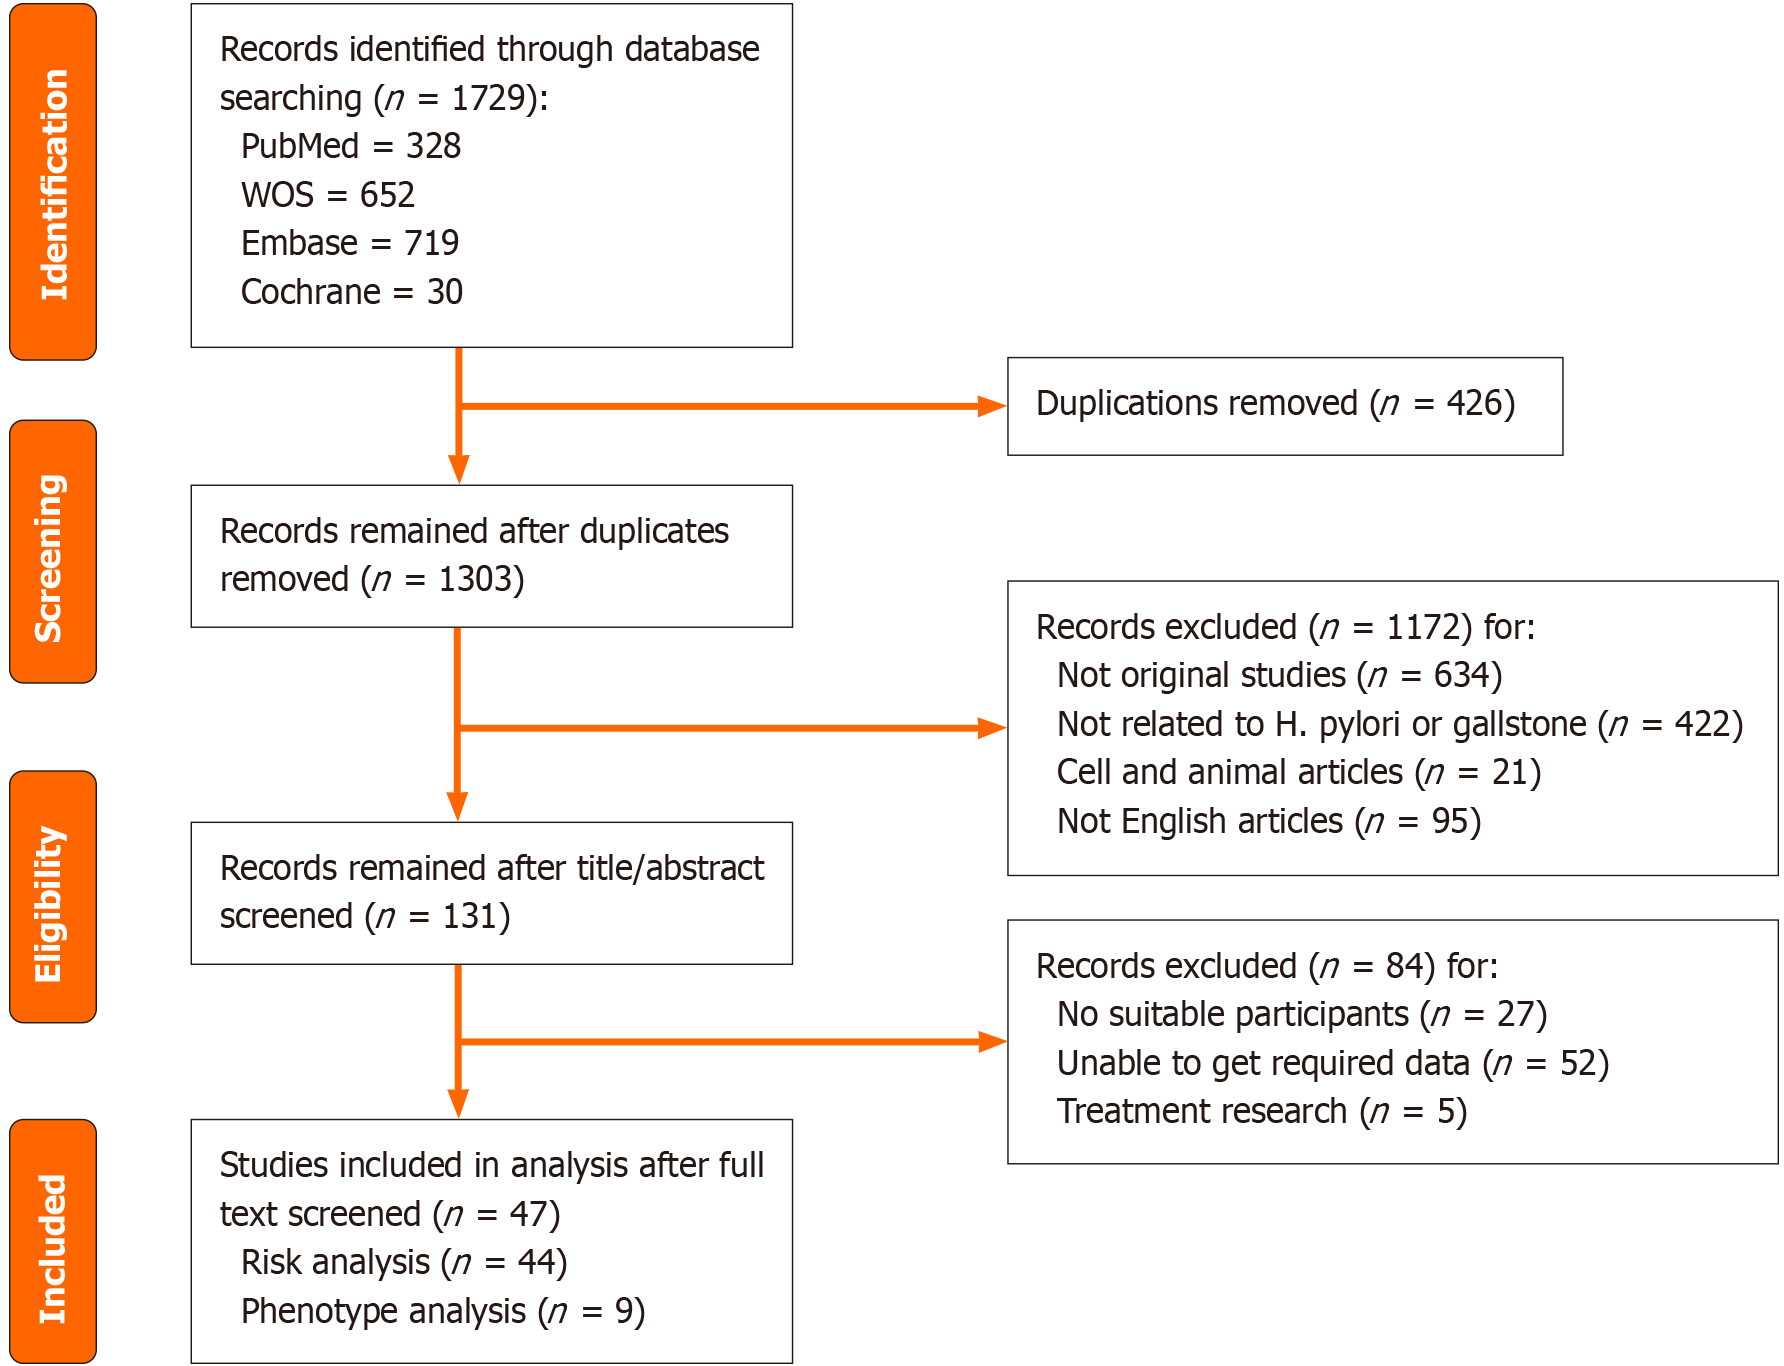
Figure 2 The flow chart of the literature screening process.
Detailed included articles shown in Table 4. H. pylori: Helicobacter pylori; WOS: Wed of Science.
Figure 3 The distribution of sample sources and detection methods for Helicobacter pylori of included studies.
A: Sample sources for Helicobacter pylori; B: Detection methods for Helicobacter pylori. Detailed data shown in Table 4. 13C/14C-UBT: 13C or 14C urease breath test; CLO: Campylobacter-like organism; PCR: Polymerase chain reaction.
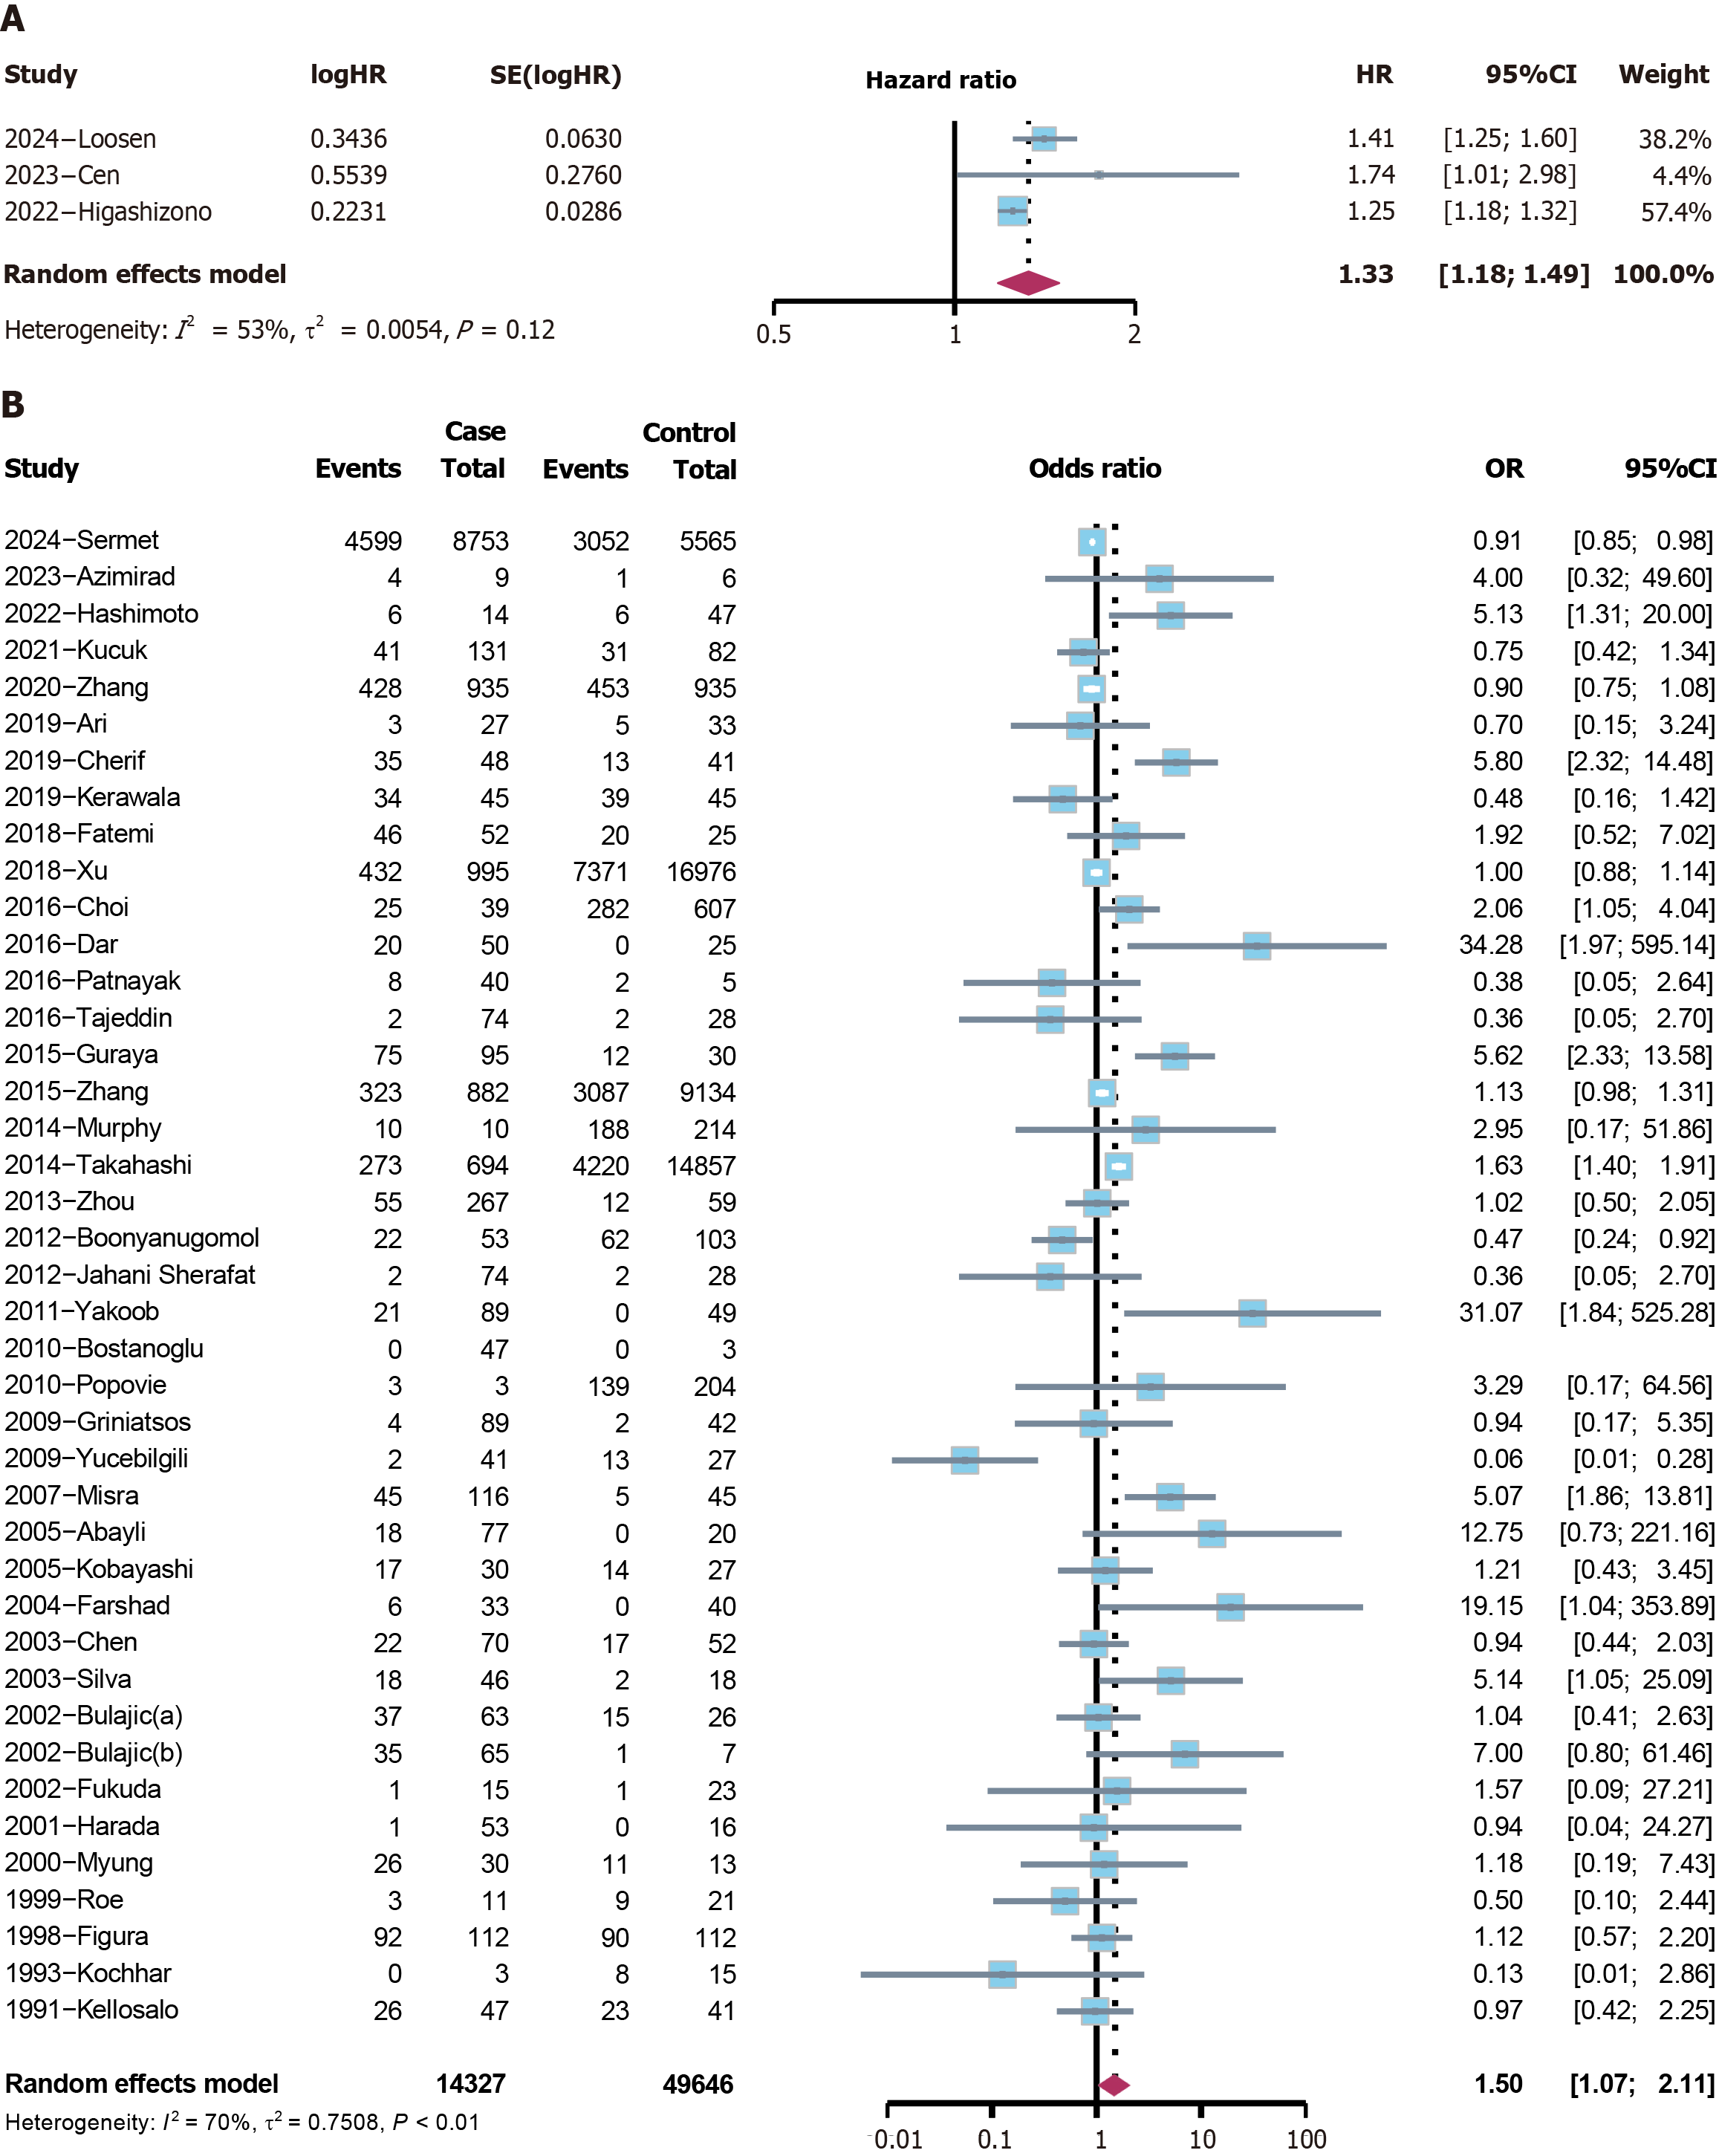
Figure 4 The forest plot of the 44 included studies for the risk analysis of cholelithiasis.
A: Cohort studies; B: Case-control and cross-sectional studies. HR: Hazard ratio; CI: Confidence interval; OR: Odds ratio.
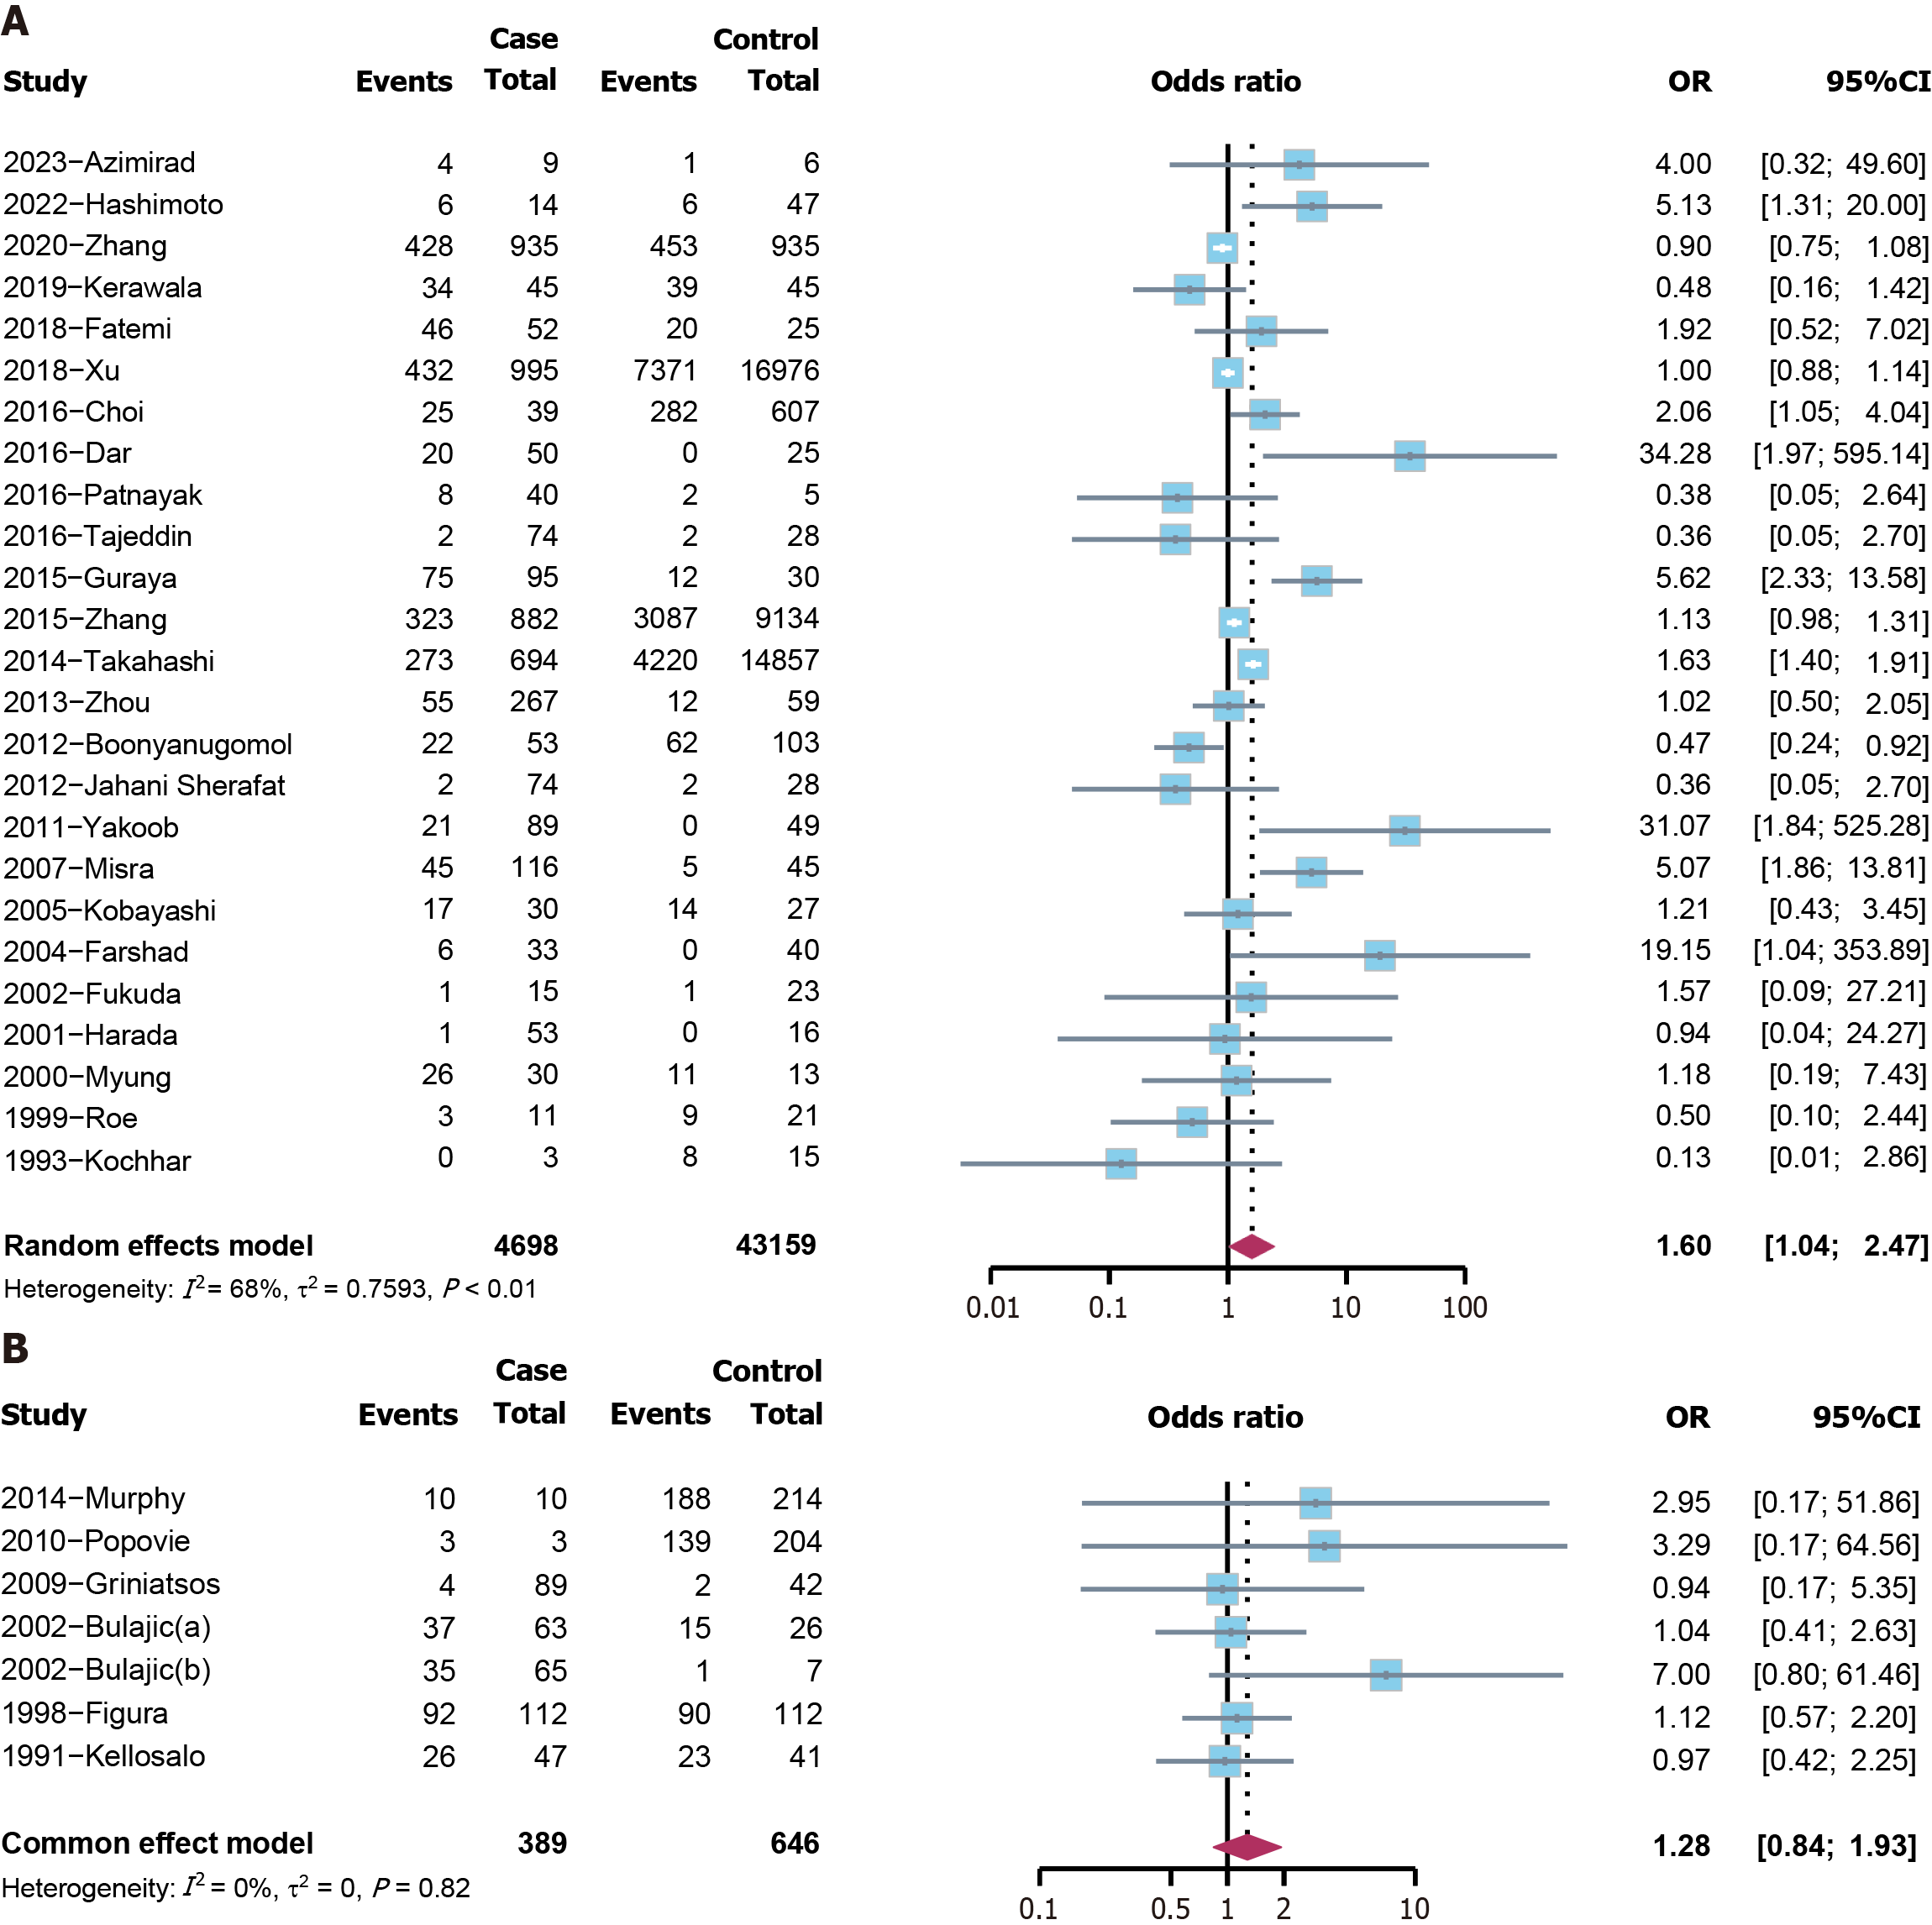
Figure 5 The results of subgroup risk analyses of cholelithiasis.
A: The subgroup analysis of studies in Asia; B: The subgroup analysis of studies in Europe. CI: Confidence interval; OR: Odds ratio.
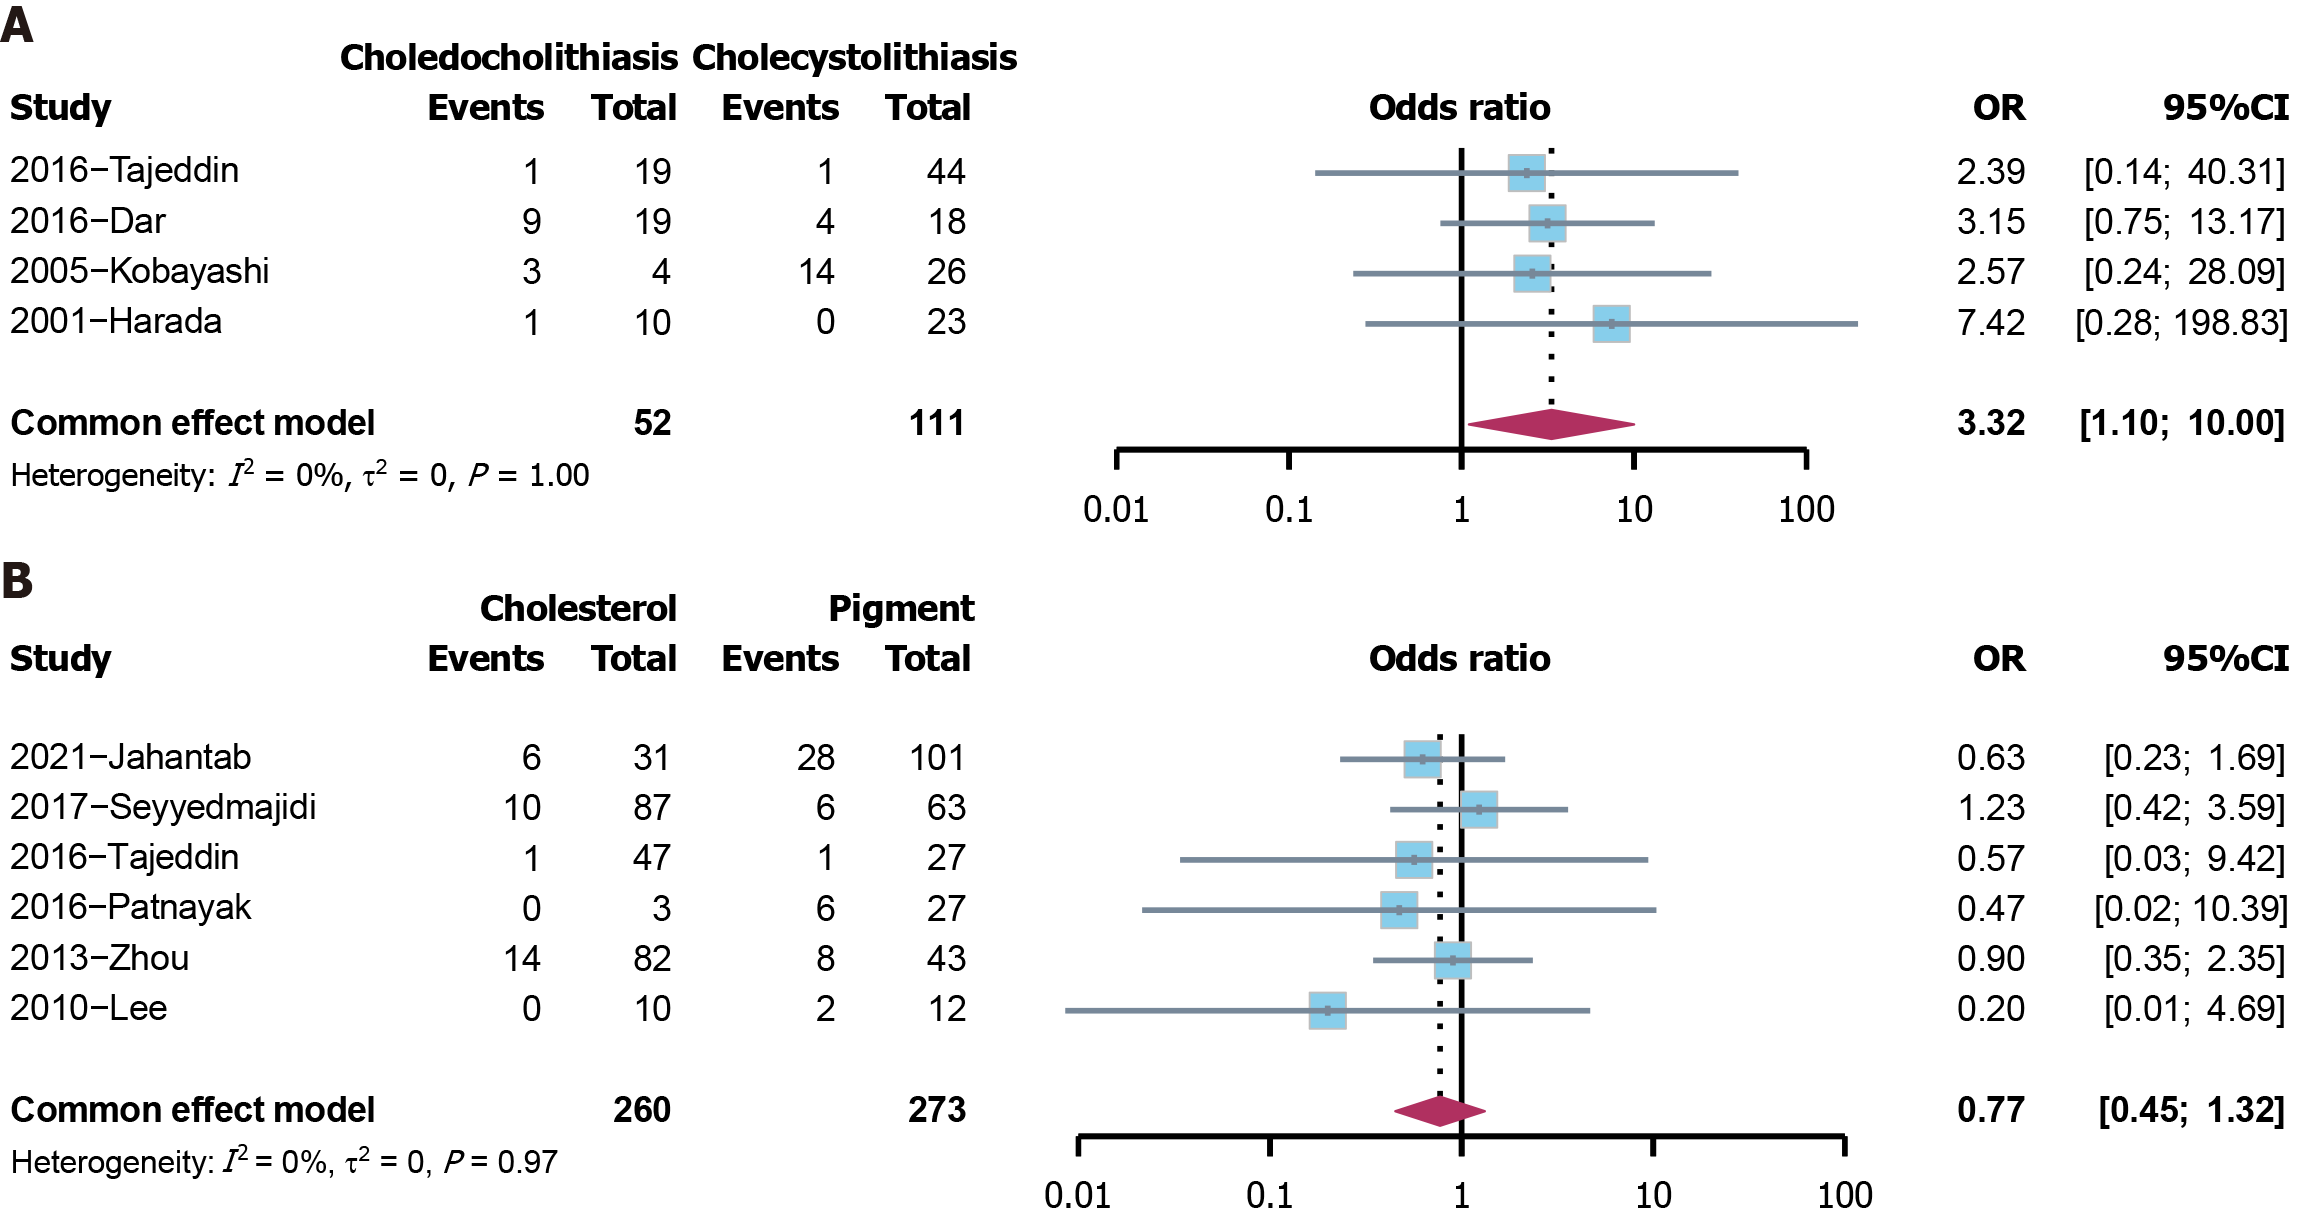
Figure 6 The results of phenotype analysis of cholelithiasis.
A: The analysis of position of stones; B: The analysis of chemical components of stones. CI: Confidence interval; OR: Odds ratio.
- Citation: Yao SY, Li XM, Cai T, Li Y, Liang LX, Liu XM, Lei YF, Zhu Y, Wang F. Helicobacter pylori infection is associated with the risk and phenotypes of cholelithiasis: A multi-center study and meta-analysis. World J Gastroenterol 2024; 30(47): 4991-5006
- URL: https://www.wjgnet.com/1007-9327/full/v30/i47/4991.htm
- DOI: https://dx.doi.org/10.3748/wjg.v30.i47.4991


