Copyright
©The Author(s) 2024.
World J Gastroenterol. Dec 14, 2024; 30(46): 4937-4946
Published online Dec 14, 2024. doi: 10.3748/wjg.v30.i46.4937
Published online Dec 14, 2024. doi: 10.3748/wjg.v30.i46.4937
Figure 1 Schematic of gallbladder incision and duodenal anastomosis.
A and B: Incision site of skin and peritoneum of C57BL/6 mice; C: A suture for connecting the gallbladder and duodenum is positioned at 12 o'clock (also referred to as 0°), 5 o'clock (or 150°), and 9 o'clock (or 270°) in an interrupted manner.
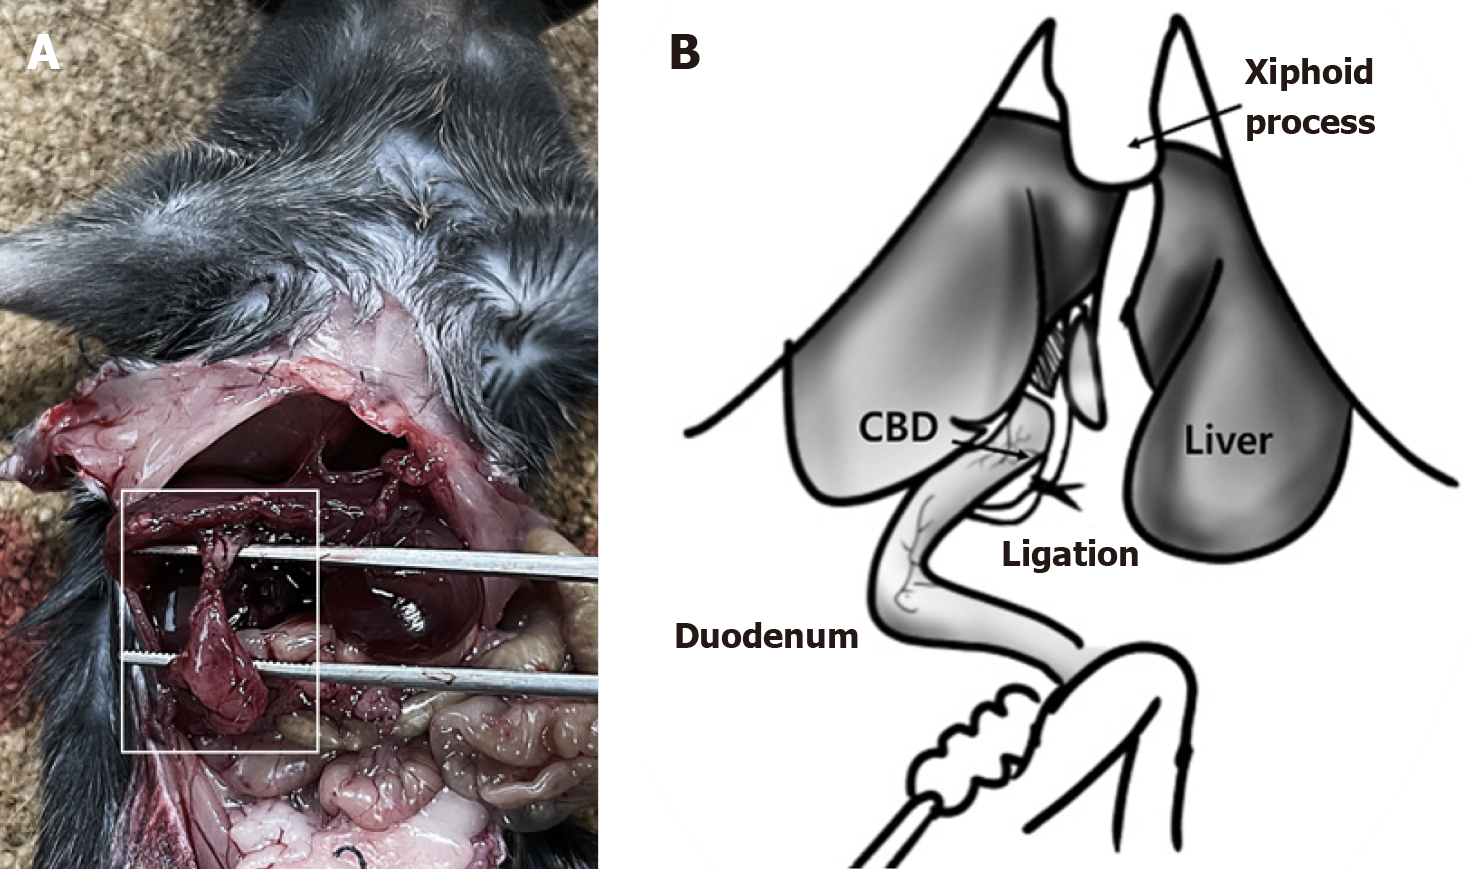
Figure 2 Cholecystoduodenal anastomosis 14 days postoperatively.
A: The gallbladder and duodenum are directly connected after surgery; B: Illustration of common bile duct (CBD) ligation in a cholecystoduodenal anastomosis mouse model. Patency between the gallbladder and duodenum is confirmed by ligation of the CBD. CBD: Common bile duct.
Figure 3 Proinflammatory cytokine levels in the surgical mouse model of cholecystoduodenal anastomosis and control.
Interleukin-6 and tumor necrosis factor-α levels in the serum of each mouse from the portal vein and postcaval vein measured using enzyme-linked immunosorbent assay. A and B: Portal vein; C and D: Postcaval vein. Data are represented as the mean ± SD. CTL: Control; TNF-α: Tumor necrosis factor; IL-6: Interleukin-6.
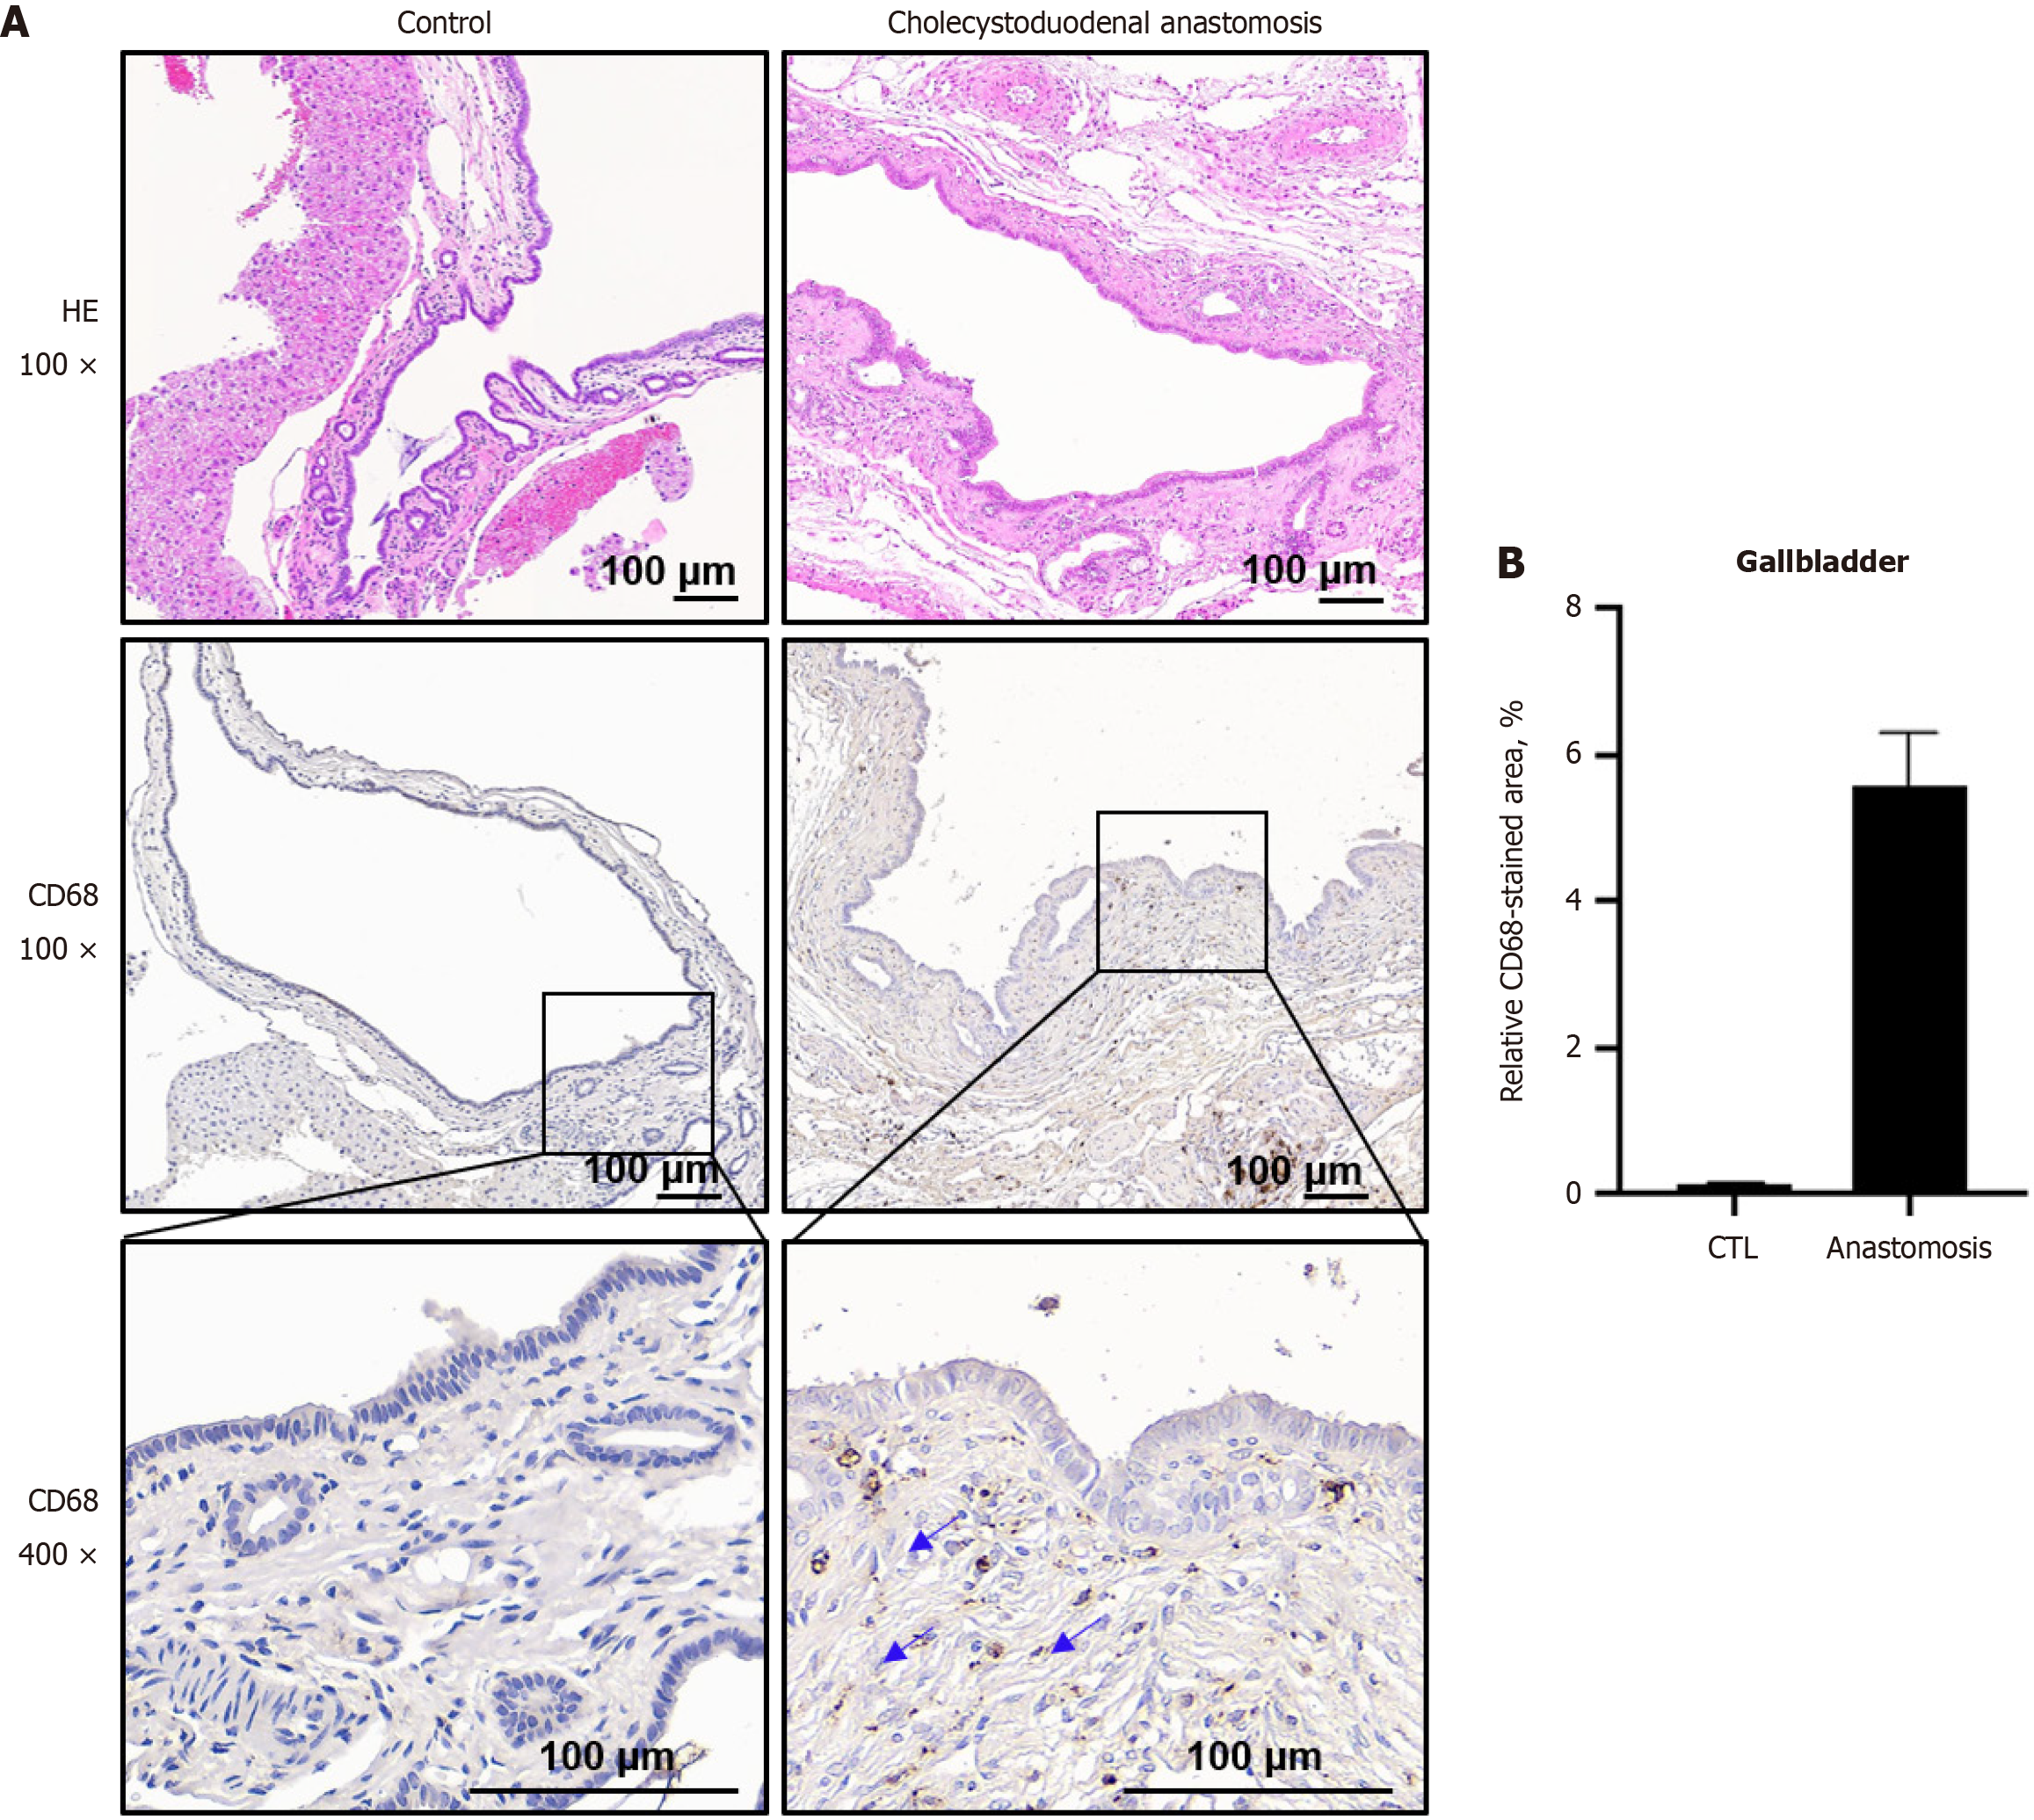
Figure 4 Structural changes and inflammation in the gallbladder epithelium of control and cholecystoduodenal anastomosis mice.
A: Upper panel: Hematoxylin and eosin staining of the gallbladder epithelium from control and cholecystoduodenal anastomosis mice. Lower panel: Immunohistochemical staining with CD68 in gallbladder tissues from control mice (left) and cholecystoduodenal anastomosis mice (right); B: Relative CD68-stained area was represented as the mean ± SD. CTL: Control.
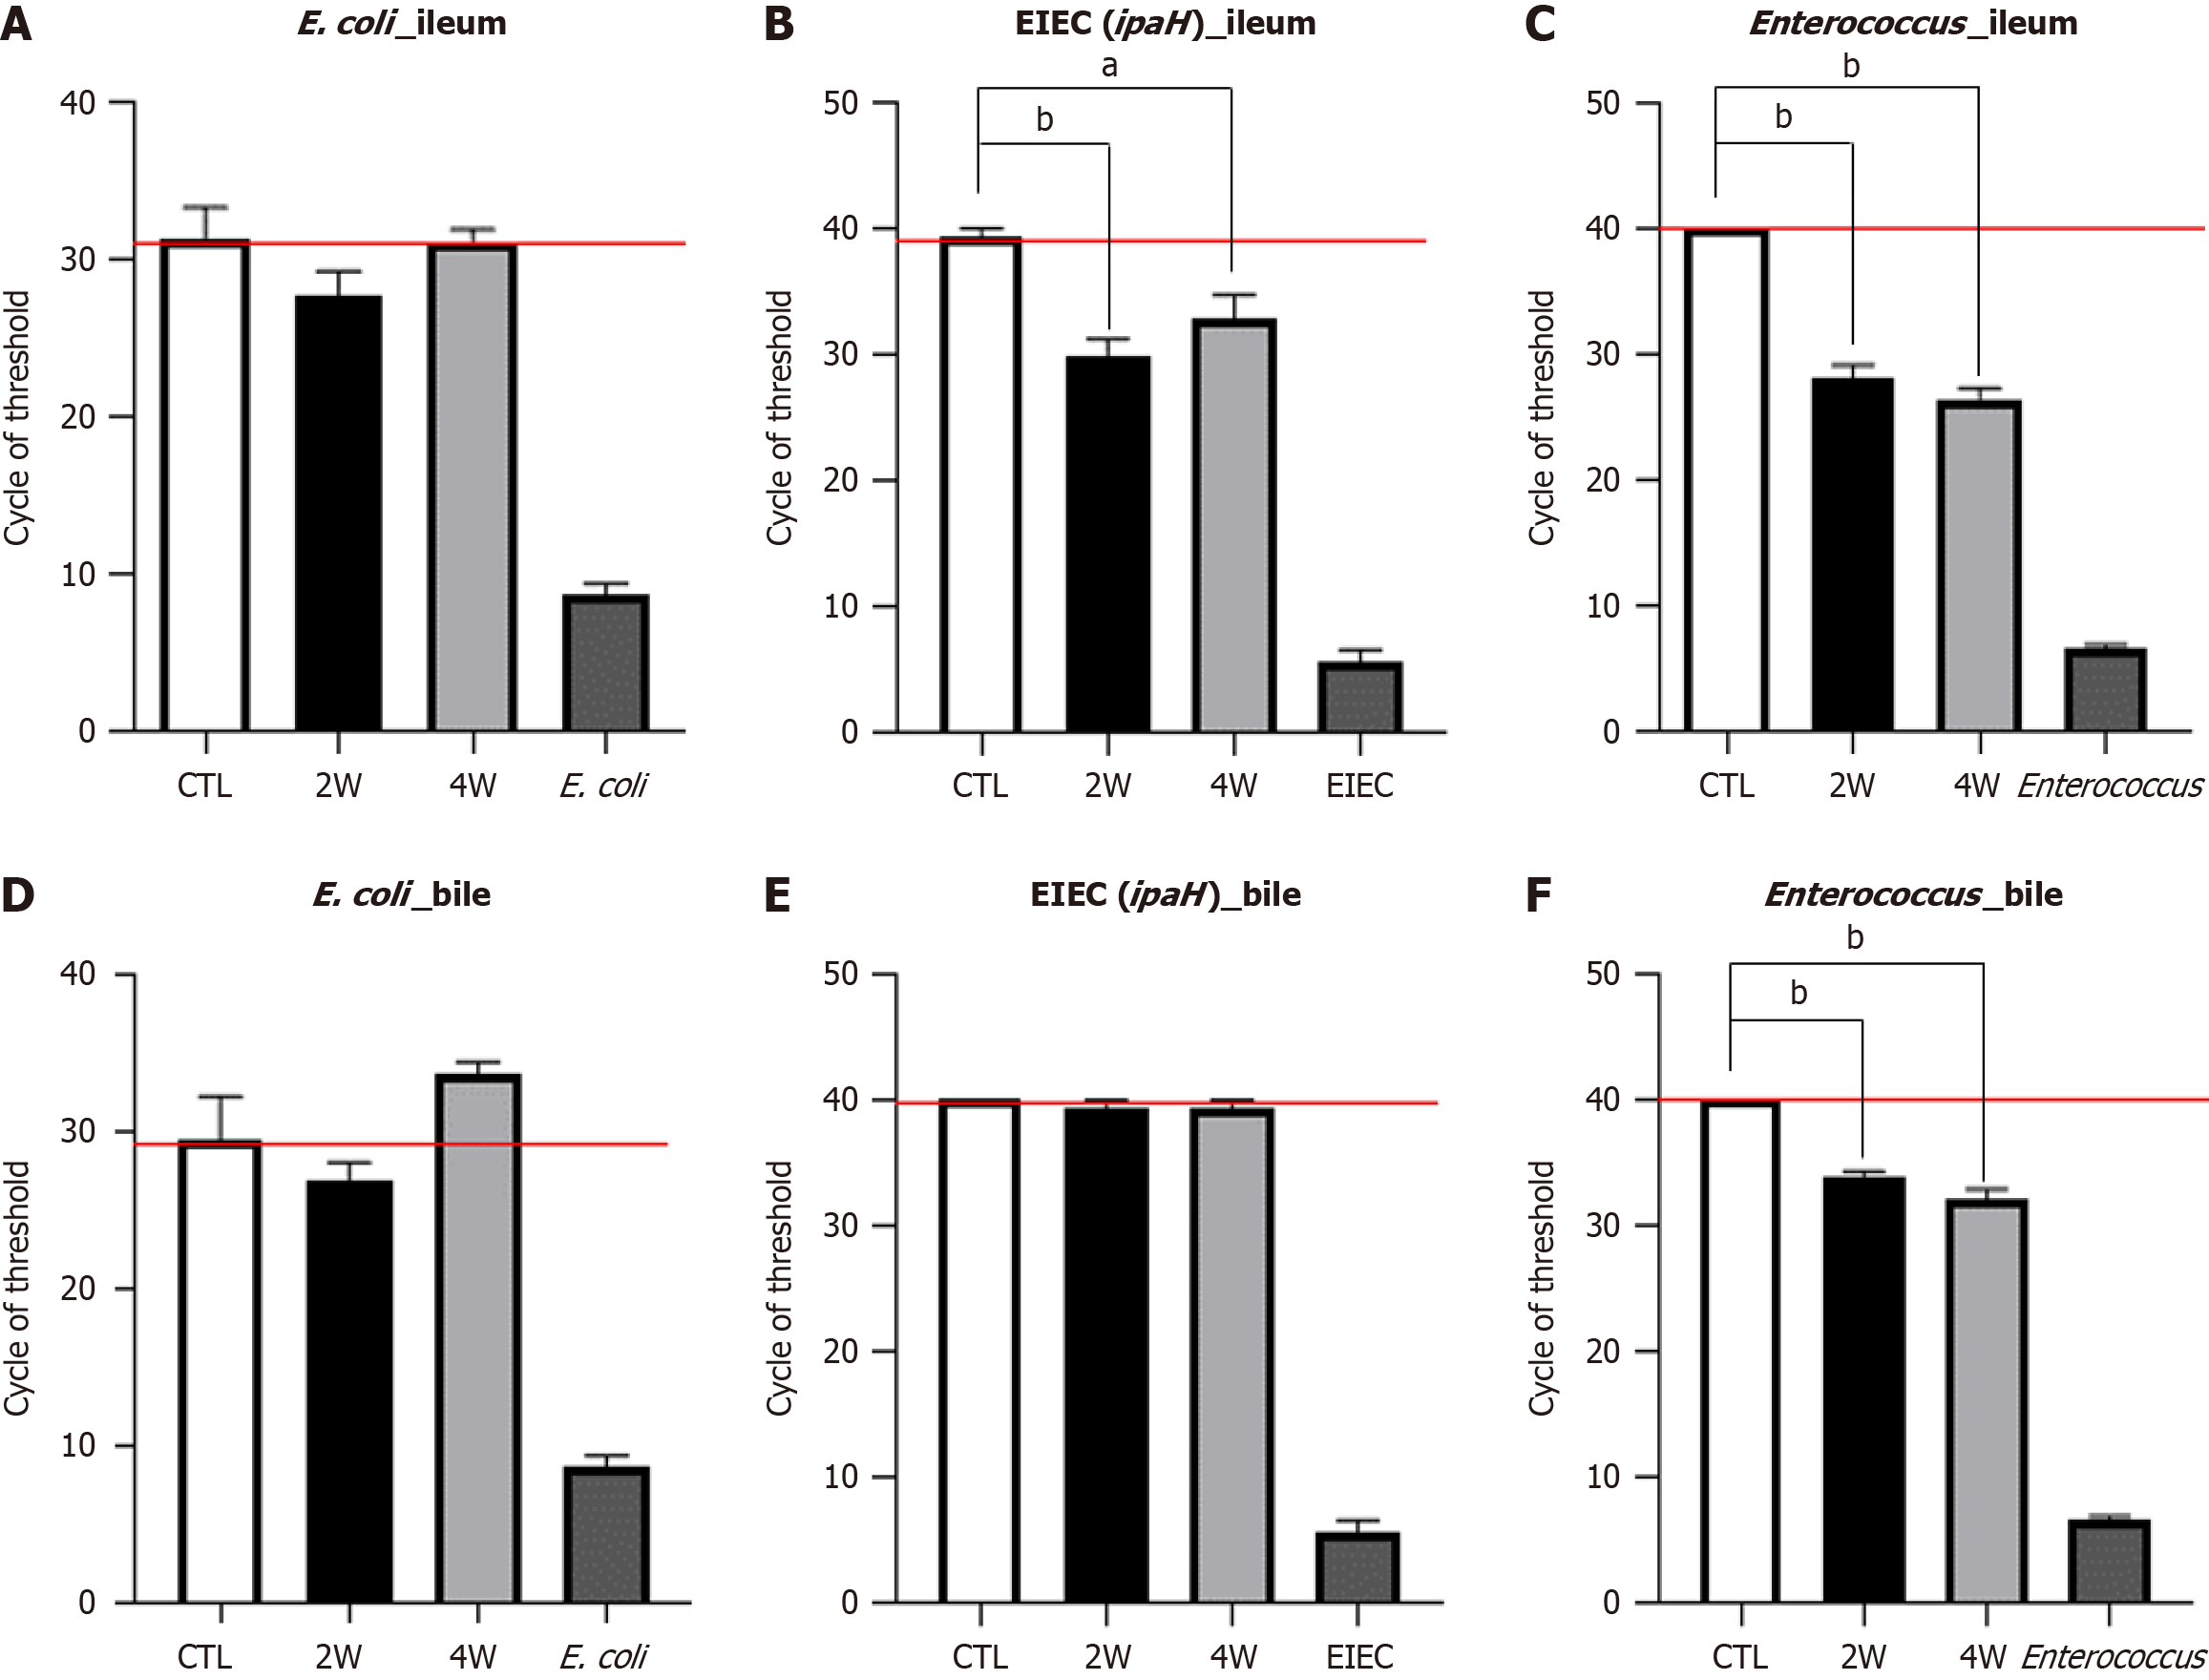
Figure 5 Quantitative reverse transcription-polymerase chain reaction analysis of 16s rRNA and ipaH genes in the ileum and bile of cholecystoduodenal anastomosis mice after injection of bacteria.
A: The mixture of Escherichia coli and Enterococcus was orally administered to cholecystoduodenal anastomosis mice. Bacterial gene was detected in the ileum using specific 16s rRNA primers; B-F: Cycle threshold (CT) of bacterial gene expression detected in the ileum and bile using EIEC-specific ipaH gene primers and 16s rRNA primers. Values are normalized to GAPDH levels and are represented as the mean ± SD. aP < 0.01, bP < 0.001 vs corresponding controls. 2W: 2 weeks after injection; 4W: 4 weeks after injection; CTL: Control; E. coli: Escherichia coli.
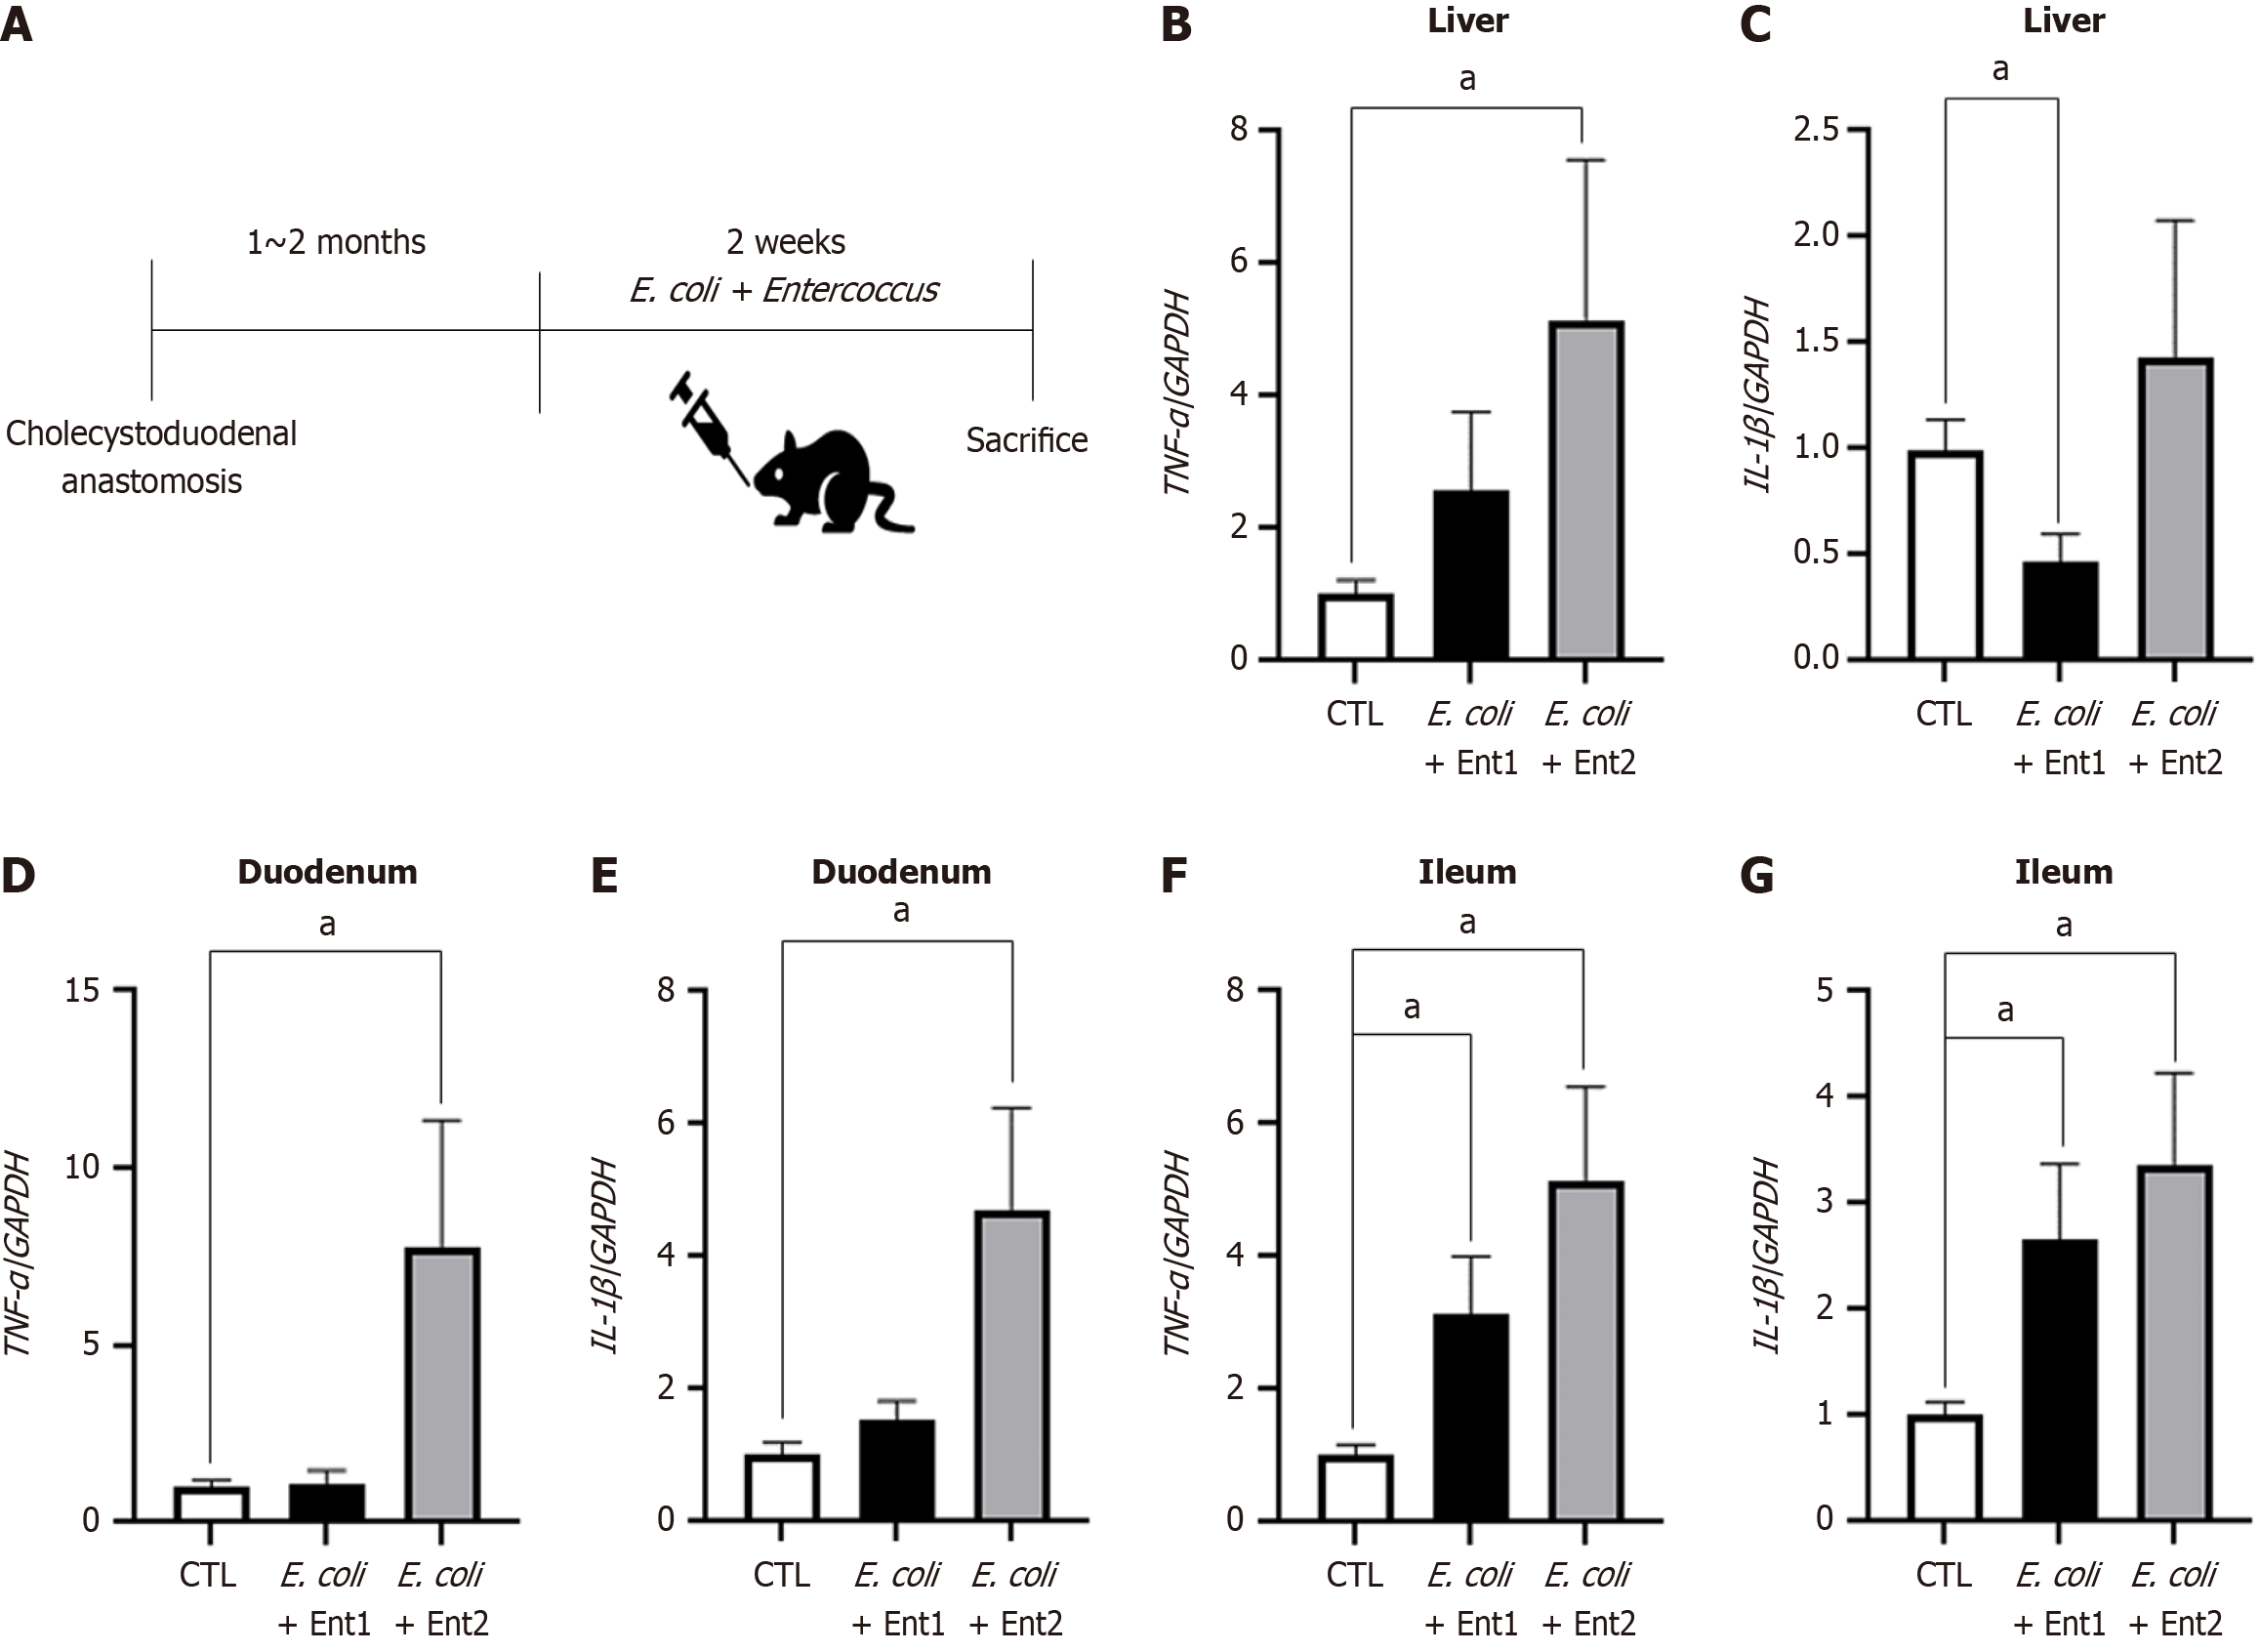
Figure 6 mRNA levels of proinflammatory cytokines in cholecystoduodenal anastomosis and control mice.
Mixture of Escherichia coli and Enterococcus (E. coli + Ent1: 6 × 10⁸ and E. coli + Ent2: 3 × 10⁹) was orally administered to cholecystoduodenal anastomosis mice for 2 weeks. A: Injection schedule of bacteria; B-G: TNF-α and IL-1β mRNA levels in the liver, duodenum, and ileum of each group after injection of saline or harmful bacteria. Values are normalized to GAPDH levels and represented as the mean ± SD. aP < 0.05 vs corresponding controls. E. coli: Escherichia coli; TNF-α: Tumor necrosis factor-α; IL: Interleukin.
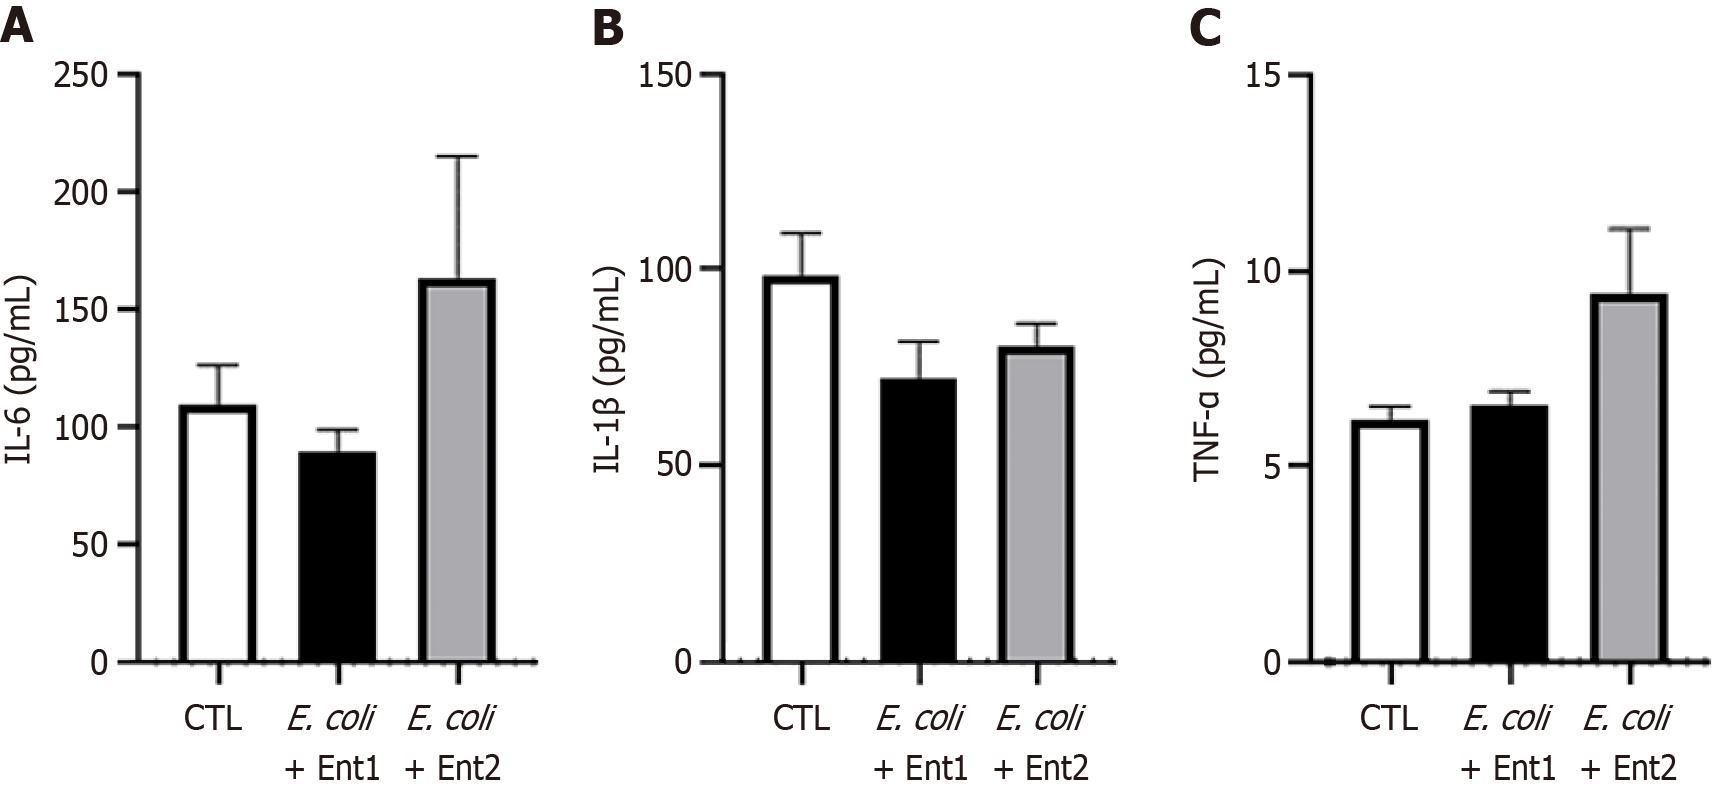
Figure 7 Serum proinflammatory cytokine levels in cholecystoduodenal anastomosis and control mice.
Interleukin (IL)-6, IL-1β, and tumor necrosis factor-α (TNF-α) levels in the serum of each mouse after injection of saline or harmful bacteria (E. coli + Ent1: 6 × 10⁸ and E. coli + Ent2: 3 × 10⁹). A: IL-6; B: IL-1β; C: TNF-α. Values are represented as the mean ± SD. E. coli: Escherichia coli; TNF-α: Tumor necrosis factor-α; IL: Interleukin.
- Citation: Jang Y, Kim JY, Han SY, Park A, Baek SJ, Lee G, Kang J, Ryu H, Kim SH. Establishment of a chronic biliary disease mouse model with cholecystoduodenal anastomosis for intestinal microbiome preservation. World J Gastroenterol 2024; 30(46): 4937-4946
- URL: https://www.wjgnet.com/1007-9327/full/v30/i46/4937.htm
- DOI: https://dx.doi.org/10.3748/wjg.v30.i46.4937


