Copyright
©The Author(s) 2024.
World J Gastroenterol. Dec 14, 2024; 30(46): 4880-4903
Published online Dec 14, 2024. doi: 10.3748/wjg.v30.i46.4880
Published online Dec 14, 2024. doi: 10.3748/wjg.v30.i46.4880
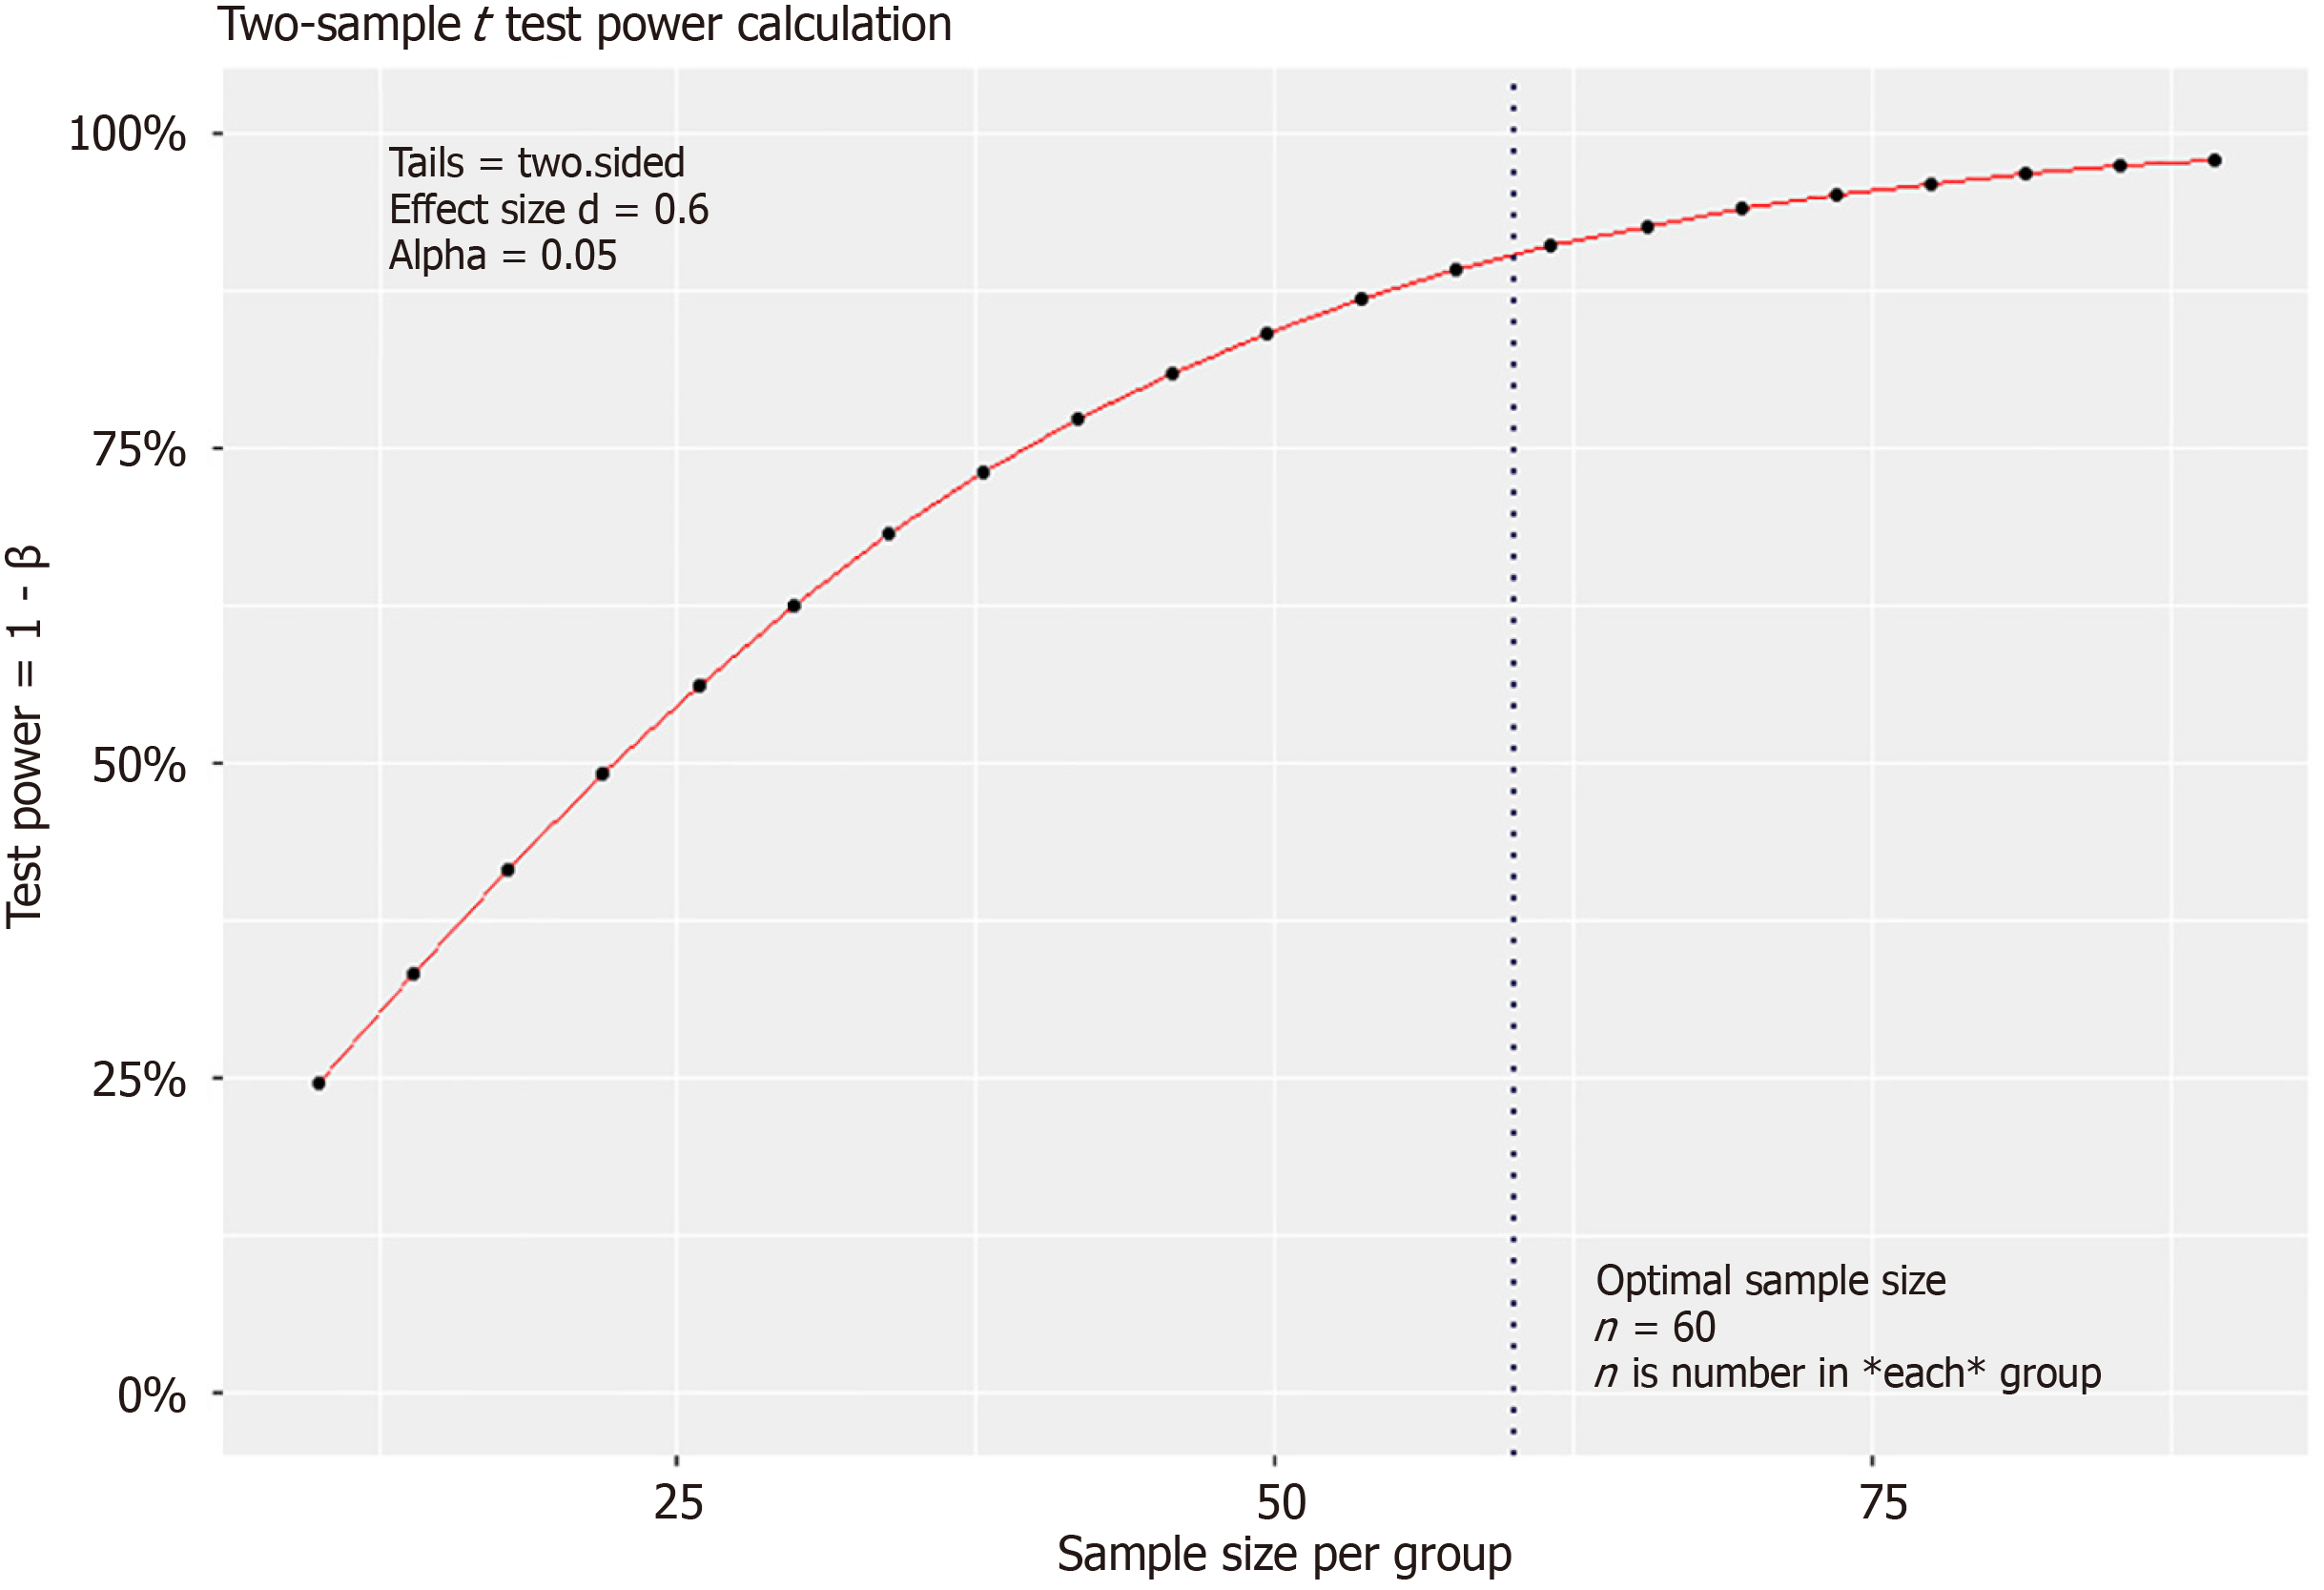
Figure 1 Graphic of sample size estimation.
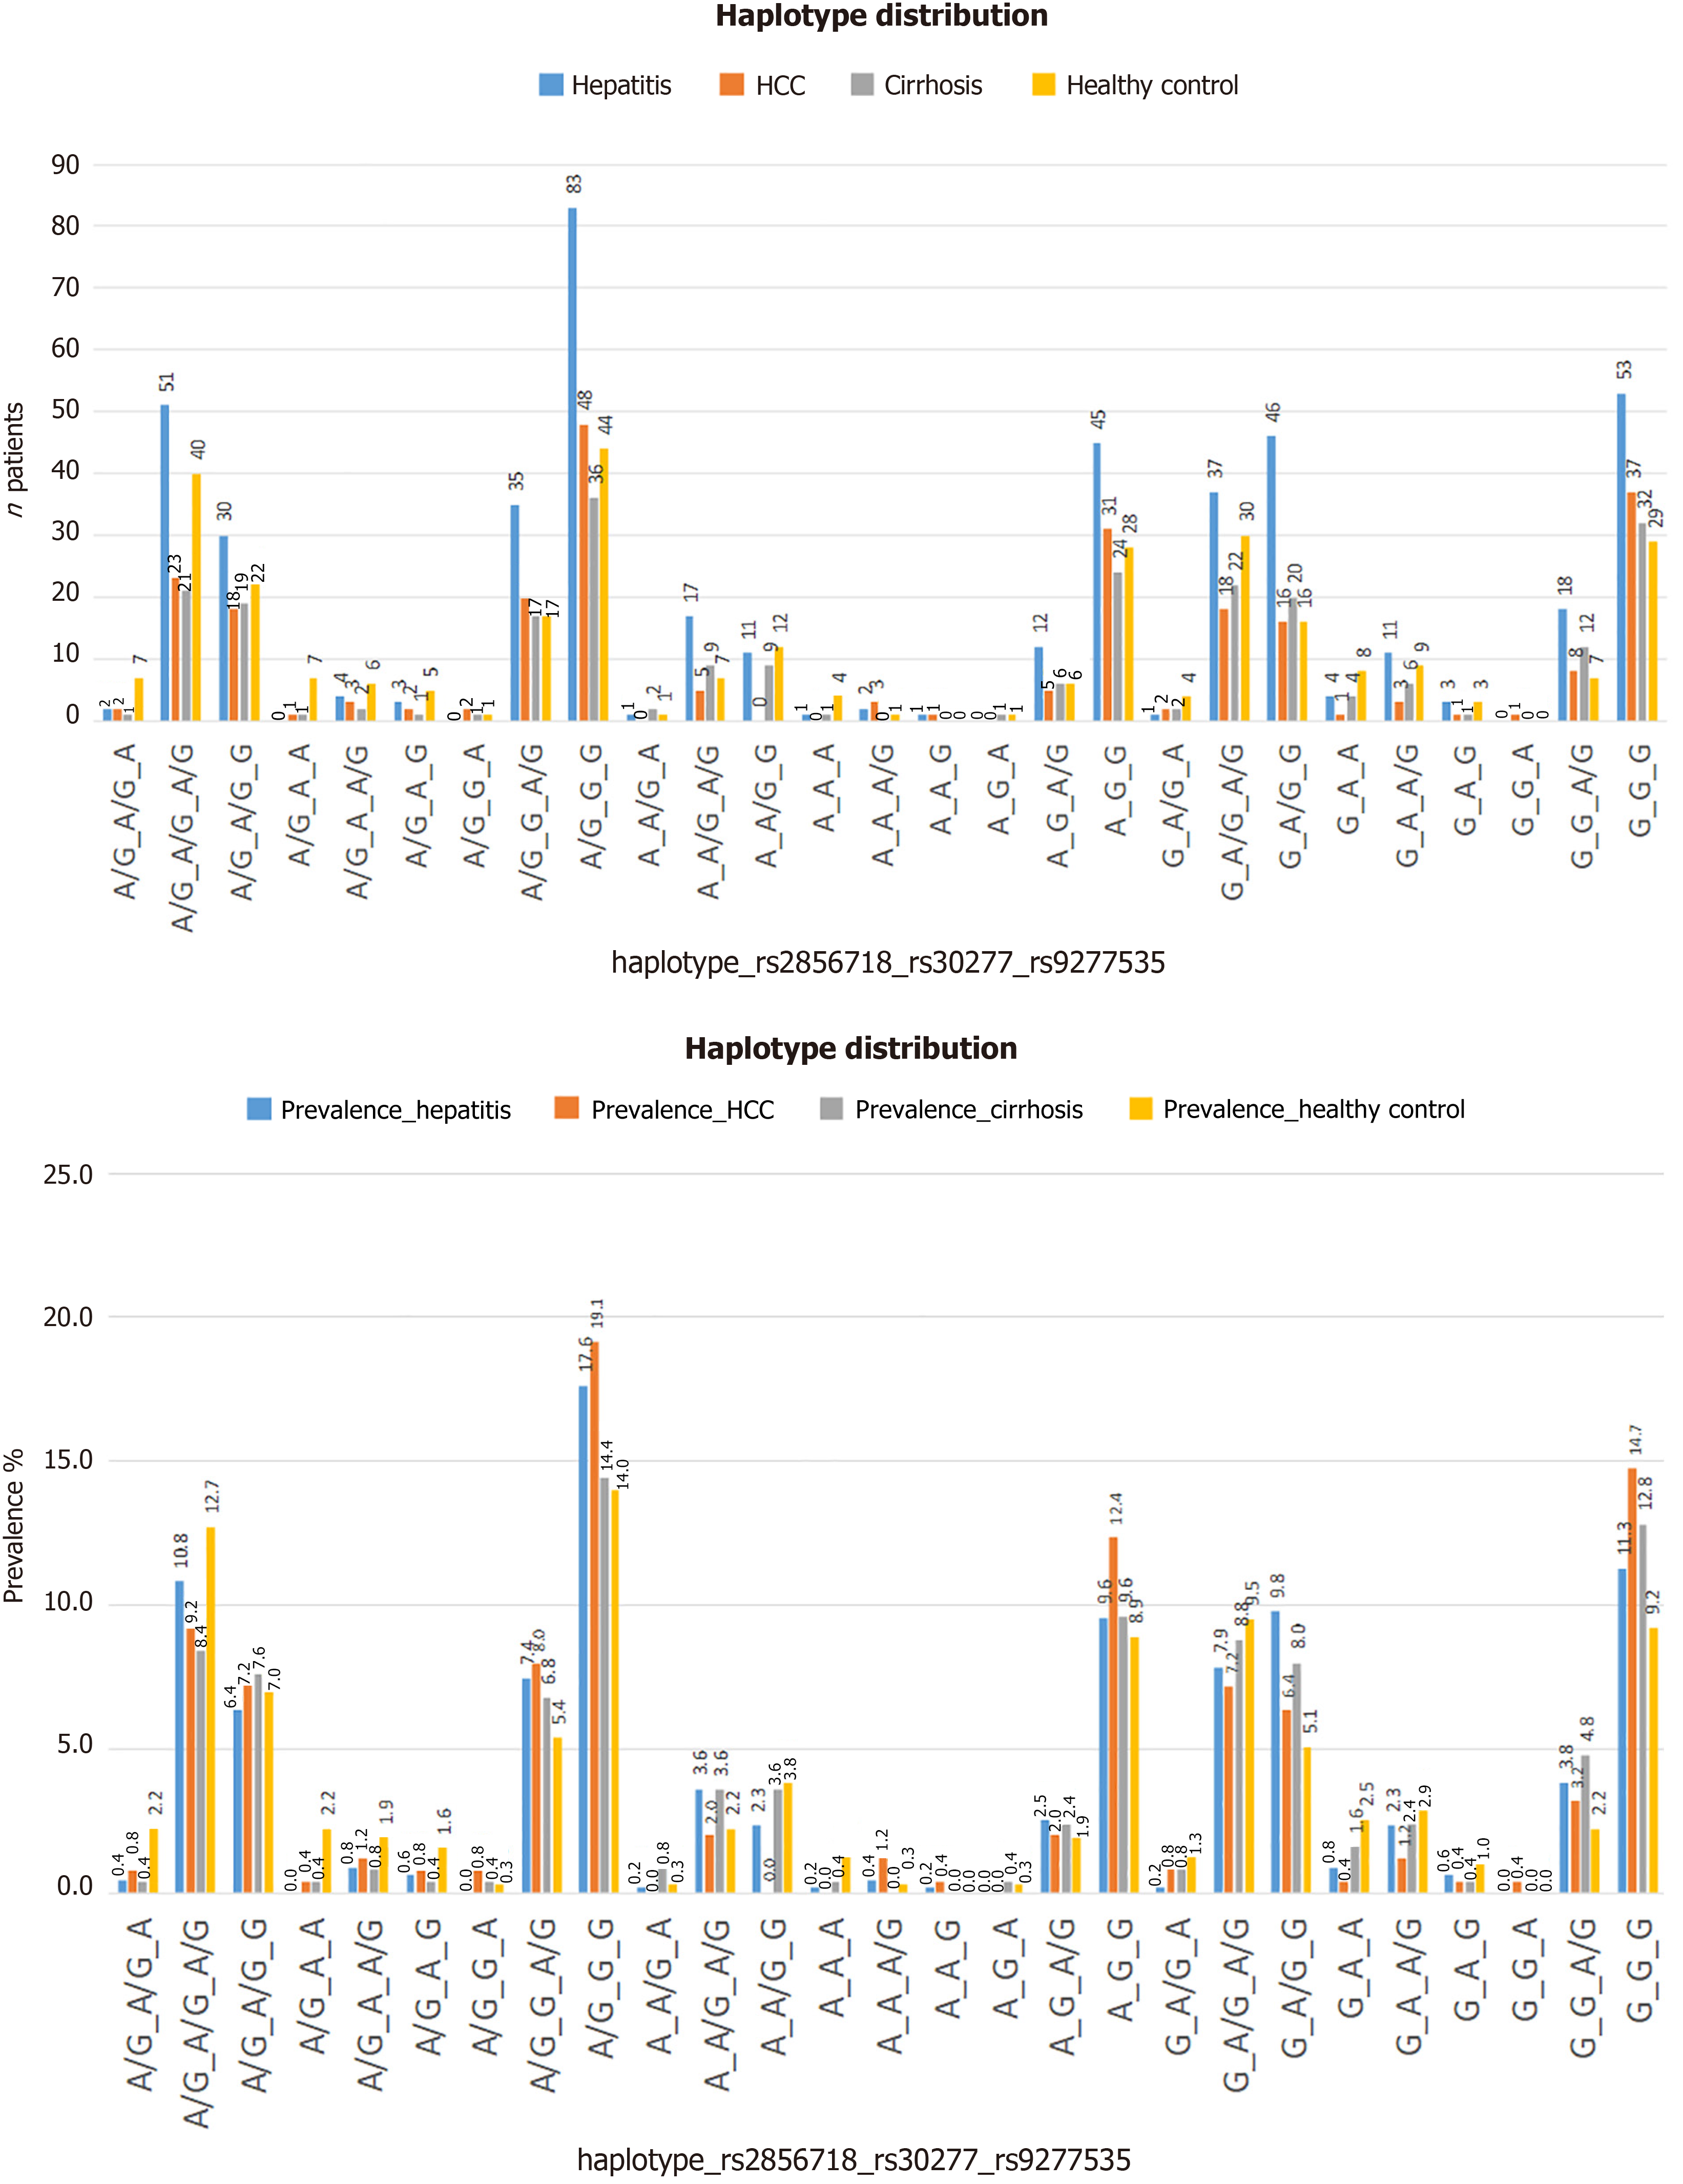
Figure 2 The distribution of genotype or haplotype combinations in each patient/participant group, in which haplotype A/G-G-G (in order of variation: Rs2856718, rs3077, rs9277535) had the highest frequency, especially in the hepatocellular carcinoma group (19.
1%, 48/250 patients). A: The distribution of genotype or haplotype combinations following the number of patients; B: The distribution of genotype or haplotype combinations following the prevalence (%).
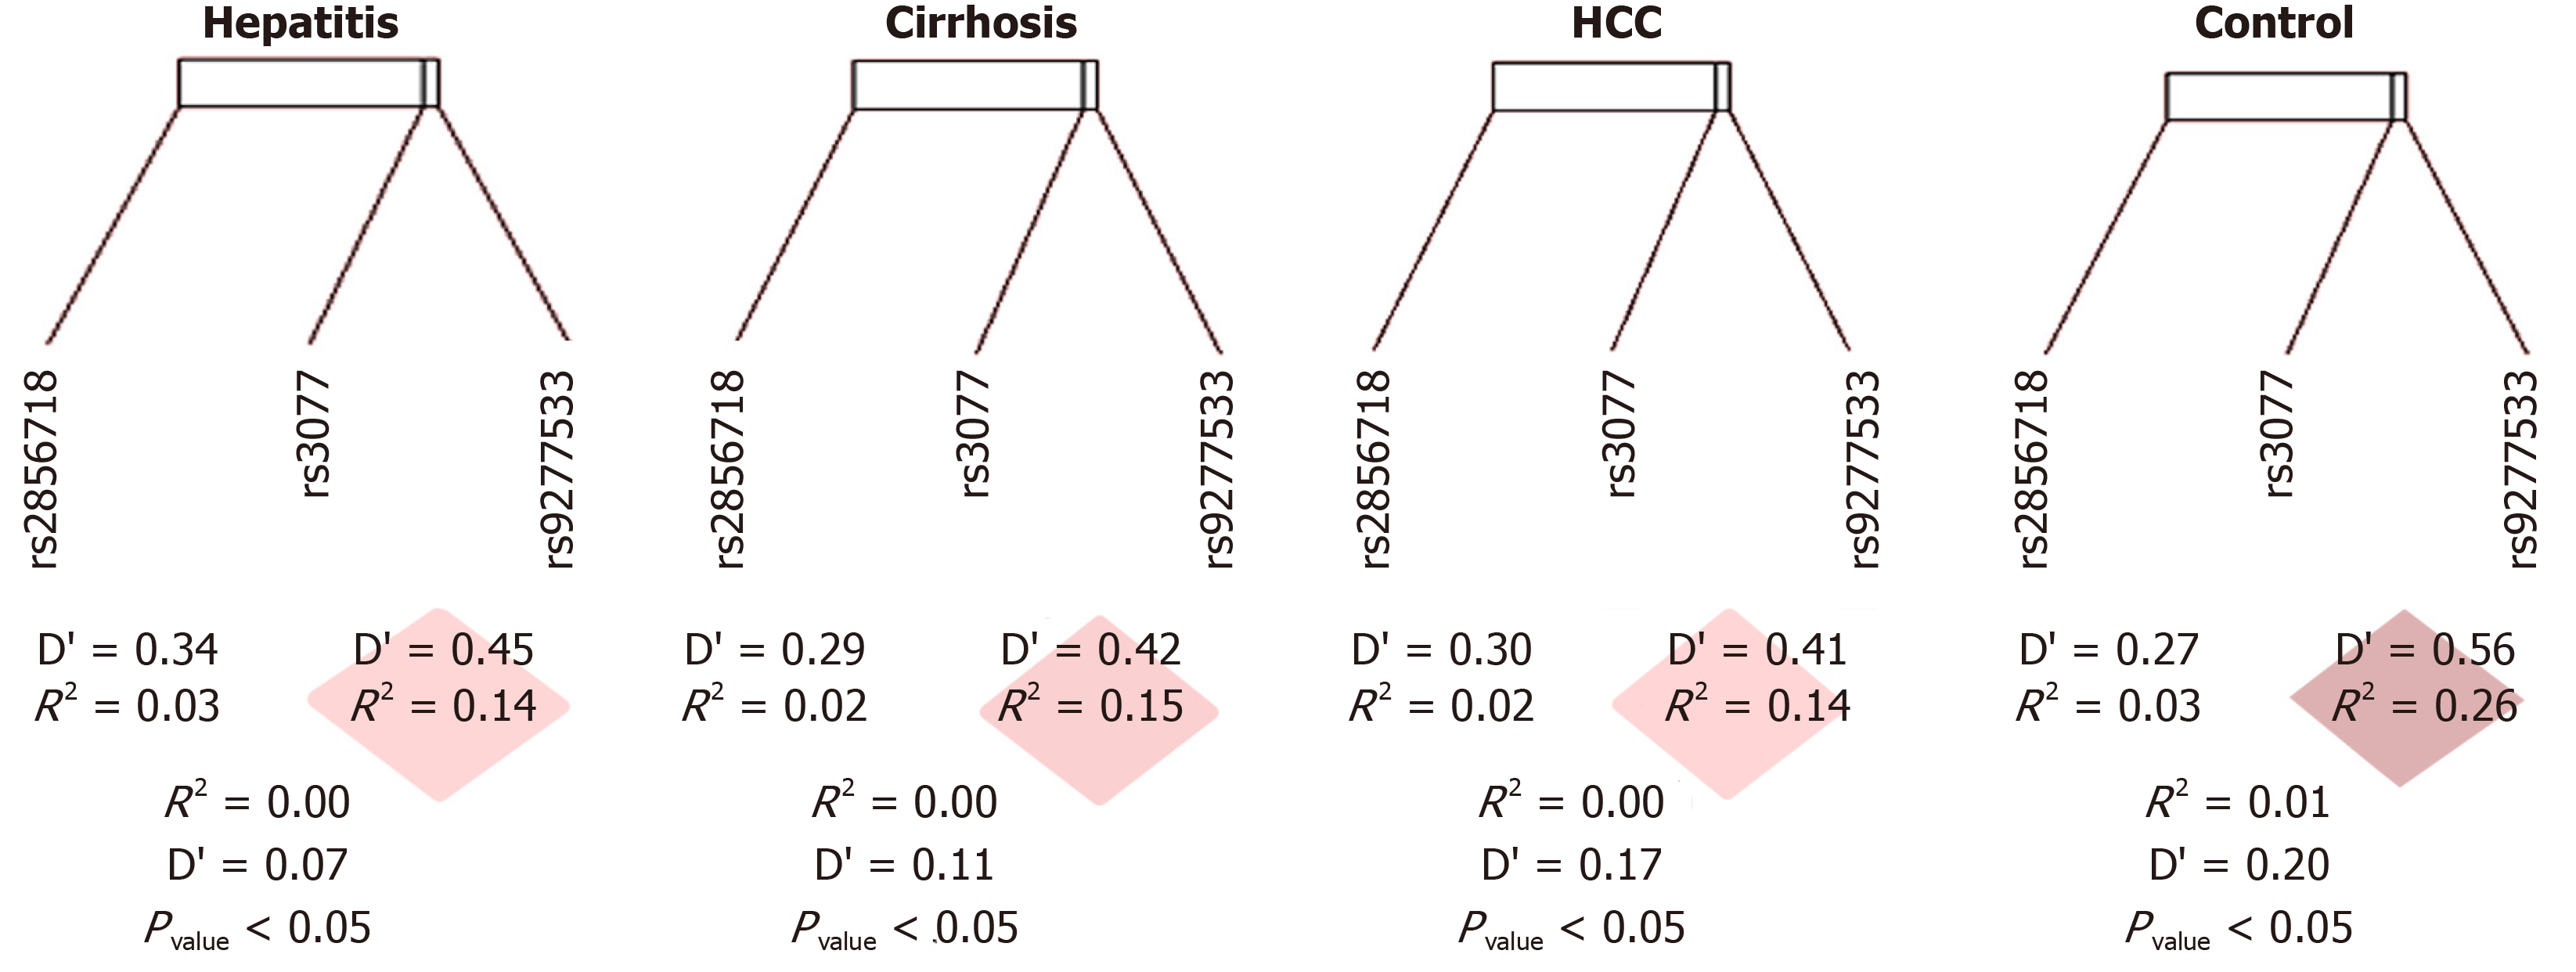
Figure 3 Linkage disequilibrium pairwise map.
The physical distance separating these single nucleotide polymorphisms (SNPs) was 29,816 kb, and the D value ranges from 0.07 to 0.42. The disequilibrium is strong when D' ≥ 0.80, moderate when D' is around 0.50, and weak when D' is 0. Significantly, the closed linkage between rs3077 and rs9277535 is due to the distance of 21kb. We found decreasment of D' from the healthy control (D’ = 0.50, P < 0.05) to the hepatic diseases group (D' < 0.3, P < 0.05), which means from the moderate to the weak disequilibrium. The variant rs2856718 showed a moderate linkage disequilibrium with rs3077 (D’ from 0.27 to 0.34) but very weak with rs9277535 (D’ from 0.07 to 0.20). This might predict the independence of this SNP to disease status except when a specific genotype of rs3077 influenced it.
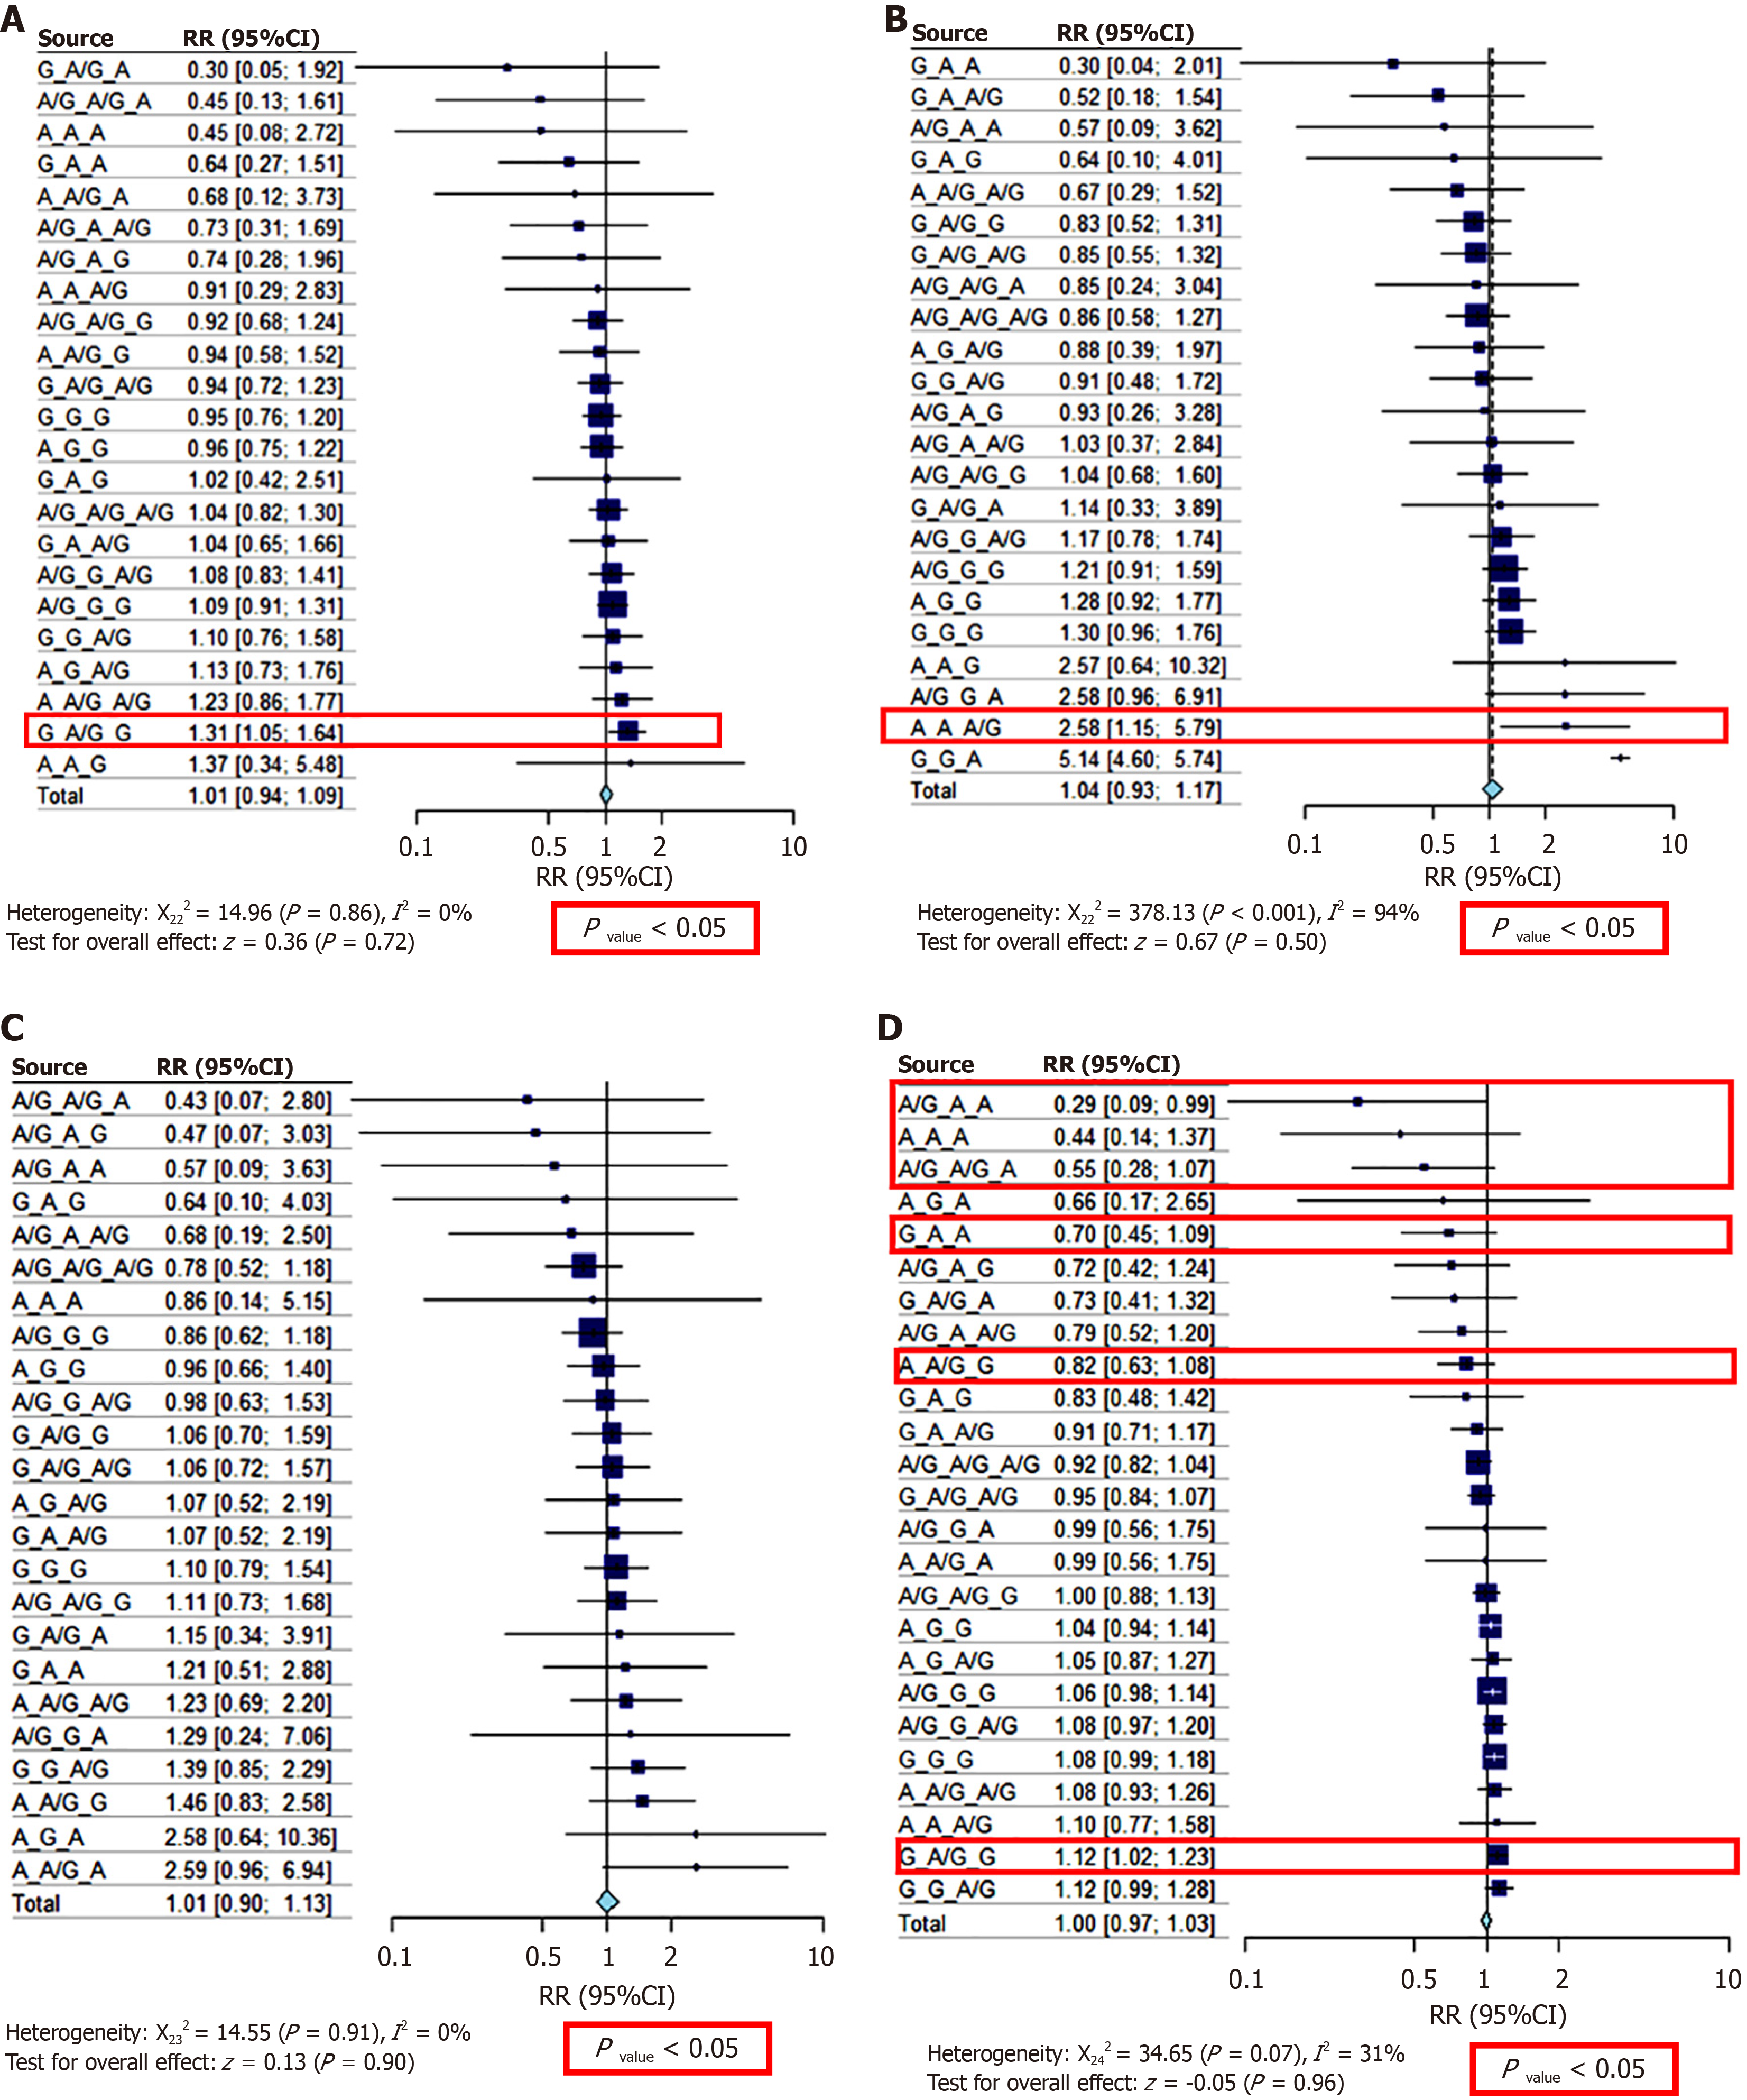
Figure 4 Forest plot show the result of risk ratio test of the haplotype or genotype combination of the three variants (in order of variation: rs2856718, rs3077, rs9277535).
A: Chronic hepatitis B group; B: Hepatitis B virus (HBV)-related hepatocarcinoma group; C: HBV-related liver cirrhosis; D: Healthy control.
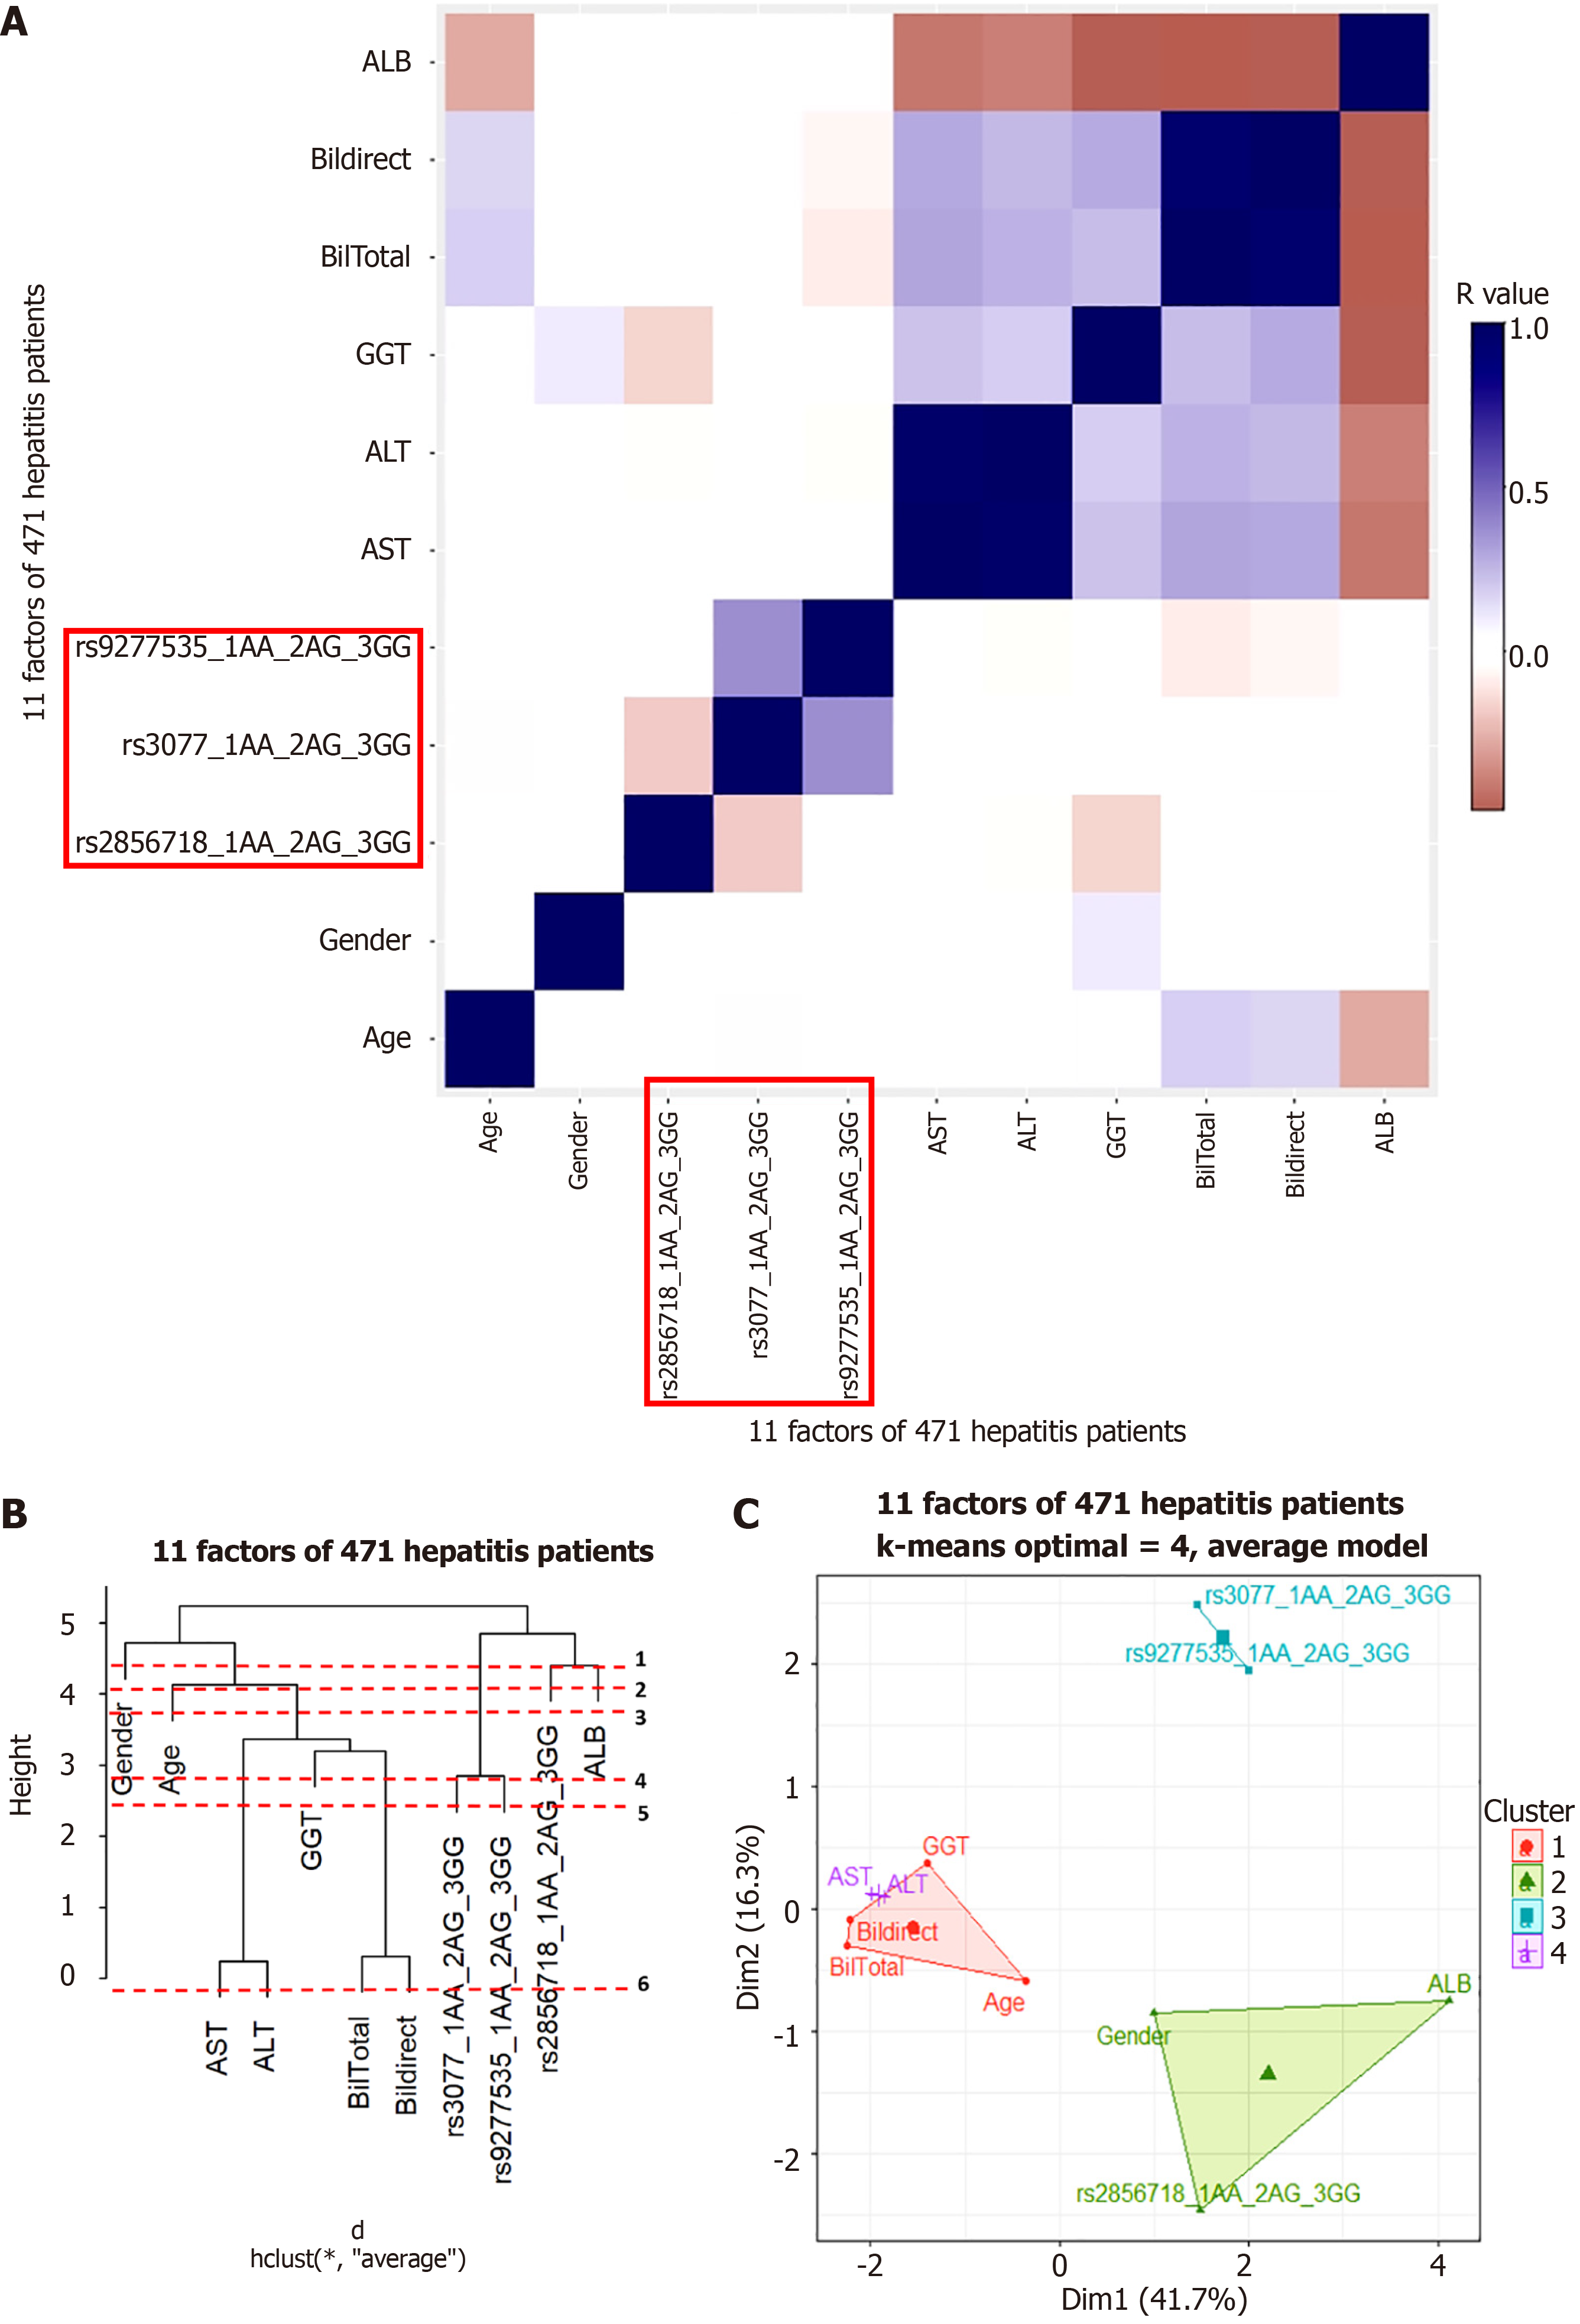
Figure 5 Hierachical clustering anaslysis result in chronic hepatitis B patient group.
A: Correlation heatmap; B: Dendrogram; C: Principal component analysis map. ALT: Alanine aminotransferase; AST: Aspartate aminotransferase; ALB: Albumin; GGT: Gamma glutamyl transferase.
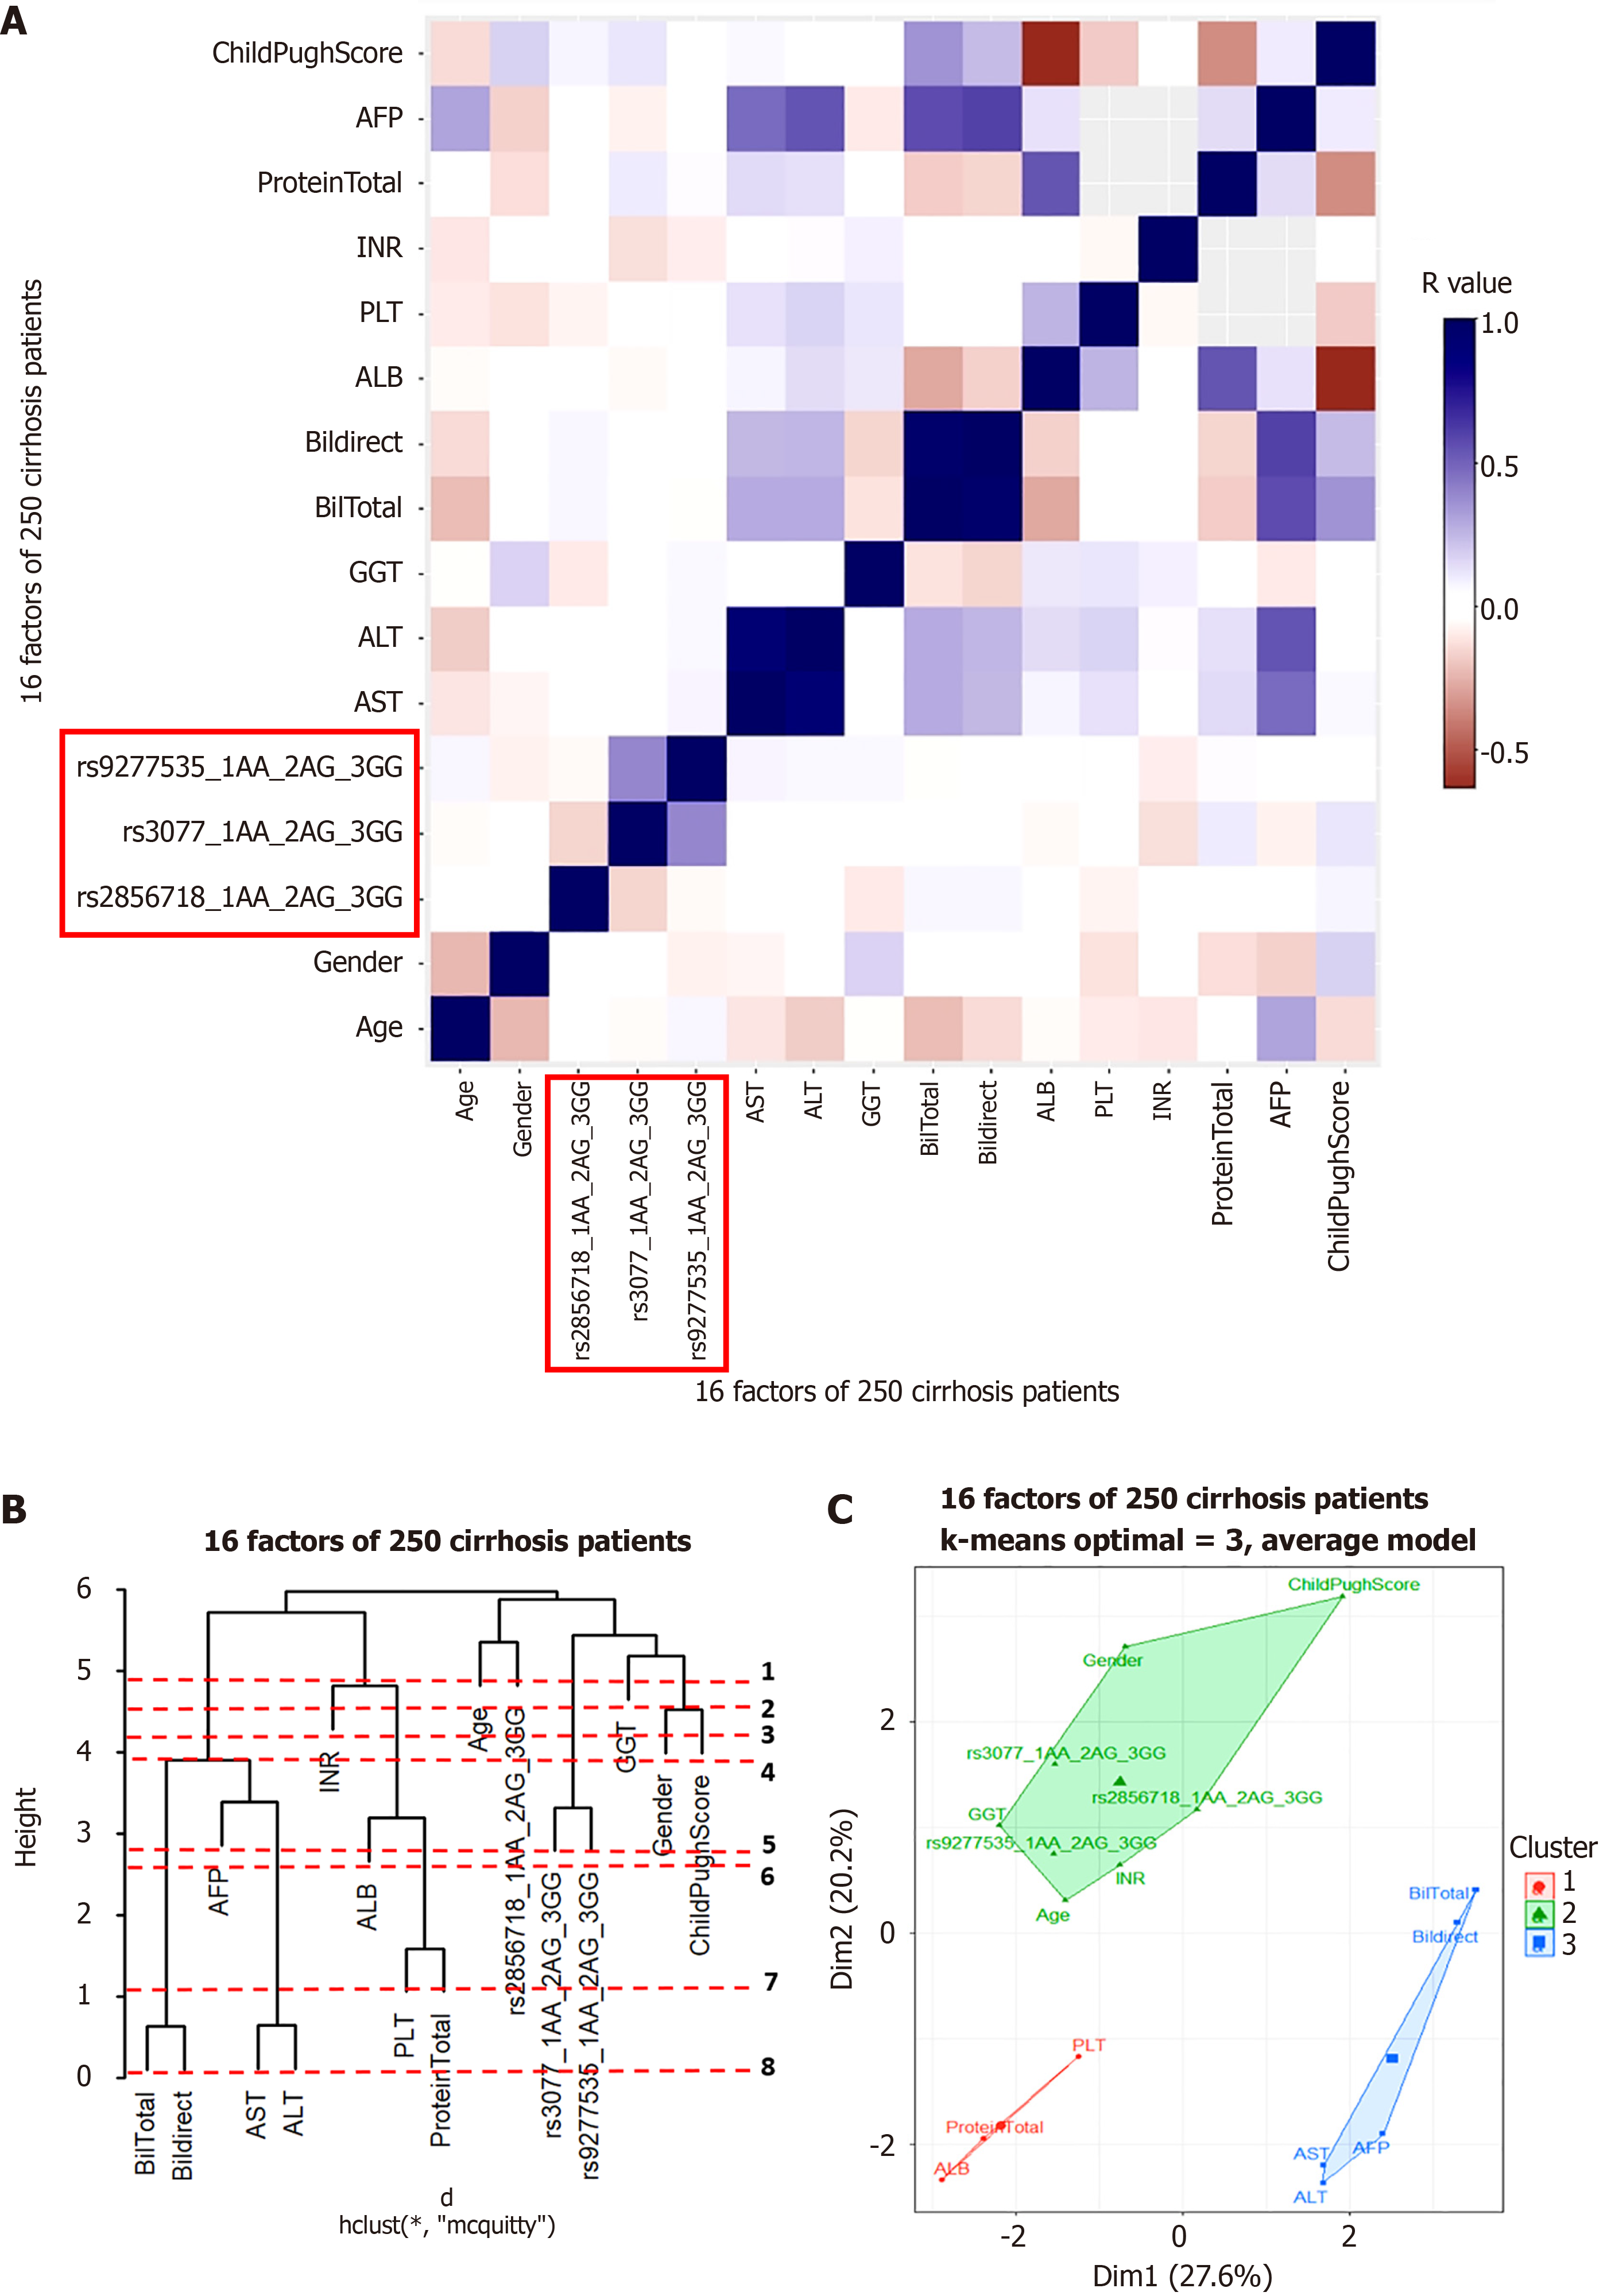
Figure 6 Hierachical clustering anaslysis result in hepatitis B virus-related liver cirrhosis patient group.
A: Correlation heatmap; B: Dendrogram; C: Principal component analysis map. ALT: Alanine aminotransferase; AST: Aspartate aminotransferase; ALB: Albumin; GGT: Gamma glutamyl transferase; AFP: Alpha-fetoprotein.
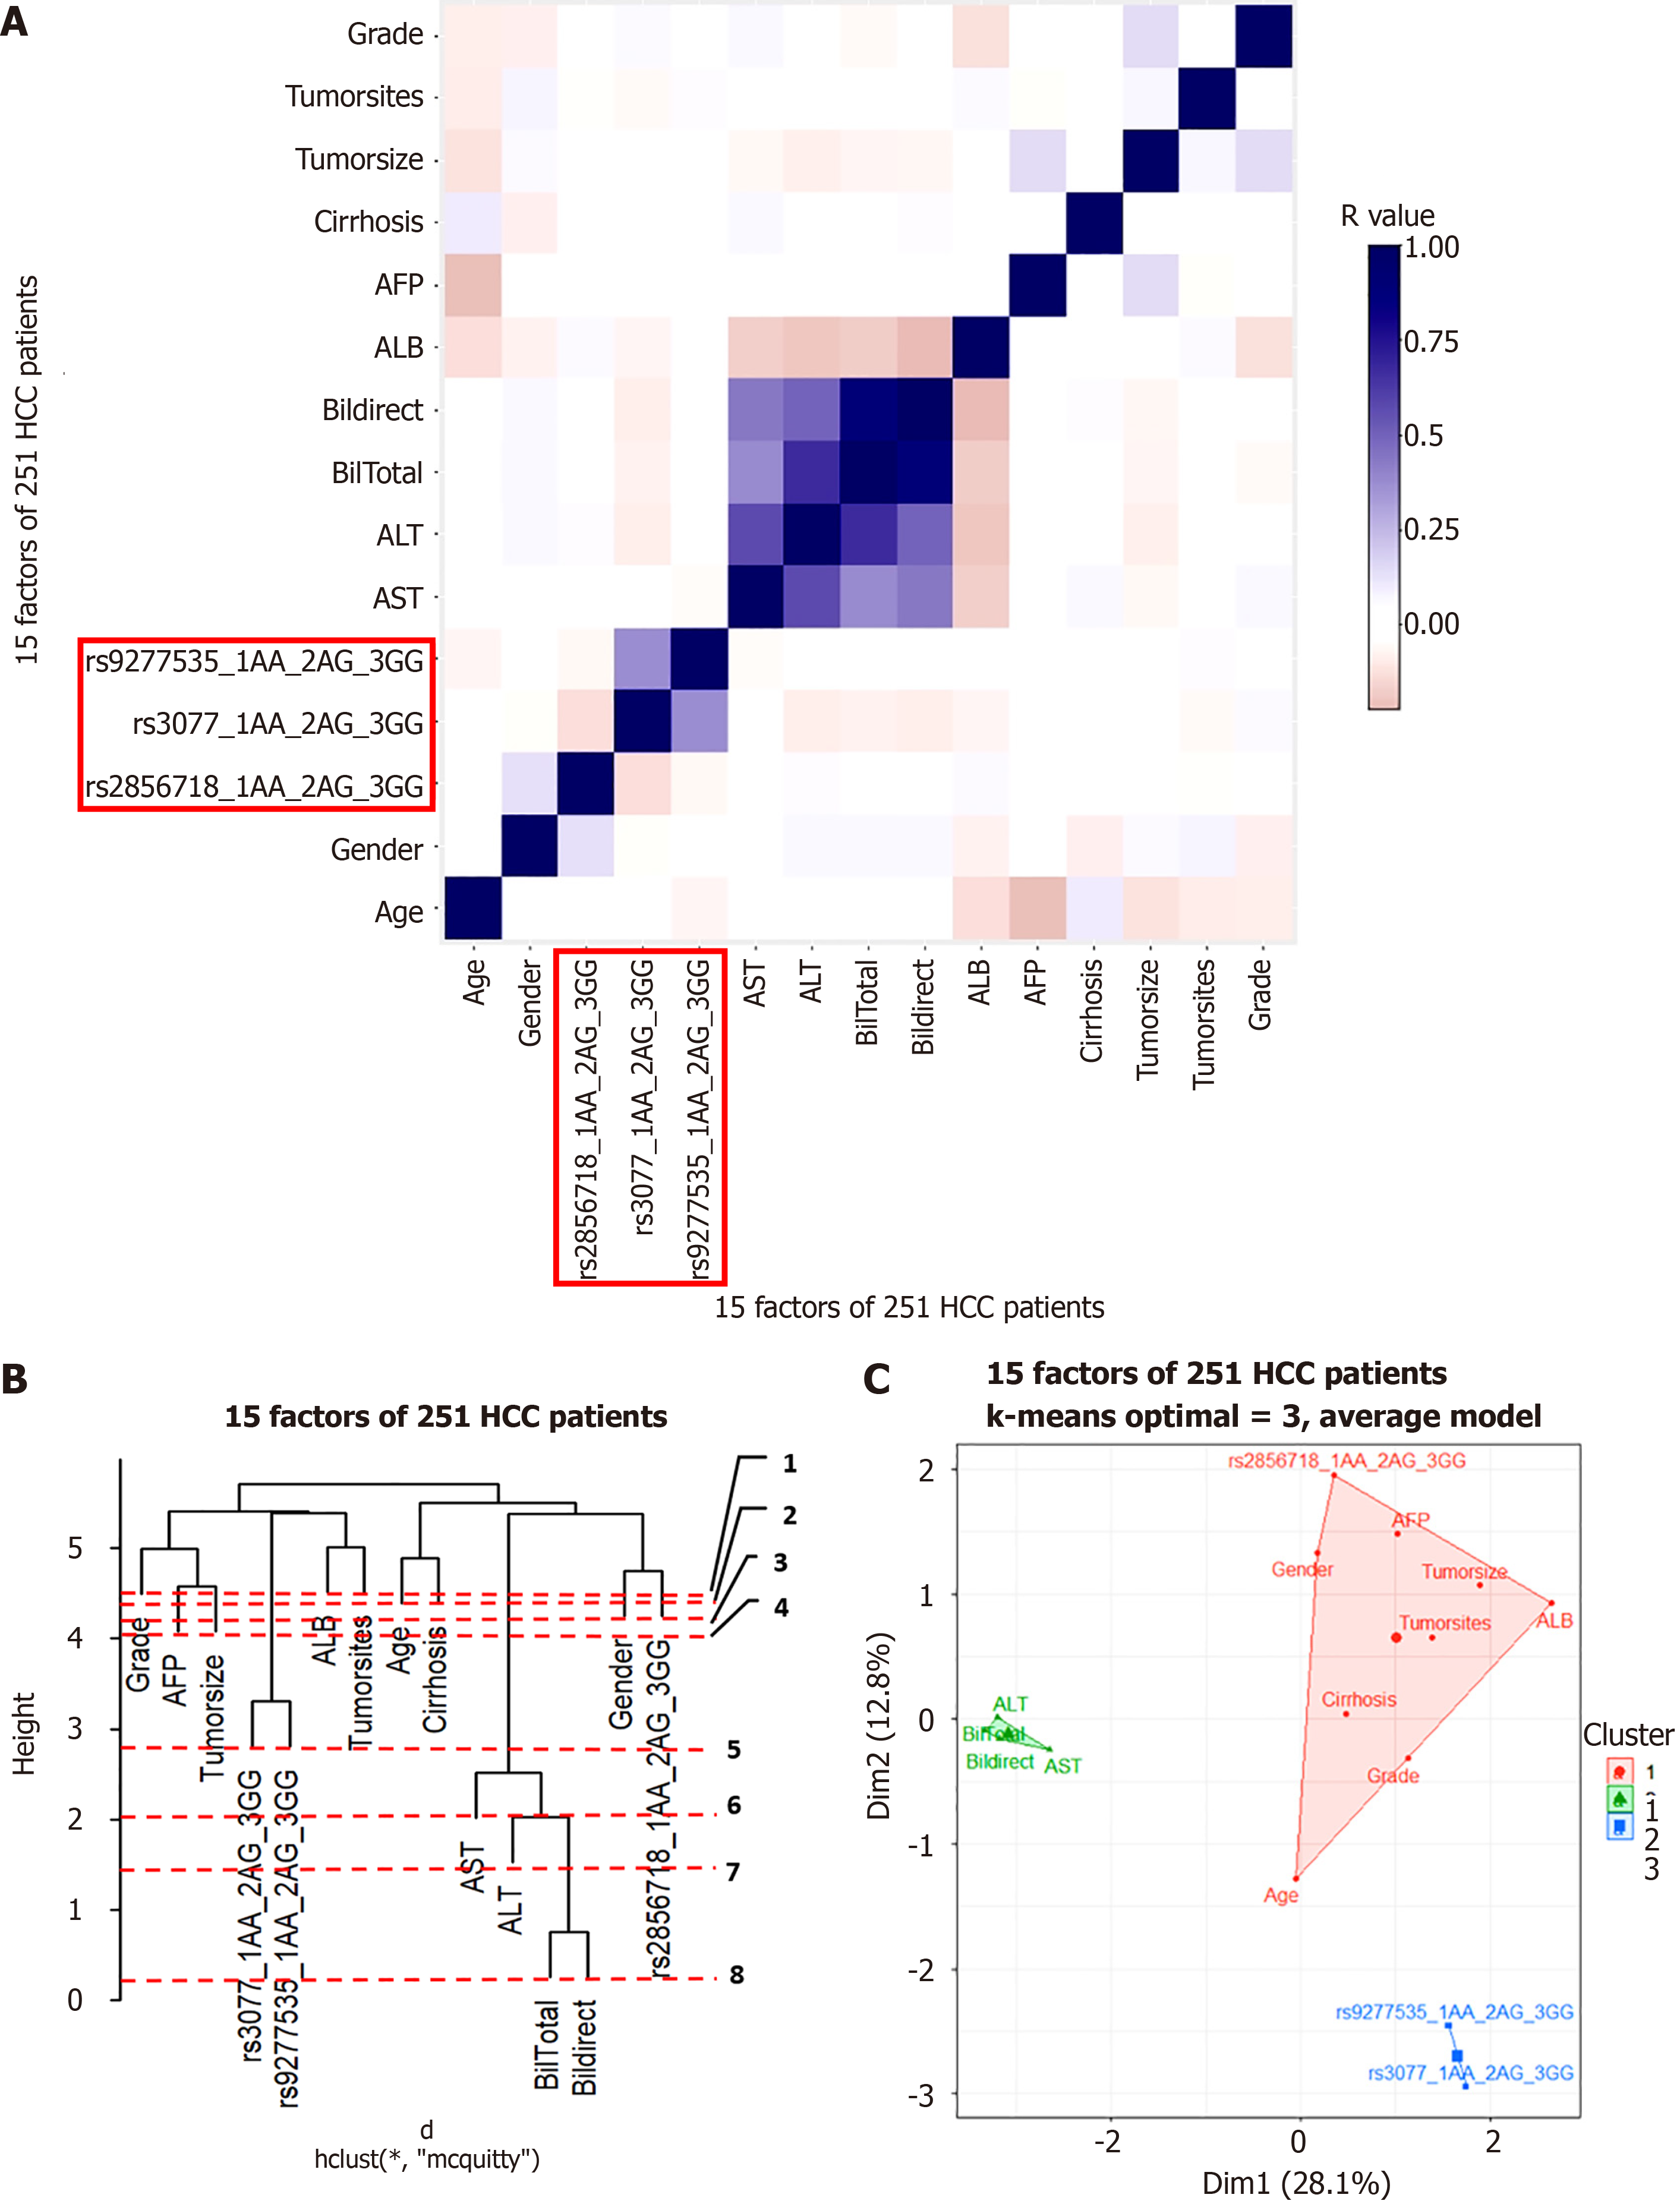
Figure 7 Hierachical clustering anaslysis result in hepatitis B virus-related hepatocarcinoma patient group.
A: Correlation Heatmap; B: Dendrogram; C: Principal component analysis map. ALT: Alanine aminotransferase; AST: Aspartate aminotransferase; ALB: Albumin; GGT: Gamma glutamyl transferase; AFP: Alpha-fetoprotein.
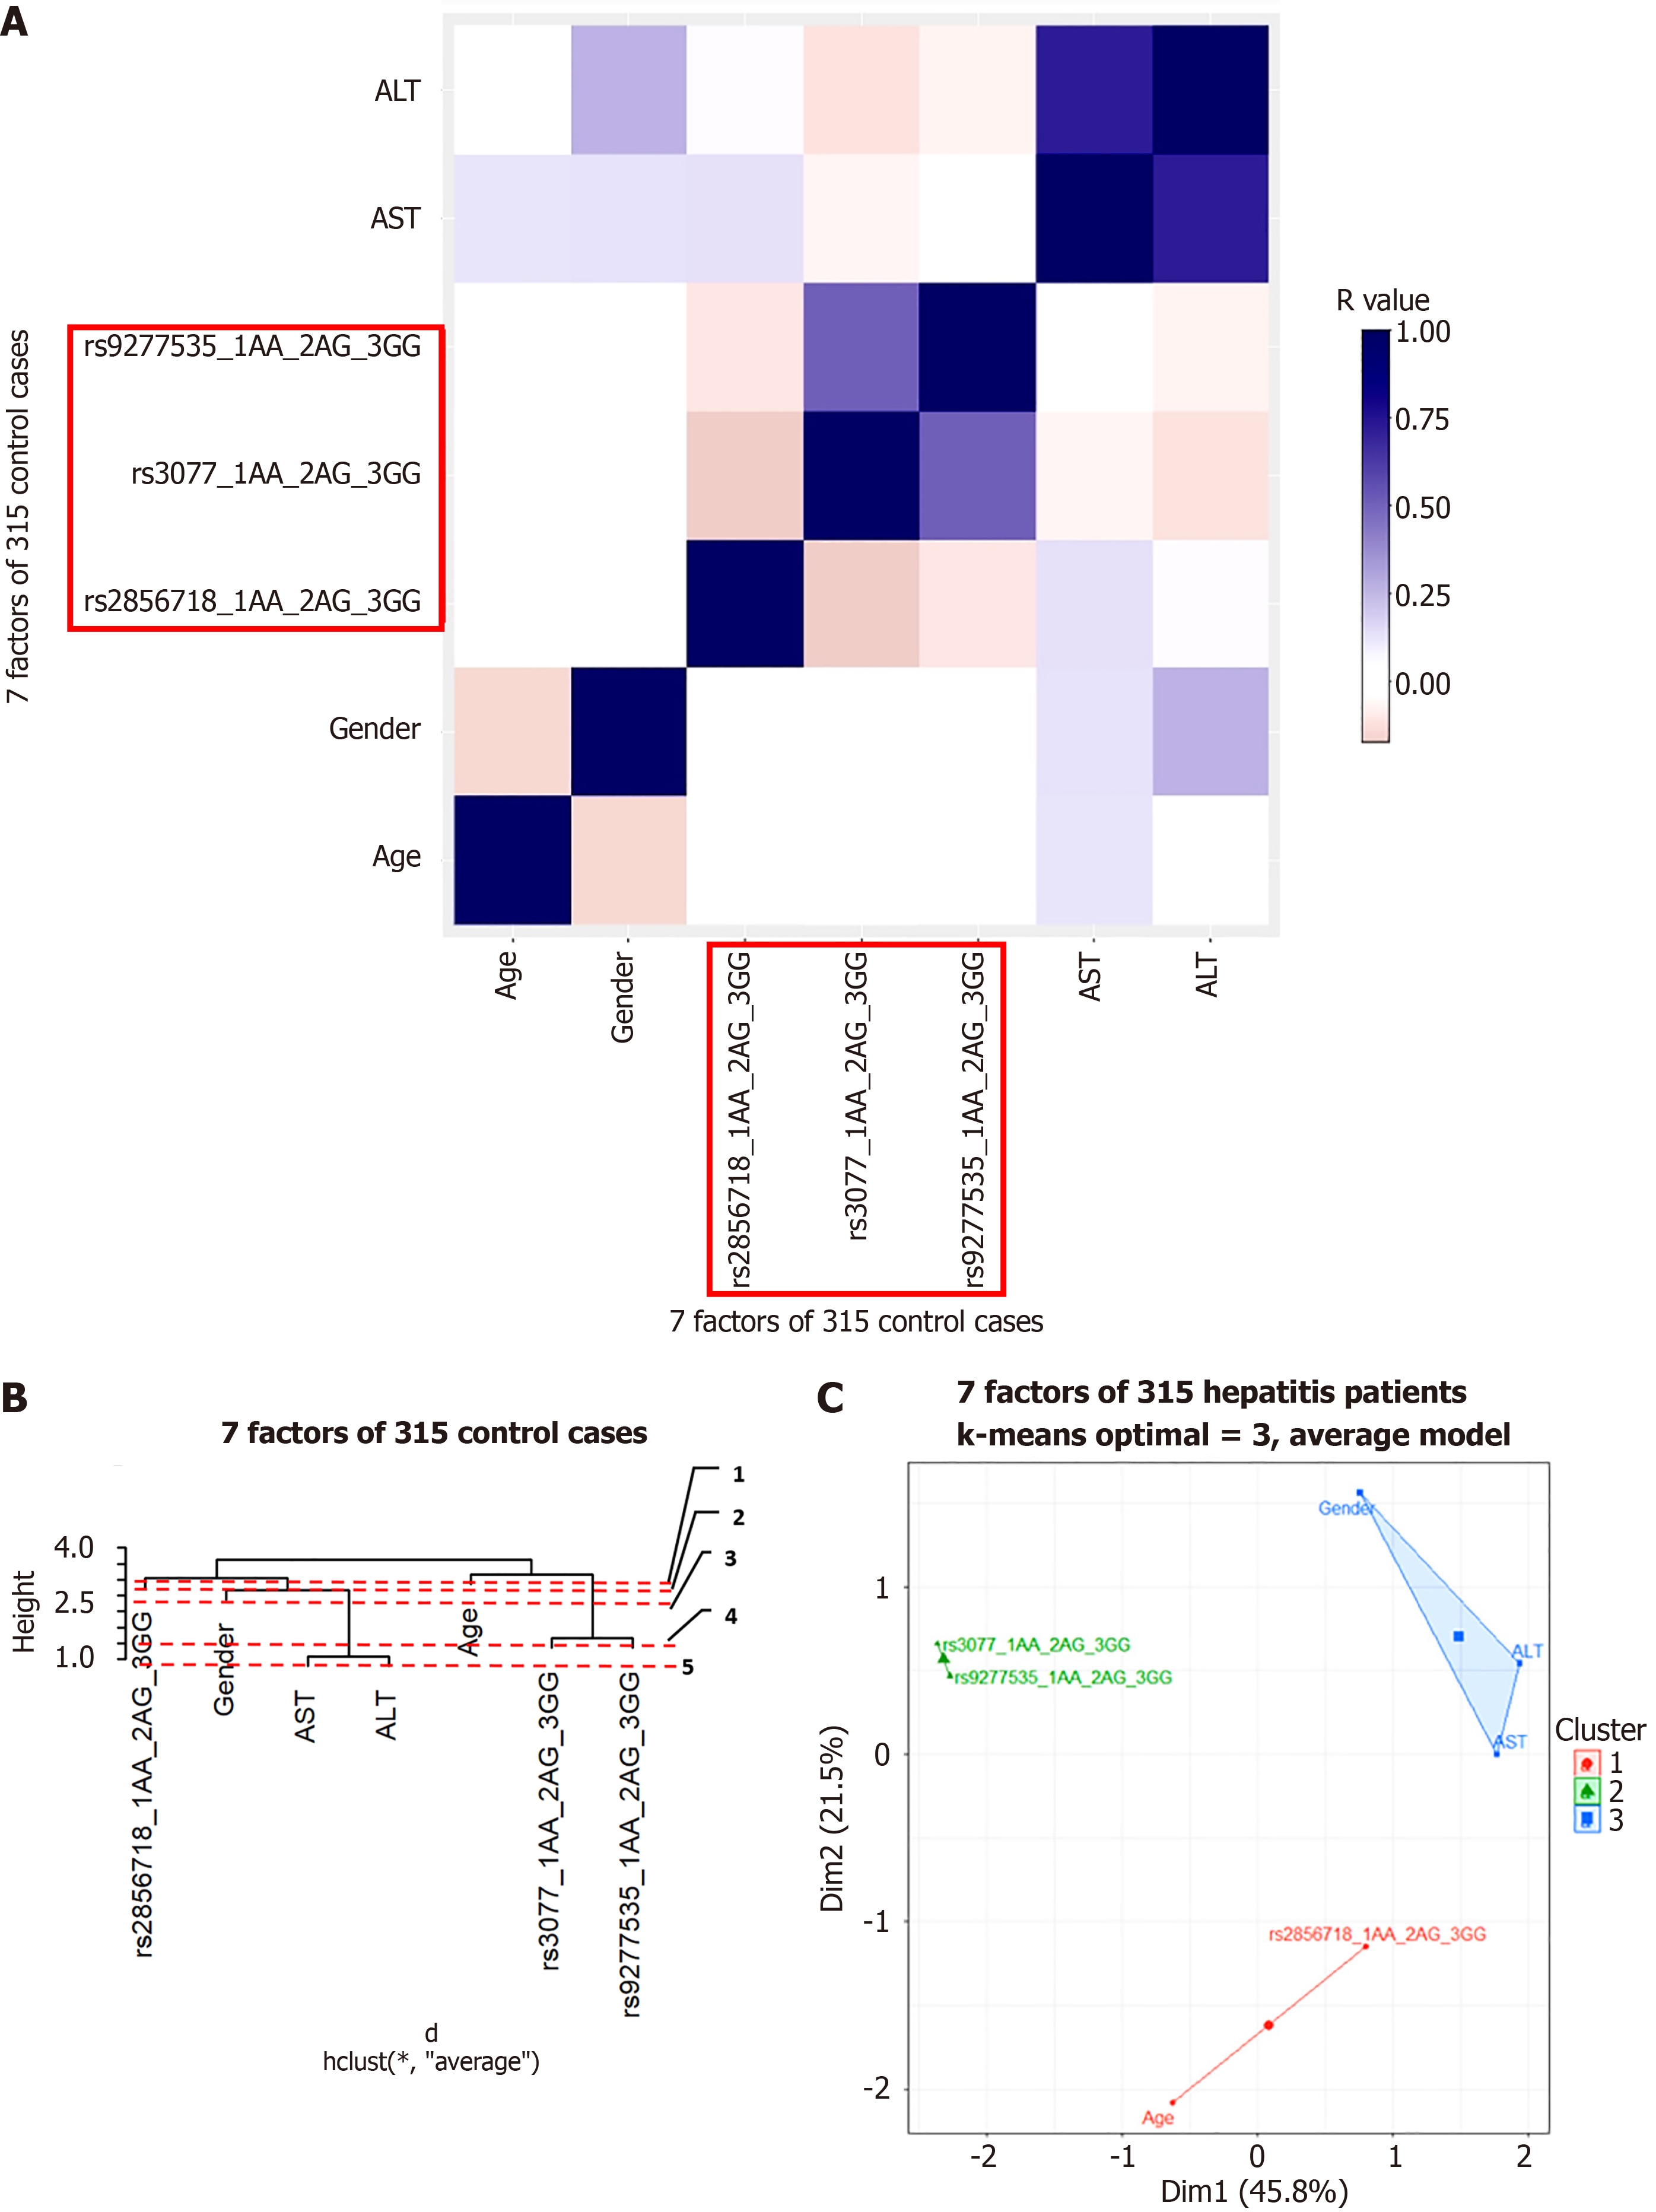
Figure 8 Hierachical clustering anaslysis result in healthy control group.
A: Correlation heatmap; B: Dendrogram; C: Principal component analysis map. ALT: Alanine aminotransferase; AST: Aspartate aminotransferase; ALB: Albumin; GGT: Gamma glutamyl transferase.
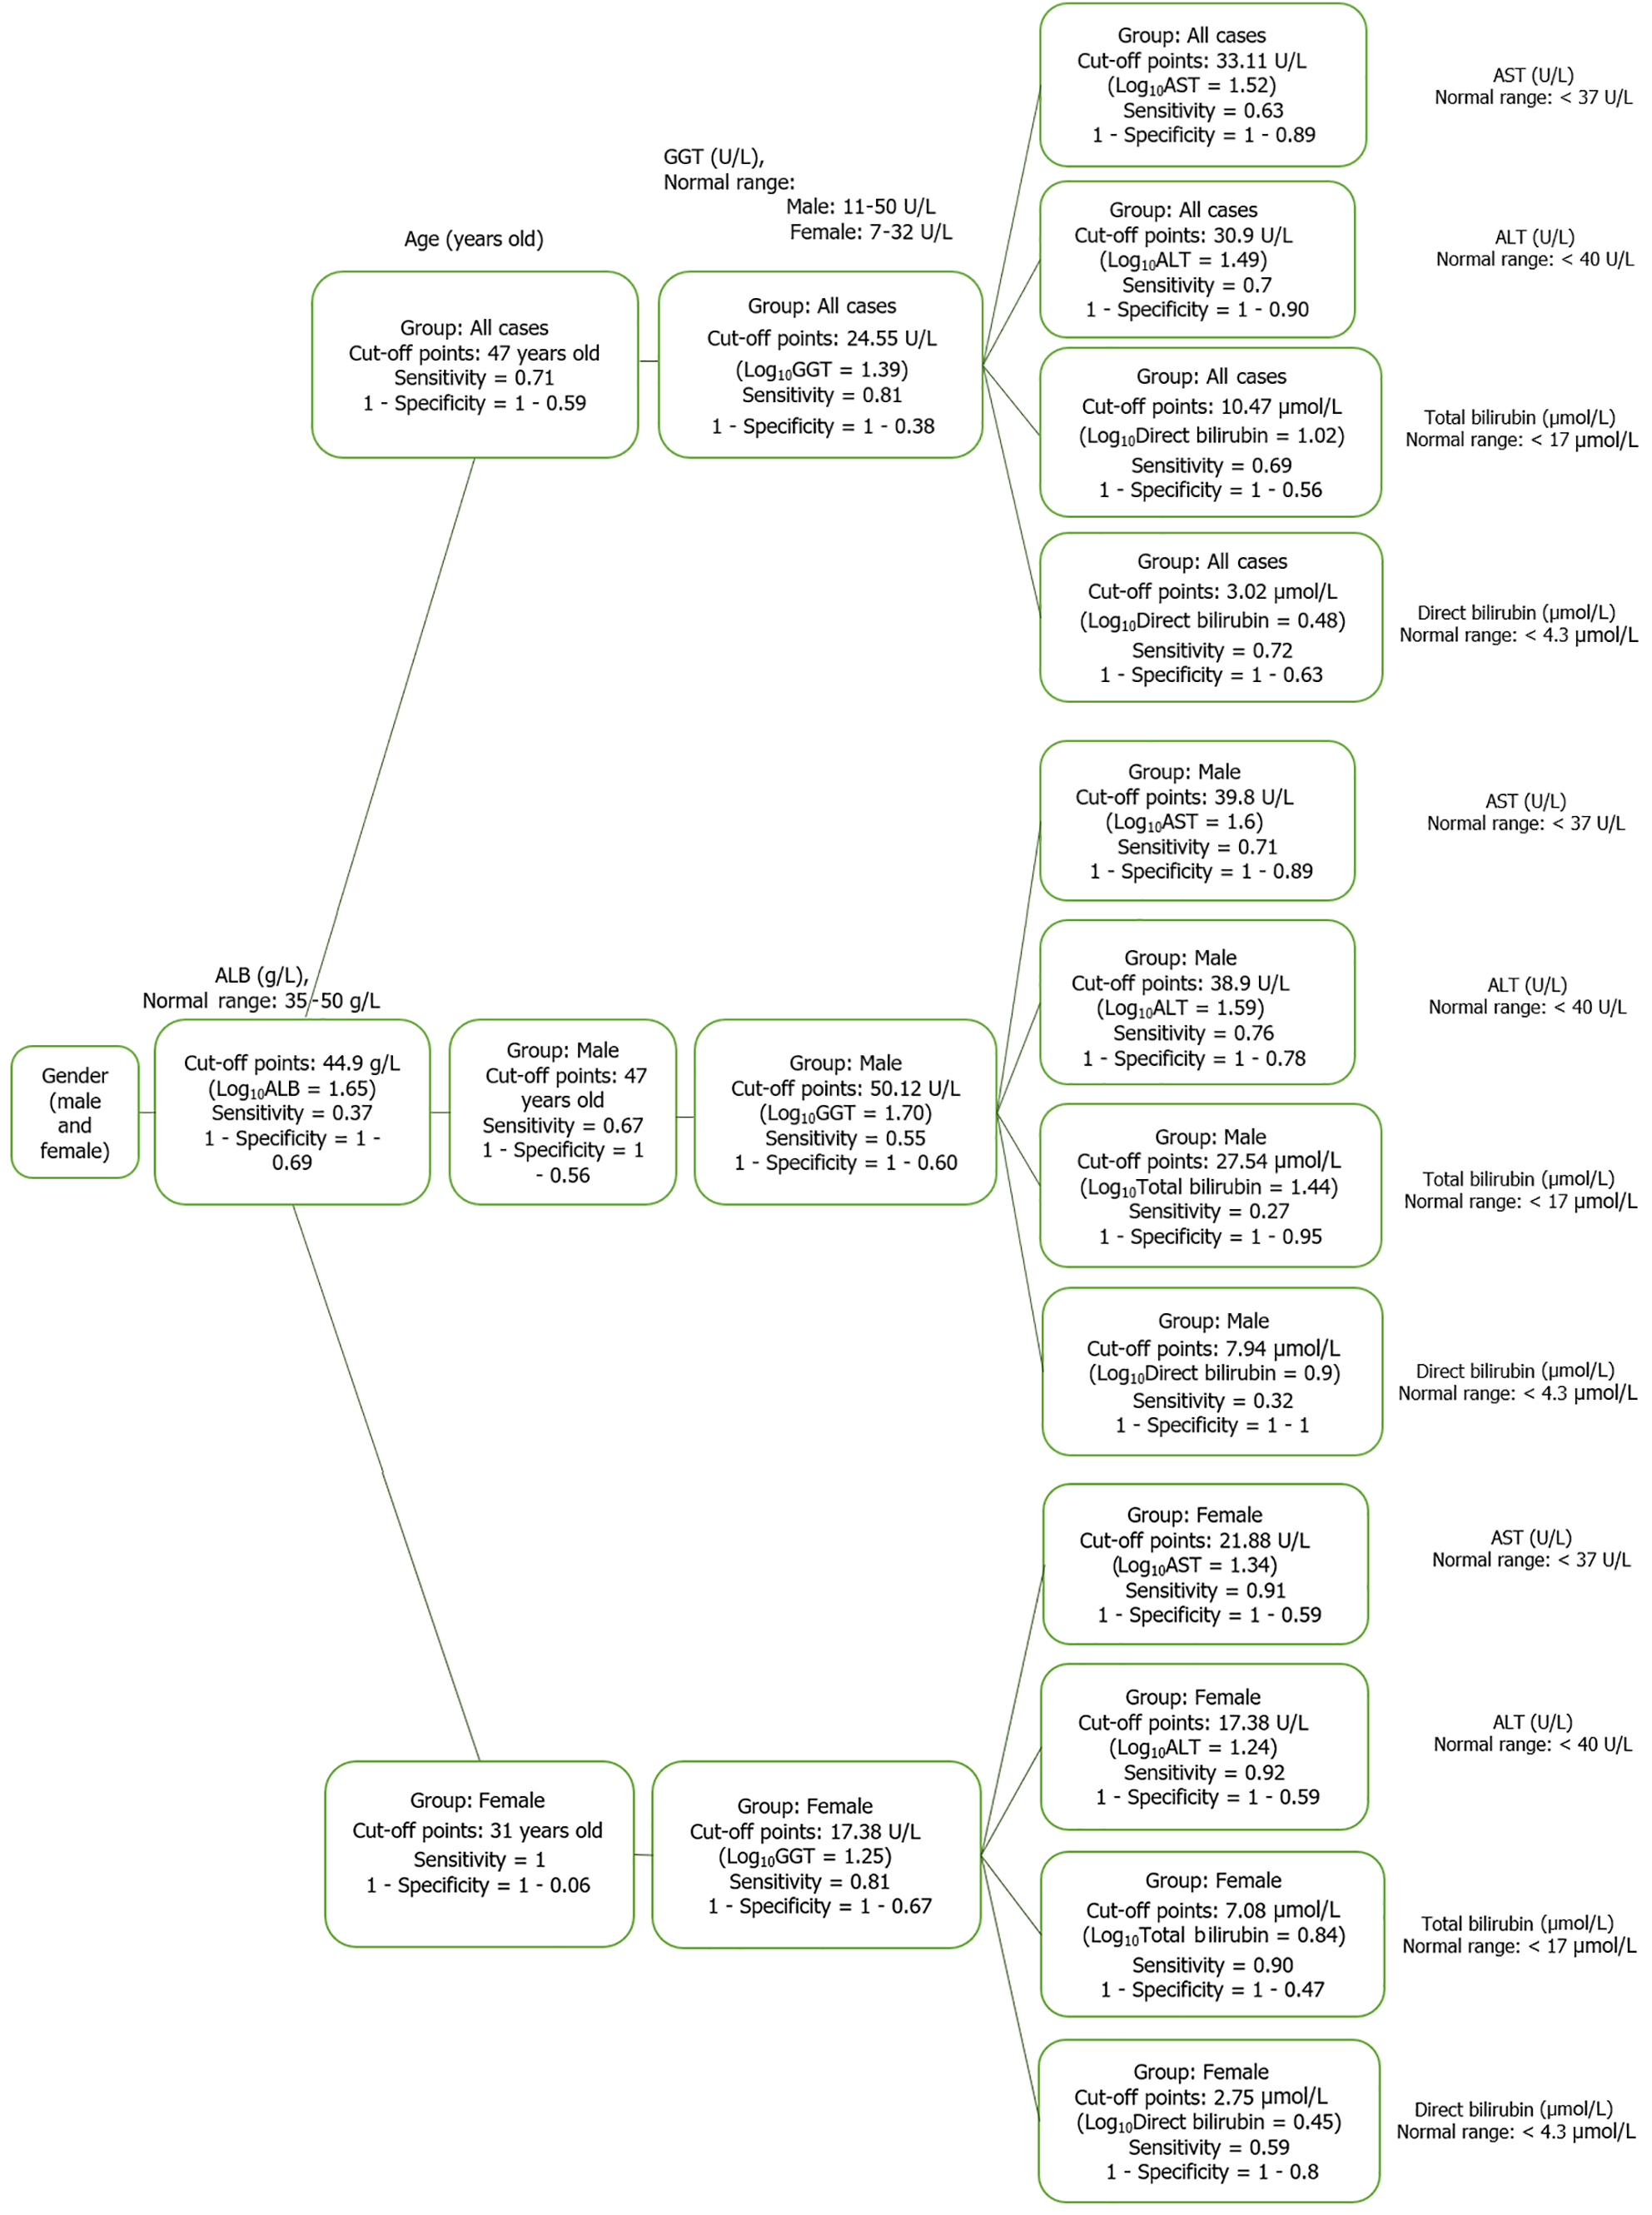
Figure 9 Diagram of optimal cut point in chronic hepatitis B patient group.
ALT: Alanine aminotransferase; AST: Aspartate aminotransferase; ALB: Albumin; GGT: Gamma glutamyl transferase.
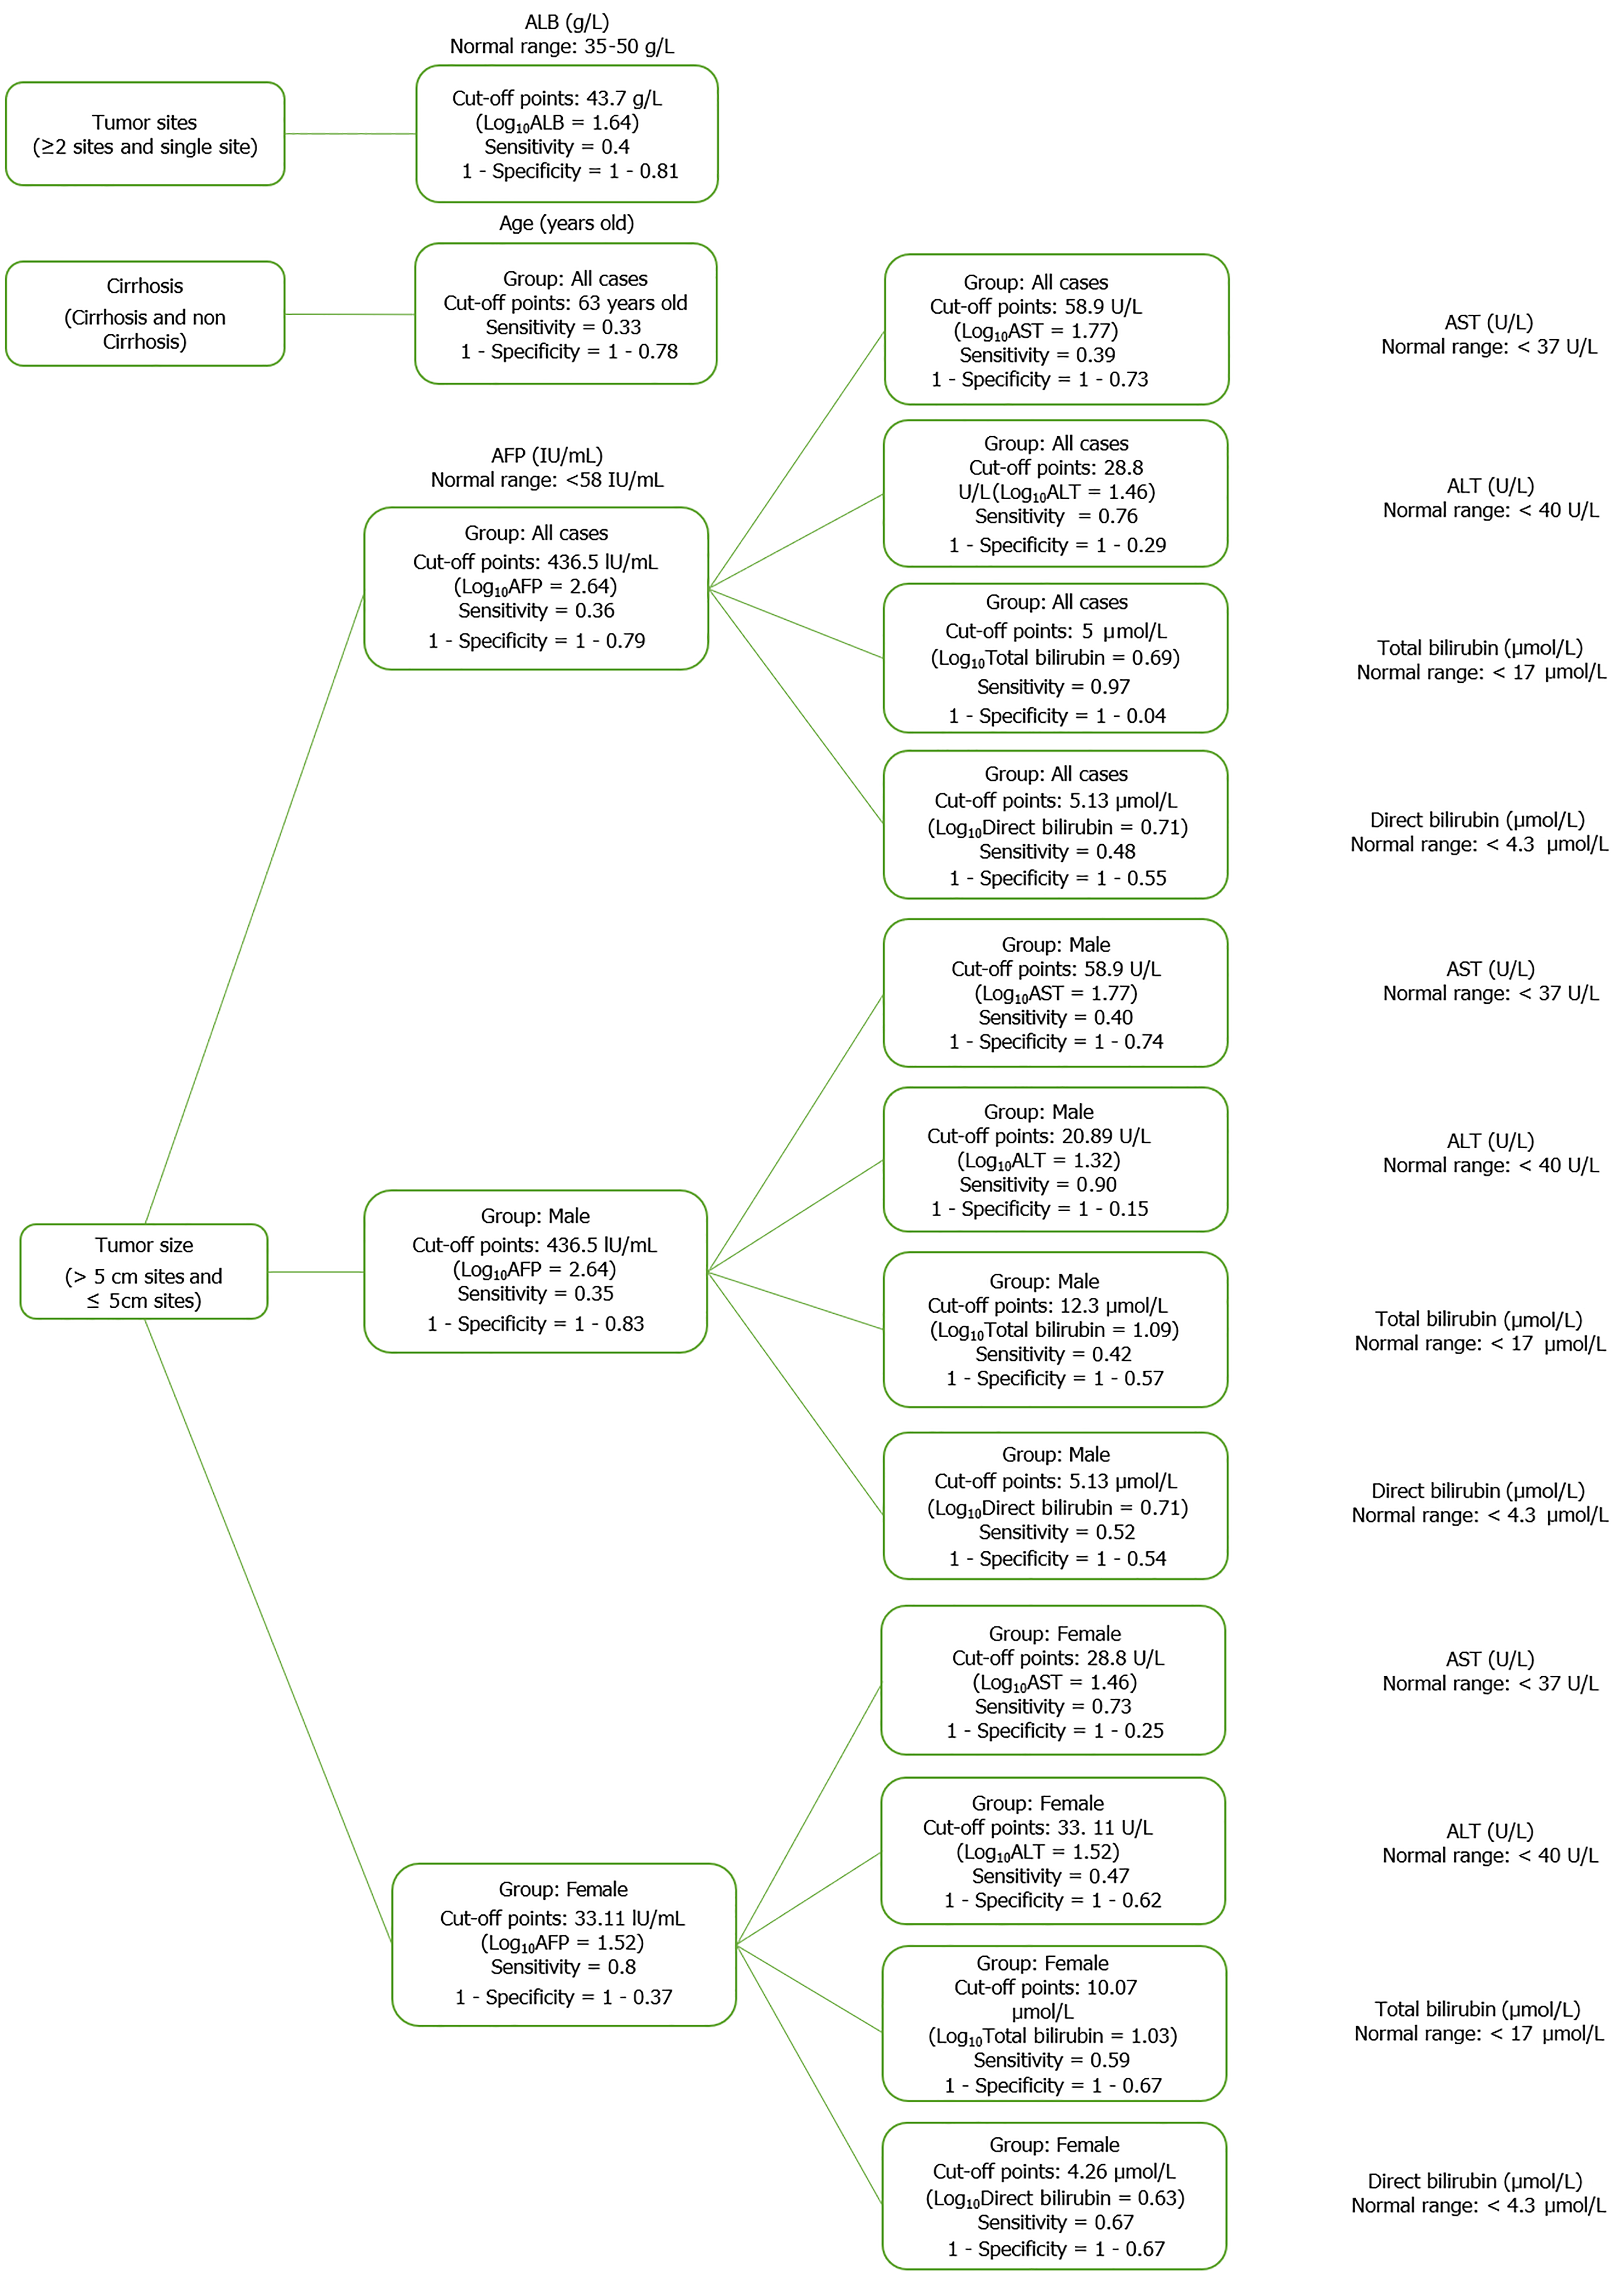
Figure 10 Diagram of optimal cut point in hepatitis B virus-related hepatocarcinoma patient group.
ALT: Alanine aminotransferase; AST: Aspartate aminotransferase; ALB: Albumin; AFP: Alpha-fetoprotein.
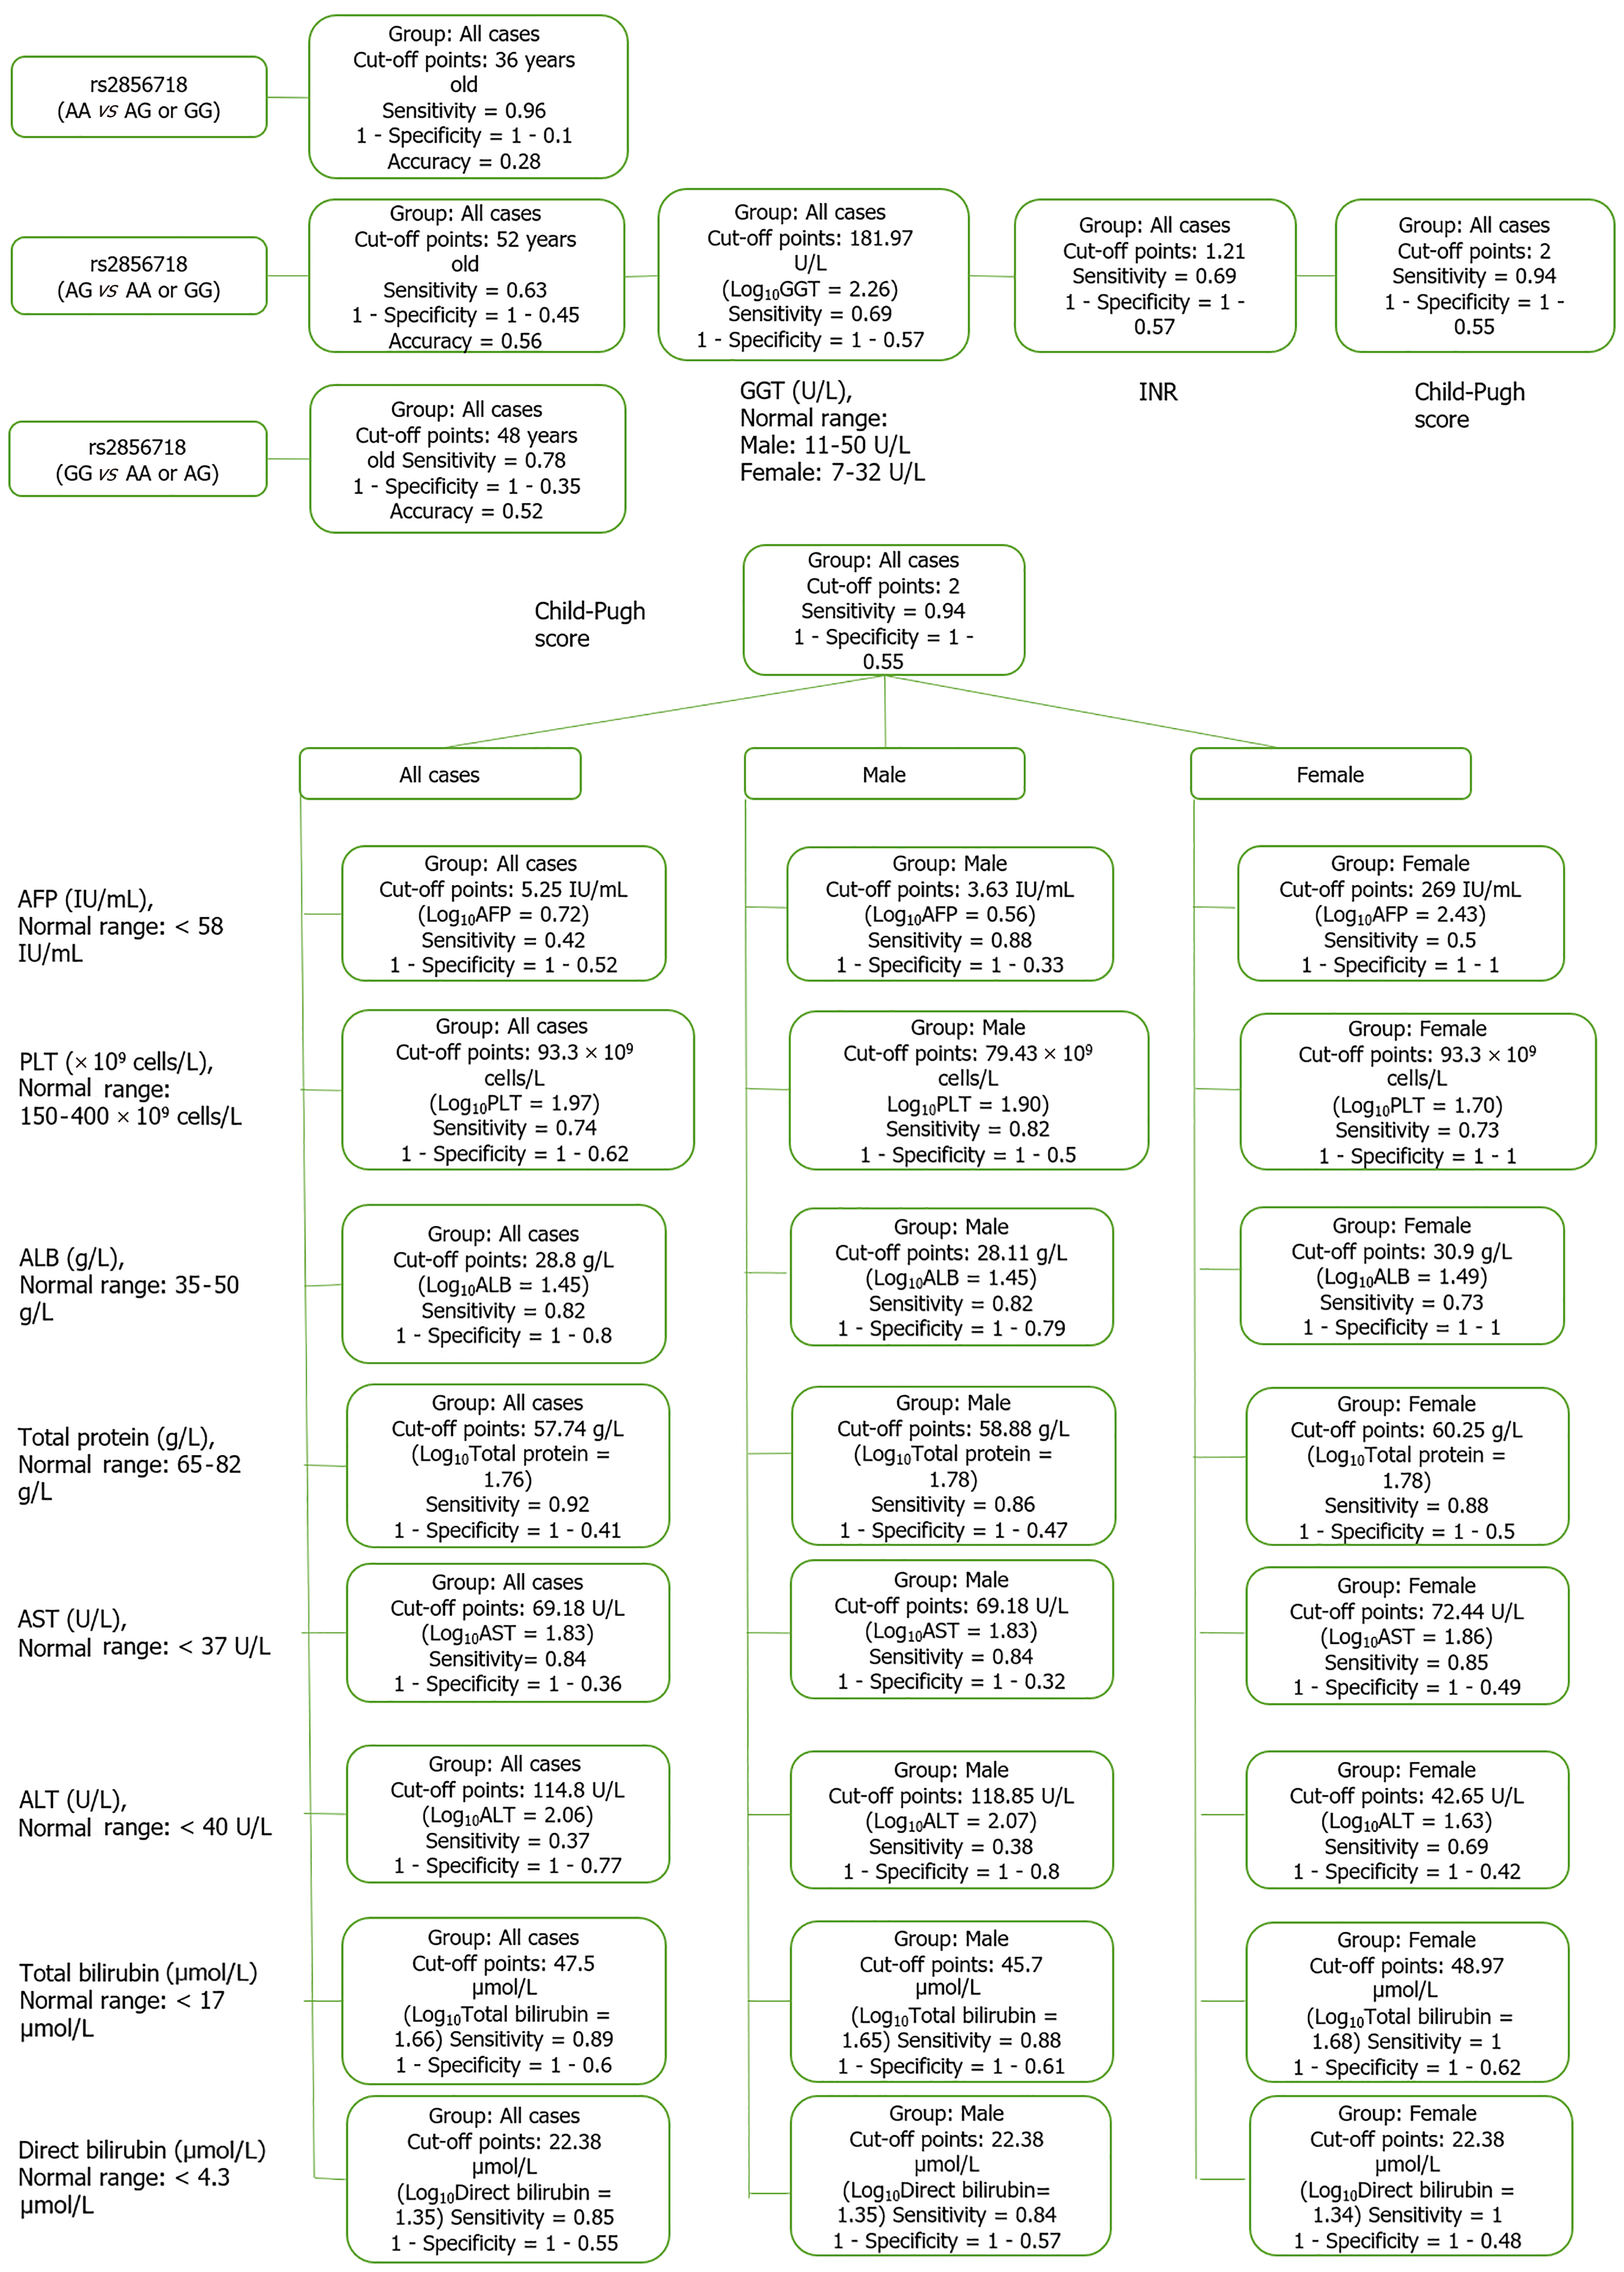
Figure 11 Diagram of optimal cut point in hepatitis B virus-related liver cirrhosis patient group.
ALT: Alanine aminotransferase; AST: Aspartate aminotransferase; ALB: Albumin; GGT: Gamma glutamyl transferase; AFP: Alpha-fetoprotein; INR: International normalized ratio; PLT: Platelet count.
- Citation: Nguyen TT, Ho TC, Bui HTT, Tran VK, Nguyen TT. Multi-clustering study on the association between human leukocyte antigen-DP-DQ and hepatitis B virus-related hepatocellular carcinoma and cirrhosis in Viet Nam. World J Gastroenterol 2024; 30(46): 4880-4903
- URL: https://www.wjgnet.com/1007-9327/full/v30/i46/4880.htm
- DOI: https://dx.doi.org/10.3748/wjg.v30.i46.4880


