Copyright
©The Author(s) 2024.
World J Gastroenterol. Dec 7, 2024; 30(45): 4817-4835
Published online Dec 7, 2024. doi: 10.3748/wjg.v30.i45.4817
Published online Dec 7, 2024. doi: 10.3748/wjg.v30.i45.4817
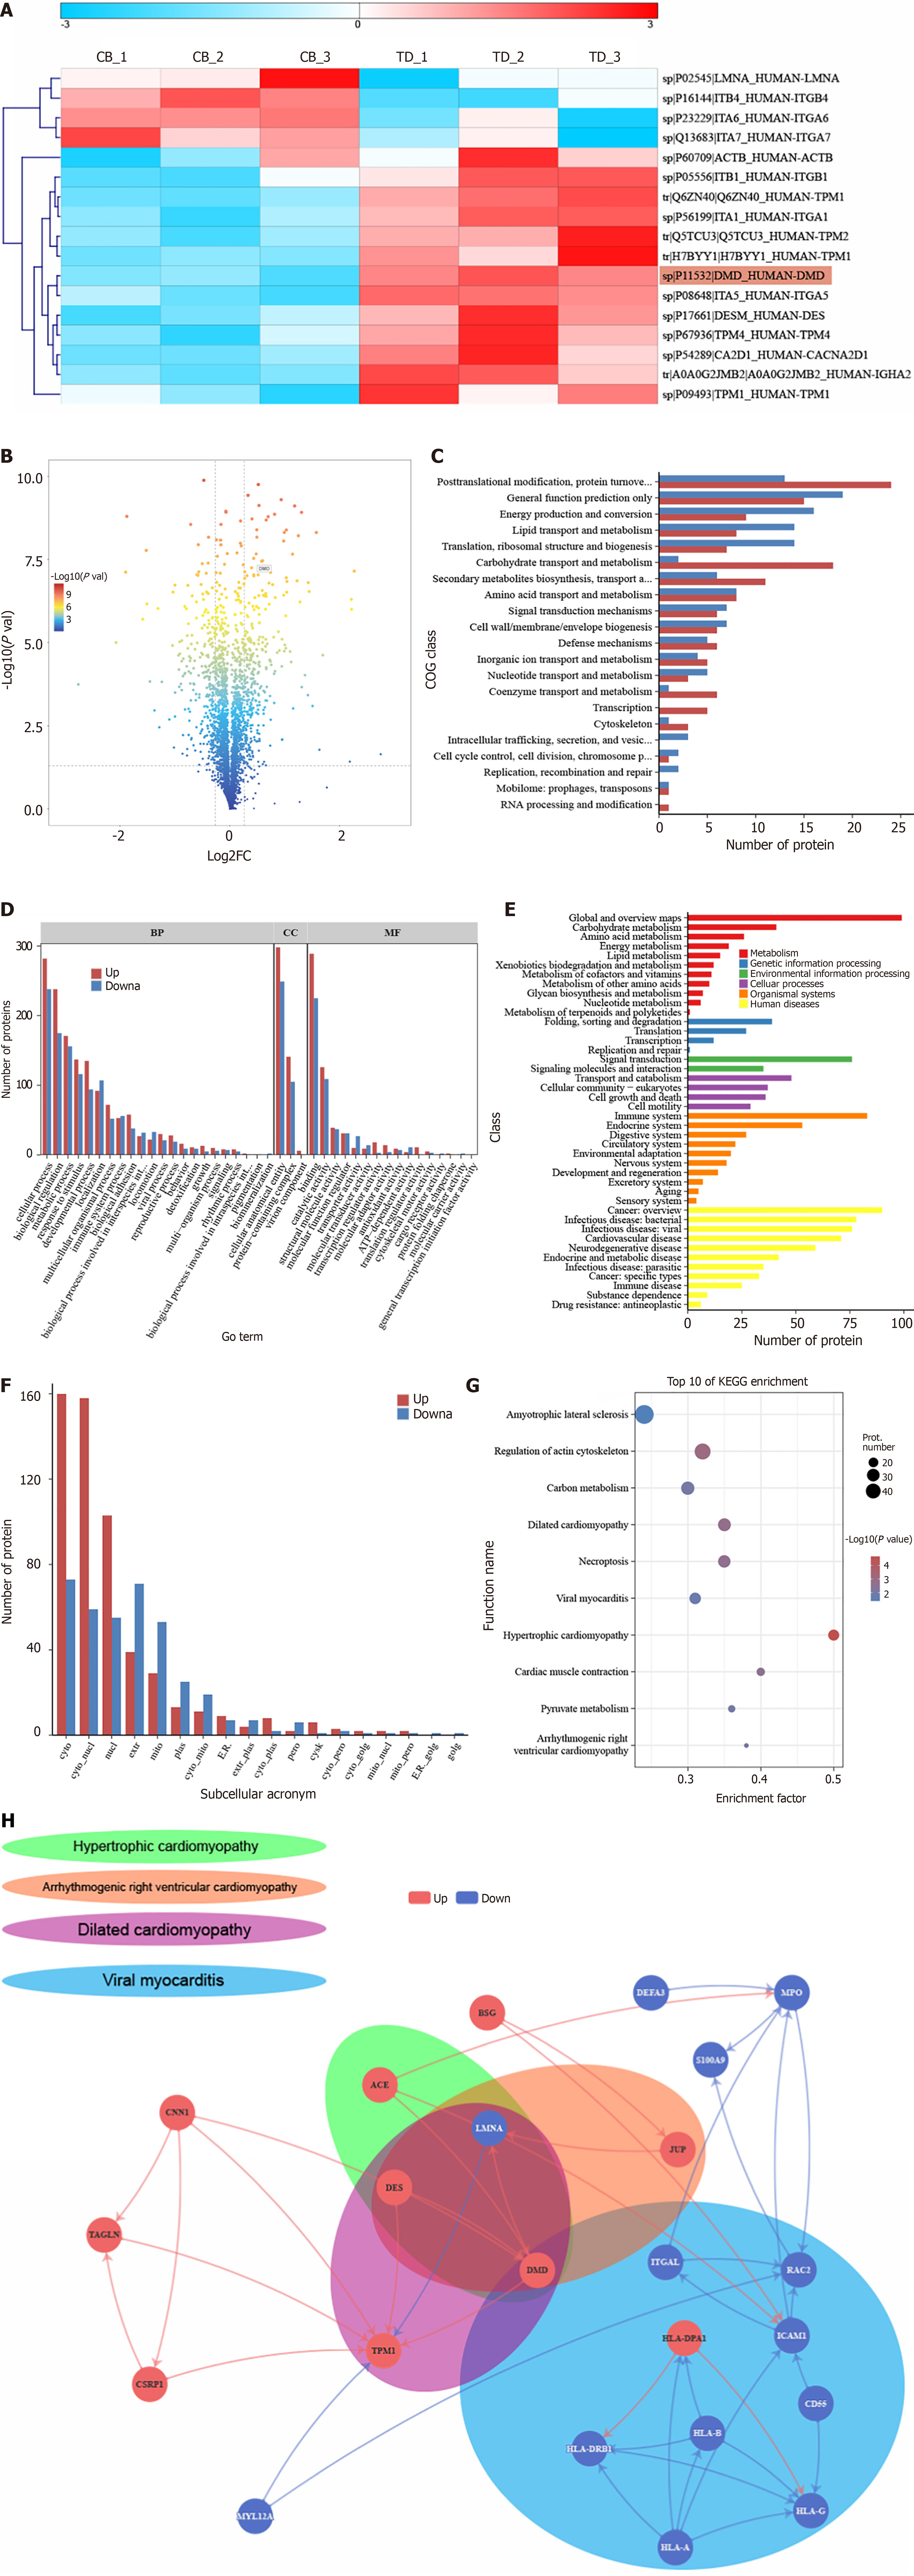
Figure 1 Analysis of differential proteins by isobaric tag for relative and absolute quantification-based quantitative proteomics.
A: Heatmap of all differential proteins in the pathological pathway of dilated cardiomyopathy; B: Volcano plot of differentially expressed proteins; C: Cluster of Orthologous Groups of proteins classification annotation results of differentially expressed proteins; D: Gene Ontology classification statistical plot of differentially expressed proteins; E: Kyoto Encyclopedia of Genes and Genomes (KEGG) classification annotation results of differentially expressed proteins; F: Subcellular localization of differentially expressed proteins; G: KEGG enrichment analysis of differentially expressed proteins. The top 10 most significantly enriched categories are shown in the bubble chart [-log10 (adjusted P value)]. The circle color indicates the enrichment P value, and the circle size indicates the number of differentially expressed proteins in the functional pathway; H: Protein interaction network of significant enrichment pathways associated with muscle contraction disorders. Red indicates up-regulated proteins expressed by the control group relative to the obstructed defecation syndrome group. Blue indicates down-regulated proteins. COG: Cluster of Orthologous Groups; GO: Gene Ontology; KEGG: Kyoto Encyclopedia of Genes and Genomes.
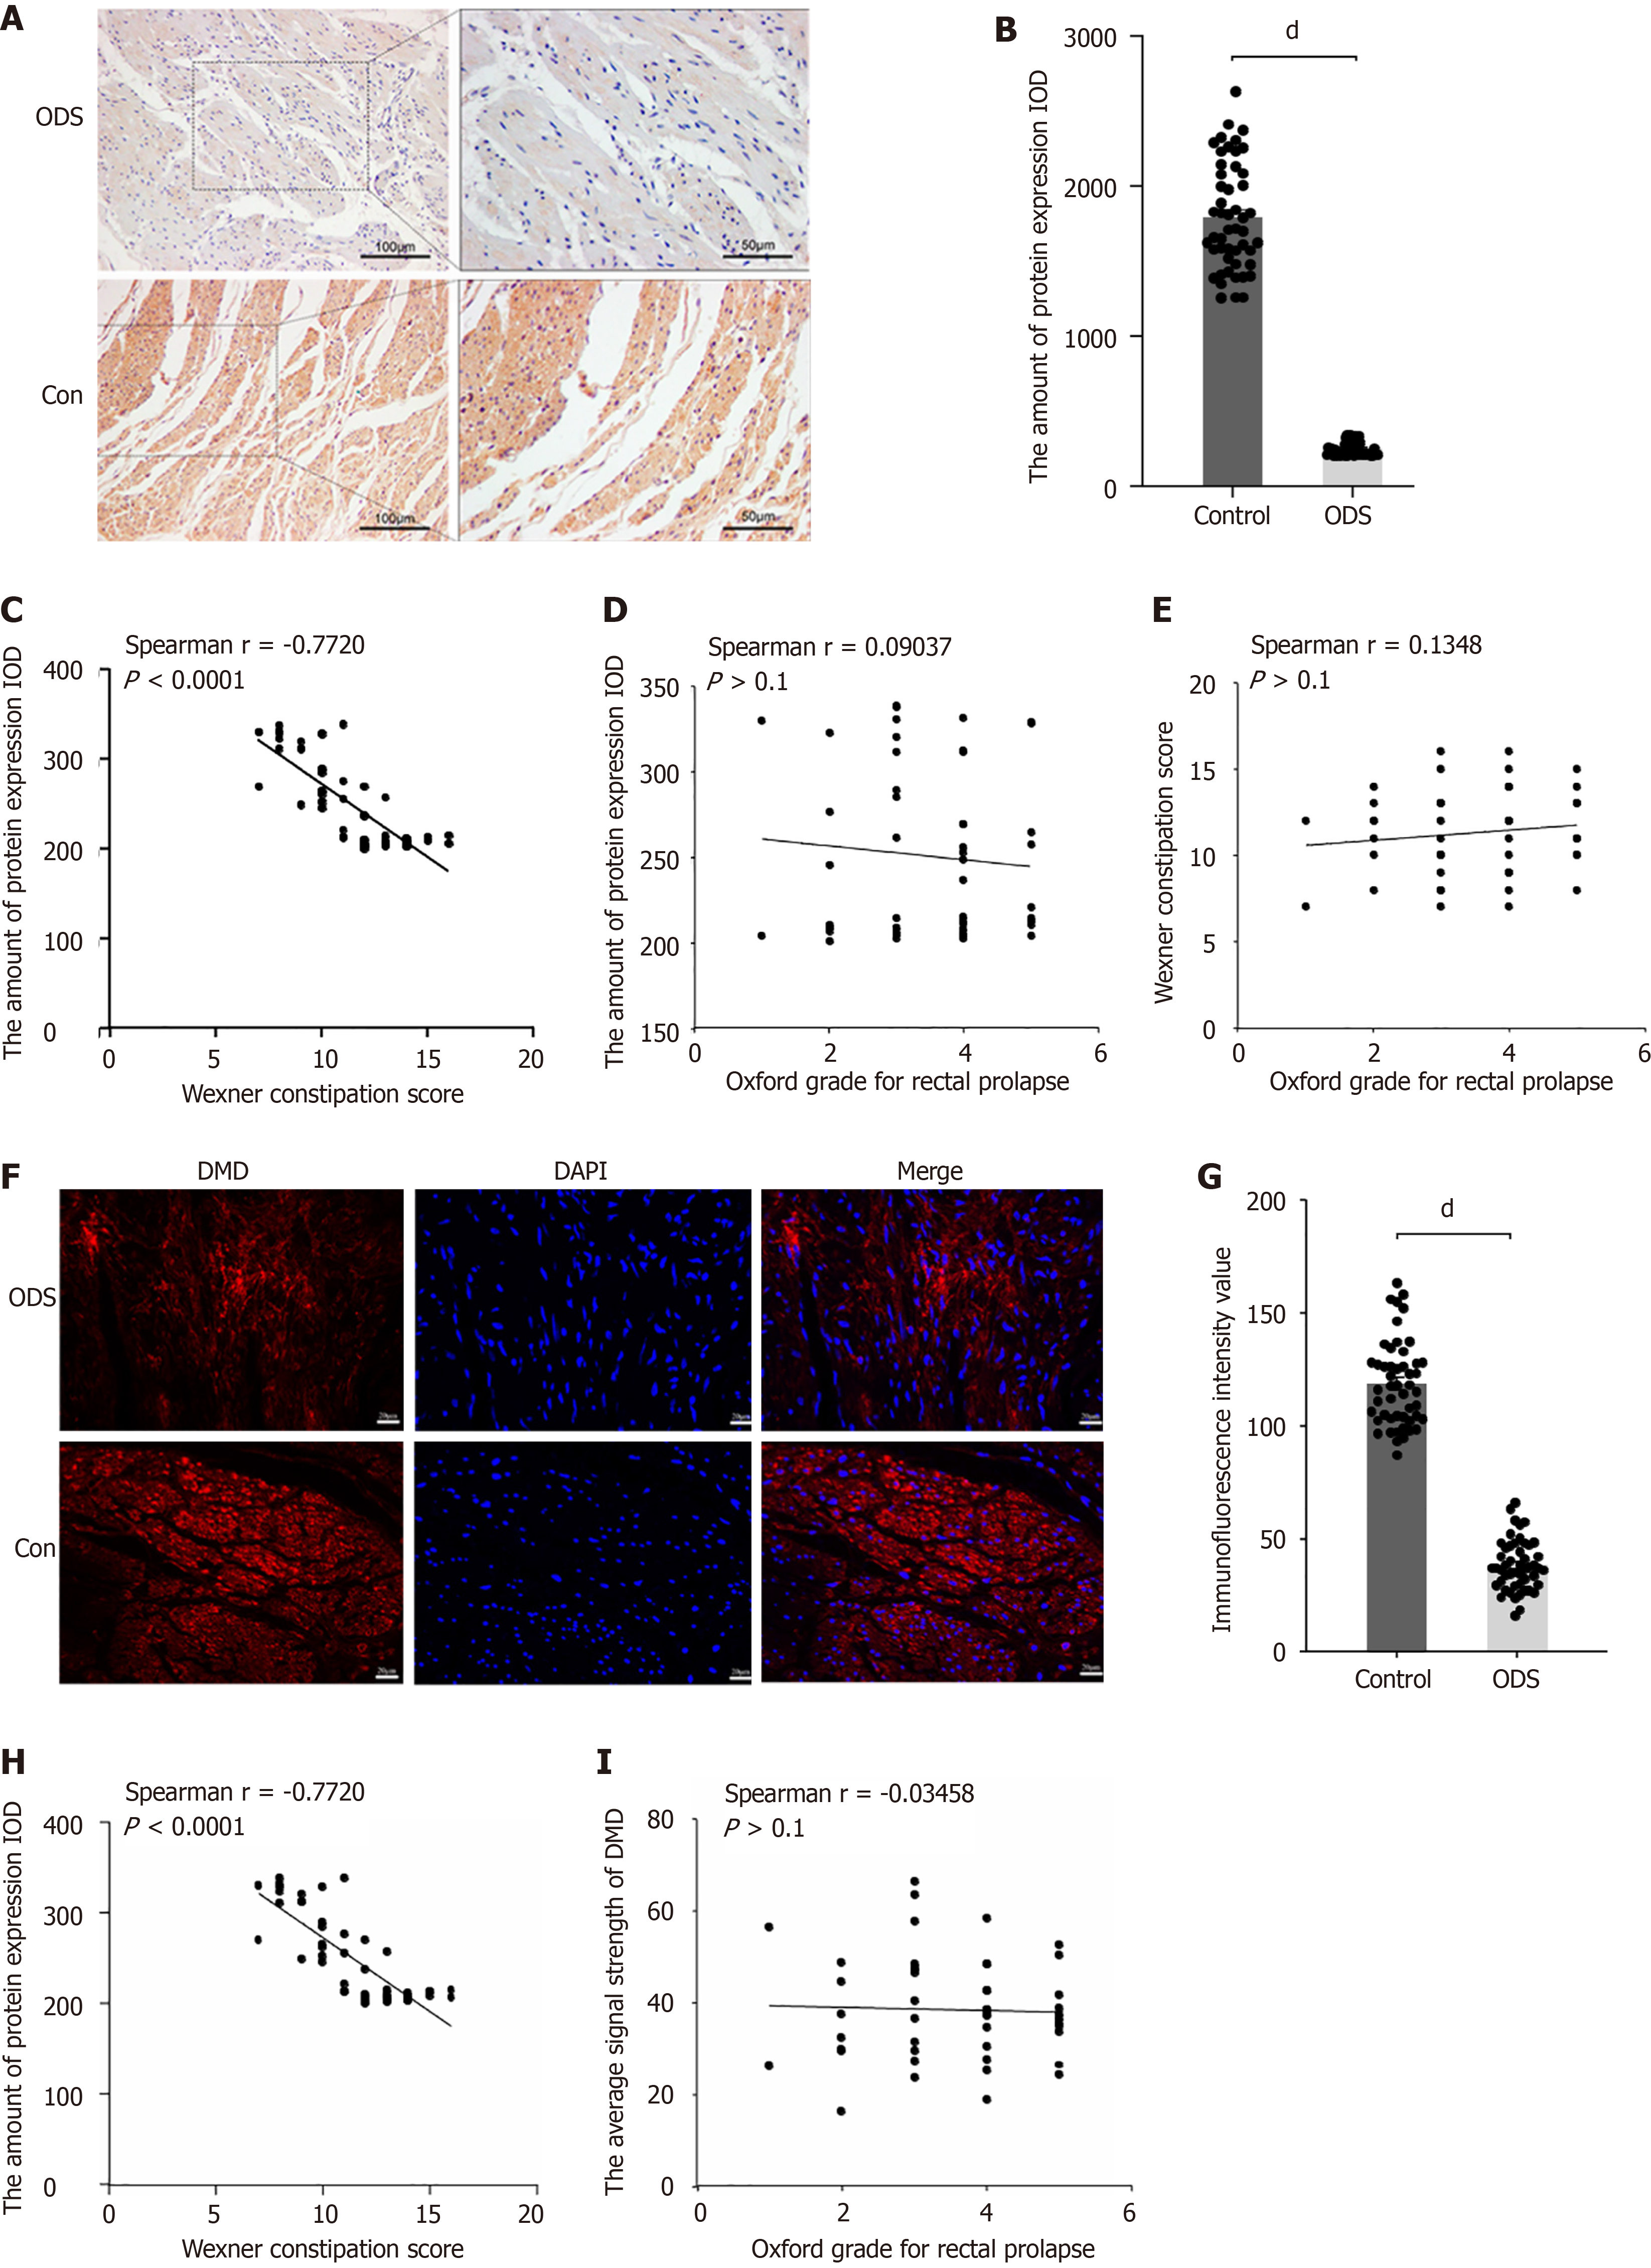
Figure 2 Downregulation of dystrophin in intestinal smooth muscle cells of obstructed defecation syndrome patients.
A: Representative immunohistochemistry staining for dystrophin (DMD) in 50 rectal specimens from both groups. Scale bar: 100 μm (left) and 50 μm (right); B: Quantitative analysis of DMD immunohistochemistry expression [integrated optical density (IOD)] in rectal samples from the obstructed defecation syndrome (ODS) group compared with the control group; C: Correlation analysis between Wexner constipation score and IOD in ODS patients. Spearman correlation r = 0.7720, P < 0.0001; D: Correlation analysis between Wexner constipation score and Oxford score in ODS patients with rectal prolapse. Spearman correlation r = 0.0904, P > 0.1; E: Correlation analysis between Wexner constipation score and IOD in ODS patients. Spearman’s correlation r = 0.1348, P > 0.1; F: Representative immunofluorescence staining for DMD in 50 rectal specimens from both groups. Scale bar = 20 μm. Nuclei were counterstained with DAPI; G: Quantitative analysis of mean fluorescence intensity (MFI) relative to the ODS and control groups; H: Correlation analysis between MFI and Wexner constipation score in the ODS group. Spearman correlation r = 0.7025, P < 0.0001; I: Correlation analysis between MFI and Oxford grade in ODS patients with rectal prolapse. Spearman correlation r = 0.03458, P > 0.1. dP < 0.0001. ODS: Obstructed defecation syndrome; IOD: Integrated optical density; DMD: Dystrophin.
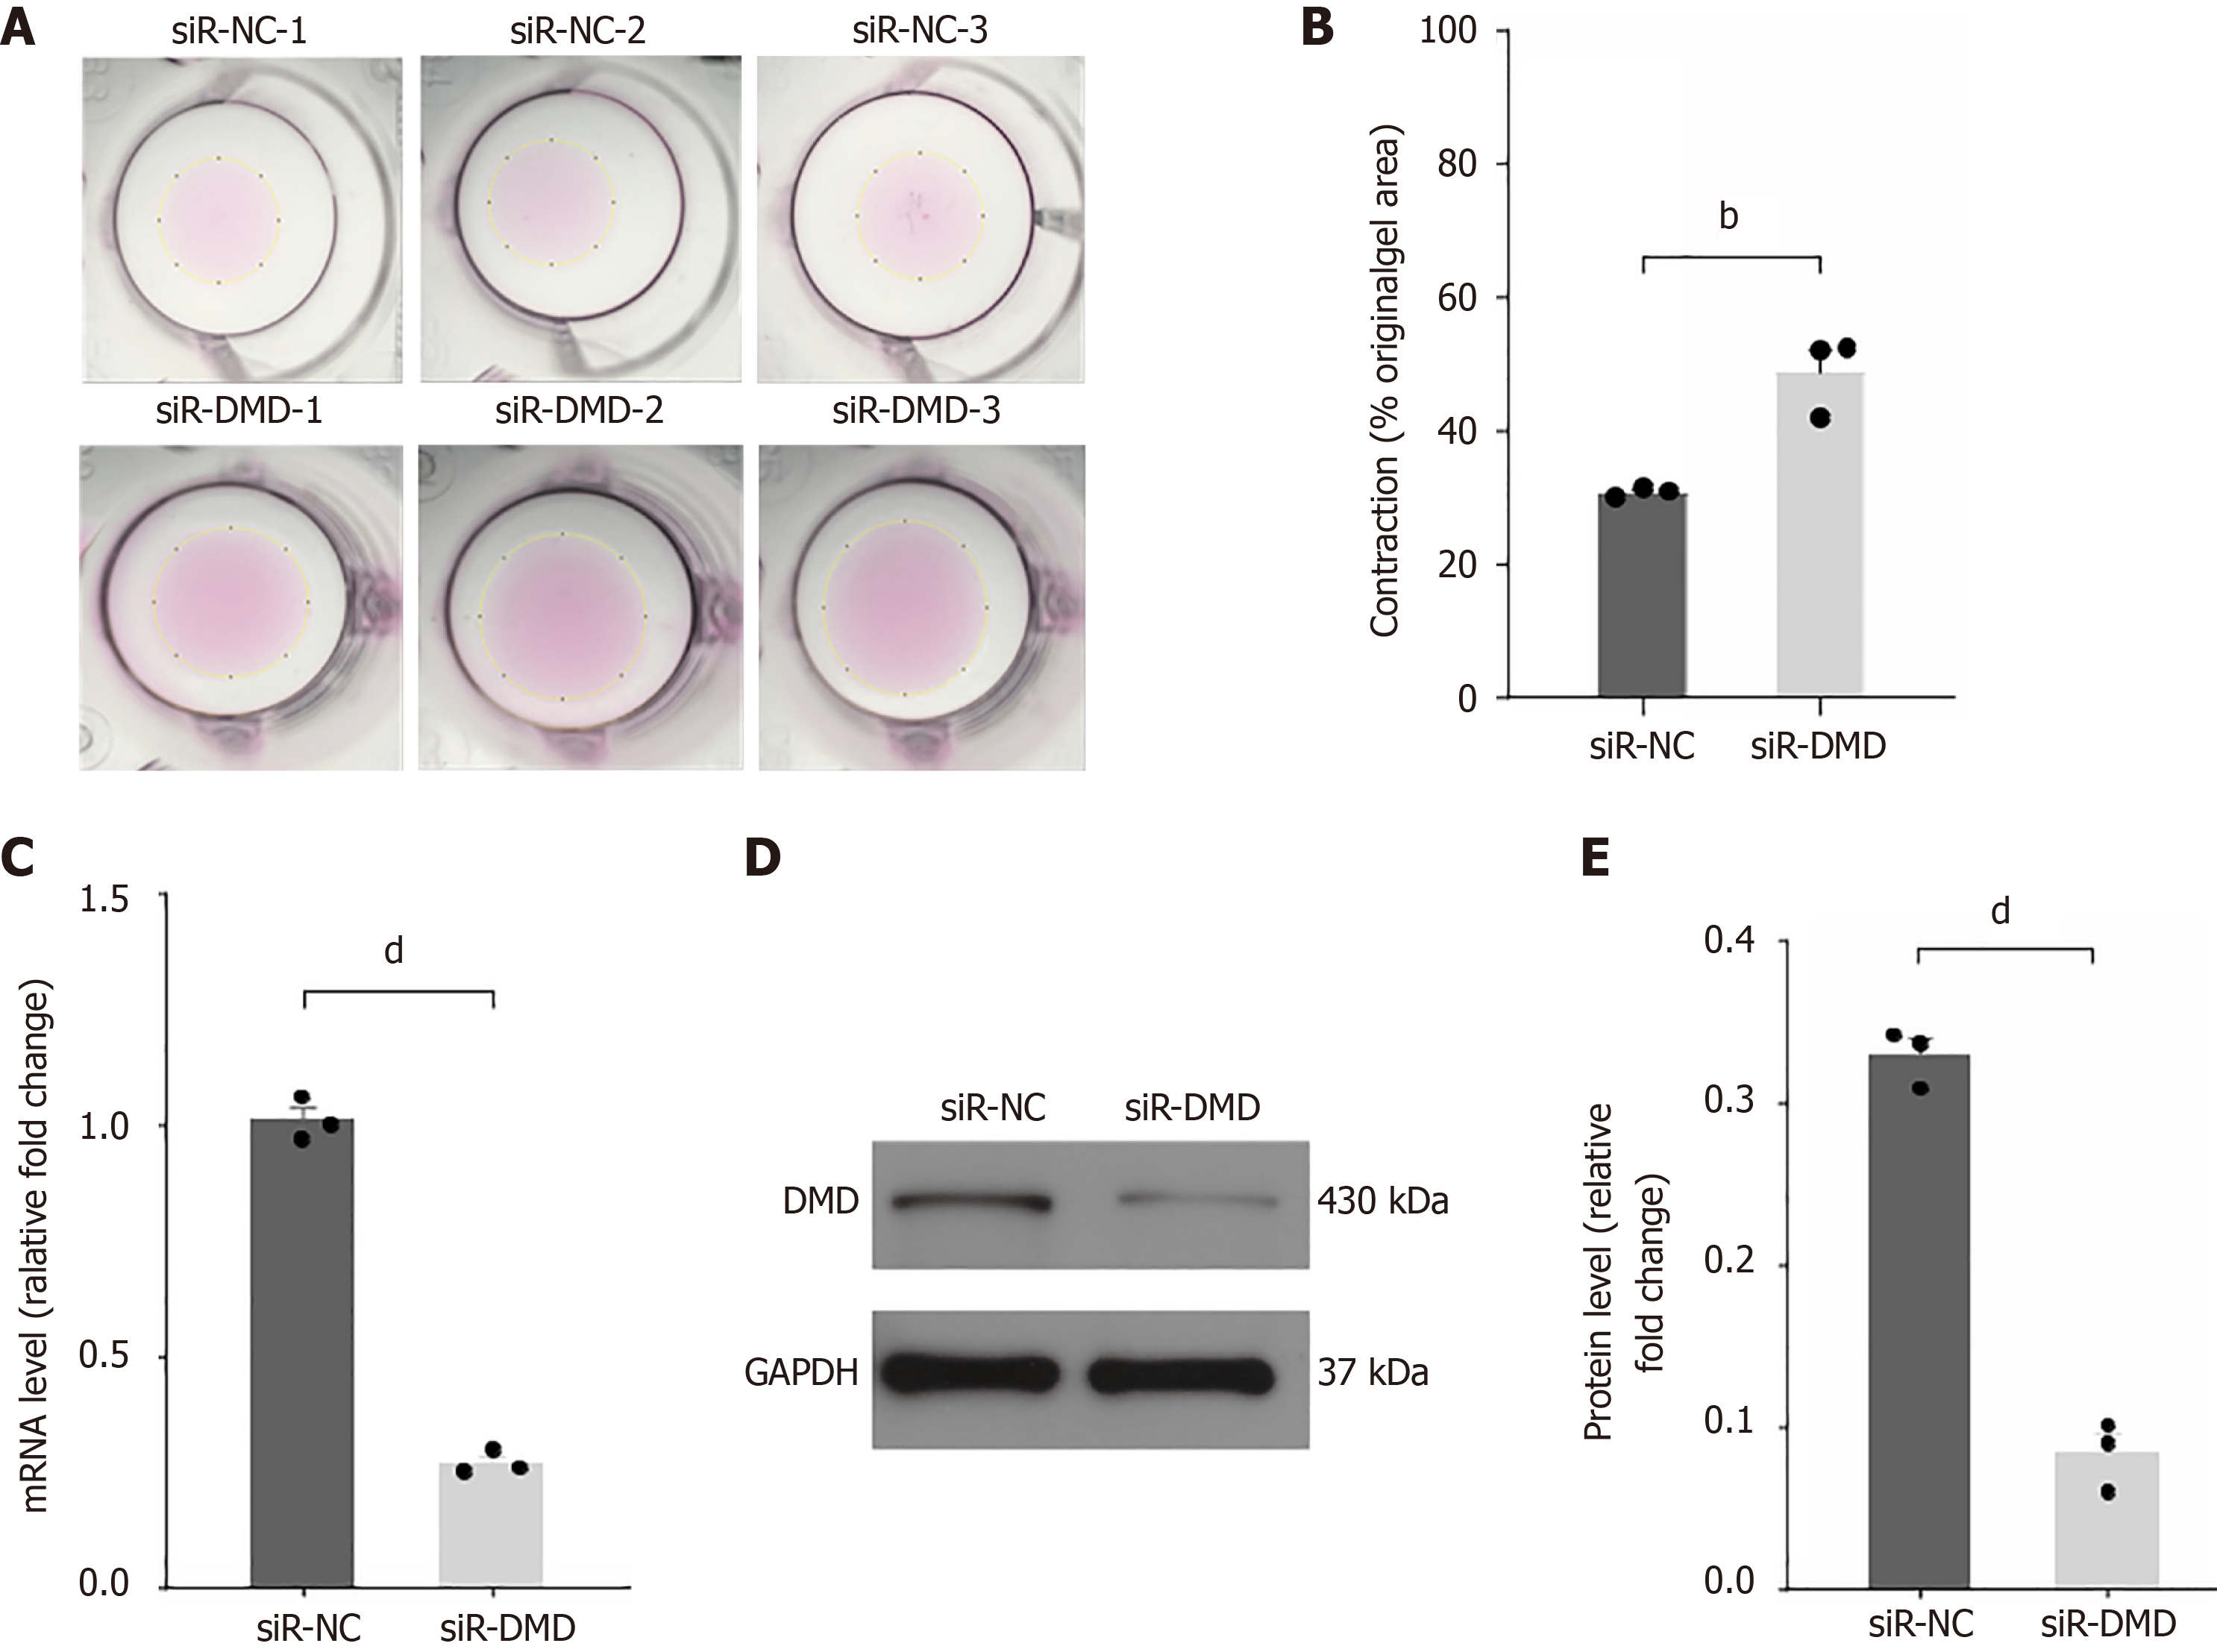
Figure 3 Downregulation of dystrophin expression is associated with impaired contraction of human intestinal smooth muscle cells.
A: Assessment of contractile function in intestinal smooth muscle cells after transfection with negative control small interfering RNA (siR-NC) (top) or siR-dystrophin (siR-DMD) (bottom); B: Quantitative analysis of cell area after contraction in both groups; C: Detection of DMD expression in human intestinal smooth muscle cells transfected with siR-NC or siR-DMD by real-time quantitative polymerase chain reaction; D: Western blot detection of DMD expression in whole cell extracts of human intestinal smooth muscle cells transfected with siR-NC or siR-DMD; E: Quantitative analysis of Western blot greyscale value. bP < 0.01, dP < 0.0001, n = 3. siR-NC: Negative control small interfering RNA; siR-DMD: Dystrophin small interfering RNA; DMD: Dystrophin.
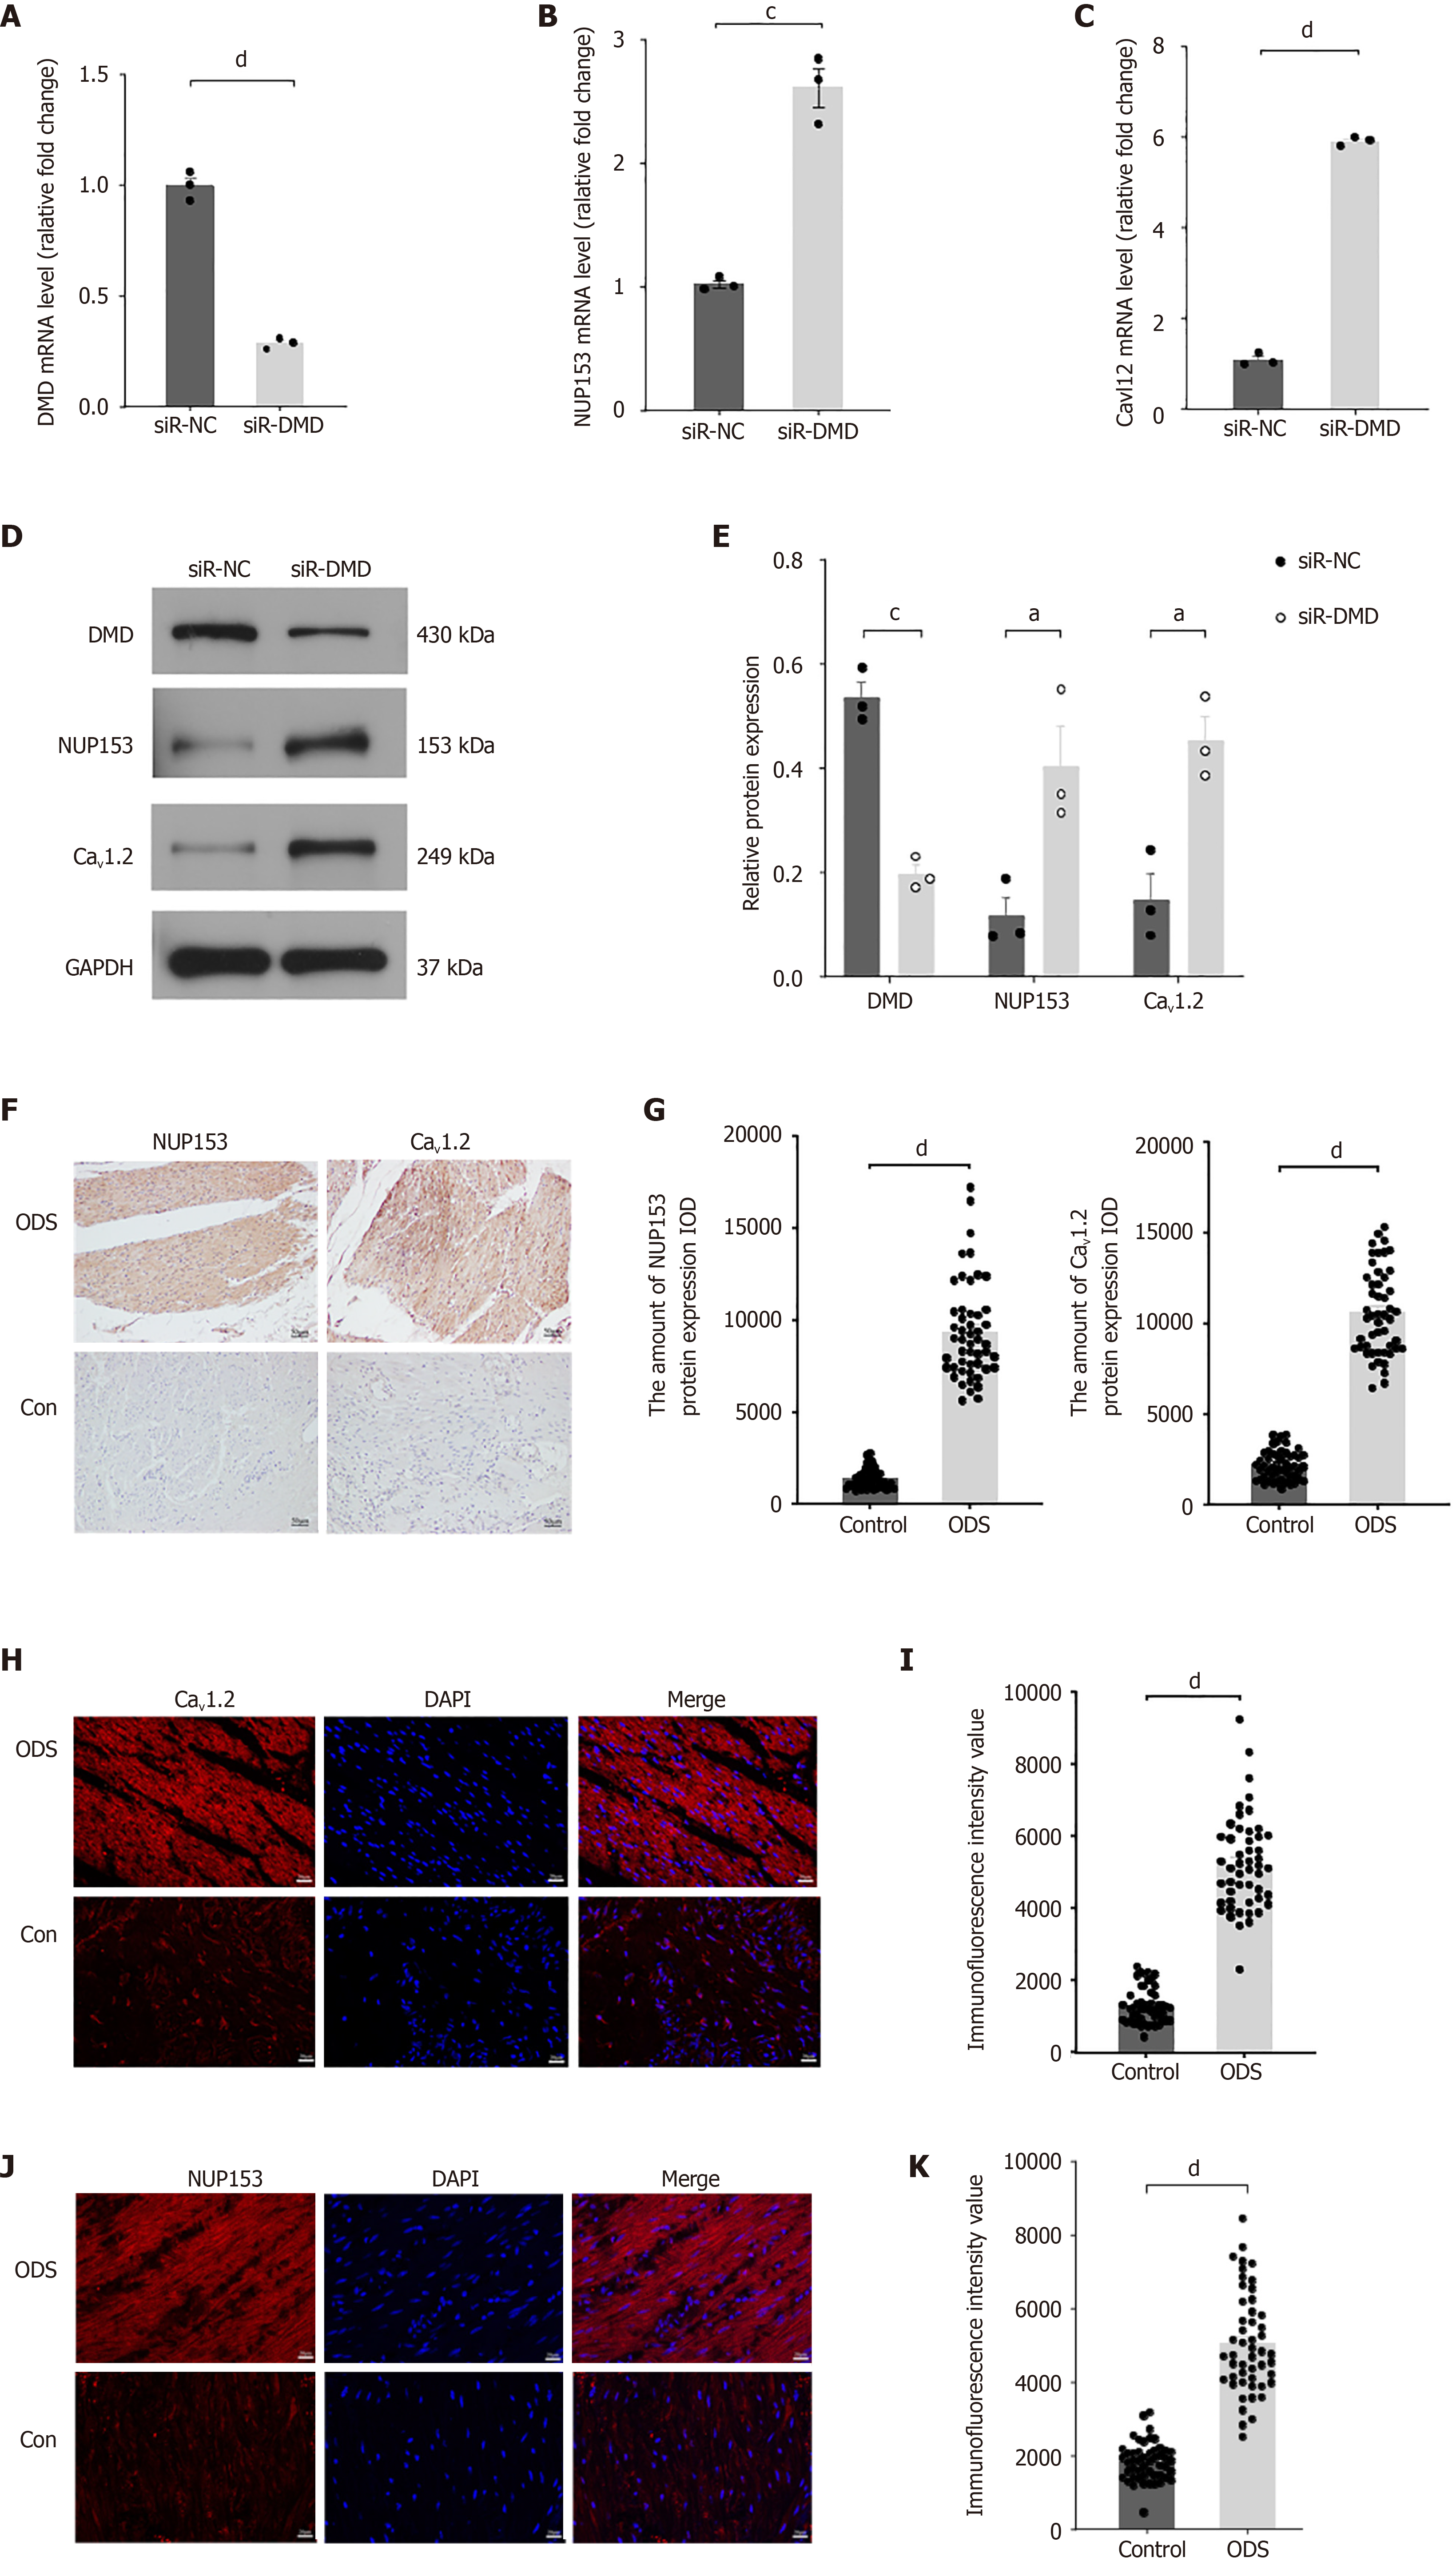
Figure 4 Overexpression of nucleoporin protein 153 and L-type voltage-gated calcium channel is associated with downregulation of dystrophin expression in human intestinal smooth muscle cells.
A: Real-time quantitative polymerase chain reaction (RT-qPCR) was used to detect the expression of dystrophin (DMD) in human intestinal smooth muscle cells transfected with negative control small interfering RNA (siR-NC) or siR-dystrophin (siR-DMD); B: RT-qPCR was used to detect the expression of nucleoporin protein 153 (NUP153) in human intestinal smooth muscle cells transfected with siR-NC or siR-DMD; C: RT-qPCR was used to detect the expression of L-type voltage-gated calcium channel (Cav1.2) in human intestinal smooth muscle cells transfected with siR-NC or siR-DMD; D: Western blot analysis of the levels of DMD, NUP153, and Cav1.2 in human intestinal smooth muscle cells transfected with siR-NC or siR-DMD; E: Quantitative analysis of Western blot greyscale value; F: Representative immunohistochemistry staining for NUP153 and Cav1.2 in rectal specimens from two groups of 50 cases. Scale bar = 50 μm; G: Quantitative analysis of the immunohistochemistry expression of NUP153 and Cav1.2 (integrated optical density of NUP153 and Cav1.2) in rectum samples of the obstructed defecation syndrome (ODS) group compared with the control group; H: Representative immunofluorescence staining for NUP153 in rectal specimens from two groups of 50 cases. Scale bar = 20 μm. Nuclei were counterstained with DAPI; I: Quantitative analysis of mean fluorescence intensity of NUP153 relative to the ODS and control groups; J: Representative immunofluorescence staining for Cav1.2 in rectal specimens from two groups of 50 cases. Scale bar = 20 μm. Nuclei were counterstained with DAPI; K: Quantitative analysis of mean fluorescence intensity of Cav1.2 relative to the ODS and control groups. aP < 0.05, cP < 0.001, dP < 0.0001, n = 3. siR-NC: Negative control small interfering RNA; siR-DMD: Dystrophin small interfering RNA; DMD: Dystrophin; ODS: Obstructed defecation syndrome; NUP153: Nucleoporin protein 153; Cav1.2: L-type voltage-gated calcium channel.
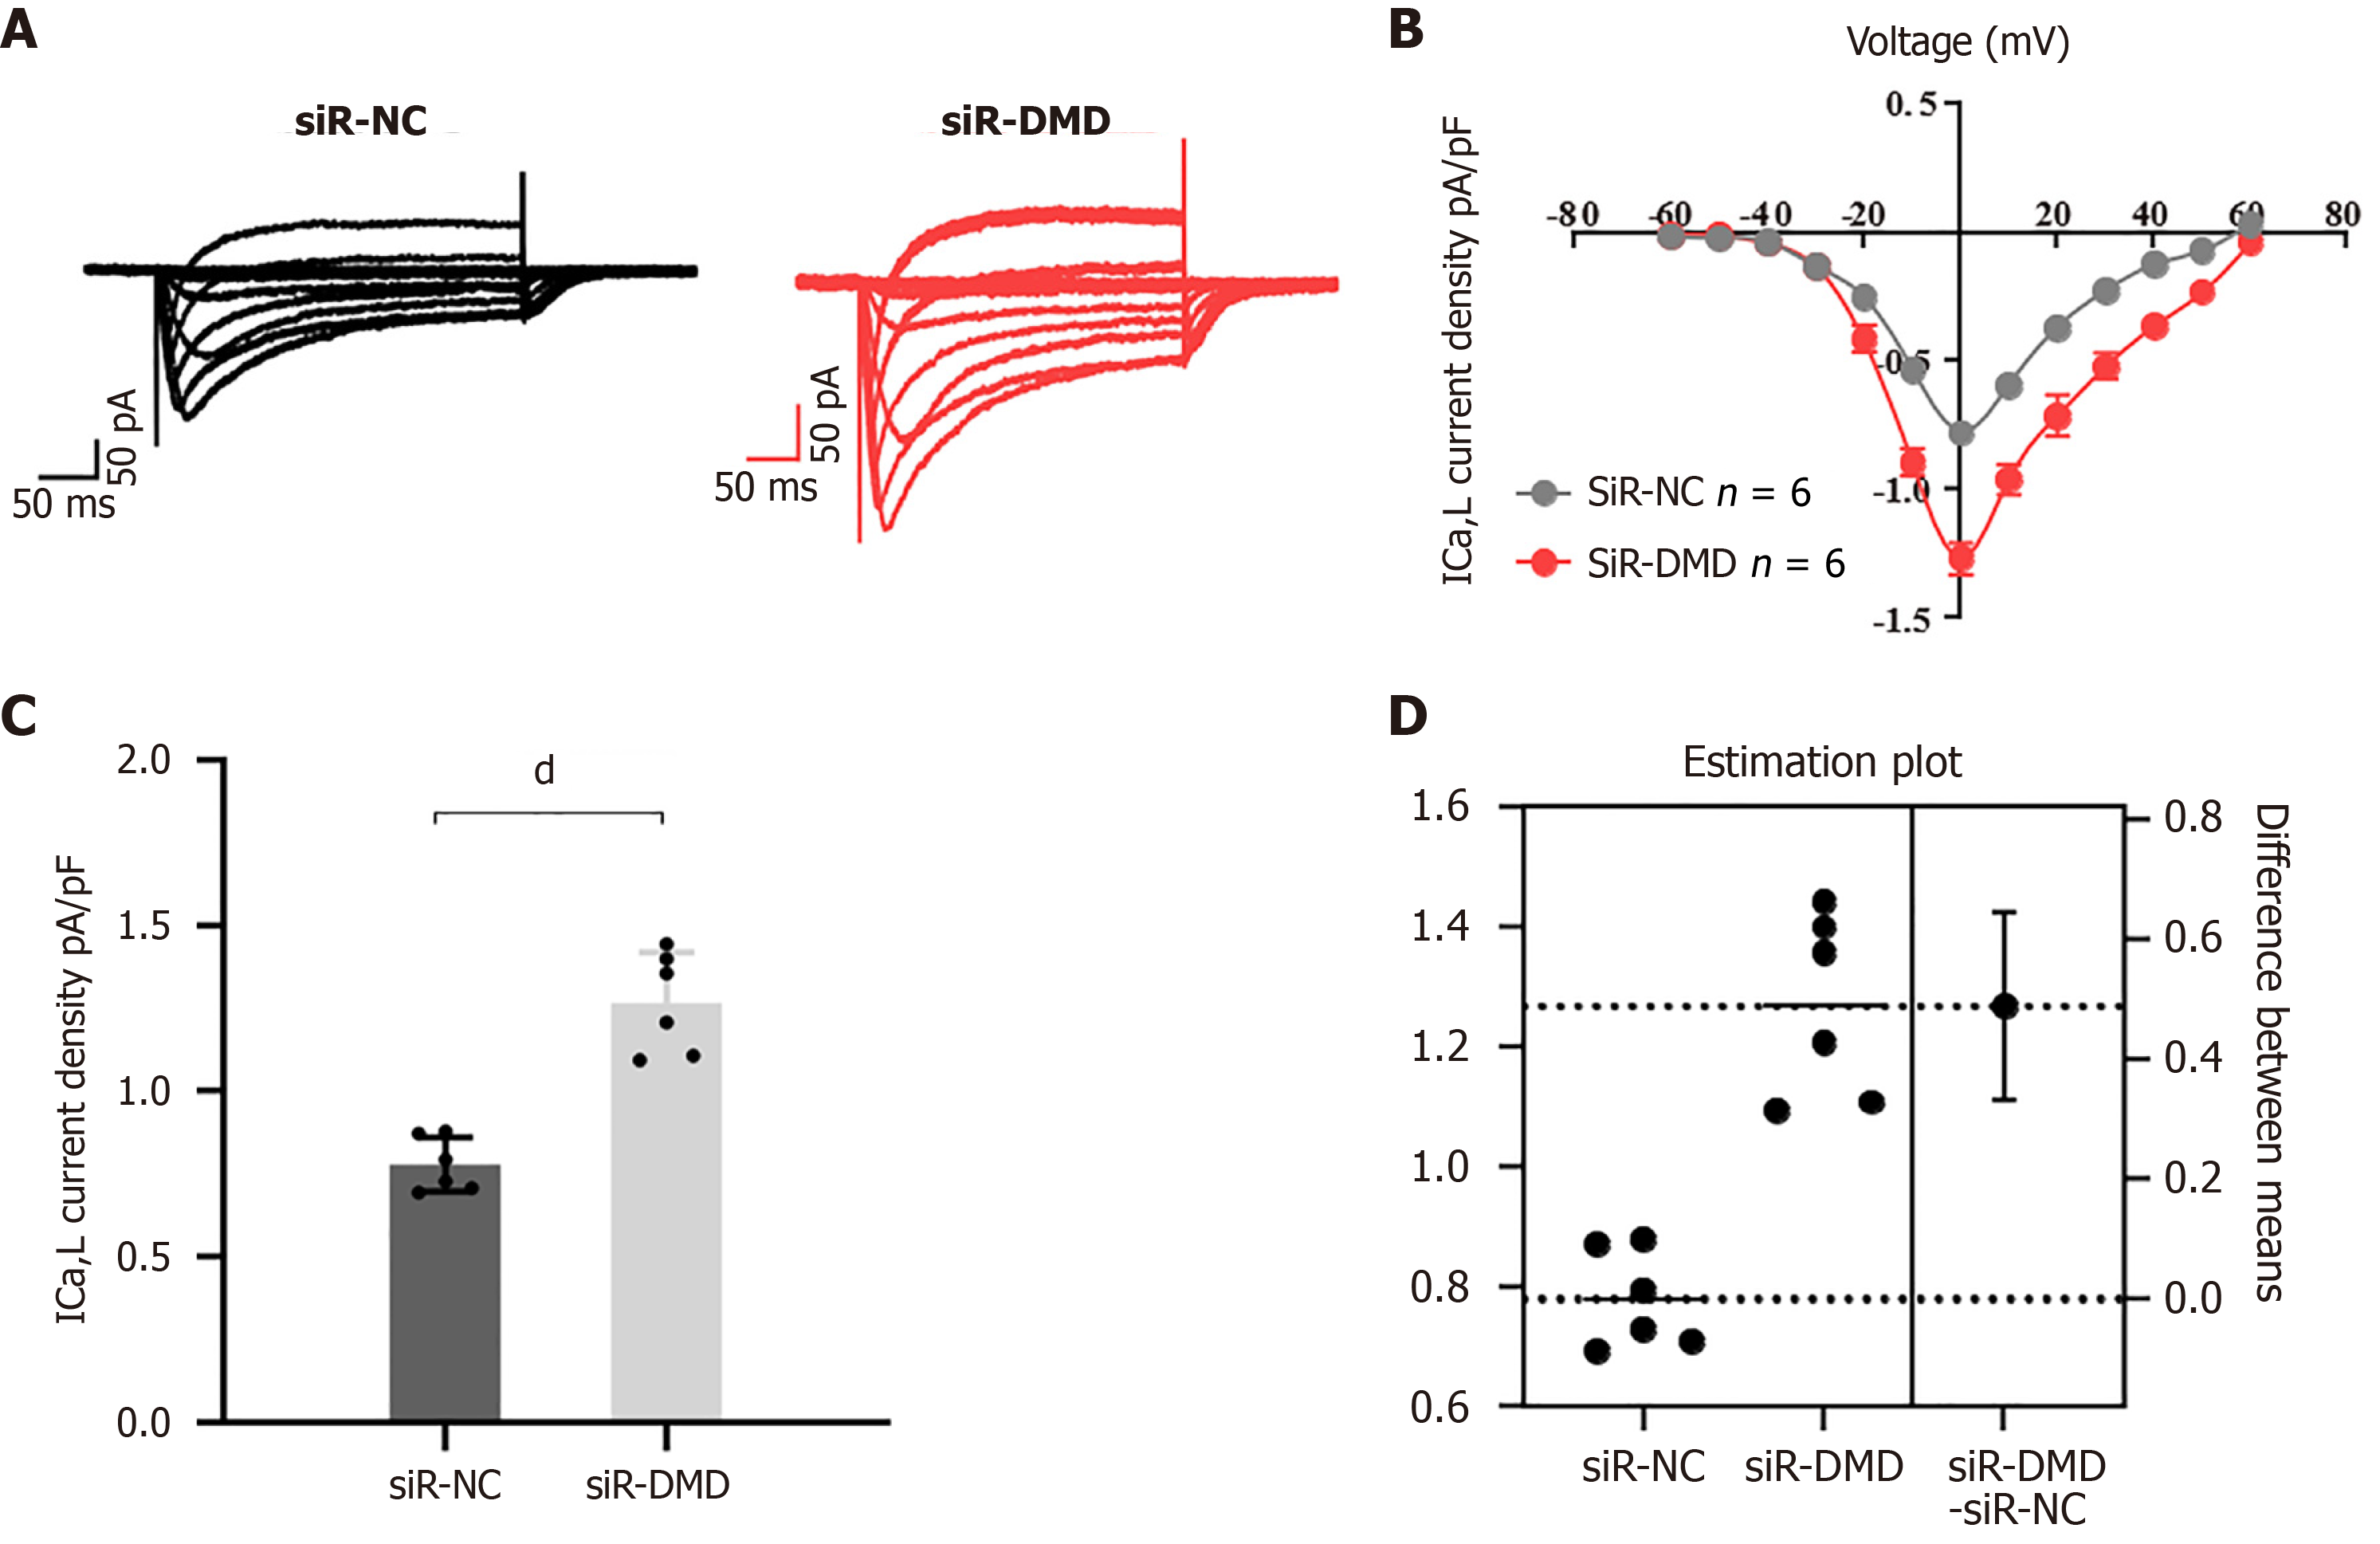
Figure 5 Downregulation of dystrophin expression leads to dysregulation of calcium influx in human intestinal smooth muscle cells.
A: Representative traces of L-type calcium currents (ICa, L) were recorded from human intestinal smooth muscle cells transfected with negative control small interfering RNA (siR-NC) or siR-dystrophin (siR-DMD) using patch-clamp techniques (the X-axis represents the time in milliseconds and the Y-axis represents the current magnitude in pico-amps); B: Line graph of ICa-L current density. The inward current induced by depolarization voltage increased after siR-DMD transfection; C: Peak intracellular calcium concentrations in the two groups of human intestinal smooth muscle cells; D: Average difference between cells transfected with siR-NC or siR-DMD shown in the estimated graph above. Both groups are plotted on the left Y-axis; the mean difference is shown as a bootstrap sampling distribution on the floating axis on the right. dP < 0.0001, n = 6. siR-NC: Negative control small interfering RNA; siR-DMD: Dystrophin small interfering RNA; DMD: Dystrophin; ICa-L: L-type calcium currents.
Figure 6 Representative images of two groups of cells examined under a transmission electron microscope.
A: Outline of control group intestinal smooth muscle cells. Orange arrows indicate intact cell membranes. Scale bar = 2 μm; B: Outline of experimental group intestinal smooth muscle cells. Orange arrows indicate intact cell membranes. Blue arrows indicate an abundance of vacuolar-like structures. Scale bar = 2 μm; C: Characterization of cell size under a transmission electron microscope. dP < 0.0001. siR-NC: Negative control small interfering RNA; siR-DMD: Dystrophin small interfering RNA.
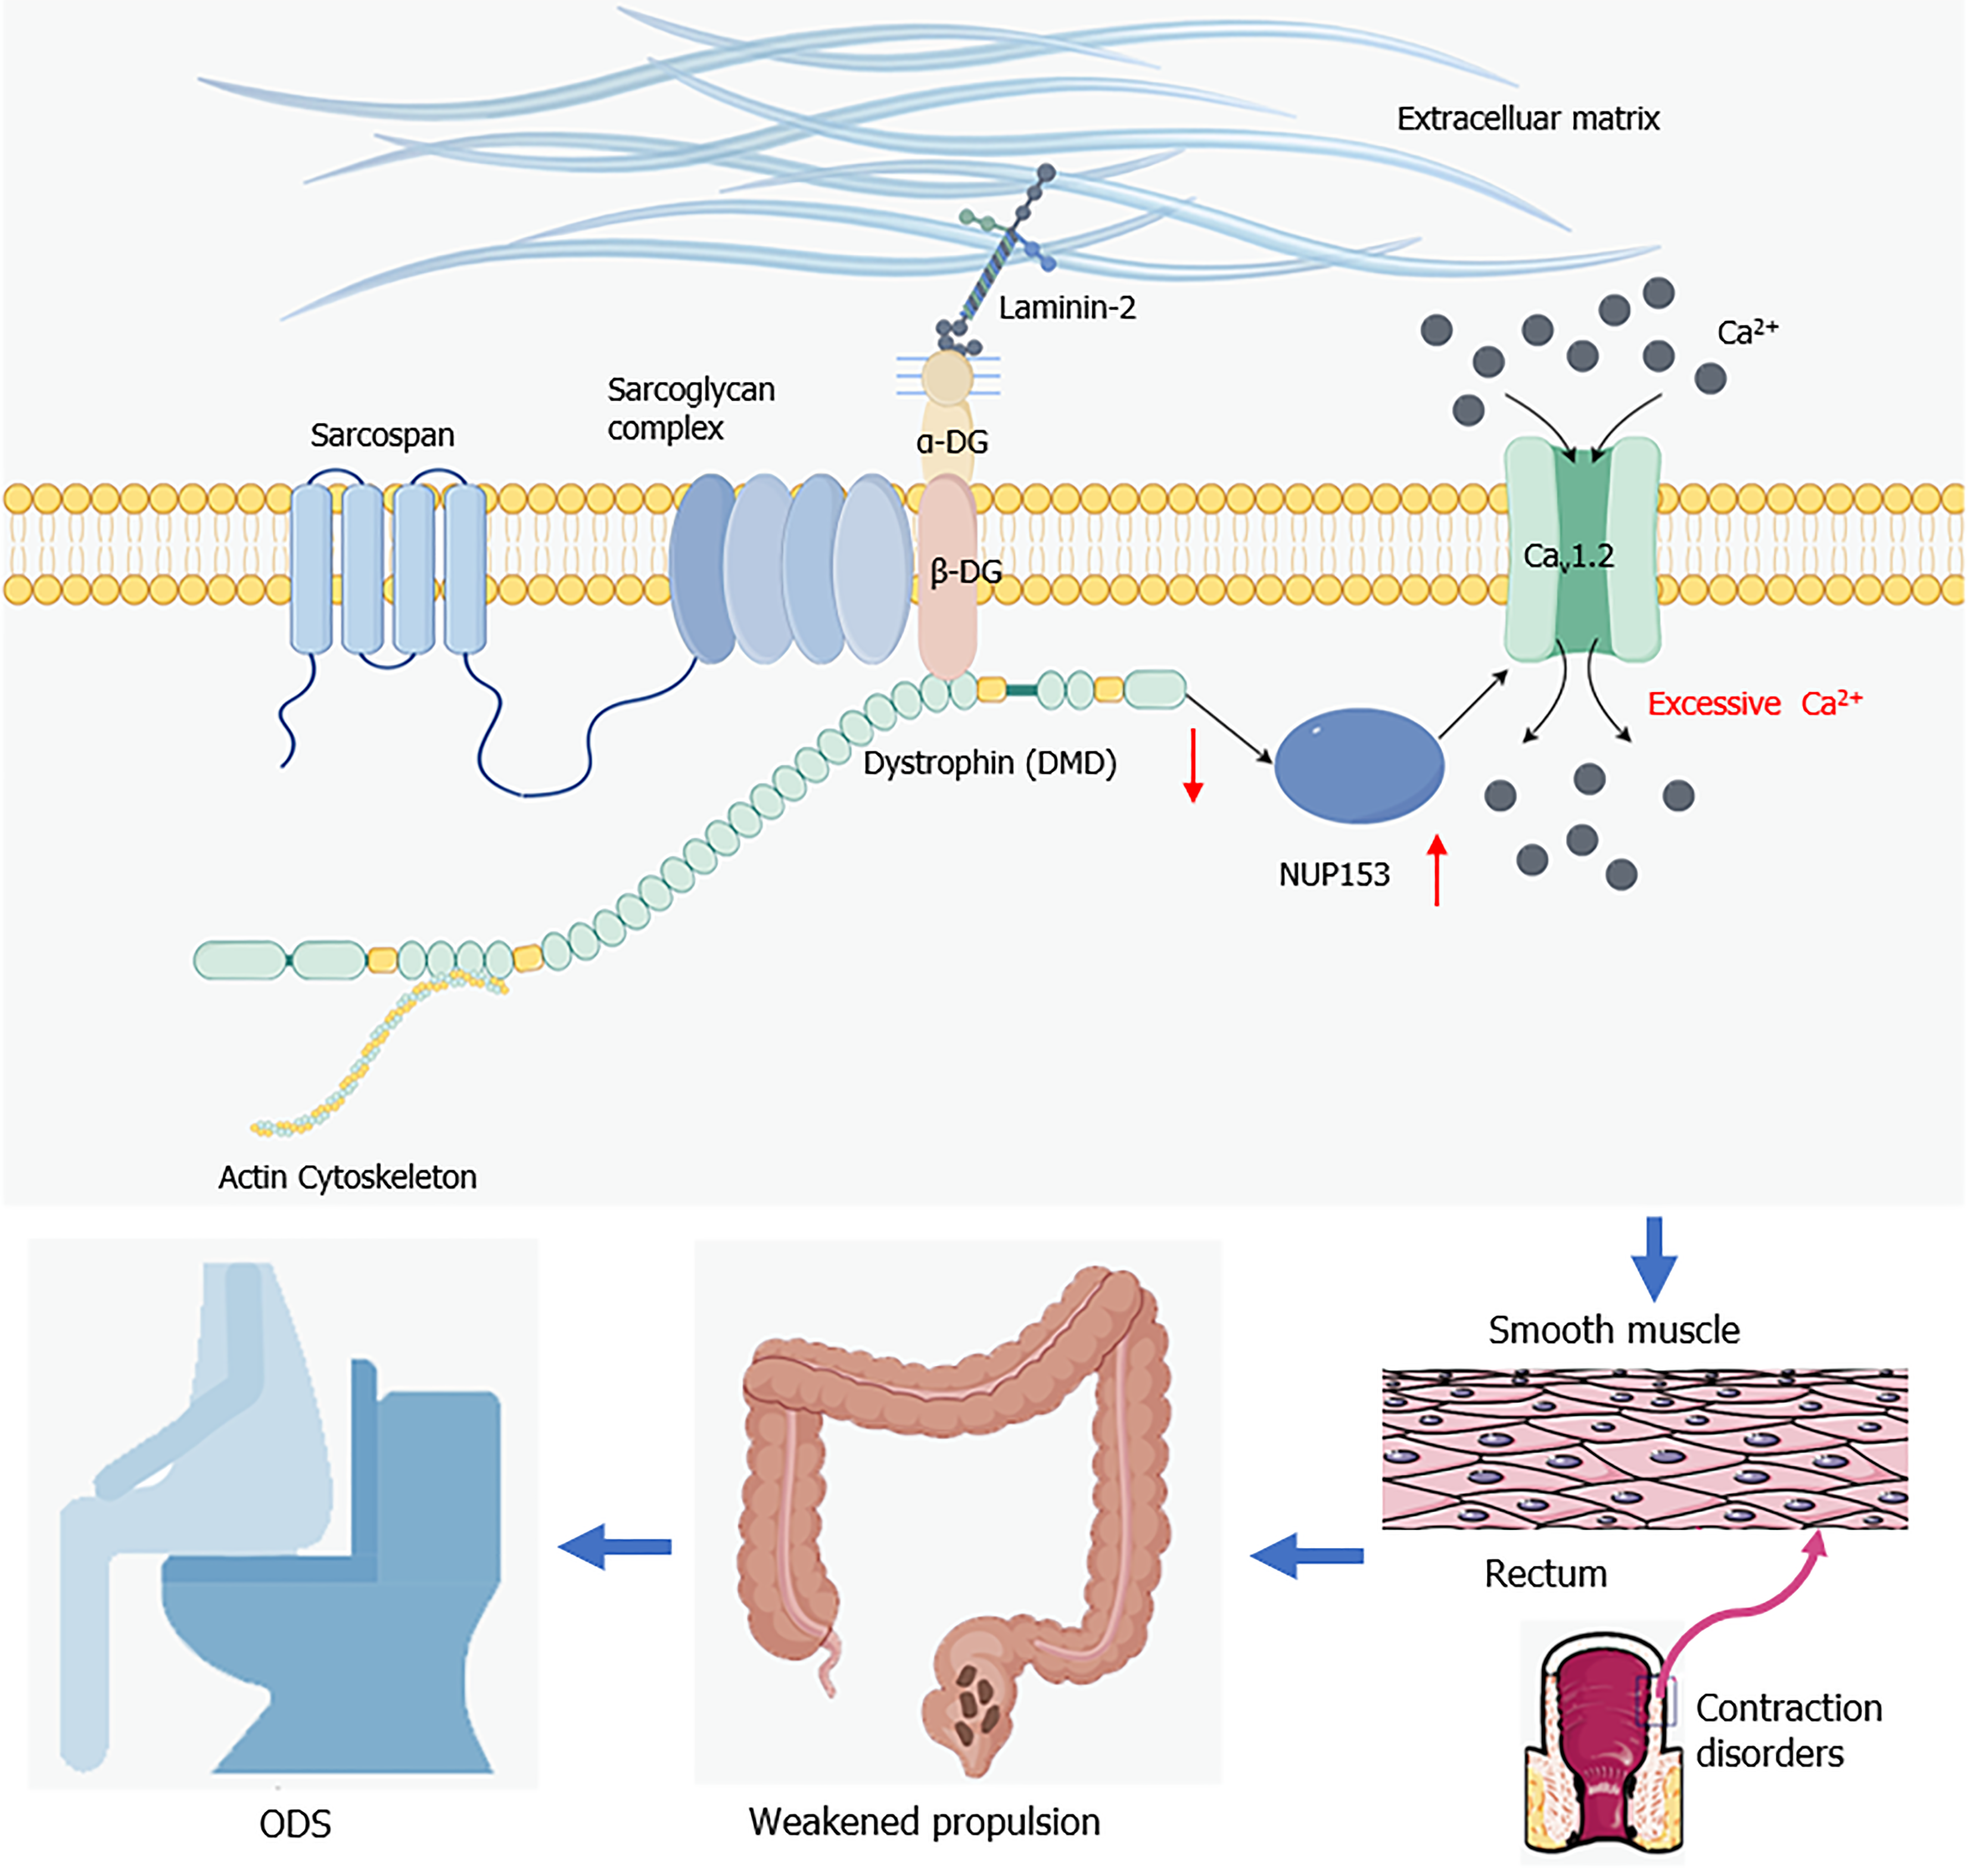
Figure 7 Diagram illustrating role of dystrophin in obstructed defecation syndrome (created with Figdraw 2.
0). In intestinal smooth muscle cells, altered expression of dystrophin affects the expression of nucleoporin protein 153, leading to its L-type voltage-gated calcium channel being overactivated and increasing calcium influx. Under these circumstances, the contractile function of intestinal smooth muscle cells is impaired, resulting in insufficient rectal propulsion force, ultimately leading to obstructed defecation syndrome. ODS: Obstructed defecation syndrome; NUP153: Nucleoporin protein 153; Cav1.2: L-type voltage-gated calcium channel.
- Citation: Li WZ, Xiong Y, Wang TK, Chen YY, Wan SL, Li LY, Xu M, Tong JJ, Qian Q, Jiang CQ, Liu WC. Quantitative proteomics analysis reveals the pathogenesis of obstructed defecation syndrome caused by abnormal expression of dystrophin. World J Gastroenterol 2024; 30(45): 4817-4835
- URL: https://www.wjgnet.com/1007-9327/full/v30/i45/4817.htm
- DOI: https://dx.doi.org/10.3748/wjg.v30.i45.4817


