Copyright
©The Author(s) 2024.
World J Gastroenterol. Dec 7, 2024; 30(45): 4801-4816
Published online Dec 7, 2024. doi: 10.3748/wjg.v30.i45.4801
Published online Dec 7, 2024. doi: 10.3748/wjg.v30.i45.4801
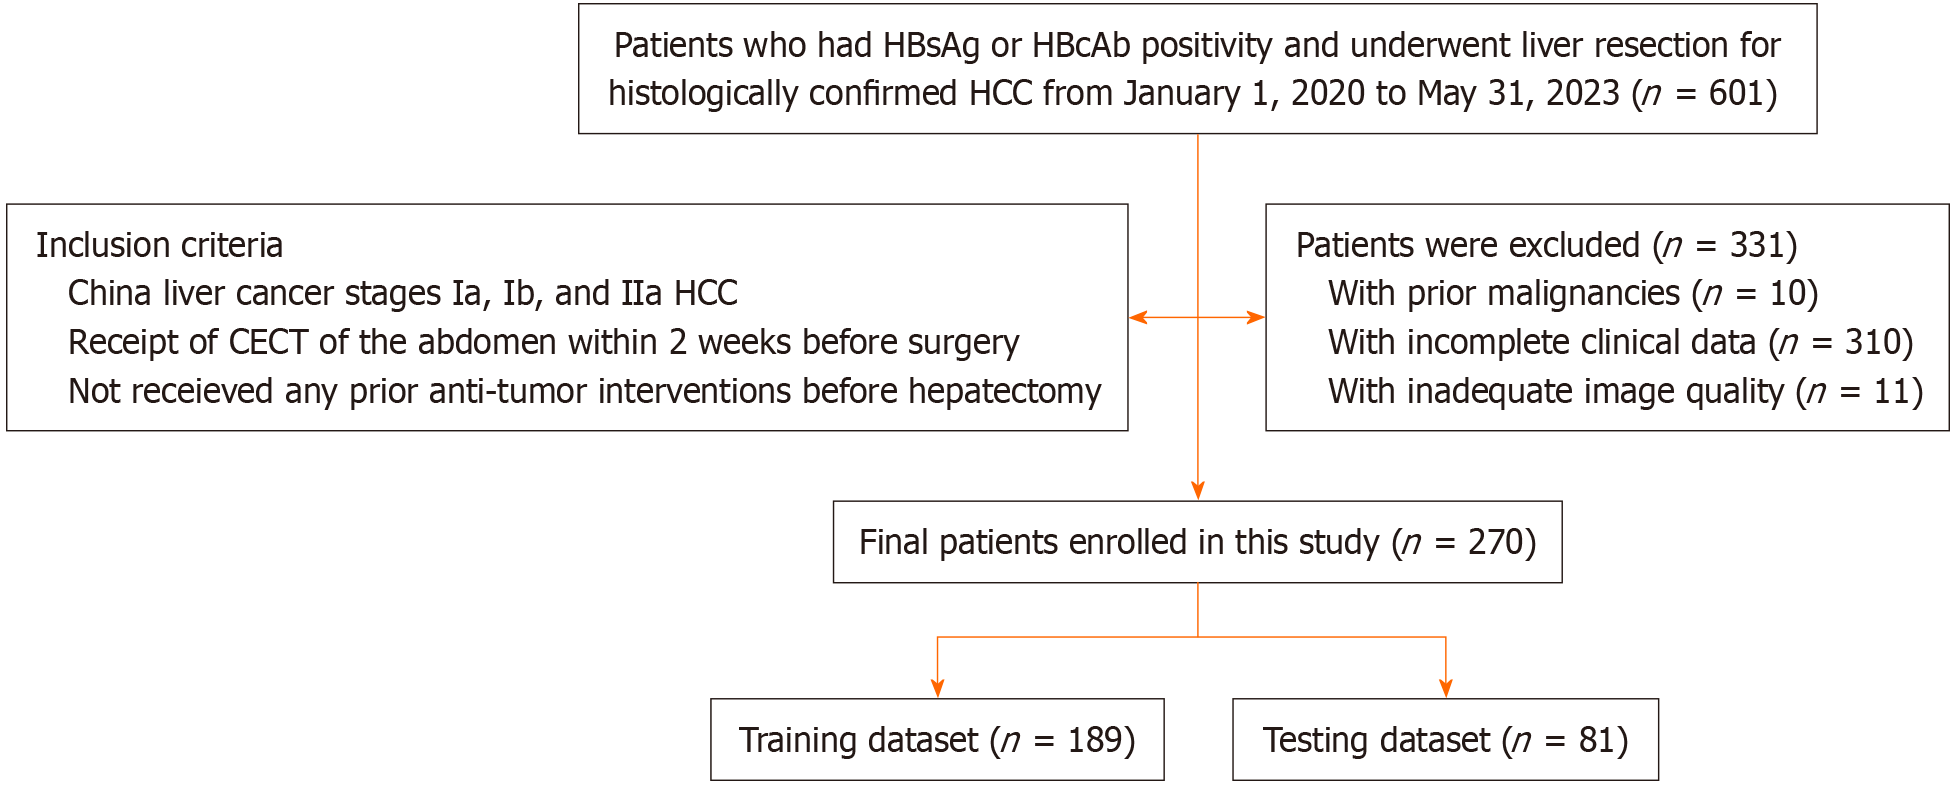
Figure 1 Flow diagram of the study enrolment patients.
HBsAg: Hepatitis B surface antigen; HBcAb: Anti-hepatitis B core antigen antibodies; HCC: Hepatocellular carcinoma; CECT: Contrast-enhanced computed tomography.
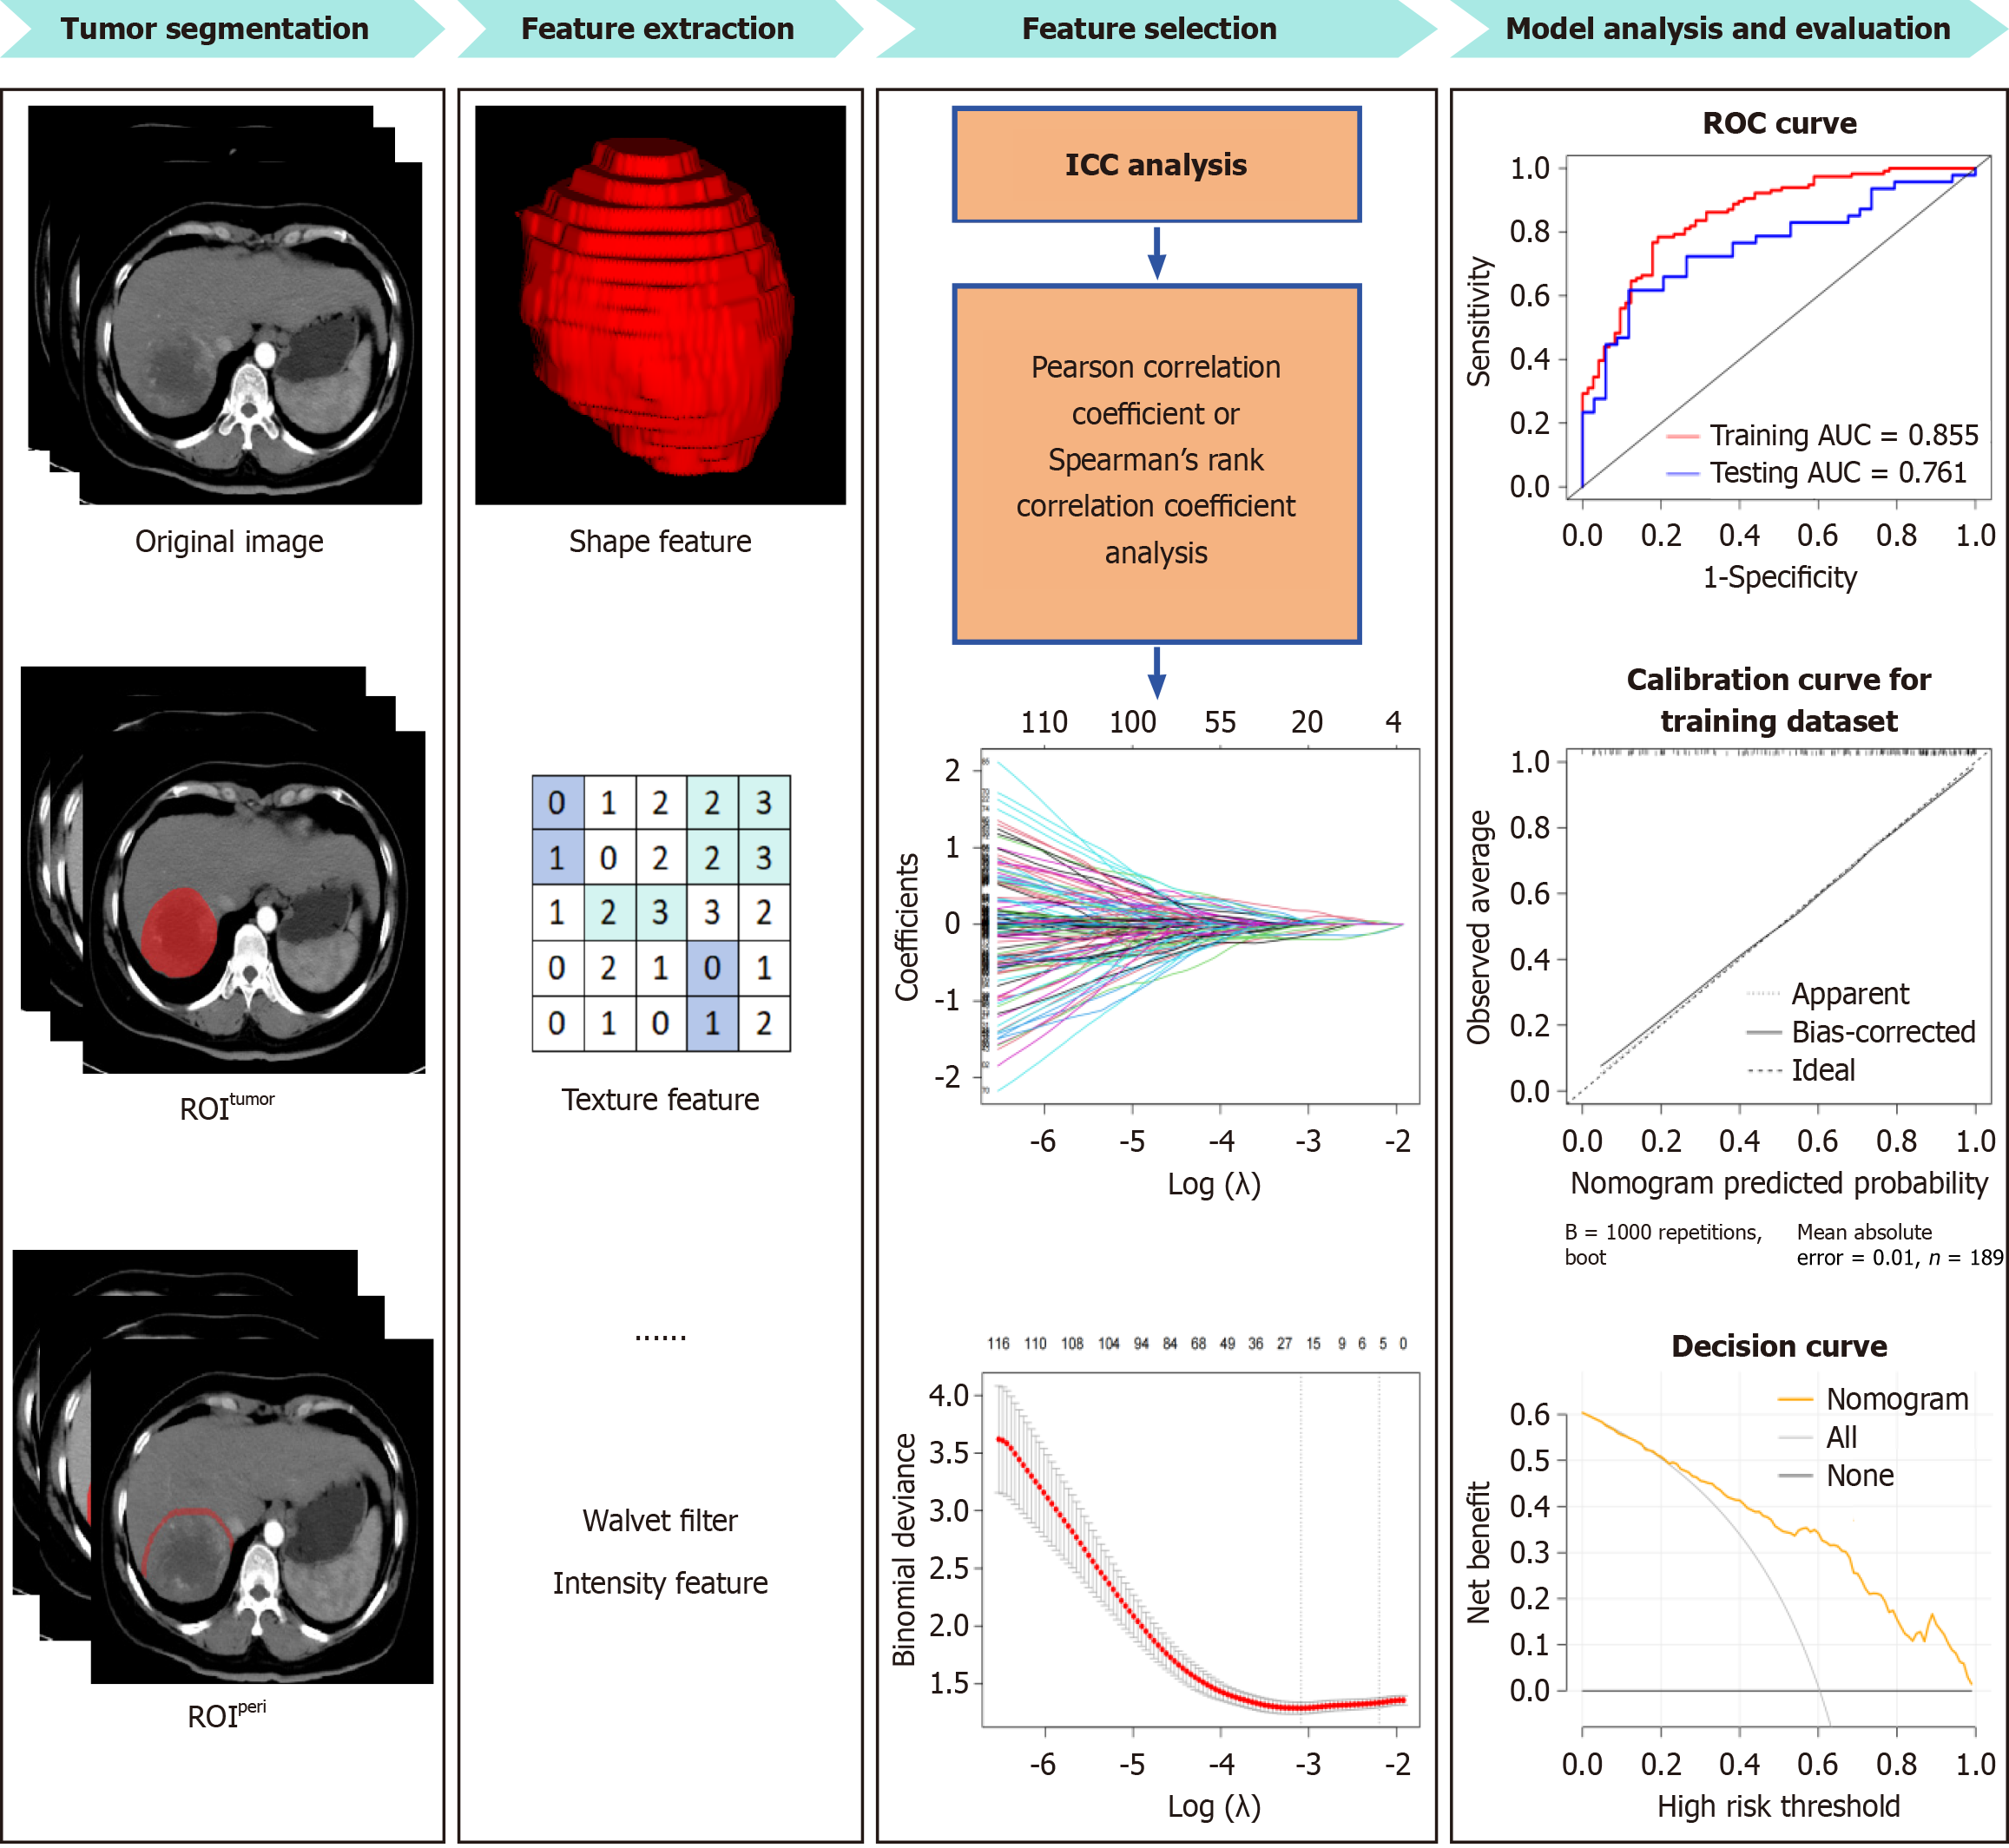
Figure 2 Workflow of radiomics analysis.
ROItumor: Region of interest of tumor; ROIperi: Region of interest of 5 mm-wide peritumoral area; ICC: Intra-class correlation coefficient; ROC: Receiver operating characteristic; AUC: Area under the curve.
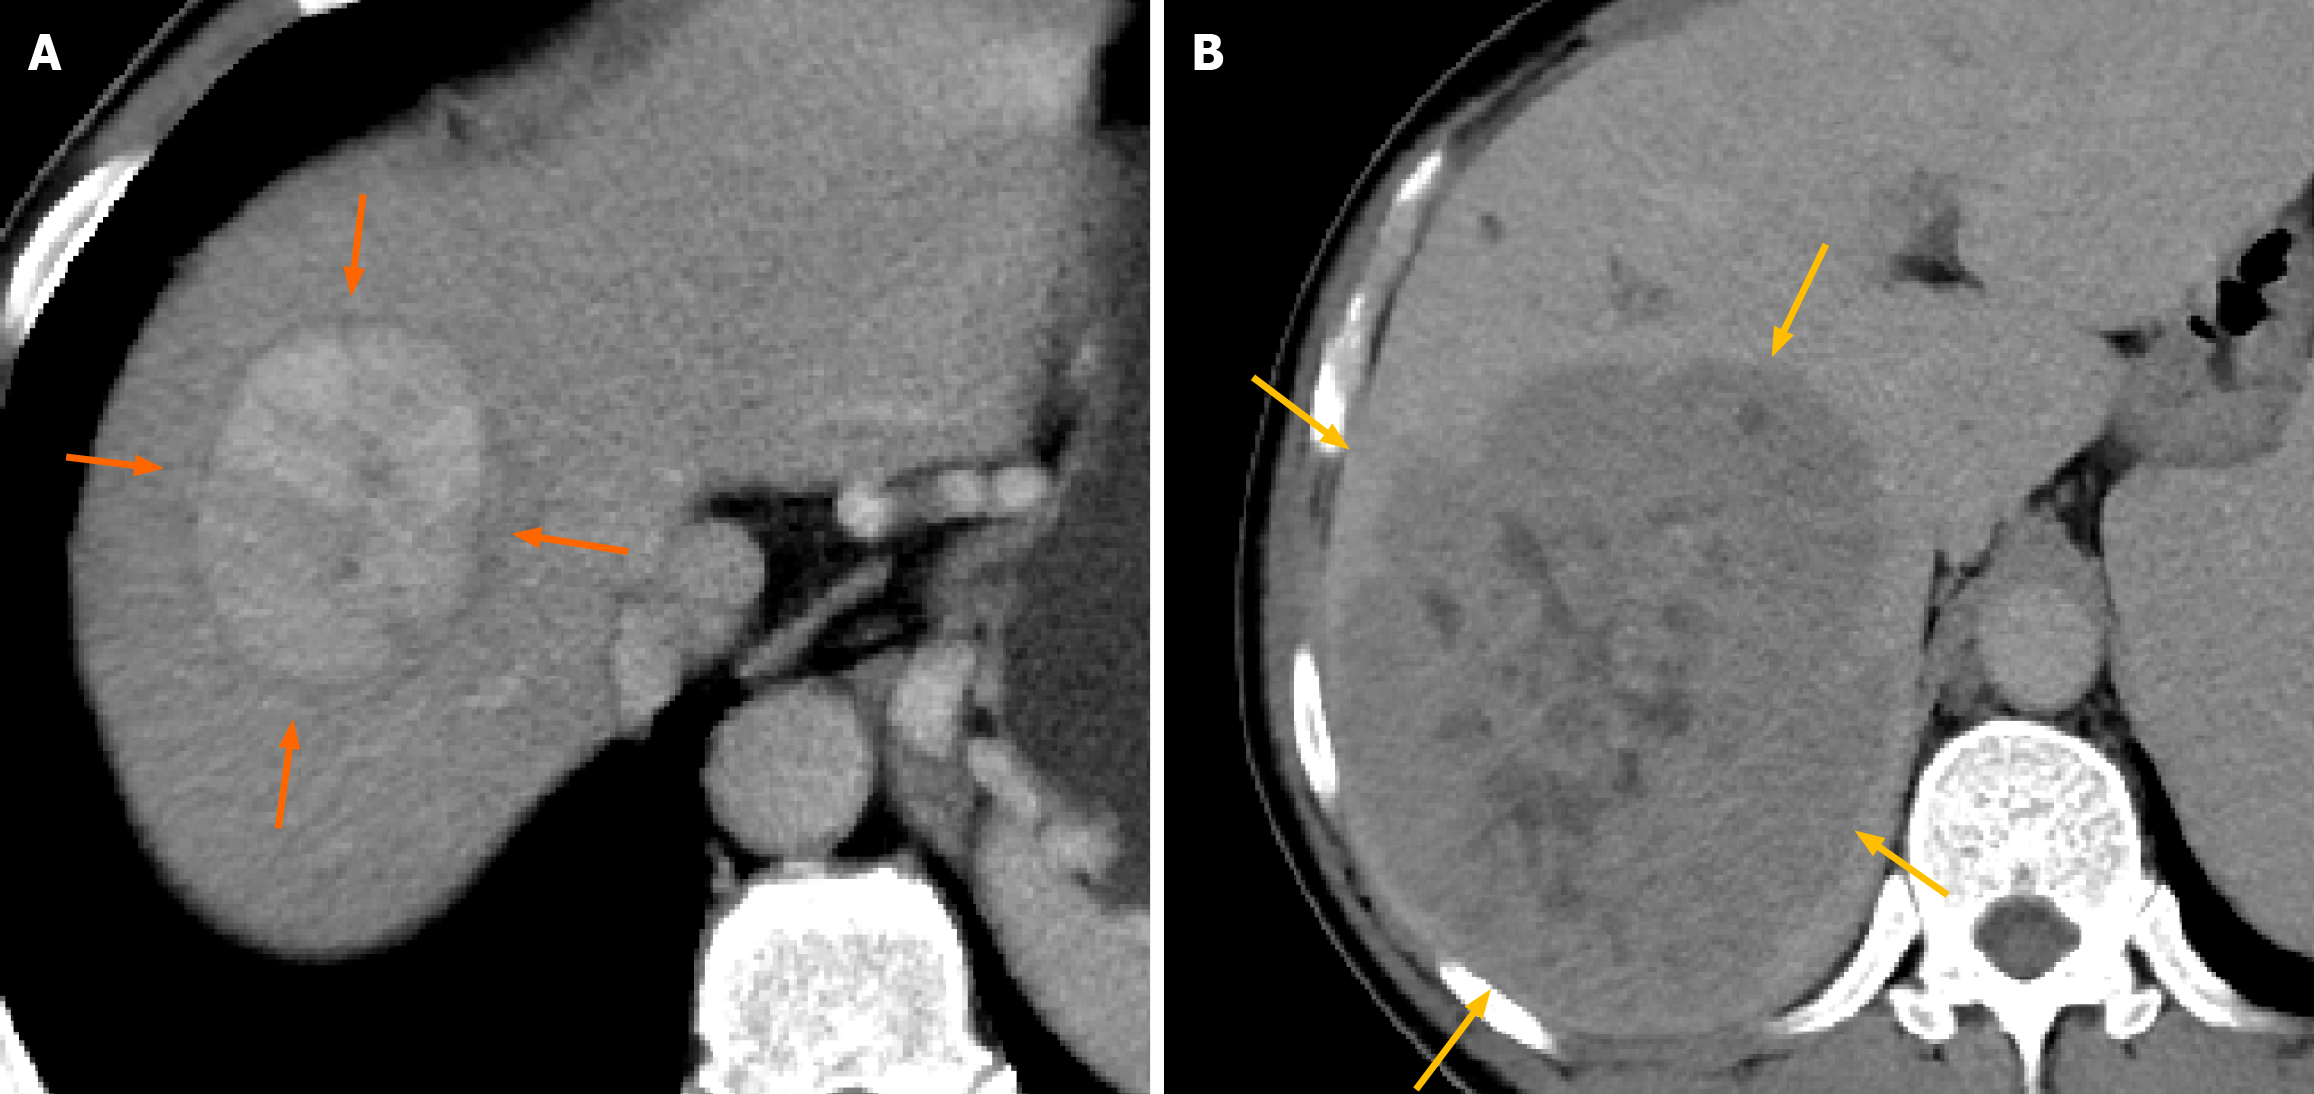
Figure 3 Two cases to show representative clinicoradiological factors of microvascular invasion-negative and microvascular invasion-positive hepatocellular carcinoma.
A: A 63-year-old man presented with a 4.0 cm solid mass in the right lobe of the liver, featuring a peritumoral hypointensity ring (orange arrow) and smooth tumor margin; B: A 46-year-old man presented with a 15 cm solid mass in the right lobe of the liver, featuring a non-smooth tumor margin and the absence of a peritumoral hypointensity ring (yellow arrow).
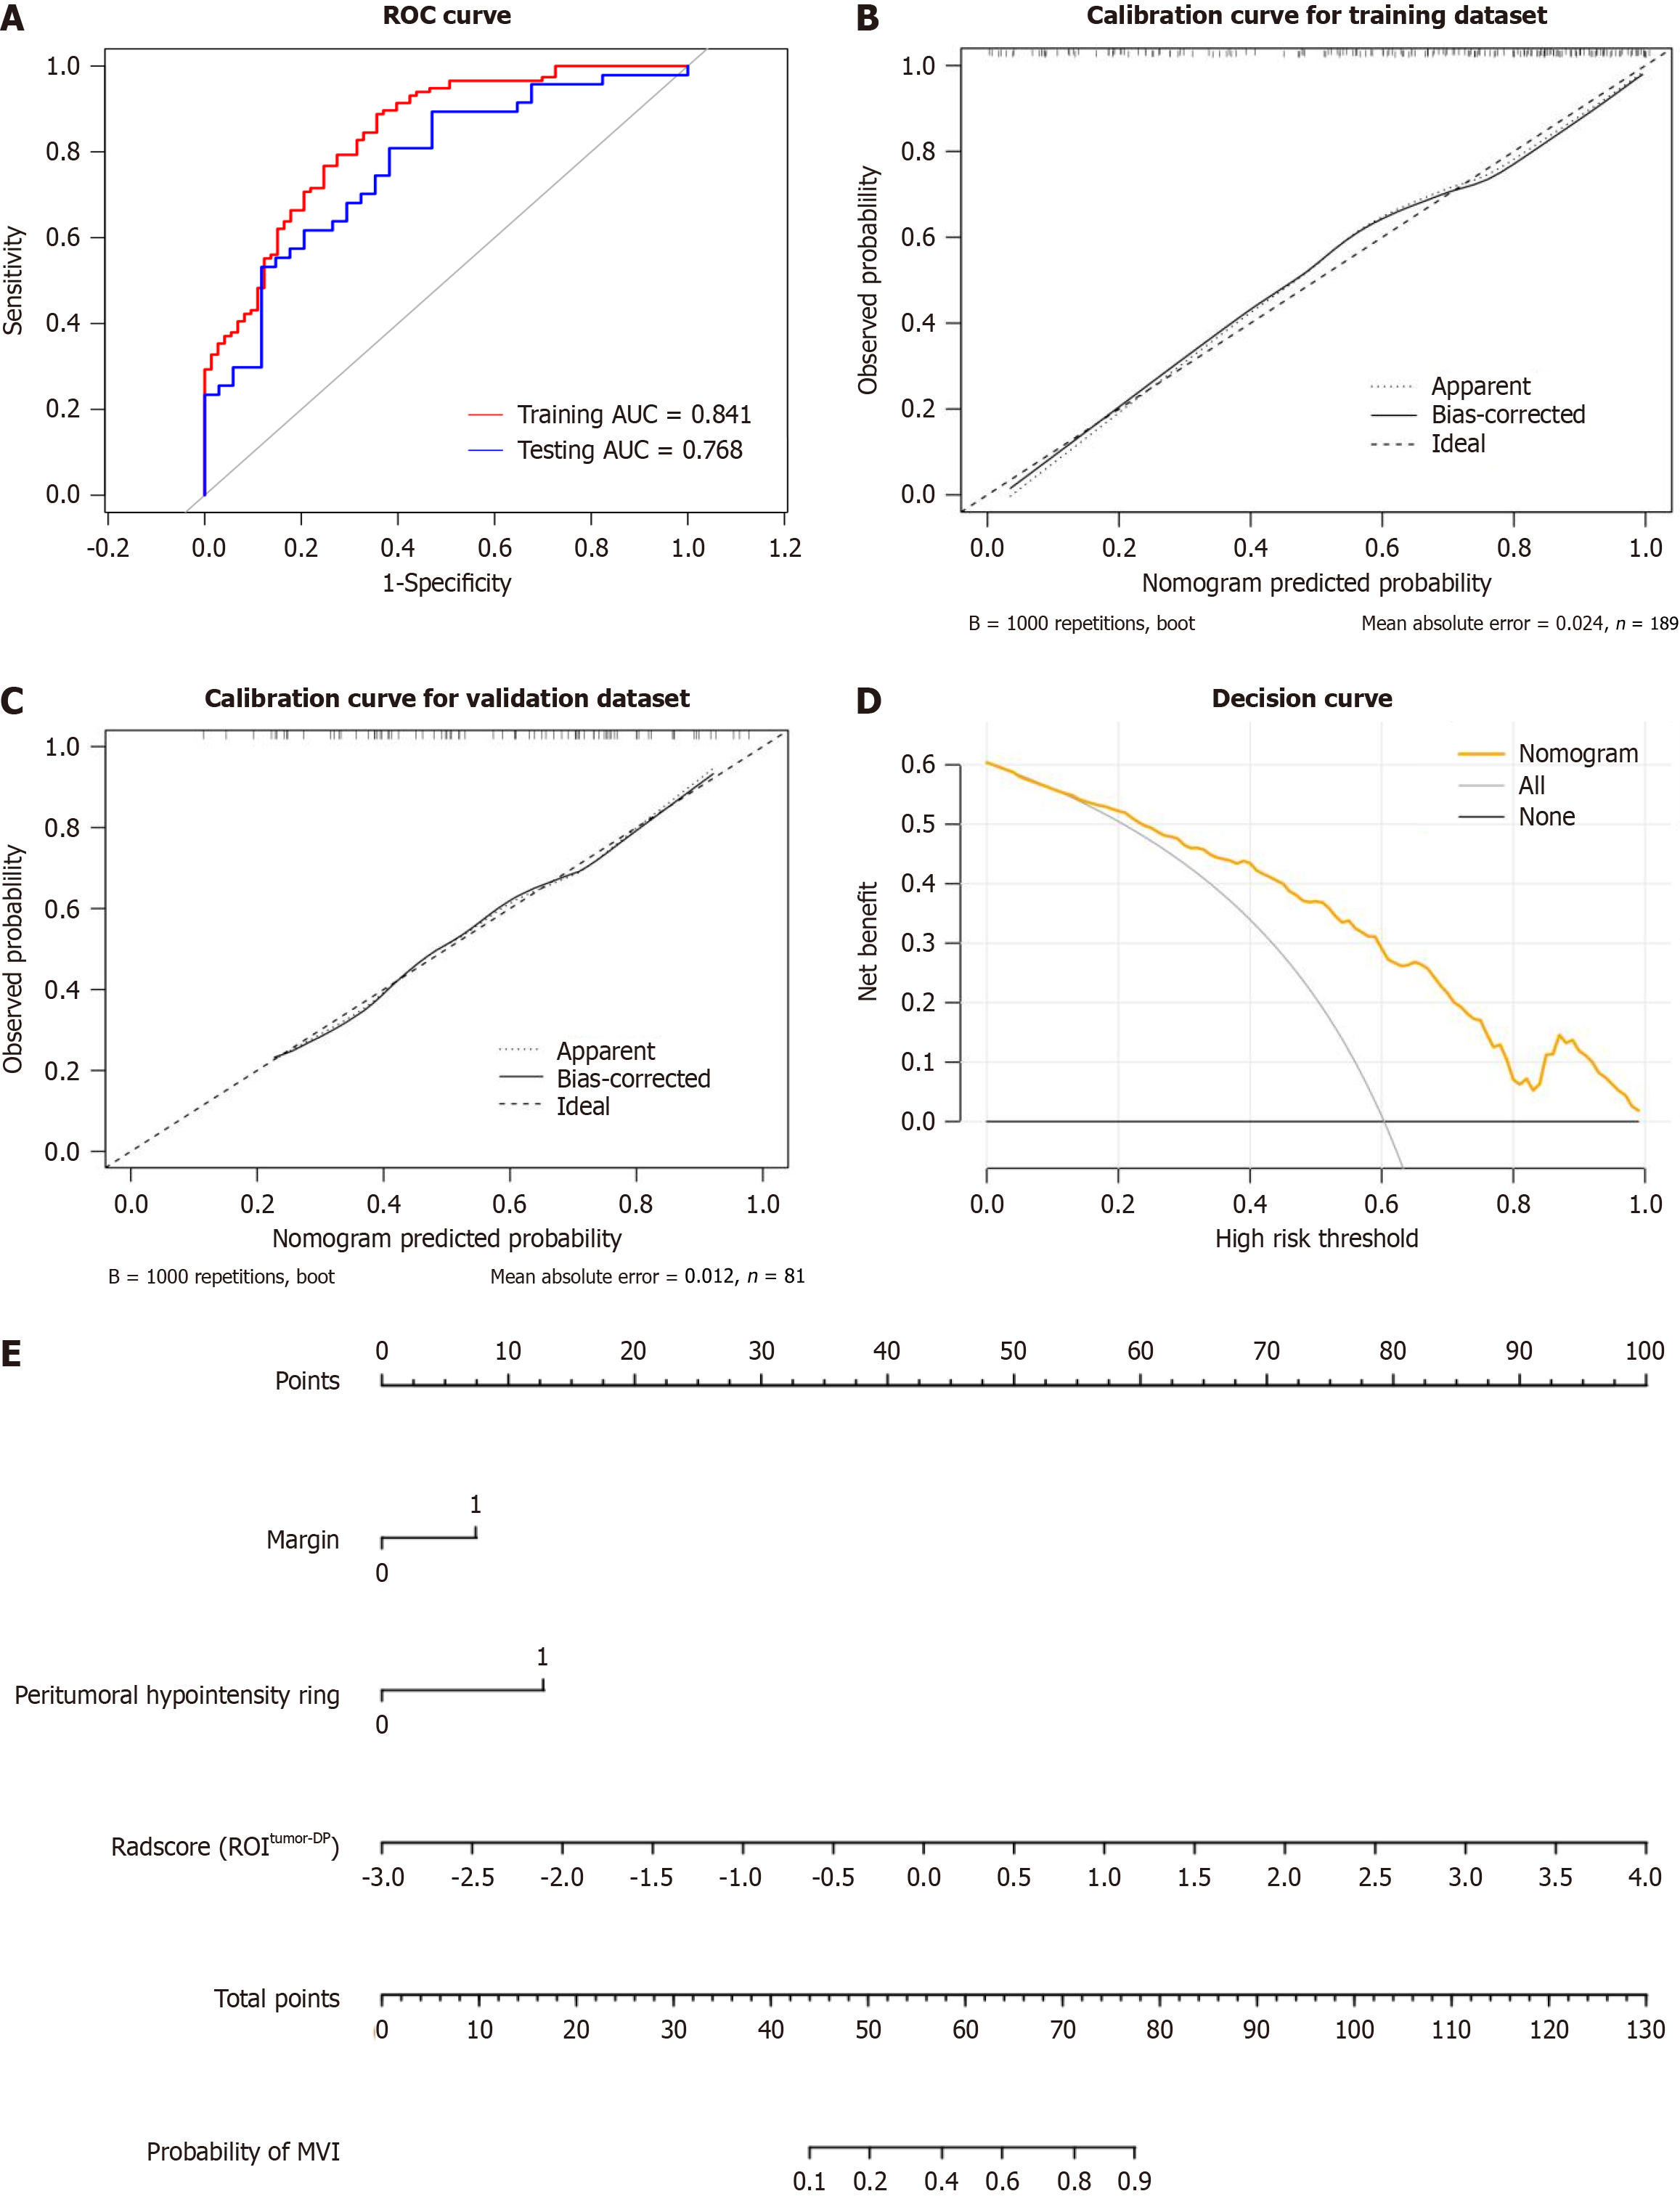
Figure 4 Calibration, discrimination, and clinical utility analysis of the radiologic-radiomics model for predicting microvascular invasion.
A: Receiver operating characteristic analysis curve of the model; B-D: Calibration curves in the training (B) and validation (C) datasets, and decision curve (D) in the overall patients; E: The model is presented with a nomogram scaled by the proportional regression coefficient of each predictor. AFP: Alpha-fetoprotein; MVI: Microvascular invasion; radscore (ROItumor-DP): Represents the radscore based on regions of interest of tumor from delayed phase contrast-enhanced computed tomography images; ROC: Receiver operating characteristic; AUC: Area under the curve.
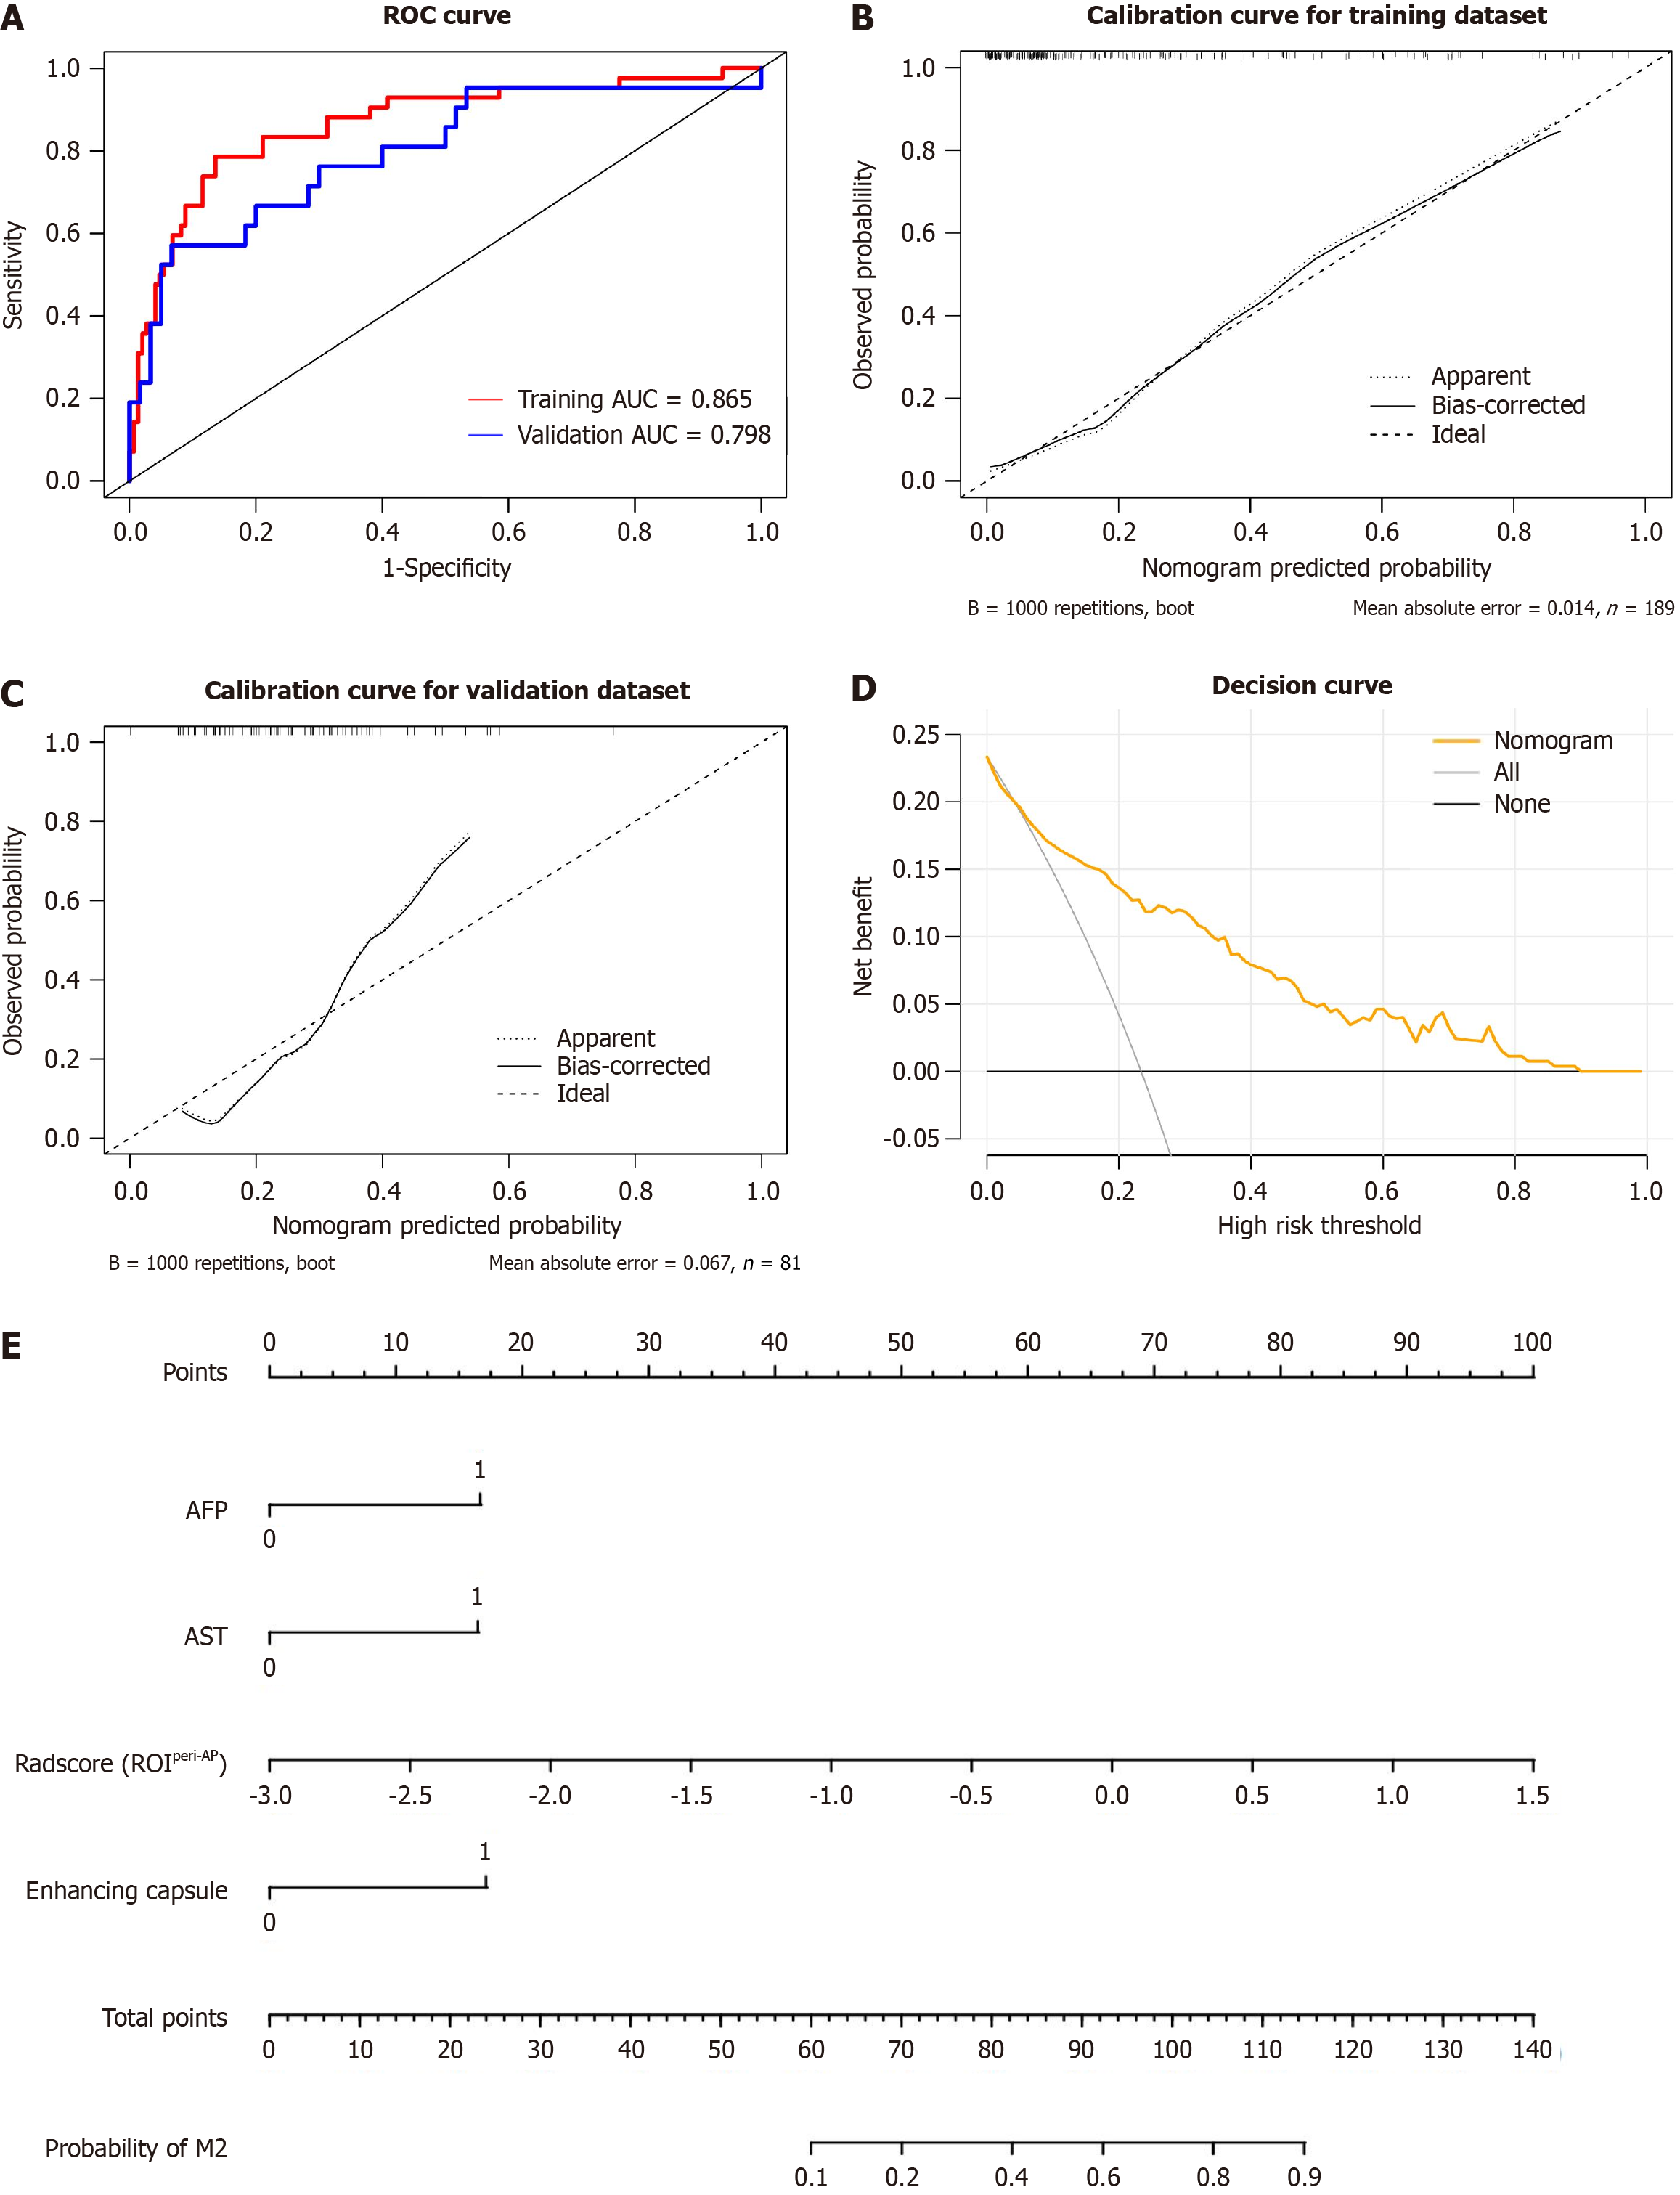
Figure 5 Calibration, discrimination, and clinical utility analysis of the model for predicting high-risk group.
A: Receiver operating characteristic analysis curve of the model; B-D: Calibration curves in the training (B) and validation (C) datasets, and decision curve (D) in the overall patients; E: The model is presented with a nomogram scaled by the proportional regression coefficient of each predictor. AFP: Alpha-fetoprotein; AST: Aspartate aminotransferase; MVI: Microvascular invasion; radscore (ROIperi-AP): Represents the radscore based on regions of interest of 5 mm-wide peritumoral area from arterial phase contrast-enhanced computed tomography images; M2: High-risk group; ROC: Receiver operating characteristic; AUC: Area under the curve.
- Citation: Xu ZL, Qian GX, Li YH, Lu JL, Wei MT, Bu XY, Ge YS, Cheng Y, Jia WD. Evaluating microvascular invasion in hepatitis B virus-related hepatocellular carcinoma based on contrast-enhanced computed tomography radiomics and clinicoradiological factors. World J Gastroenterol 2024; 30(45): 4801-4816
- URL: https://www.wjgnet.com/1007-9327/full/v30/i45/4801.htm
- DOI: https://dx.doi.org/10.3748/wjg.v30.i45.4801


