Copyright
©The Author(s) 2024.
World J Gastroenterol. Nov 21, 2024; 30(43): 4620-4635
Published online Nov 21, 2024. doi: 10.3748/wjg.v30.i43.4620
Published online Nov 21, 2024. doi: 10.3748/wjg.v30.i43.4620
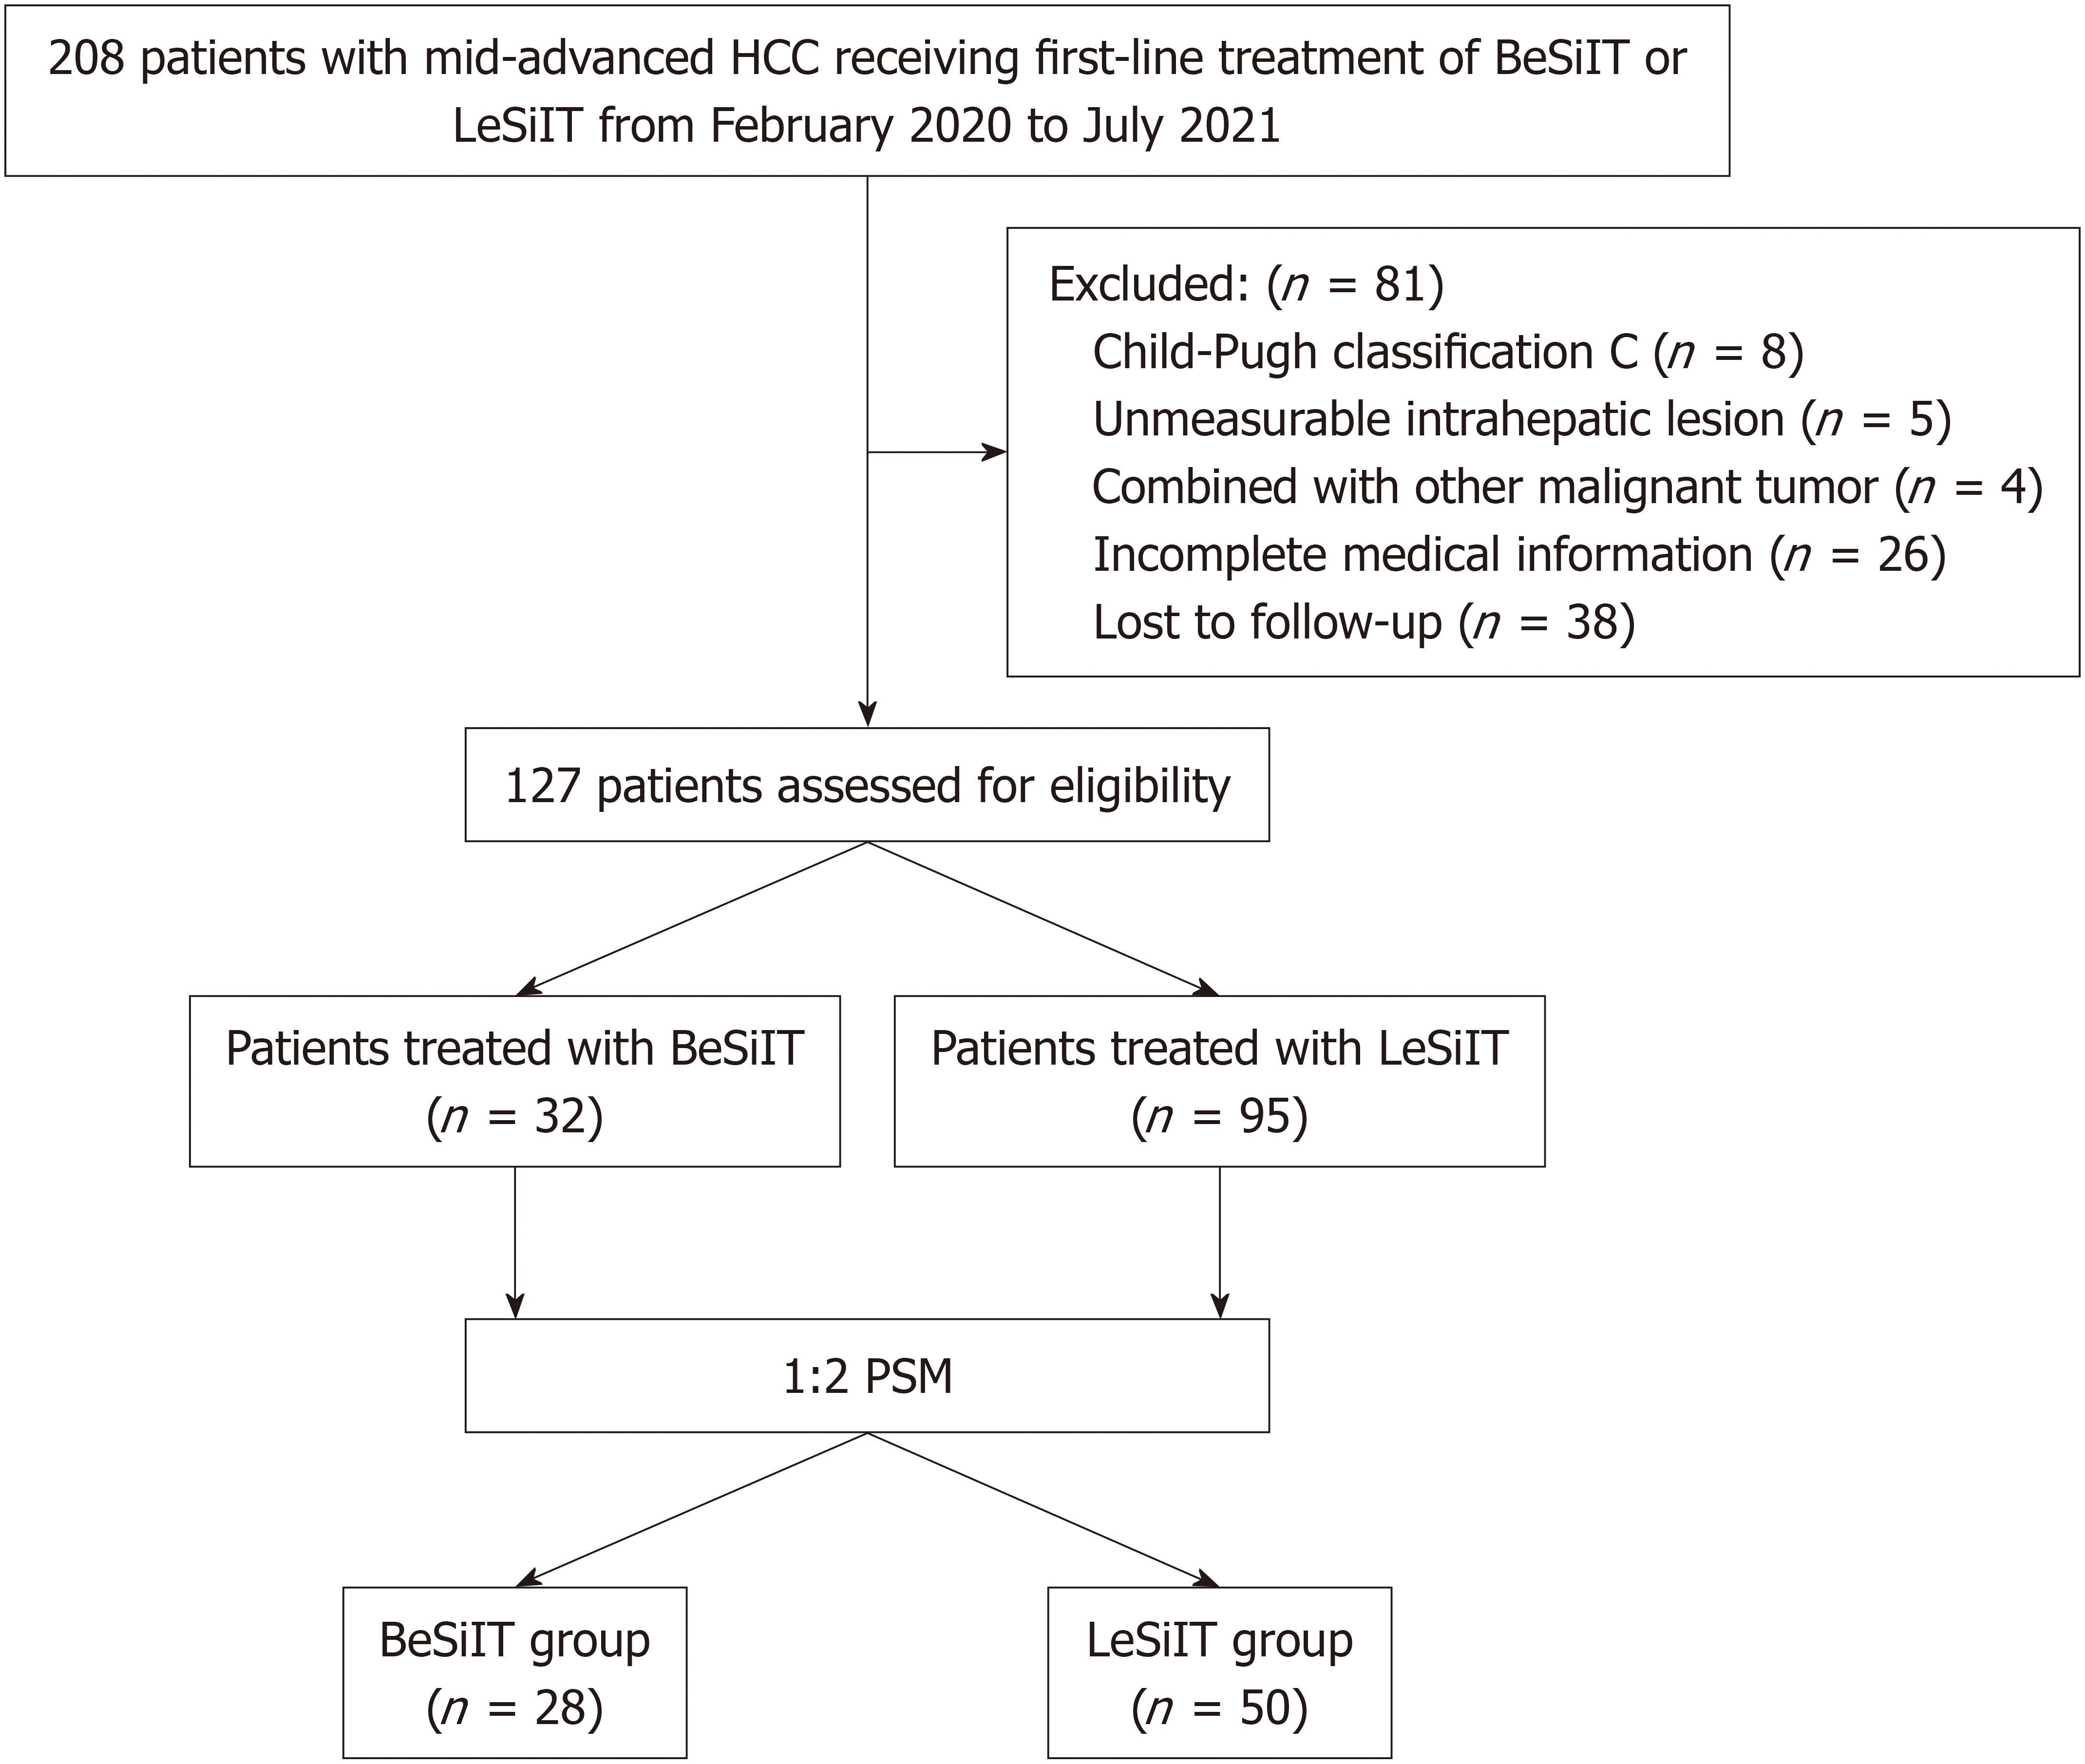
Figure 1 Flowchart for patient selection.
HCC: Hepatocellular carcinoma; BeSiIT: Bevacizumab plus sintilimab plus interventional treatment; LeSiIT: Lenvatinib plus sintilimab plus interventional treatment; PSM: Propensity score matching.
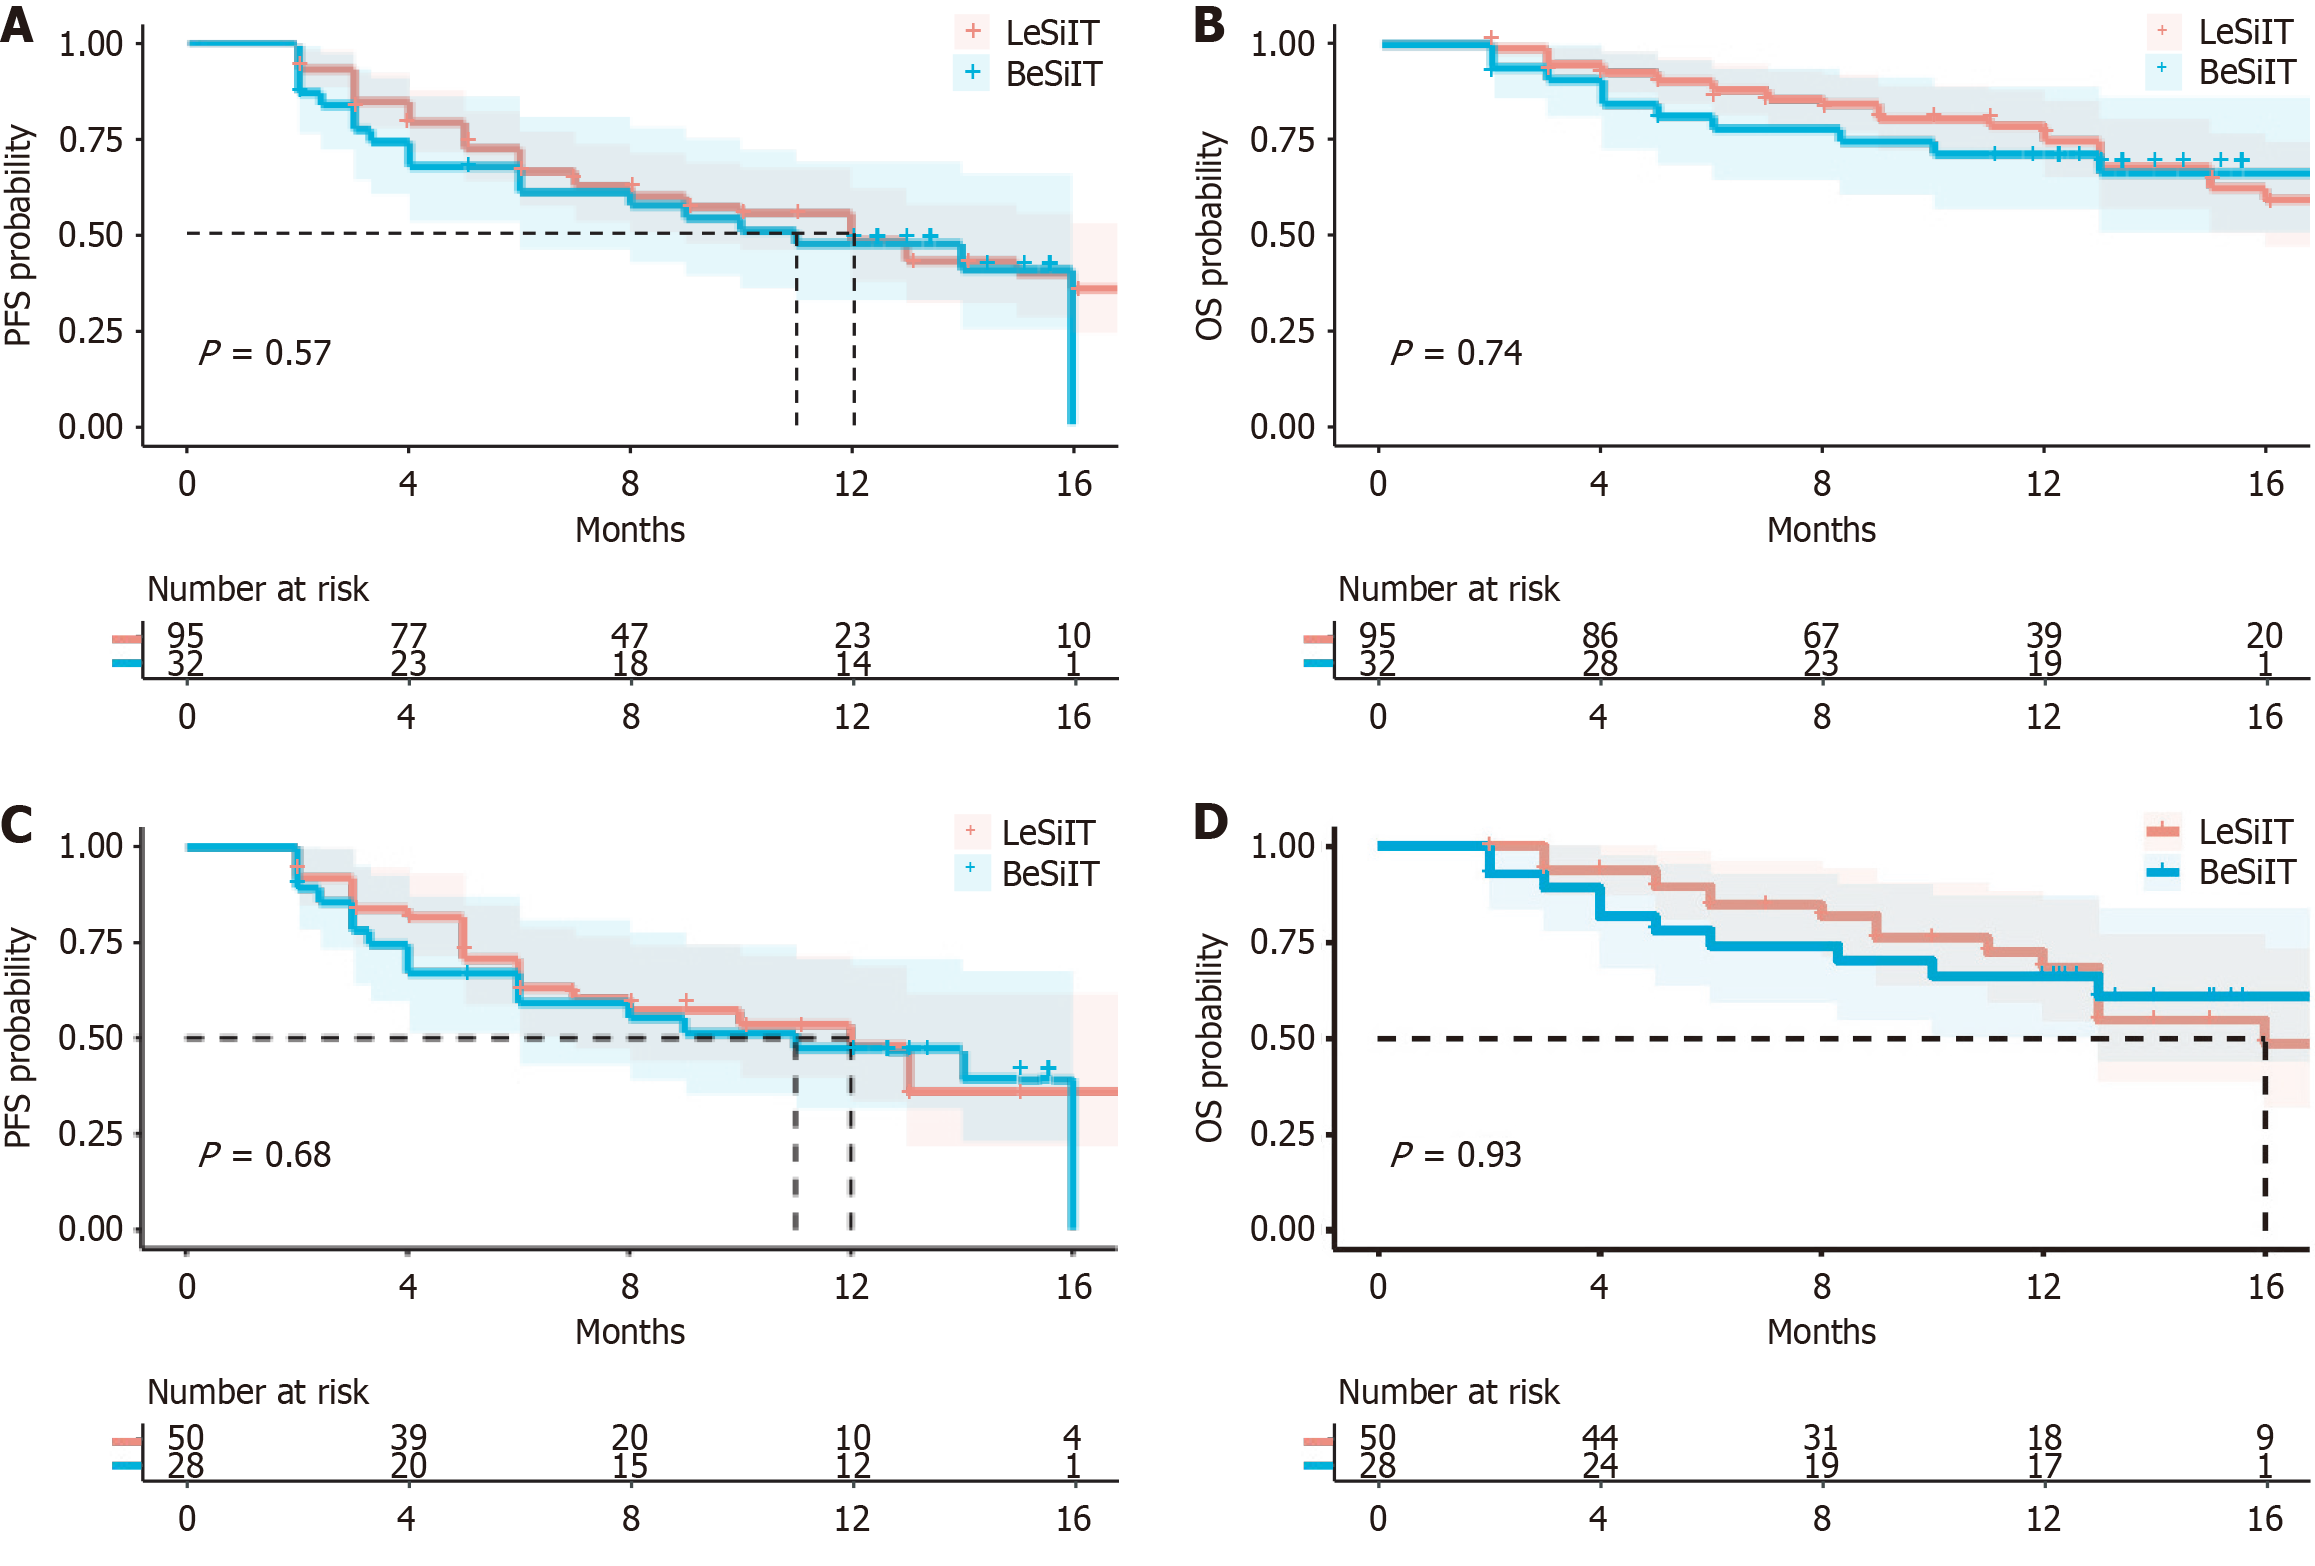
Figure 2 Kaplan-Meier curves between the lenvatinib plus sintilimab plus interventional treatment and bevacizumab plus sintilimab plus interventional treatment groups.
A: Kaplan-Meier curves based on propensity score matching (PFS) before propensity score matching (PSM); B: Kaplan-Meier curves based on overall survival (OS) before PSM; C: Kaplan-Meier curves based on PFS after PSM; D: Kaplan-Meier curves based on OS after PSM. PFS: Progression-free survival; OS: Overall survival; PSM: Propensity score matching; BeSiIT: Bevacizumab plus sintilimab plus interventional treatment; LeSiIT: Lenvatinib plus sintilimab plus interventional treatment.
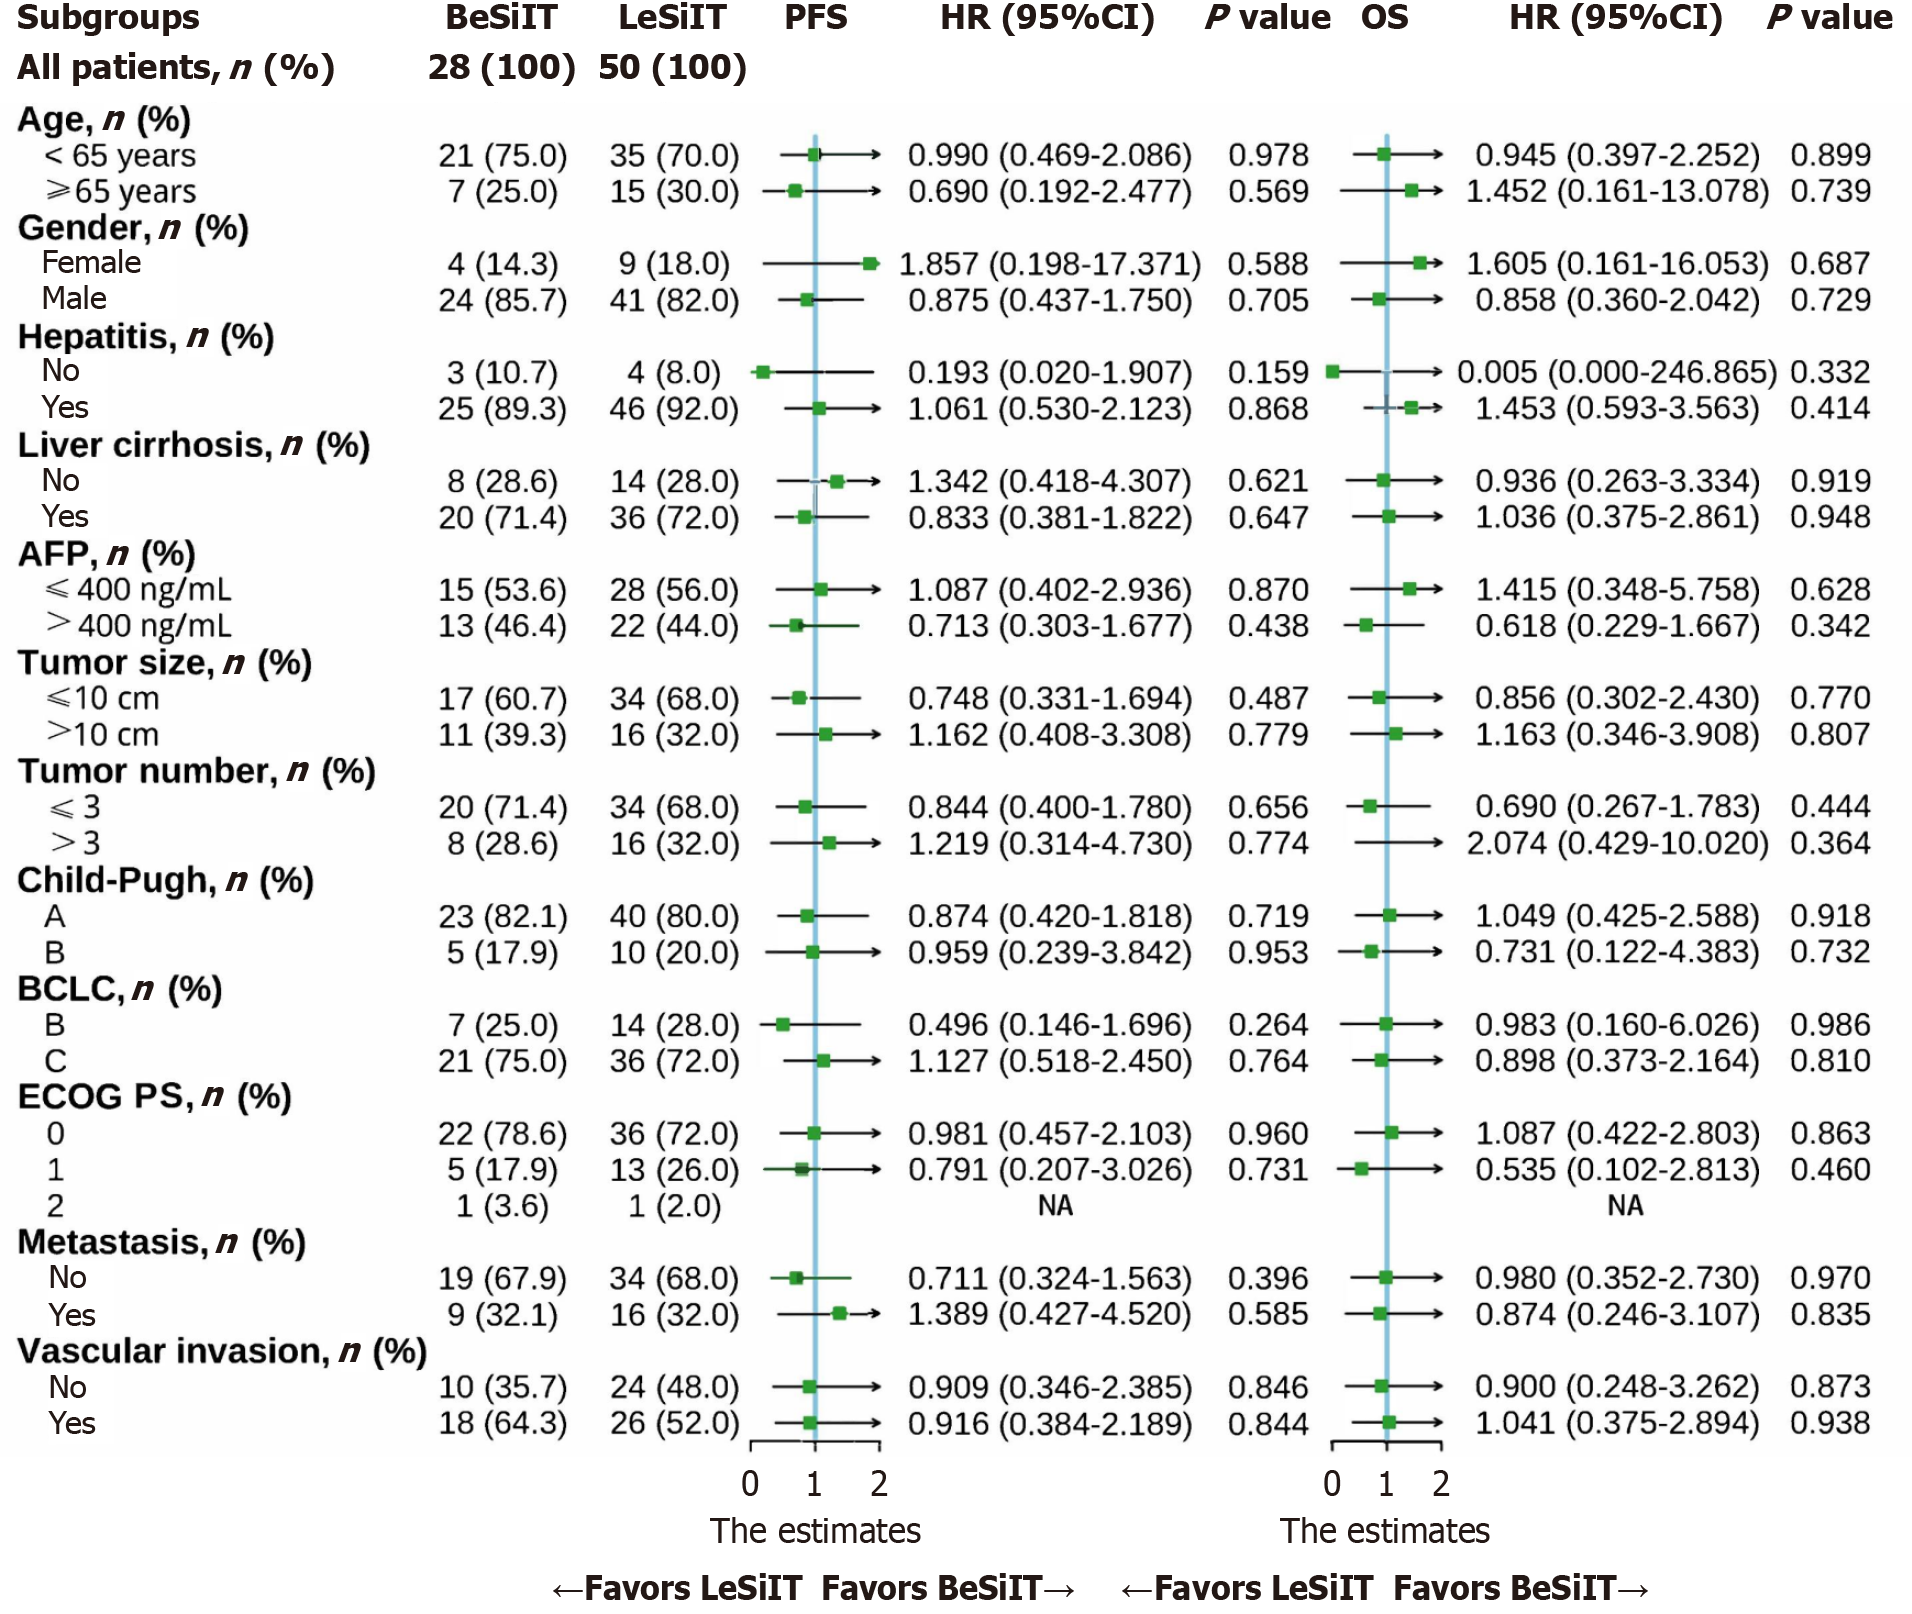
Figure 3 Forest plot for progression-free survival and overall survival of the matched cohorts of patients.
BeSiIT: Bevacizumab plus sintilimab plus interventional treatment; LeSiIT: Lenvatinib plus sintilimab plus interventional treatment; PFS: Progression-free survival; OS: Overall survival; HR: Hazard ratios; AFP: Α-fetoprotein; BCLC: The Barcelona Clinic Liver Cancer; ECOG PS: Eastern Cooperative Oncology Group Performance Status.
Figure 4 Best percentage changes in the sizes of the intrahepatic target lesions of patients from baseline assessed with modified response evaluation criteria in solid tumors.
A: Bevacizumab plus sintilimab plus interventional treatment; B: Lenvatinib plus sintilimab plus interventional treatment. The horizontal coordinate represents each patient and the vertical coordinate represents the percentage change in intrahepatic target lesion size from baseline. BeSiIT: Bevacizumab plus sintilimab plus interventional treatment; LeSiIT: Lenvatinib plus sintilimab plus interventional treatment; CR: Complete response; PR: Partial response; SD: Stable disease; PD: Progressive disease.
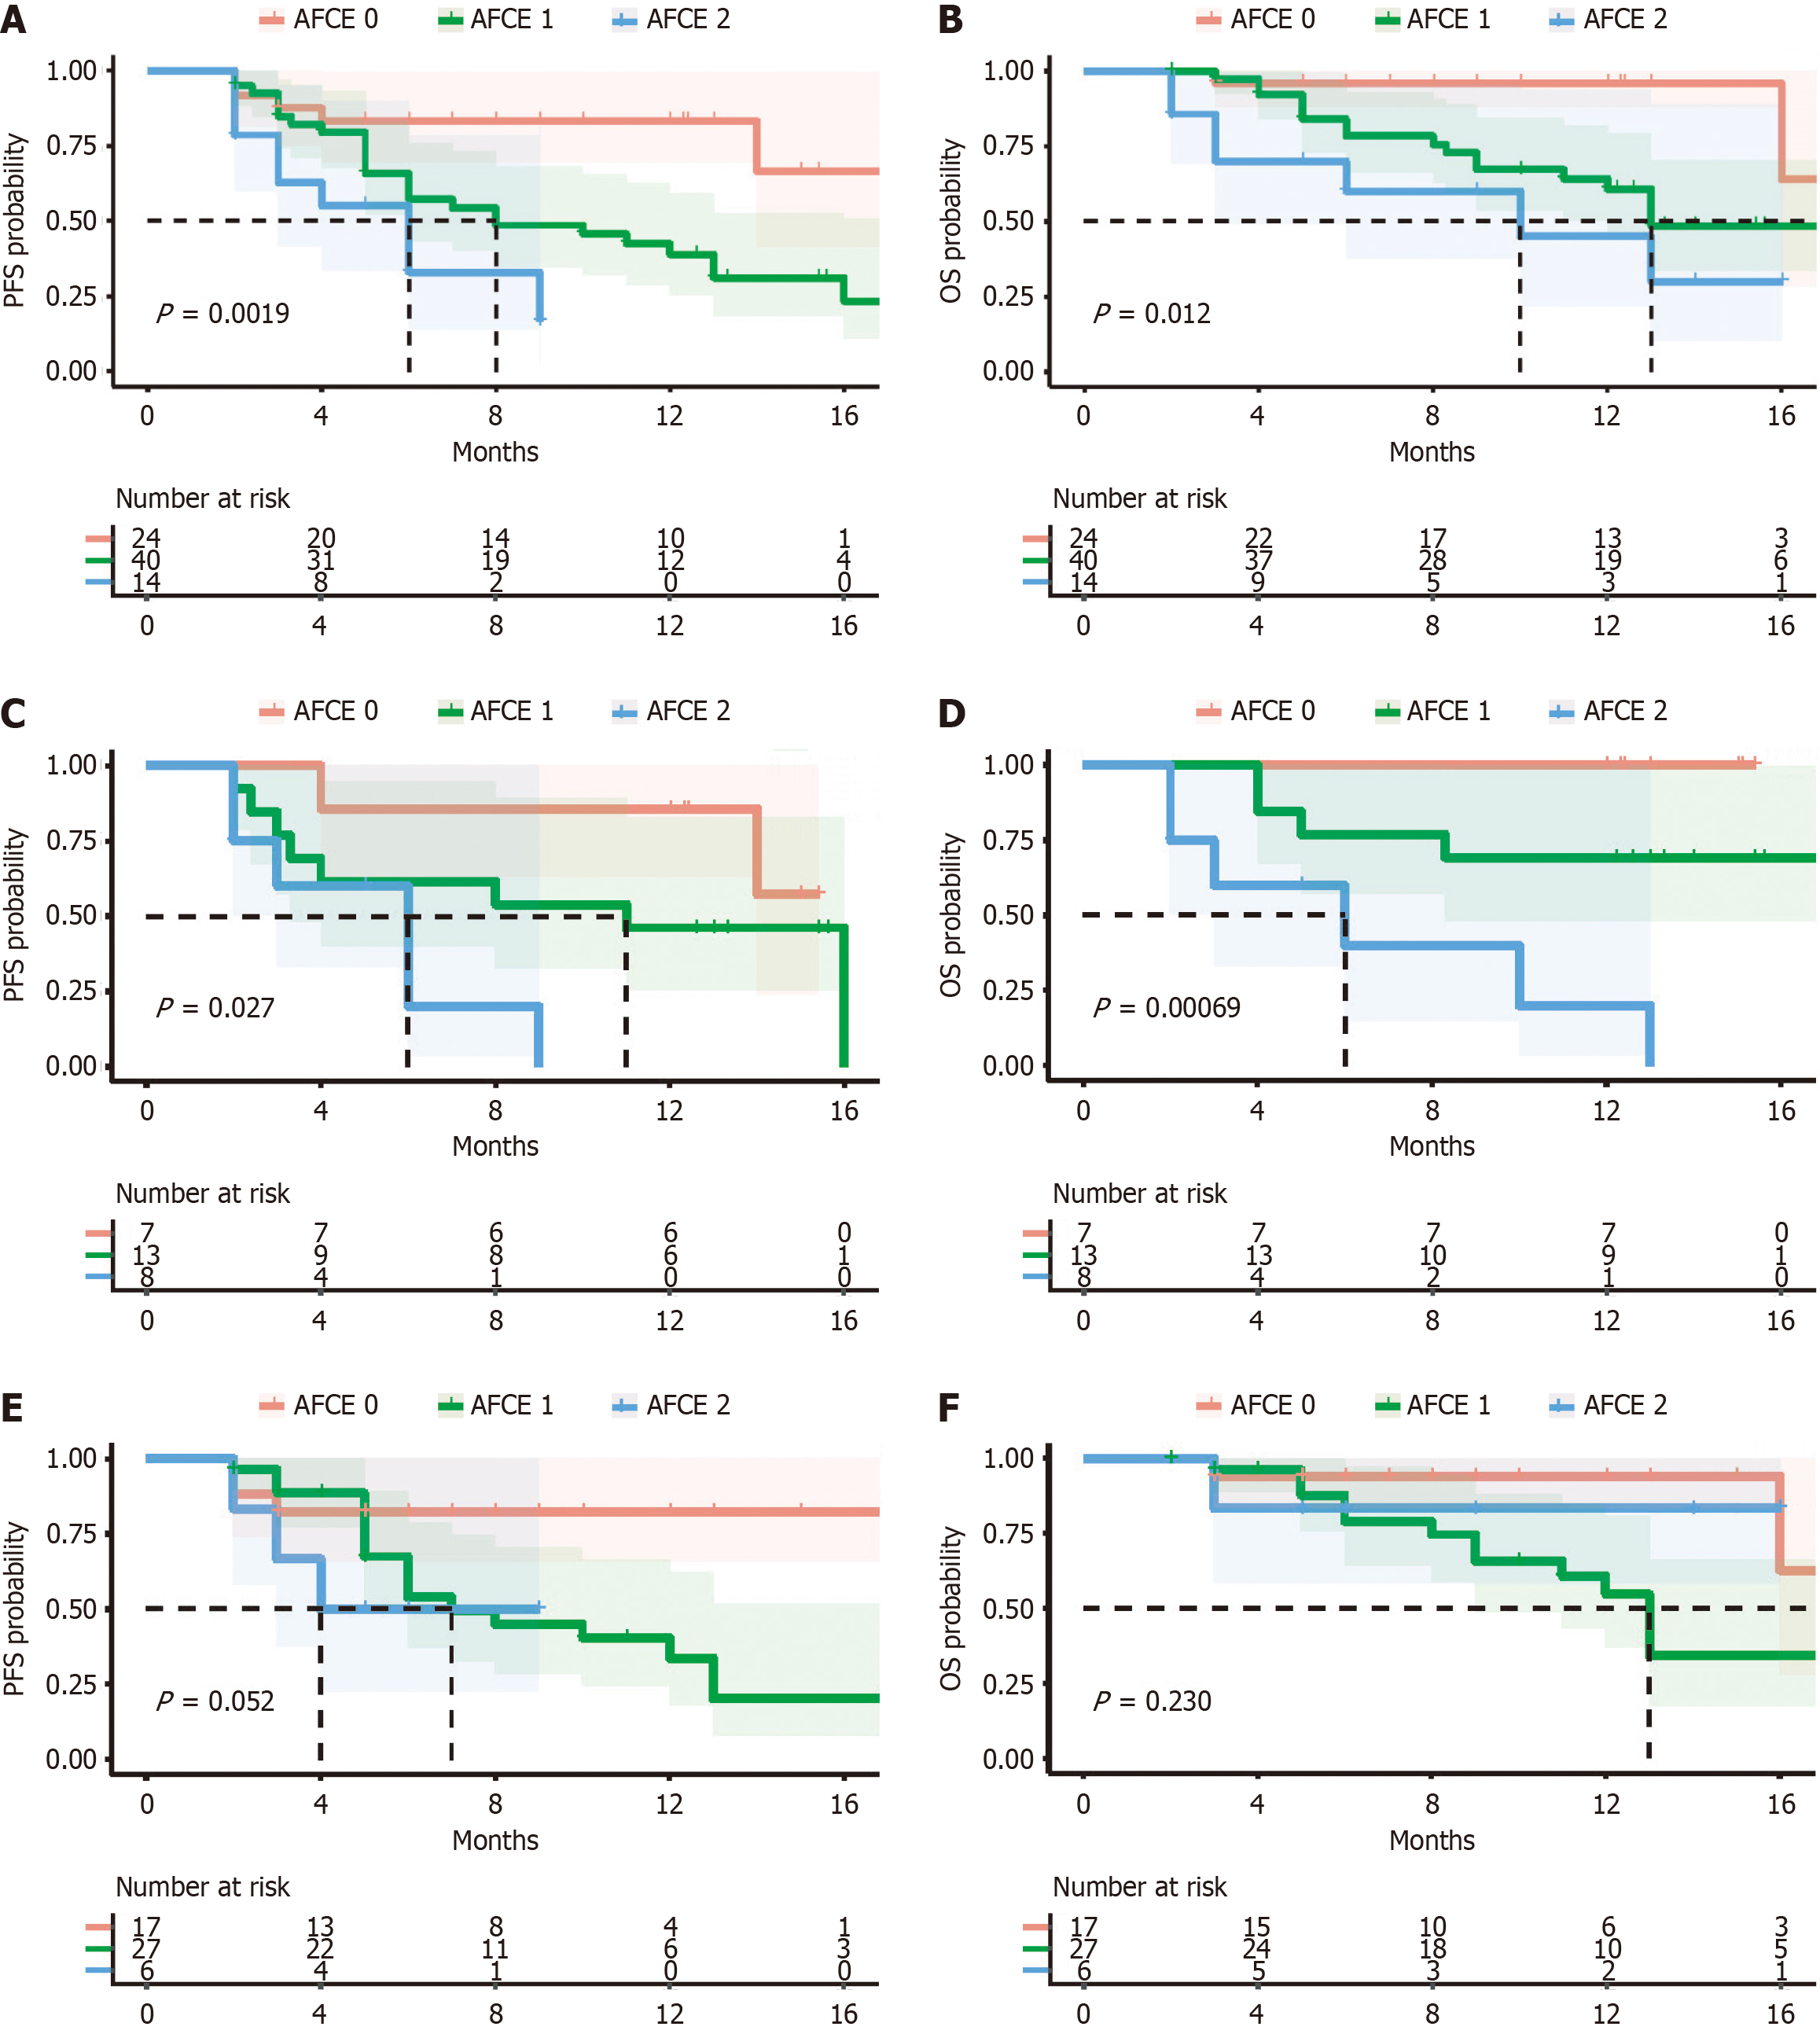
Figure 5 Kaplan-Meier curves based on α-fetoprotein and carcinoembryonic antigen score.
A: Kaplan-Meier curves based on progression-free survival (PFS); B: Kaplan-Meier curves based on overall survival (OS); C: Kaplan-Meier curves based on PFS in the bevacizumab plus sintilimab plus interventional treatment (BeSiIT) groups; D: Kaplan-Meier curves based on OS in the BeSiIT groups; E: Kaplan-Meier curves based on PFS in the lenvatinib plus sintilimab plus interventional treatment (LeSiIT) groups; F: Kaplan-Meier curves based on OS in the LeSiIT groups. AFCE: Α-fetoprotein and carcinoembryonic antigen score; PFS: Progression-free survival; OS: Overall survival.
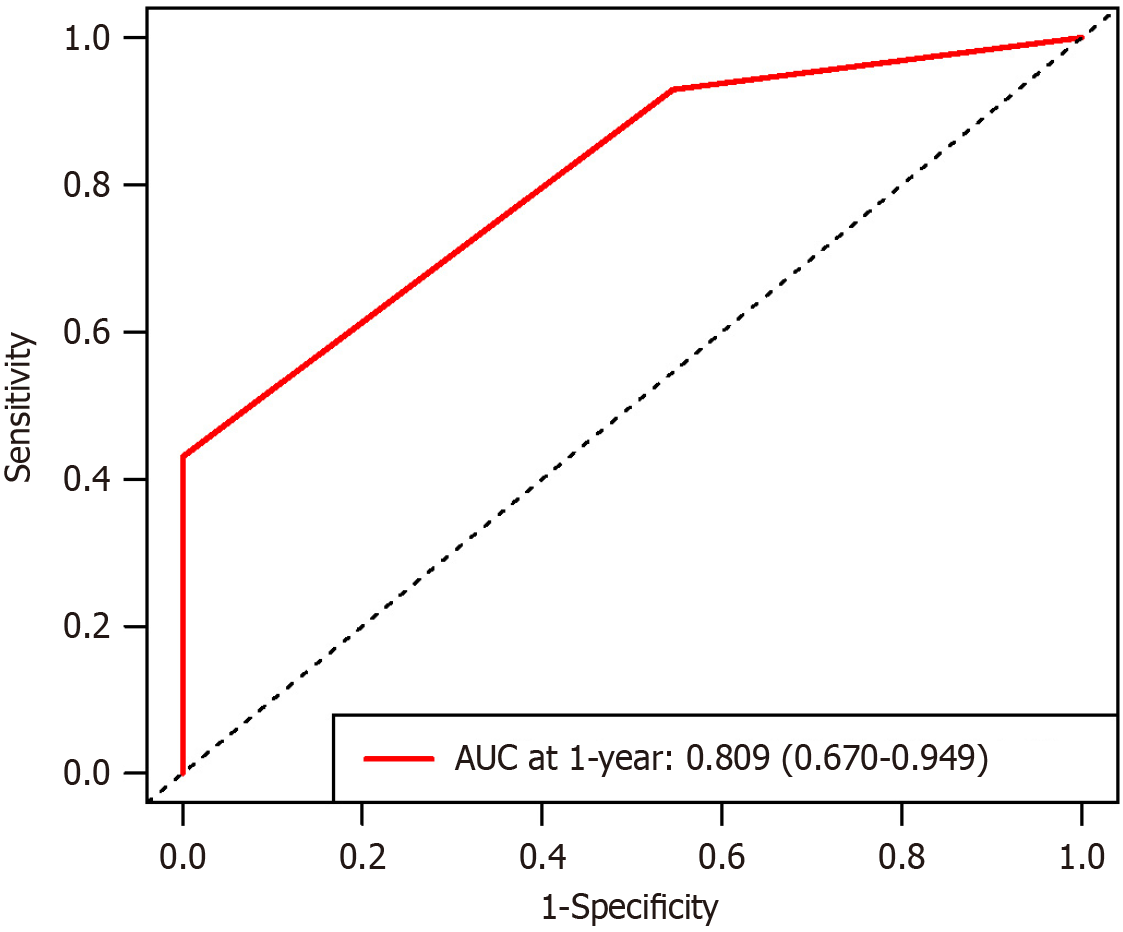
Figure 6 Receiver operating characteristic curves for α-fetoprotein and carcinoembryonic antigen score in the bevacizumab plus sintilimab plus interventional treatment subgroup.
AUC: Area under the curve.
- Citation: Han RY, Gan LJ, Lang MR, Ren SH, Liu DM, Li GT, Liu YY, Tian XD, Zhu KW, Sun LY, Chen L, Song TQ. Lenvatinib, sintilimab combined interventional treatment vs bevacizumab, sintilimab combined interventional treatment for intermediate-advanced unresectable hepatocellular carcinoma. World J Gastroenterol 2024; 30(43): 4620-4635
- URL: https://www.wjgnet.com/1007-9327/full/v30/i43/4620.htm
- DOI: https://dx.doi.org/10.3748/wjg.v30.i43.4620


