Copyright
©The Author(s) 2024.
World J Gastroenterol. Nov 21, 2024; 30(43): 4609-4619
Published online Nov 21, 2024. doi: 10.3748/wjg.v30.i43.4609
Published online Nov 21, 2024. doi: 10.3748/wjg.v30.i43.4609
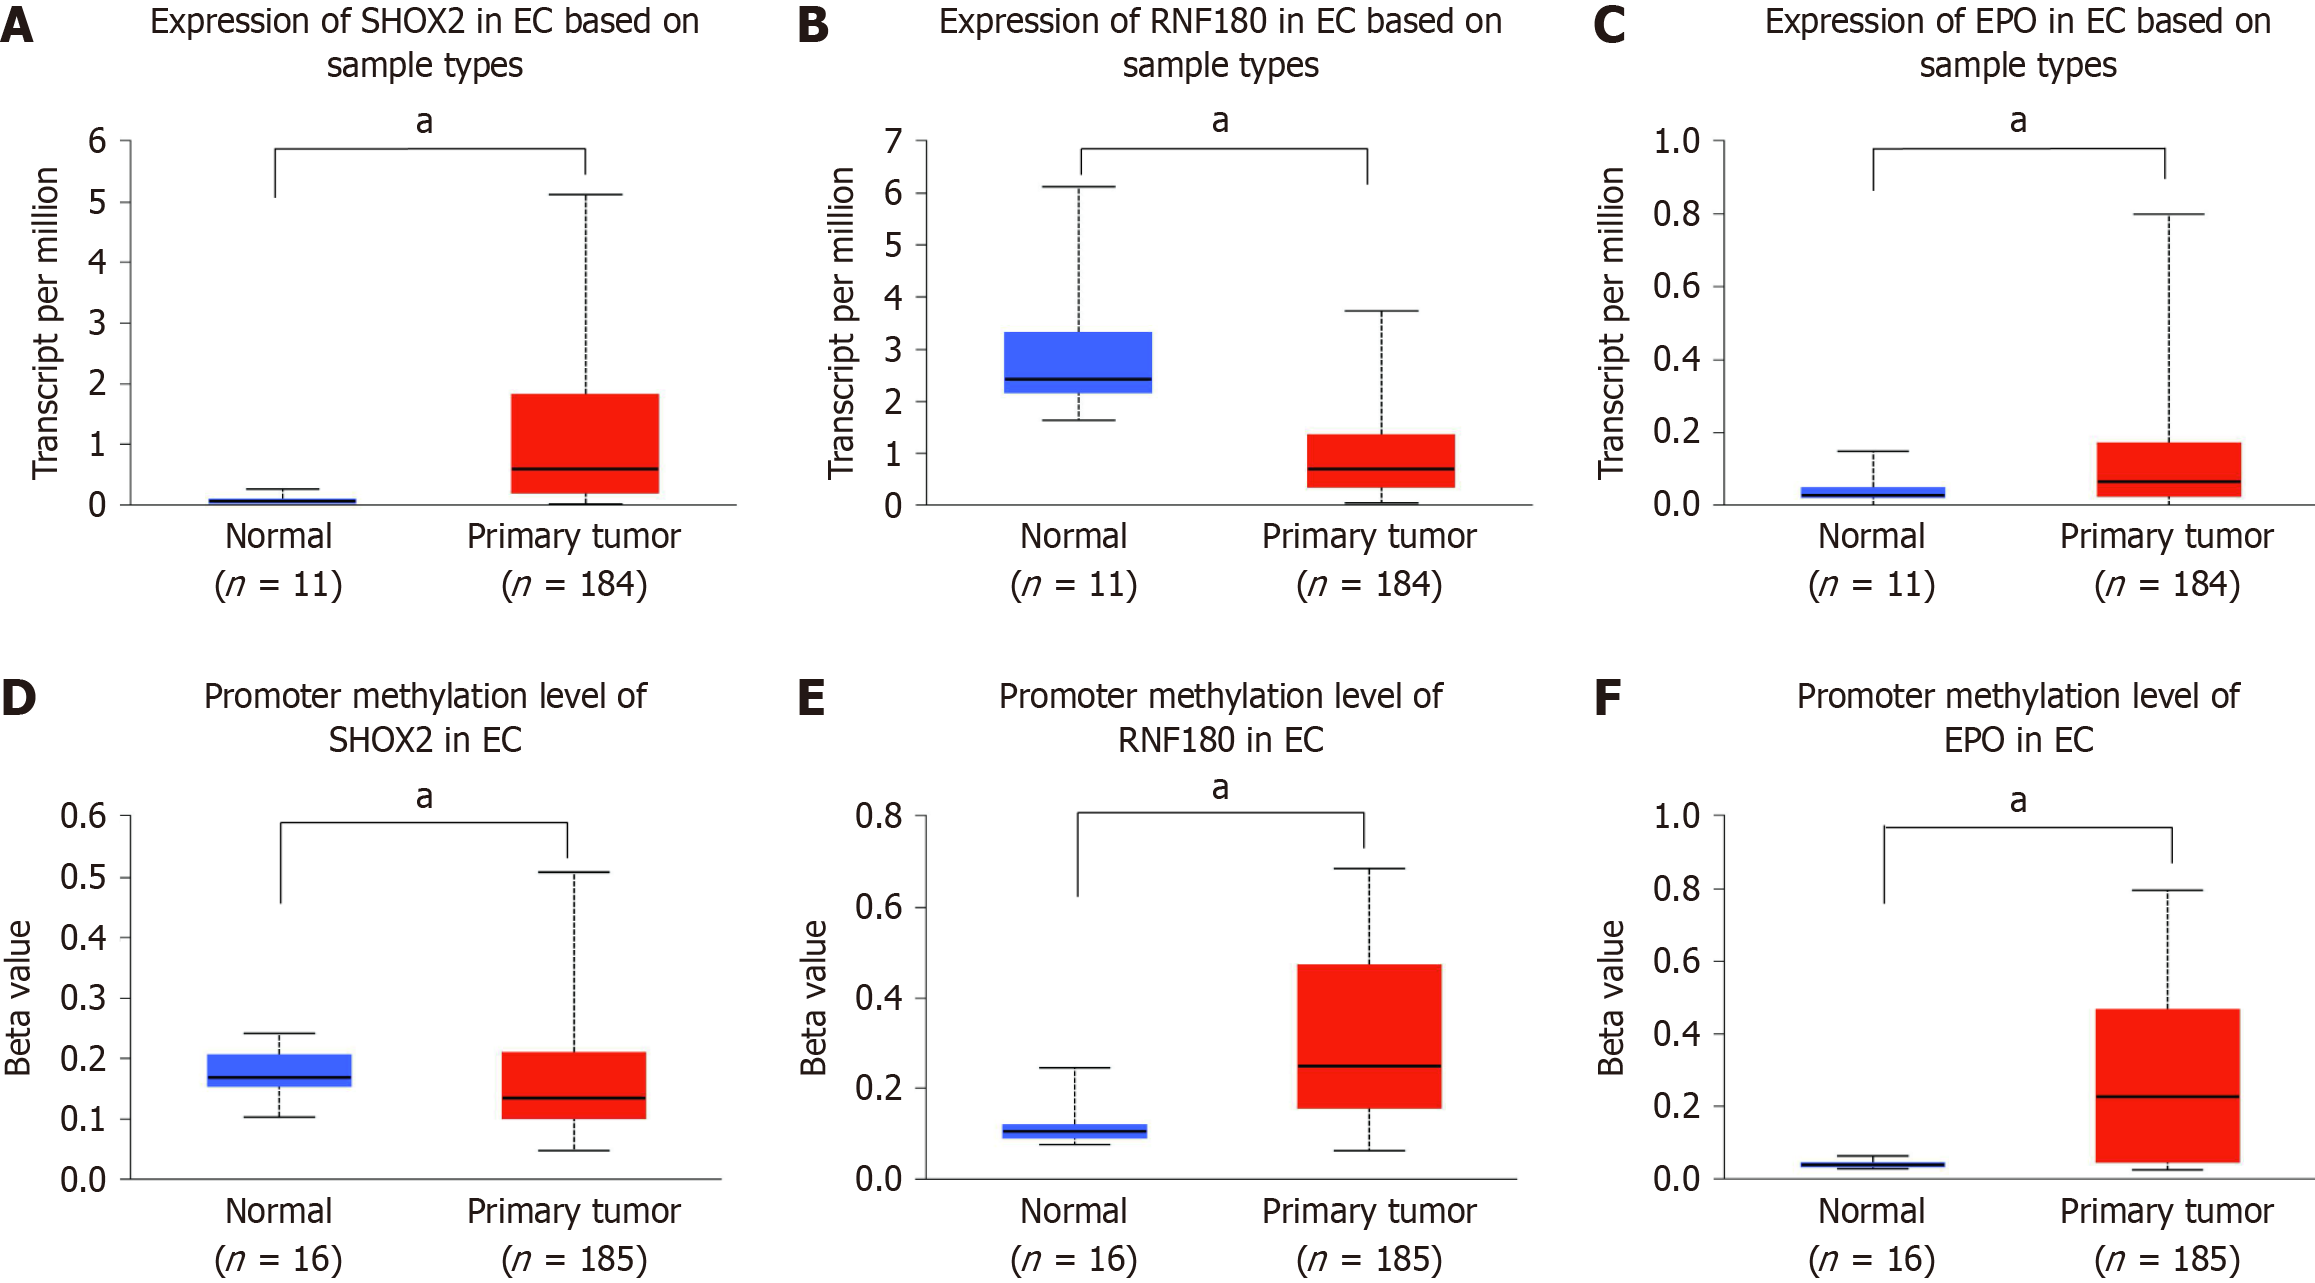
Figure 1 SHOX2, RNF180, and EPO expression and methylation in normal esophageal tissue (n = 11) and esophageal cancer tissue (n = 181) samples from previously reported genome data.
A, C, and E: Expression of SHOX2, RNF180, and EPO was up- or downregulated in esophageal cancer (EC) tissues (n = 181); B, D, and F: Promoter methylation levels of SHOX2, RNF180, and EPO in normal esophageal tissues (n = 11) and EC tissues (n = 181), as indicated by beta values ranging from 0 (unmethylated) to 1 (fully methylated). aP < 0.05. EC: Esophageal cancer.
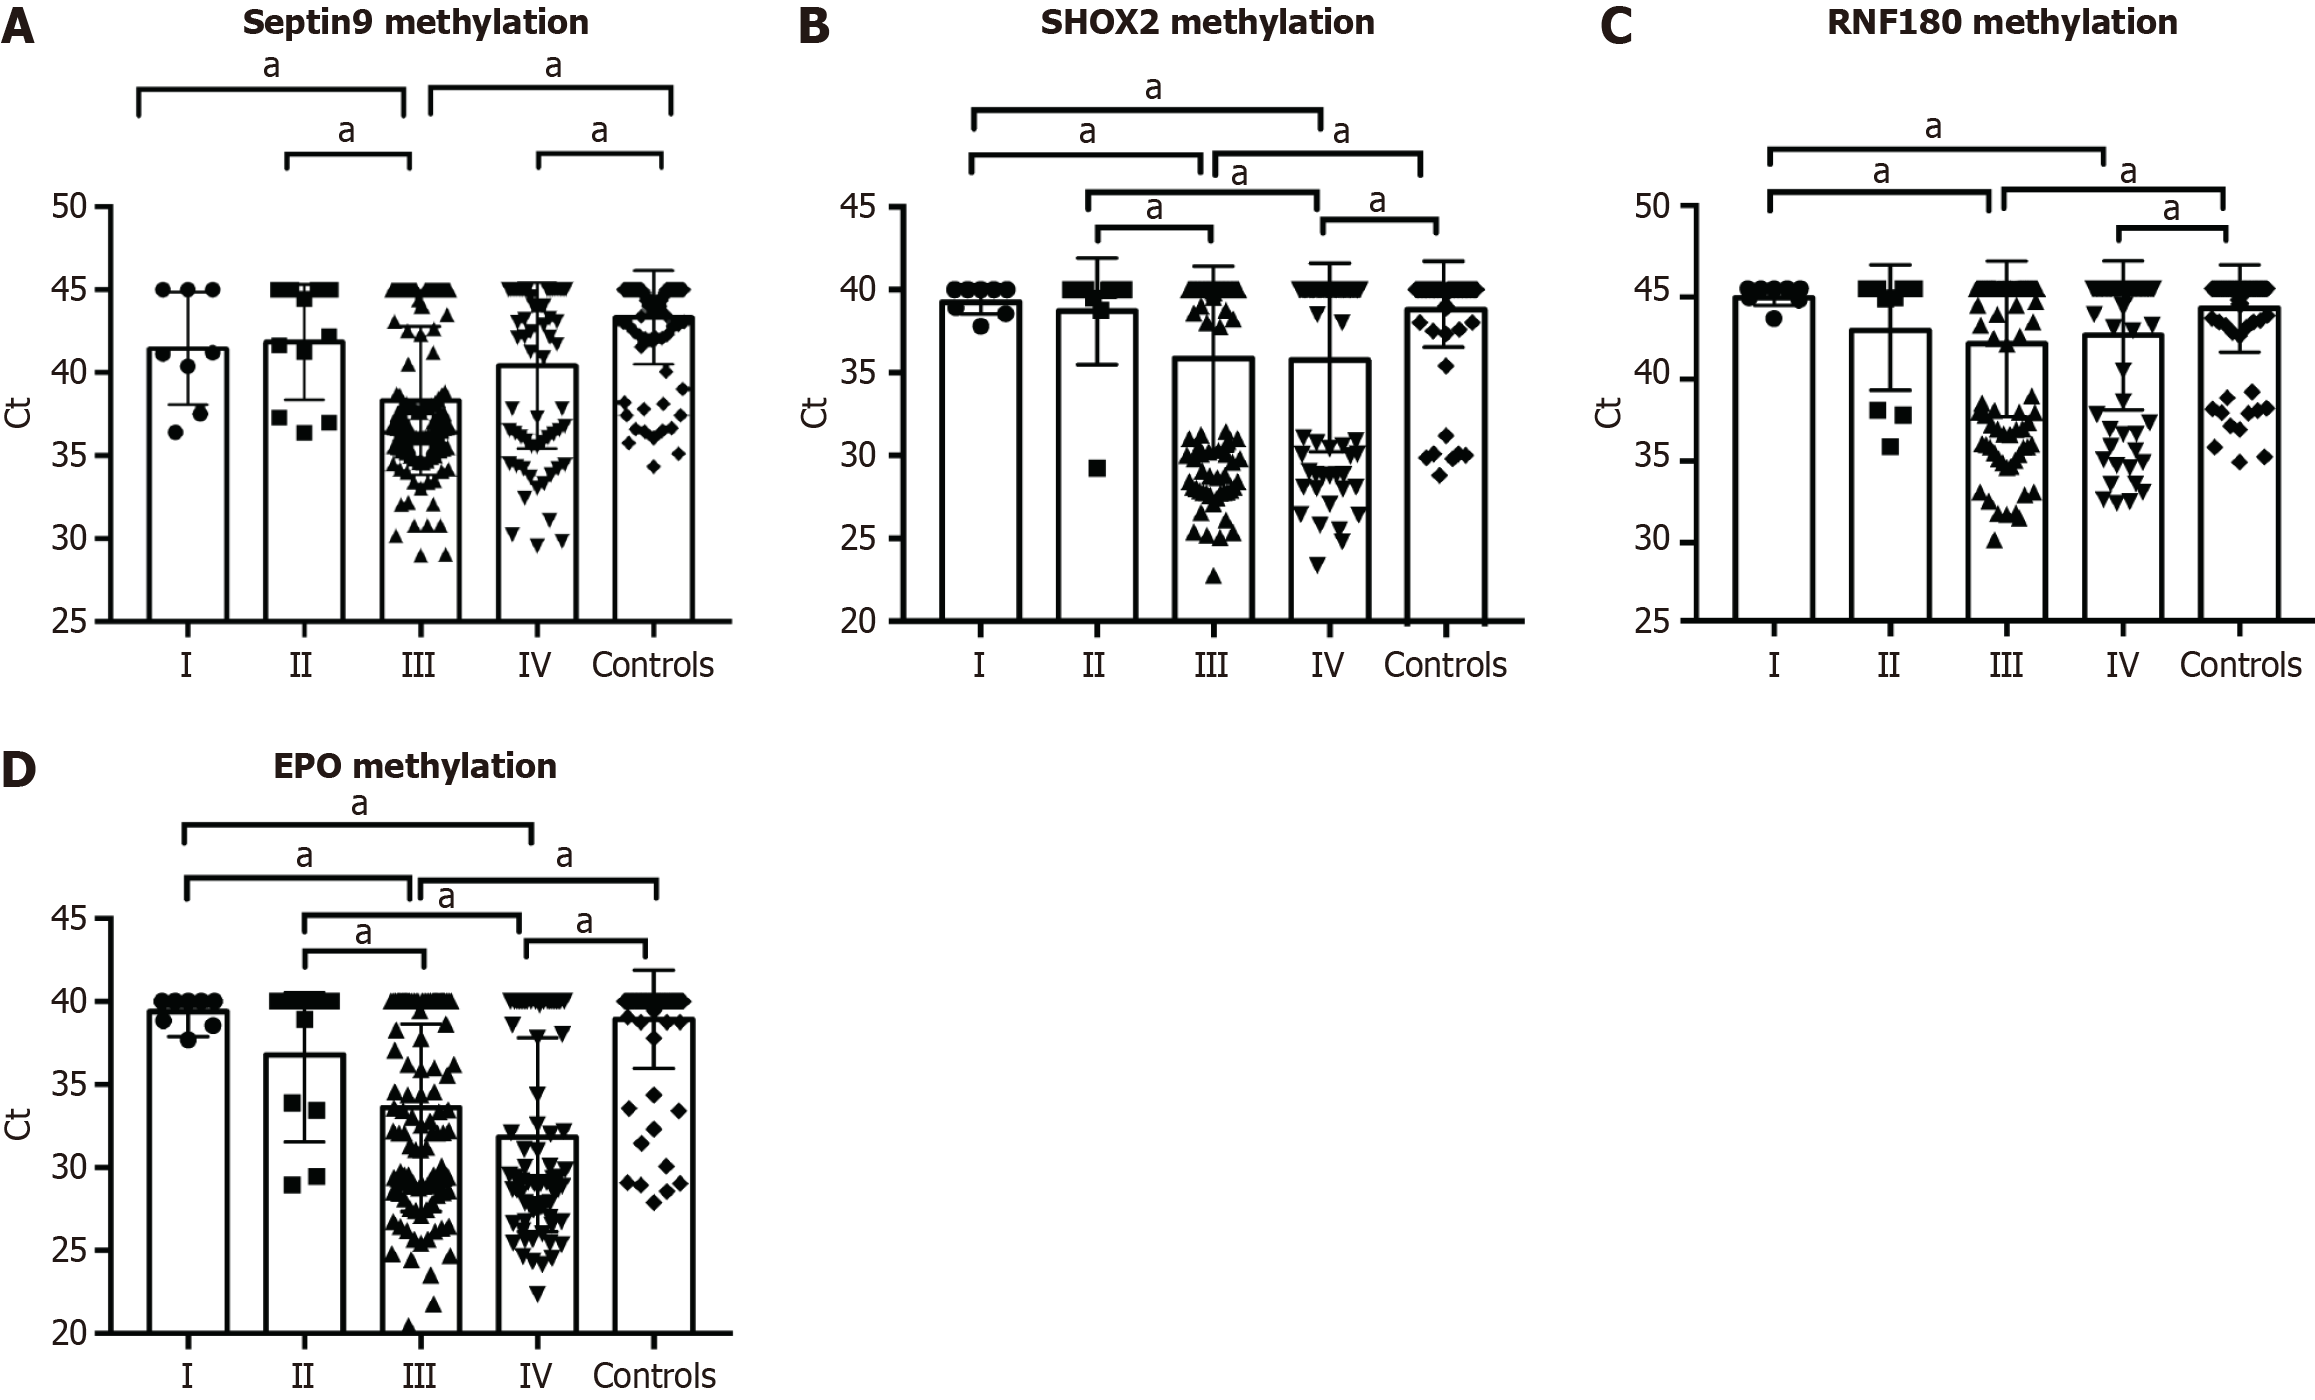
Figure 2 Quantitative analysis of SEPTIN9, SHOX2, RNF180 and EPO methylation in plasma specimens of controls (n = 102) and patients with different stages of esophageal cancer (n = 210).
A-D: Quantitative analysis of SEPTIN9 (A), SHOX2 (B), RNF180 (C), and EPO (D) methylation in esophageal cancer patients with different stages and controls. The positive rates of SHOX2, RNF180, SEPTIN9, and EPO DNA methylation in EC patients with advanced stages were higher than those of EC patients with early stages and controls. aP < 0.05.
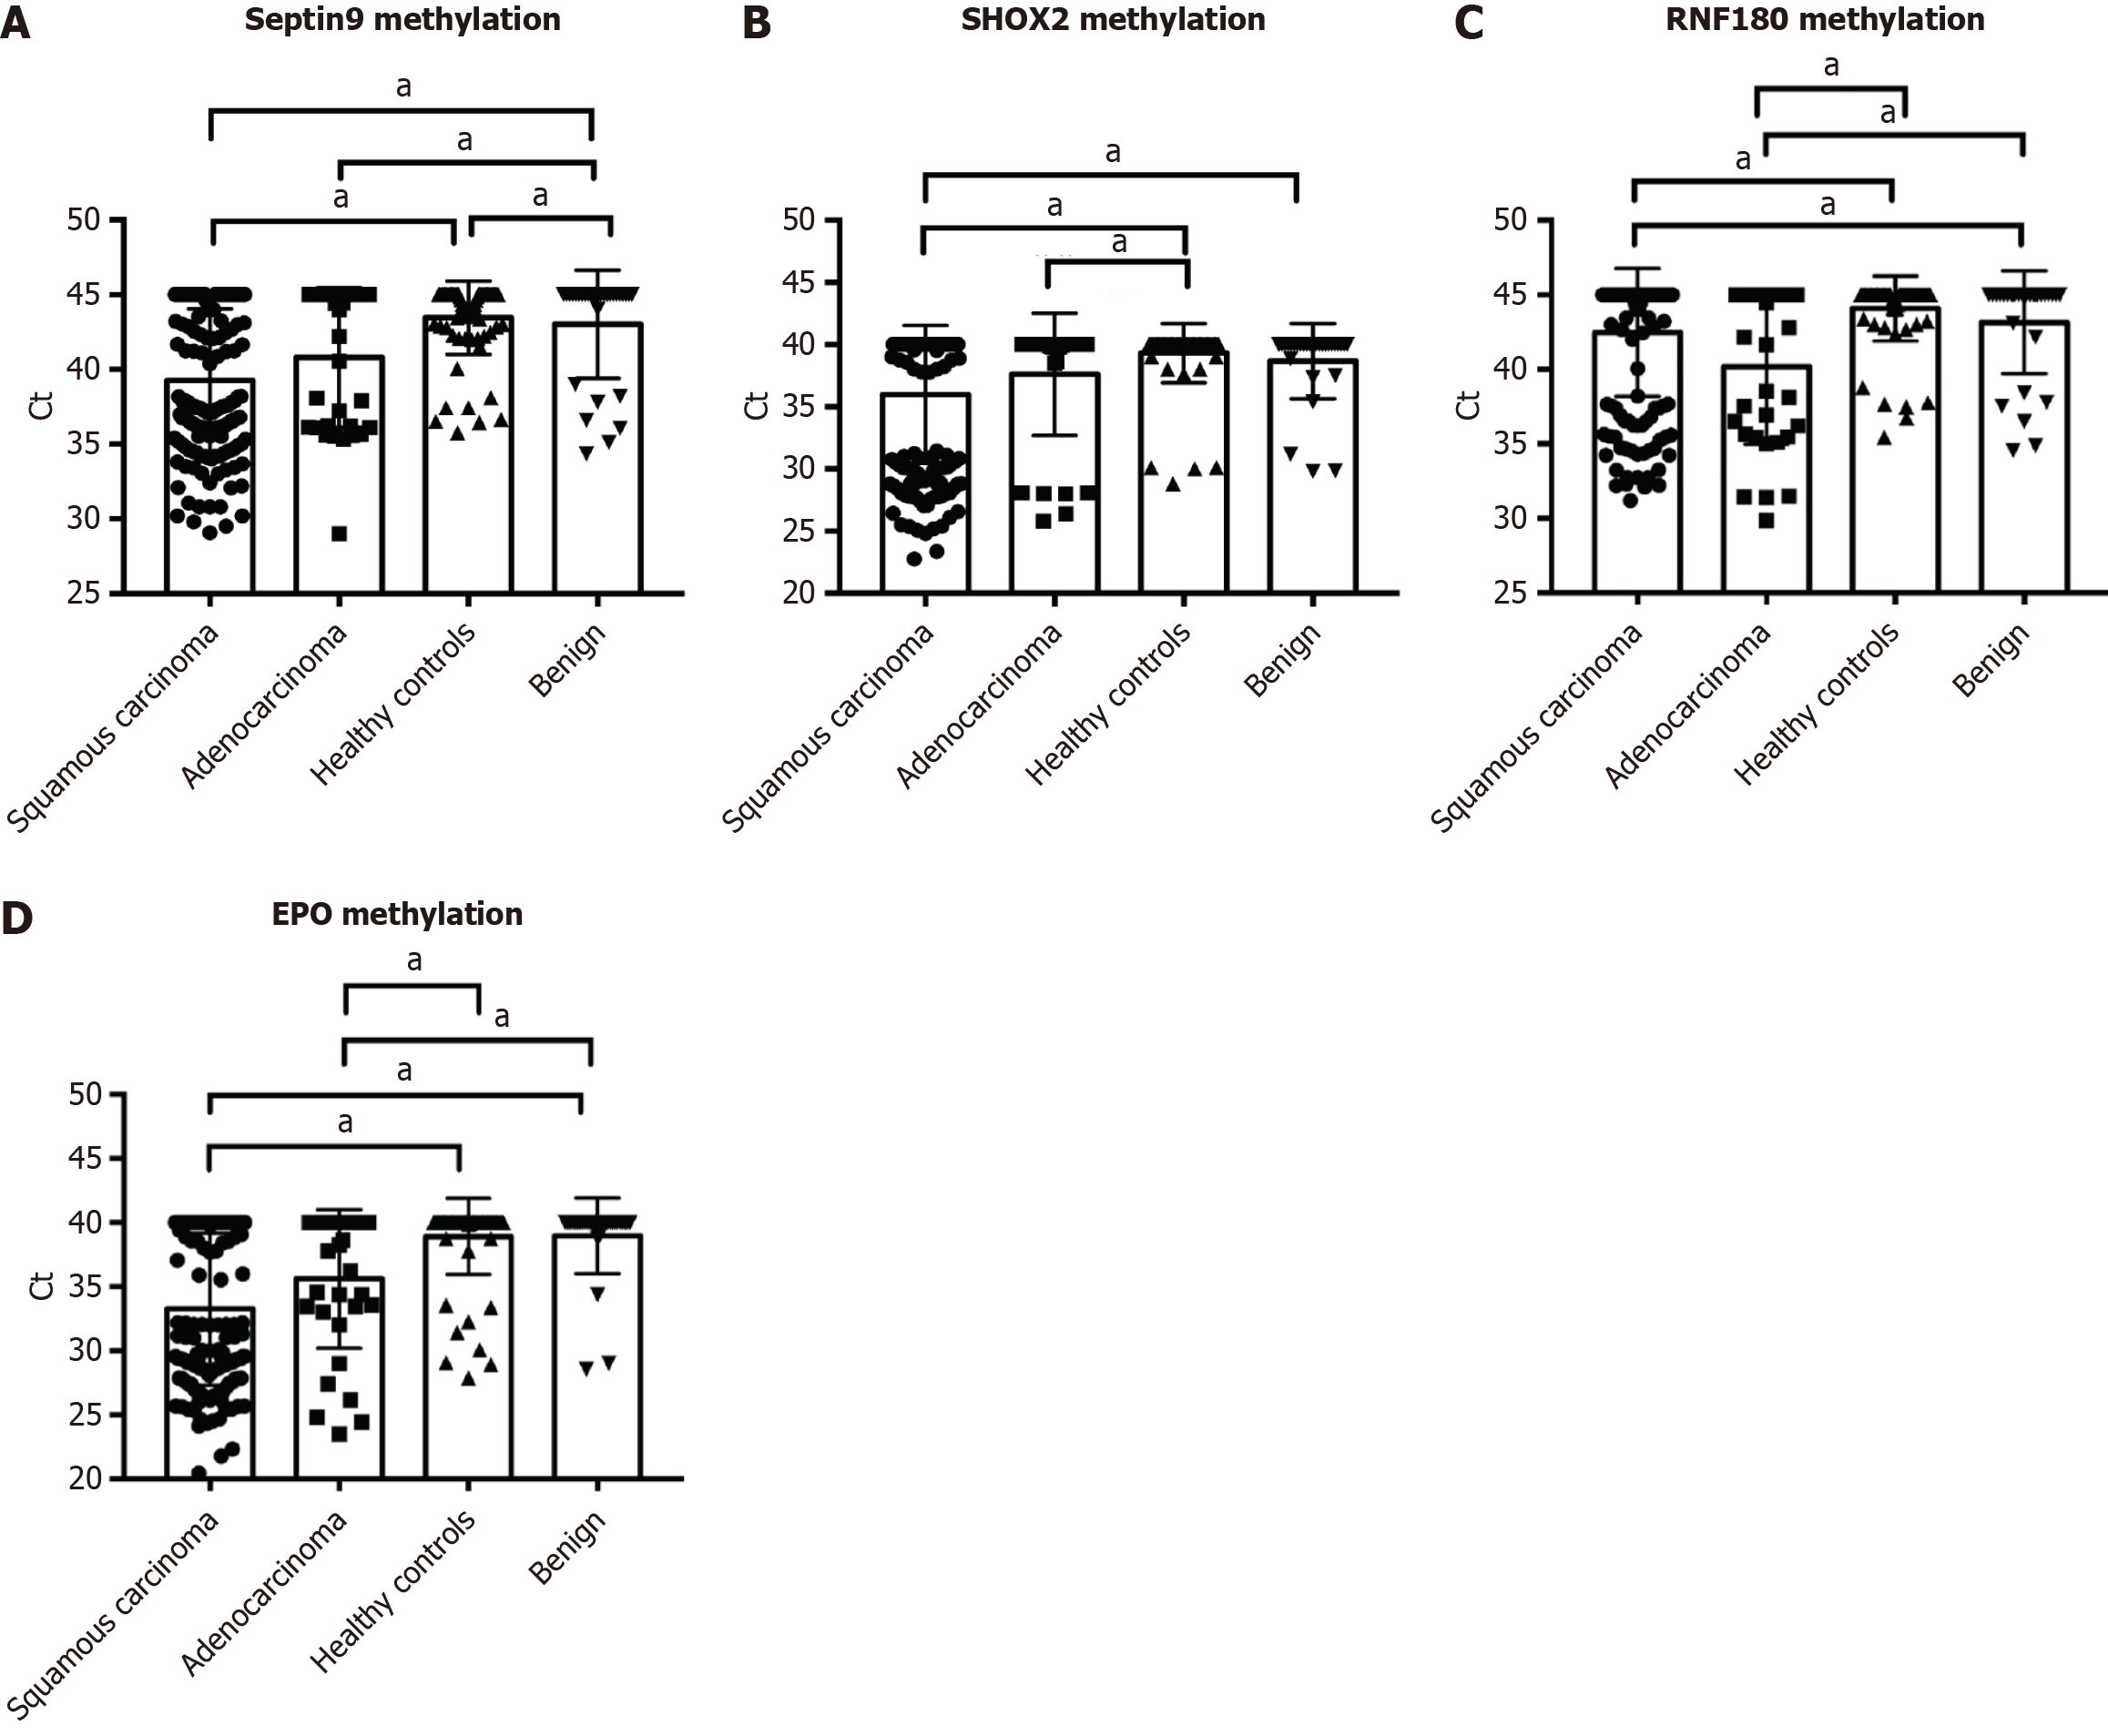
Figure 3 Quantitative analysis of SEPTIN9, SHOX2, RNF180, and EPO methylation in plasma specimens of controls (n = 102) and patients with esophageal adenocarcinoma (n = 33) and squamous cell carcinoma (n = 177).
A-D: Quantitative analysis of SEPTIN9 (A), SHOX2 (B), RNF180 (C), and EPO (D) methylation in esophageal adenocarcinoma, squamous cell carcinoma (SCC), and controls. No significant differences were observed in the positive rates of SHOX2, RNF180, SEPTIN9, and EPO methylation in esophageal cancer patients with SCC and adenocarcinoma, while they exceeded those of healthy controls and benign patients. aP < 0.05.
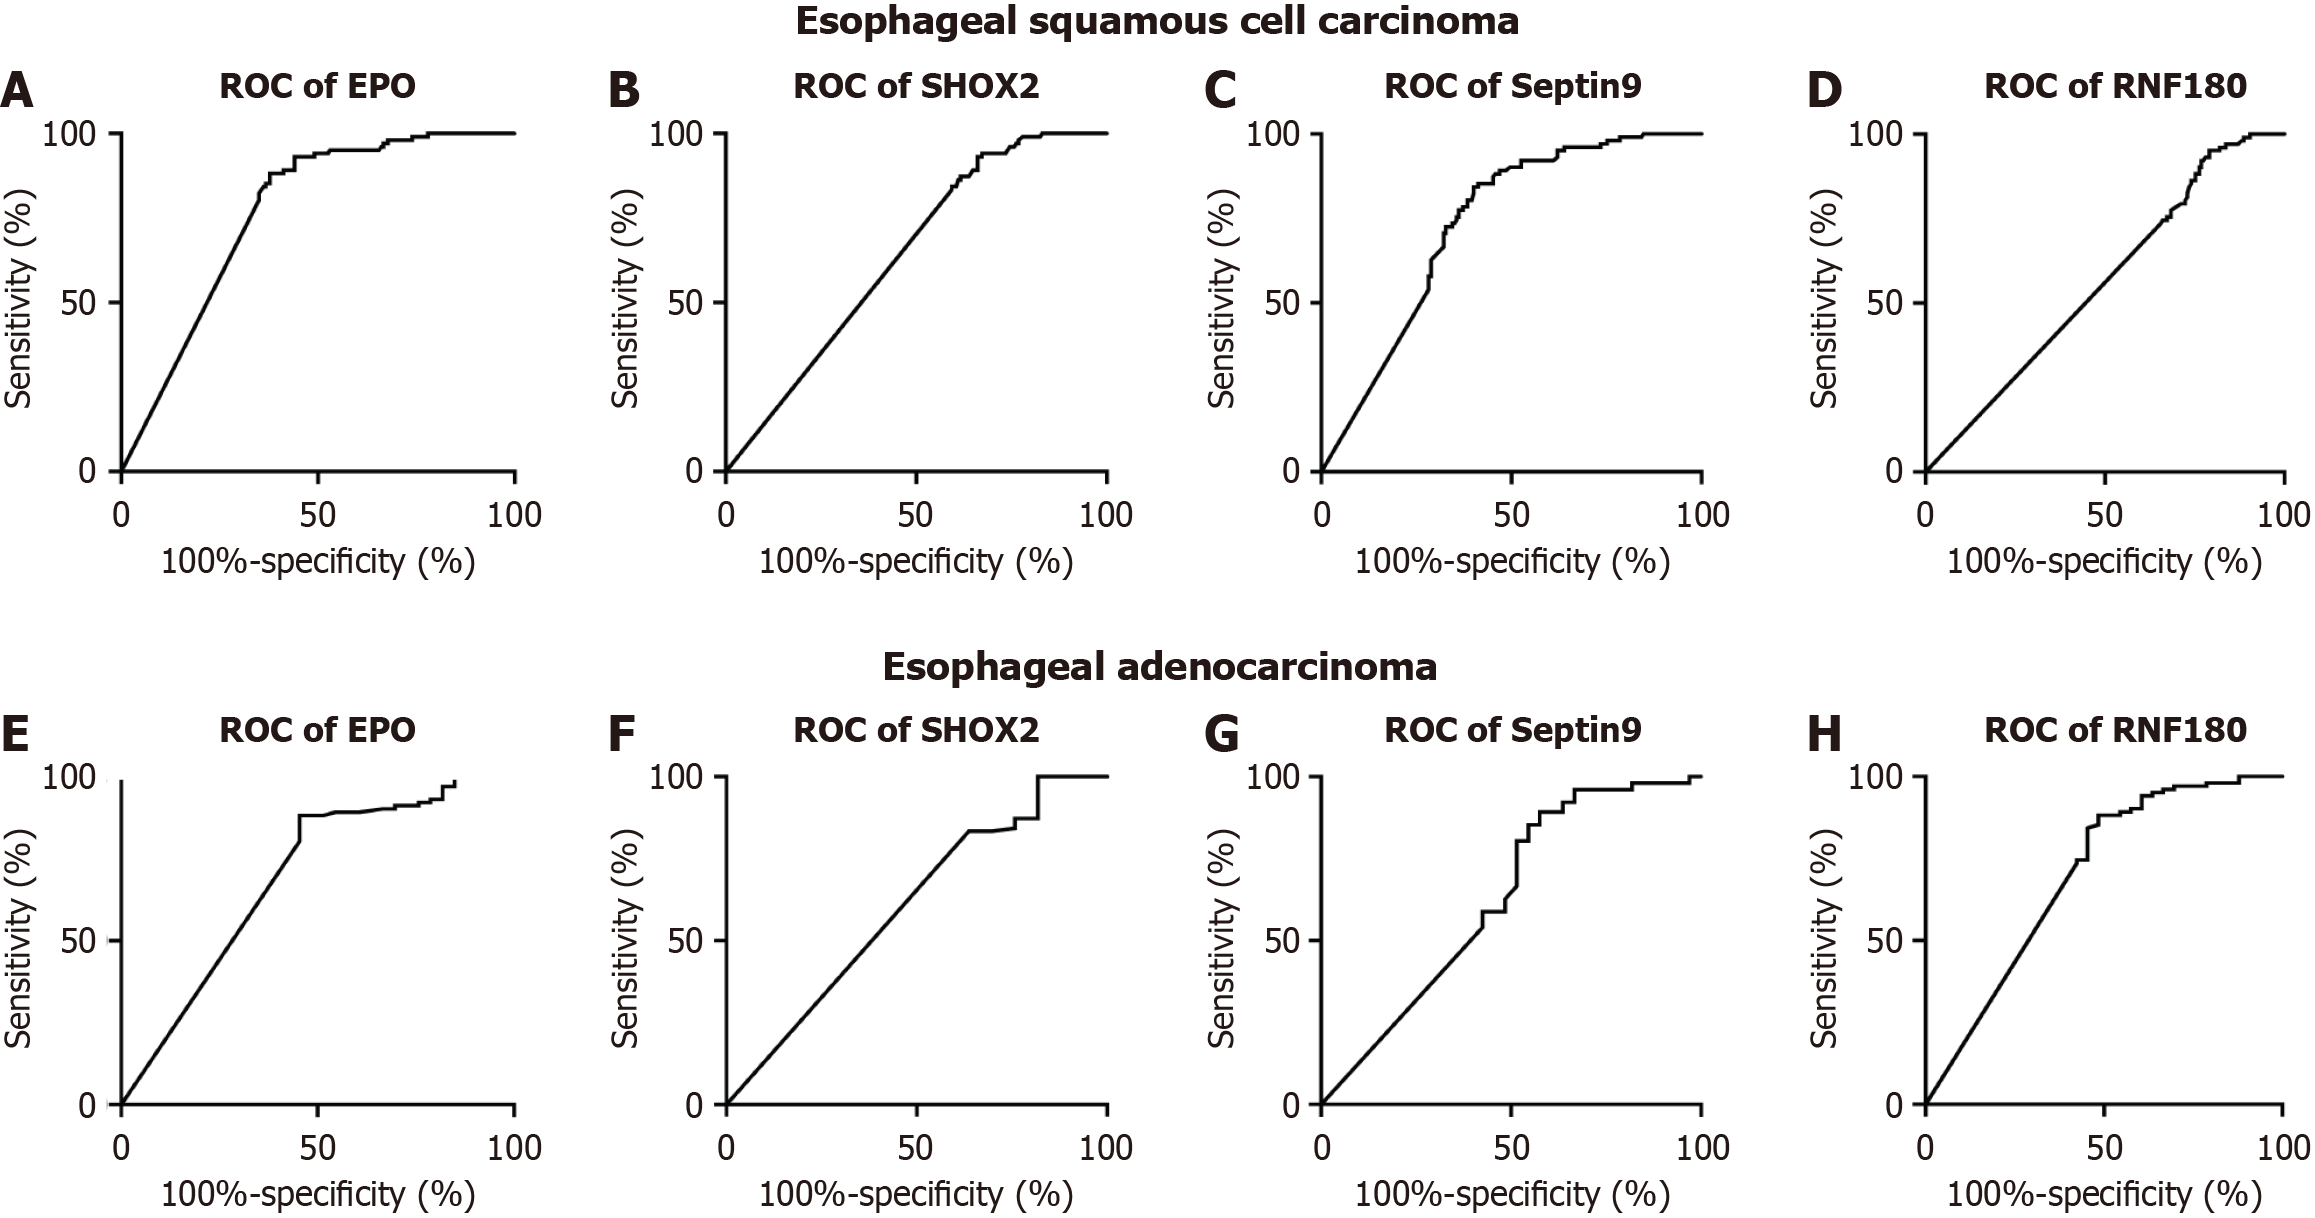
Figure 4 Receiver operating characteristic curve analysis of SHOX2, RNF180, SEPTIN9, and EPO methylation biomarkers.
A-D: Receiver operating characteristic (ROC) curves of methylation for squamous cell carcinoma. Area under the curve (AUC)-SHOX2 = 0.639 (95%CI: 0.575–0.703), AUC-SEPTIN9 = 0.731 (95%CI: 0.673–0.789), AUC-EPO = 0.765 (95%CI: 0.710–0.820), and AUC-RNF180 = 0.559 (95%CI: 0.491–0.626); E-H: ROC curve analysis of methylation for adenocarcinoma. AUC-SHOX2 = 0.601 (95%CI: 0.484–0.719), AUC-SEPTIN9 = 0.626 (95%CI: 0.504–0.749), AUC-EPO = 0.691 (95%CI: 0.577–0.805), and AUC-RNF180 = 0.697 (95%CI: 0.582–0.813). ROC: Receiver operating characteristic.
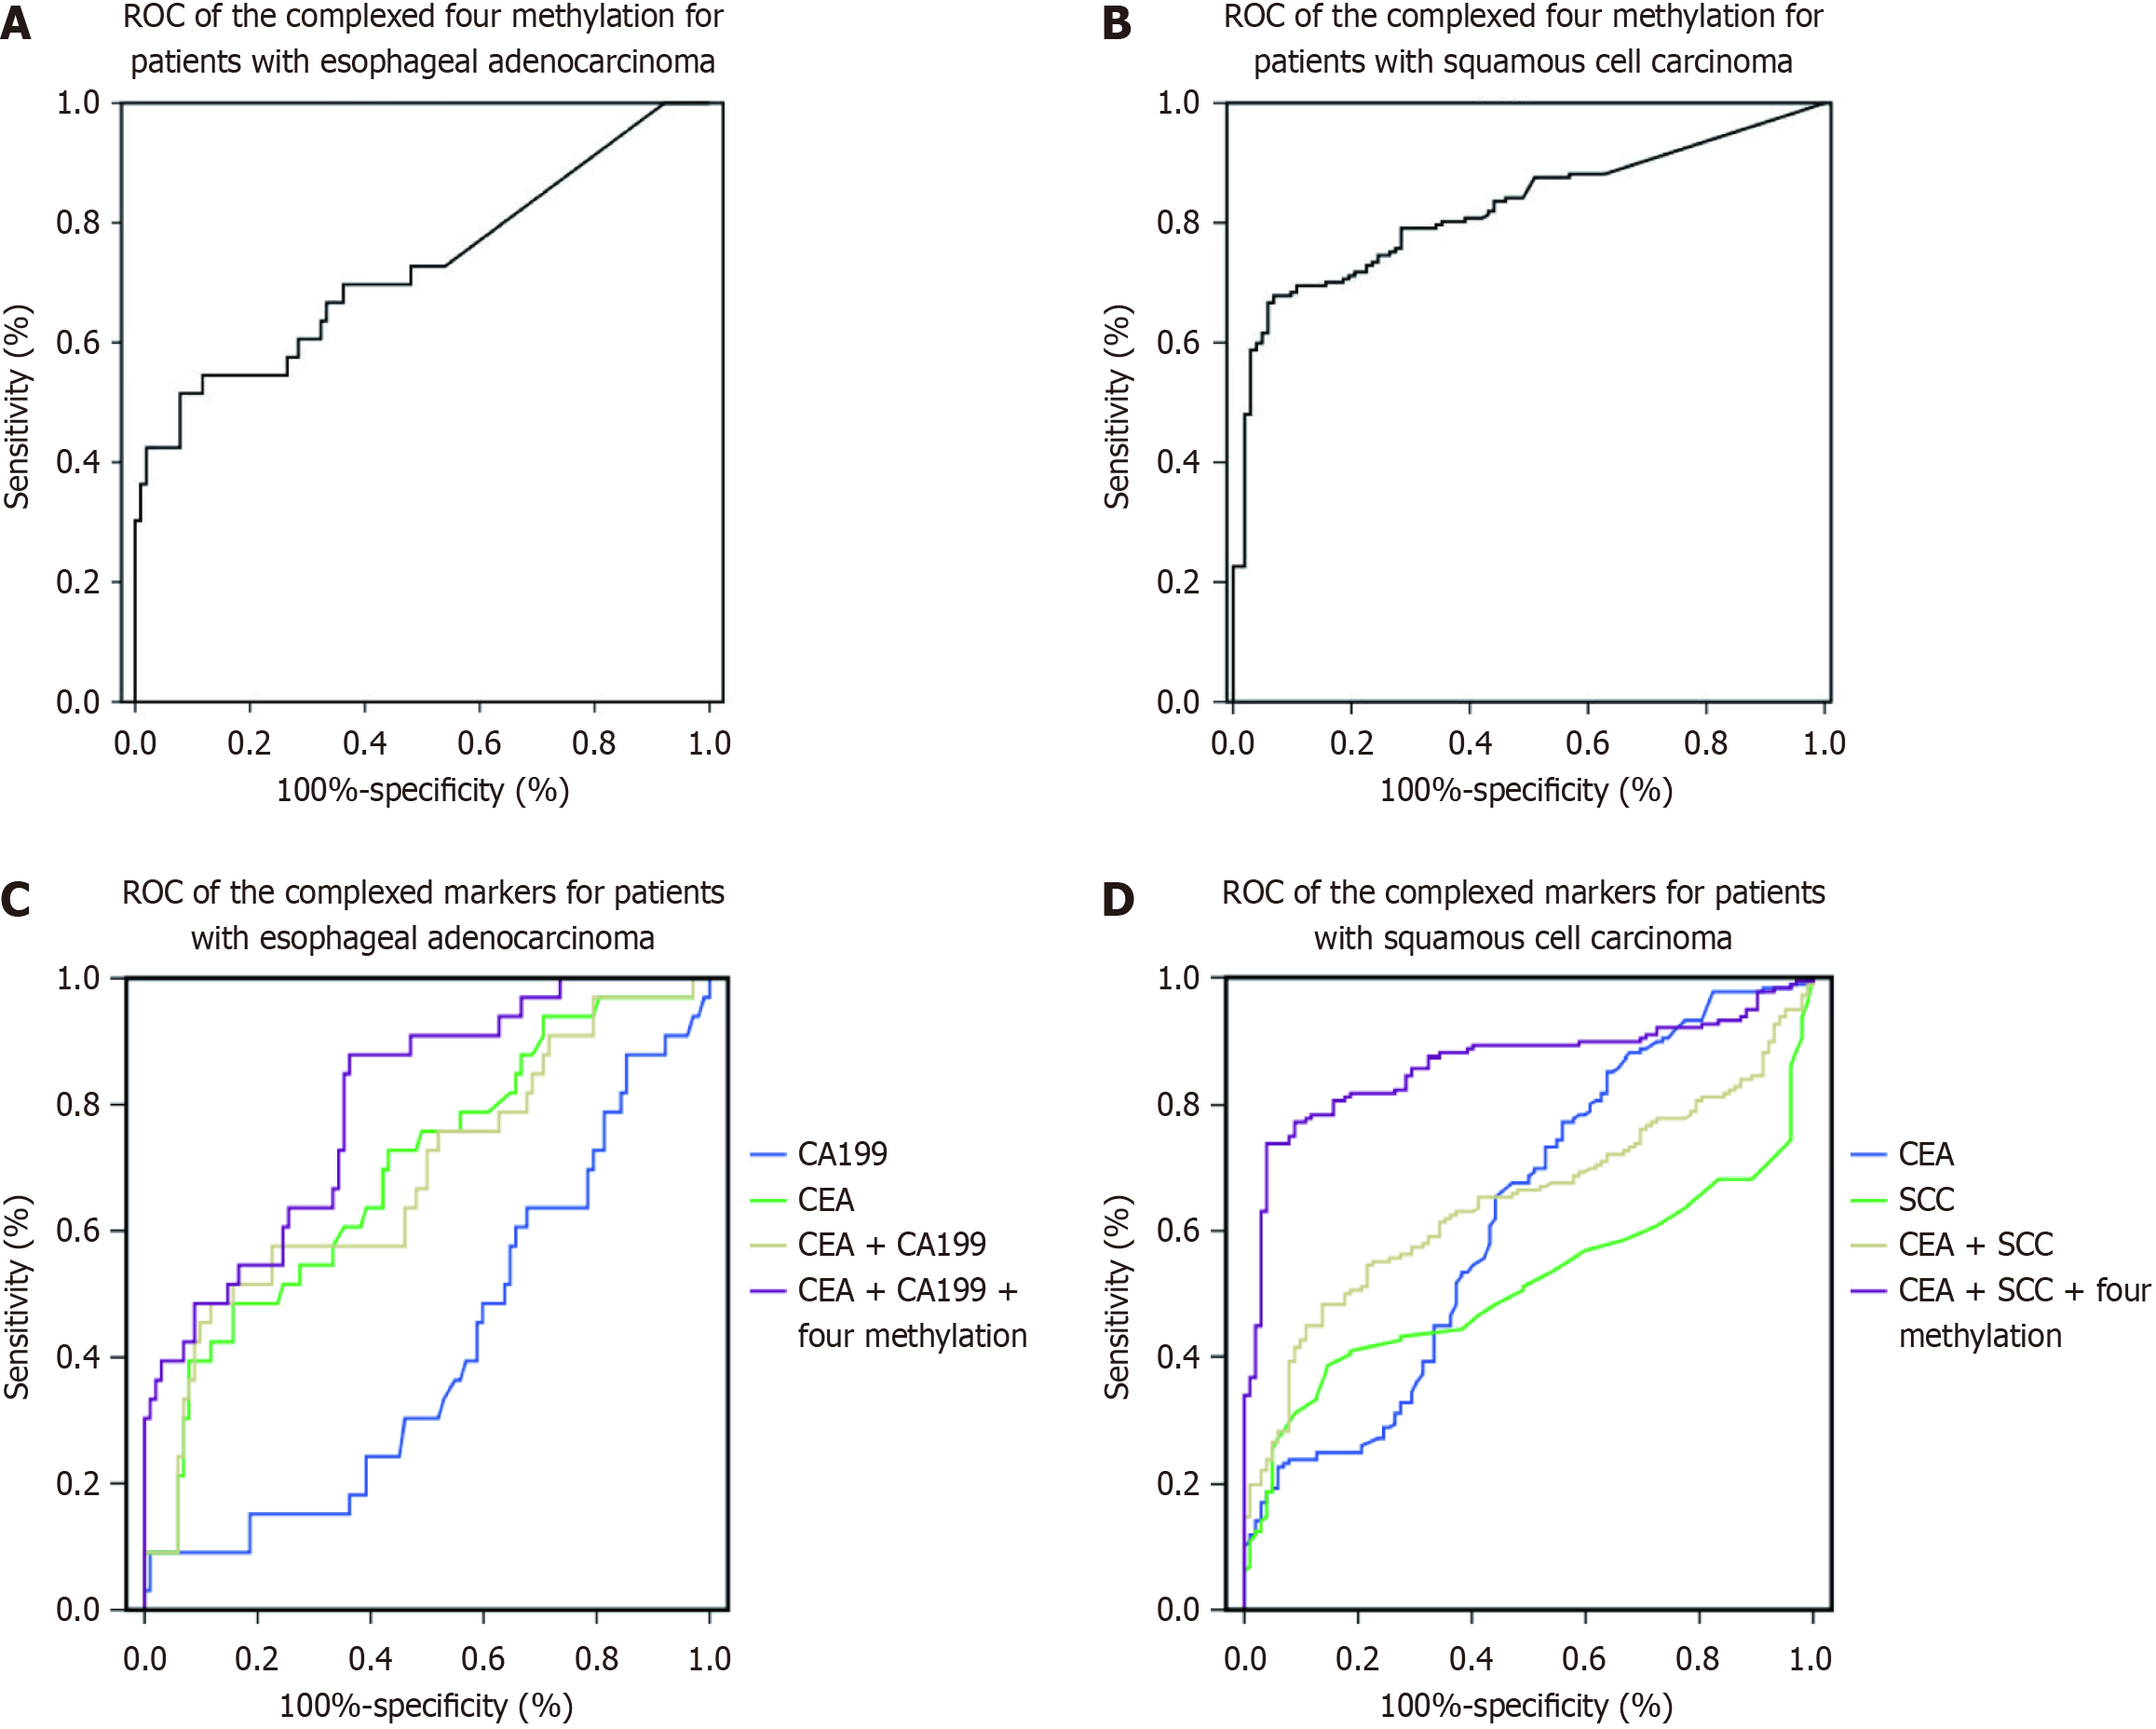
Figure 5 Receiver operating characteristic curve analysis of the tumor markers squamous cell carcinoma antigen, carbohydrate antigen 199, and carcinoembryonic antigen as well as methylation of the four genes as evaluated using plasma samples of patients with esopha
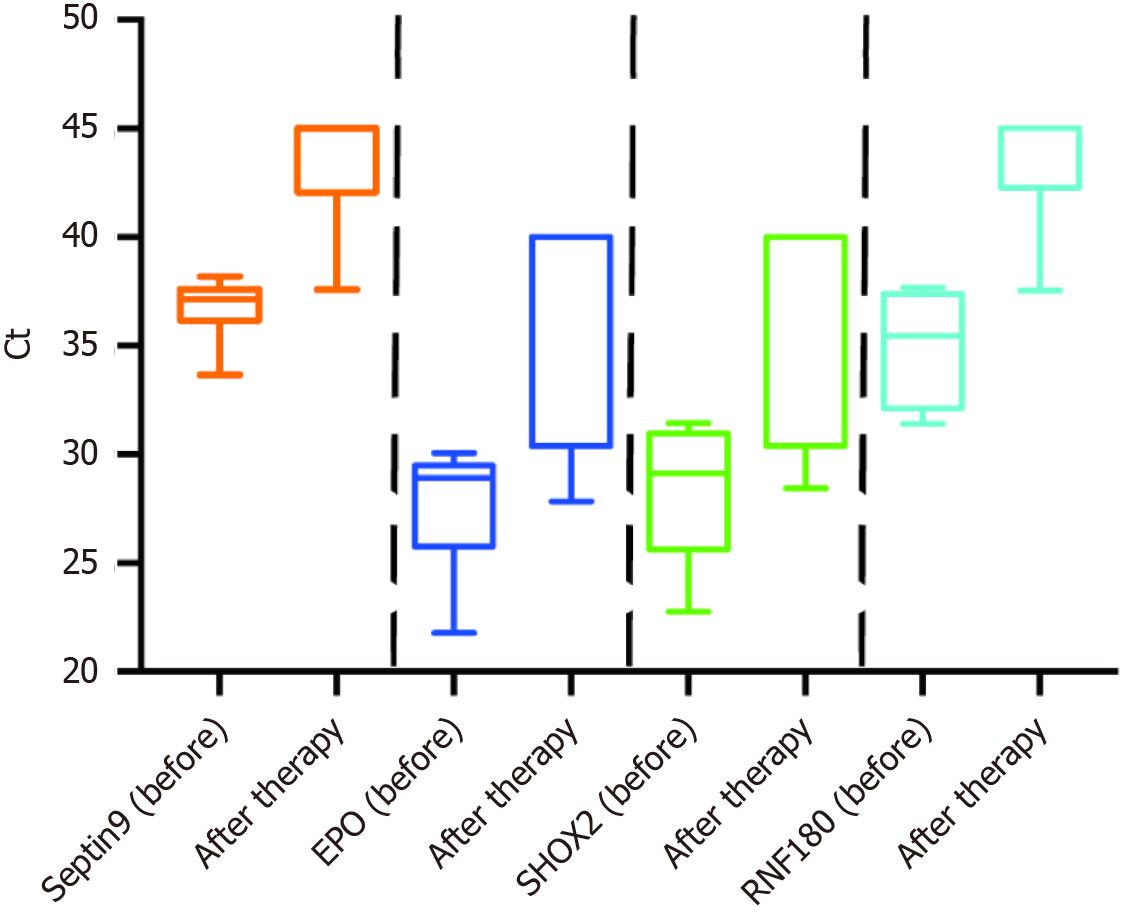
Figure 6 Frequency distributions of plasma SHOX2, RNF180, SEPTIN9, and EPO methylation before and after therapy in patients with esophageal cancer (n = 23).
Frequency distributions of plasma SHOX2, RNF180, SEPTIN9, and EPO methylation were less after therapy than before therapy.
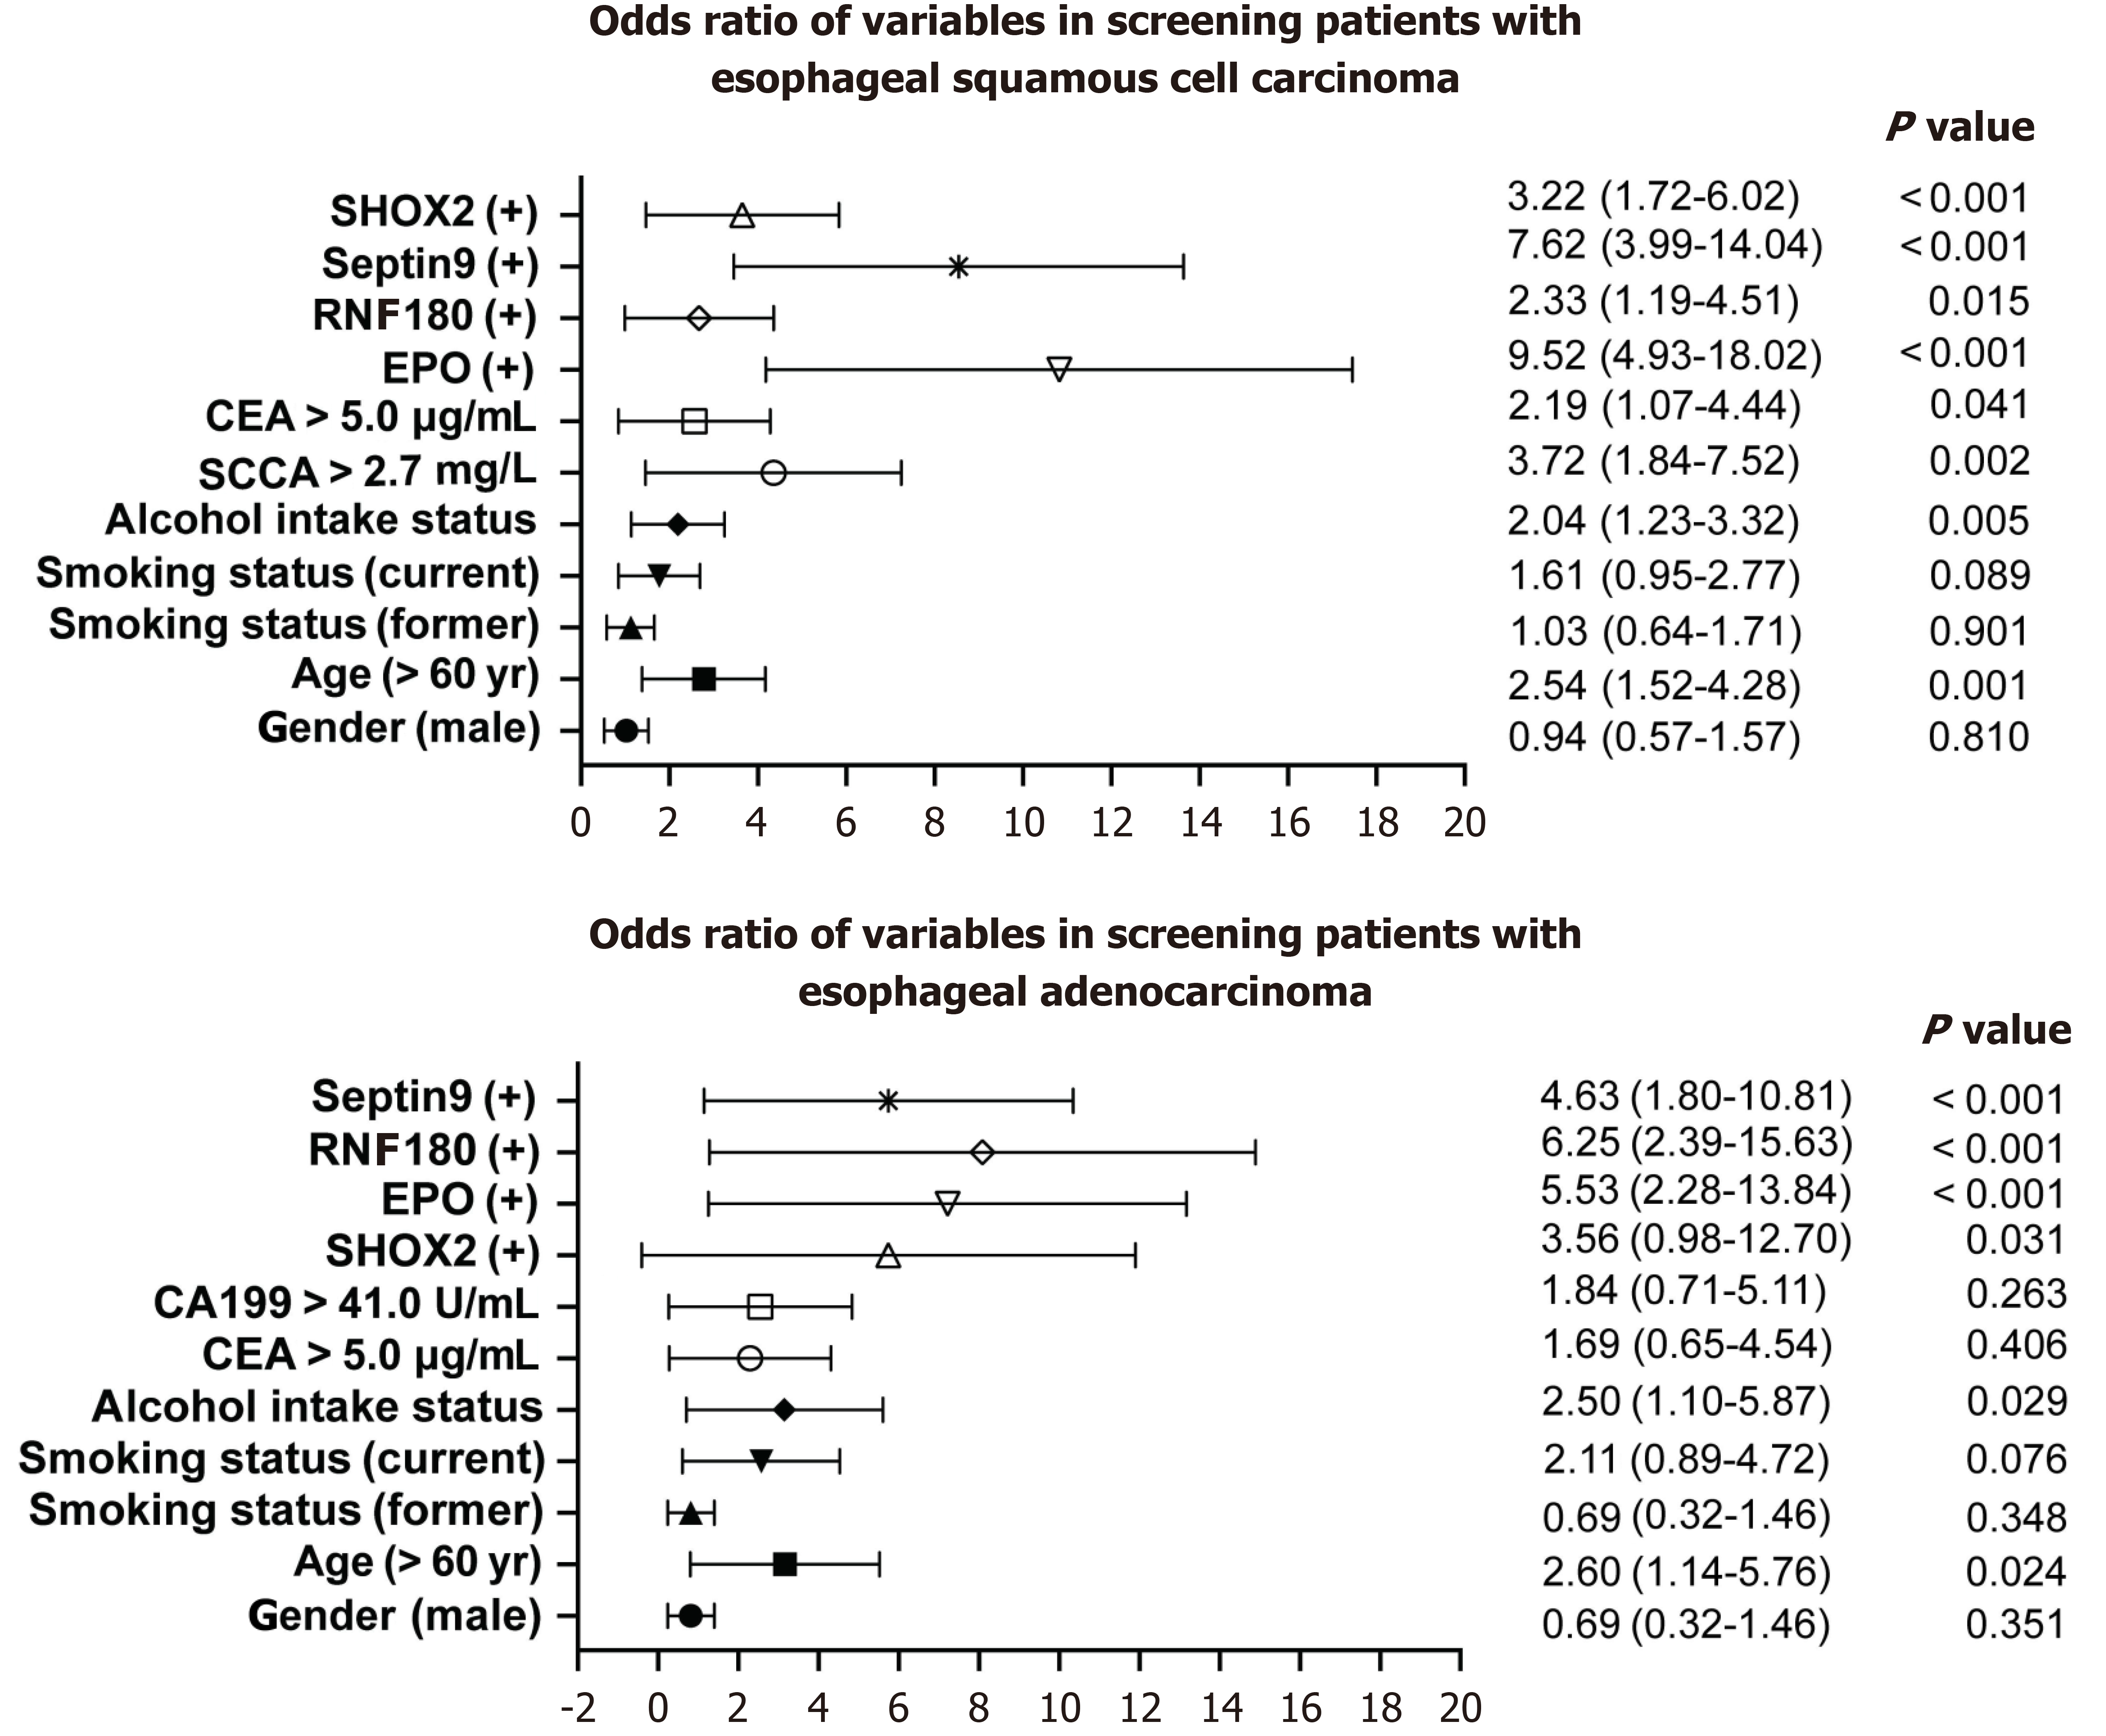
Figure 7 Forest plots of age, gender, smoking status, alcohol intake status, biomarker levels, and SHOX2, RNF180, SEPTIN9, and EPO methylation in screening patients with esophageal cancer.
Variables are on the left axis, while P values are on the right. OR: Odds ratio; SCCA: Squamous cell carcinoma antigen; CEA: Carcinoembryonic antigen; CA199: Carbohydrate antigen 199.
- Citation: Liu XJ, Pi GL, Wang S, Kai JD, Yu HF, Shi HW, Yu J, Zeng H. Plasma DNA methylation detection for early screening, diagnosis, and monitoring of esophageal adenocarcinoma and squamous cell carcinoma. World J Gastroenterol 2024; 30(43): 4609-4619
- URL: https://www.wjgnet.com/1007-9327/full/v30/i43/4609.htm
- DOI: https://dx.doi.org/10.3748/wjg.v30.i43.4609


