Copyright
©The Author(s) 2024.
World J Gastroenterol. Nov 14, 2024; 30(42): 4544-4556
Published online Nov 14, 2024. doi: 10.3748/wjg.v30.i42.4544
Published online Nov 14, 2024. doi: 10.3748/wjg.v30.i42.4544
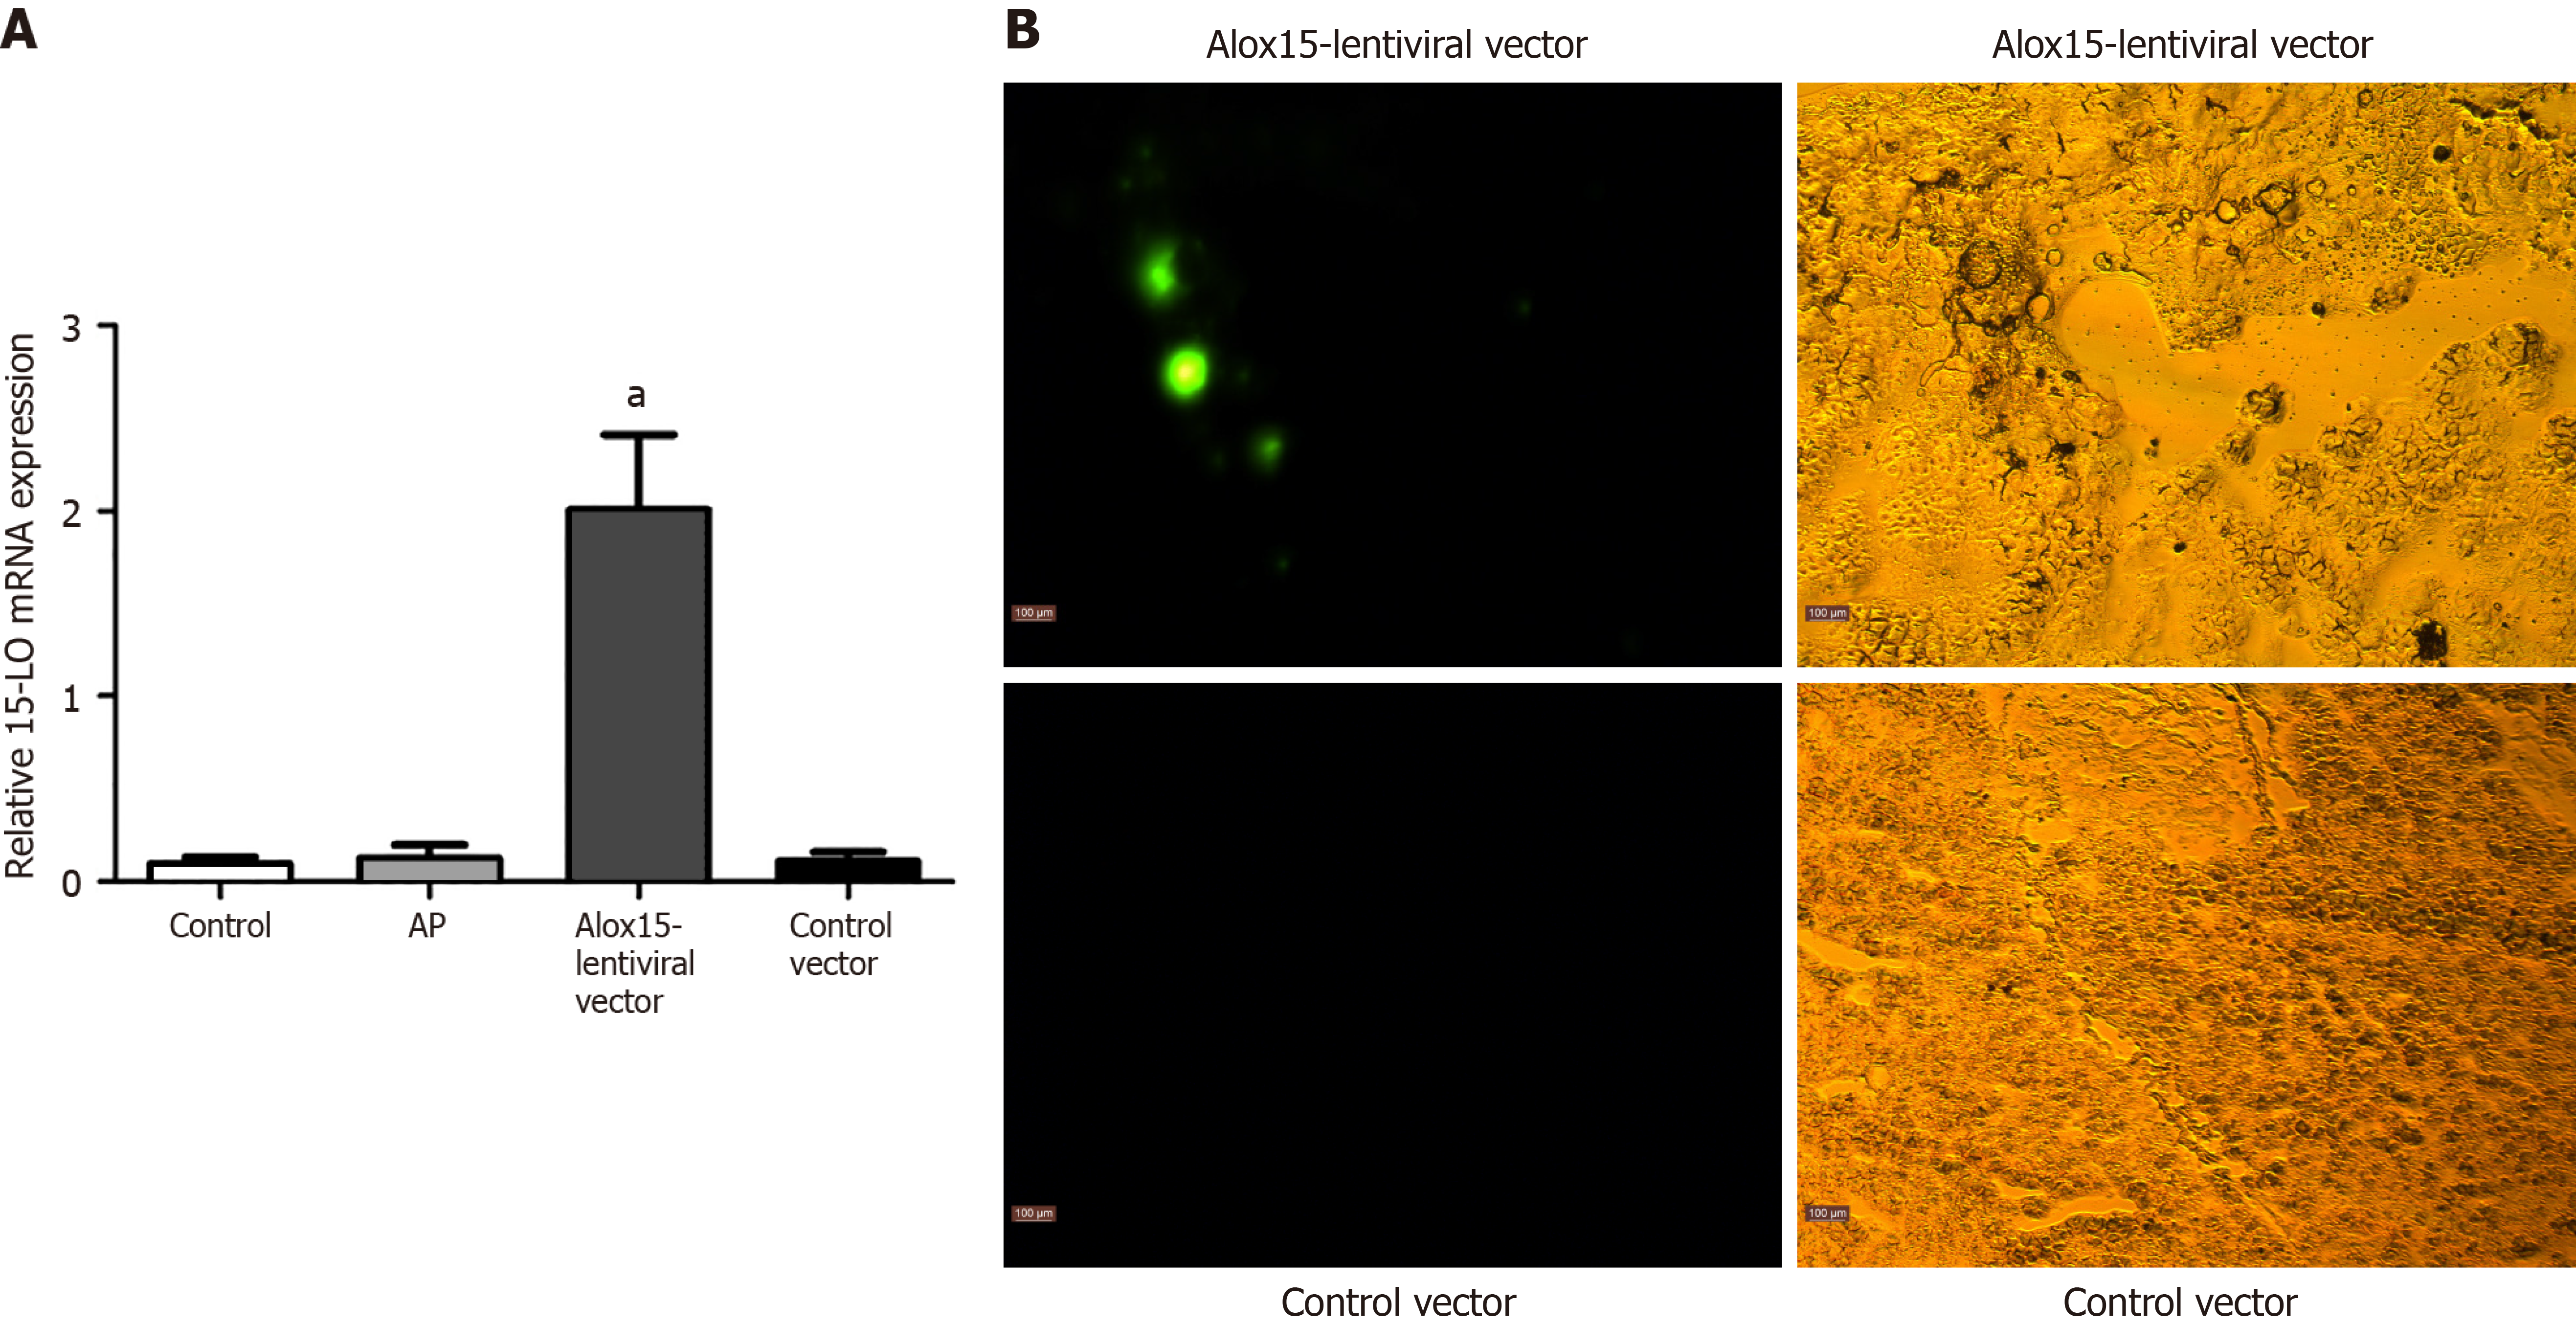
Figure 1 Expression of Alox15 in rats.
A: Alox15 mRNA levels in the pancreas; B: Immunofluorescence of Alox15 protein in pancreas from the Alox15-lentiviral vector group and the vector control group, the scale bar represents 100 μm. Differences were assessed using one-way ANOVA and multiple comparisons were determined using Games-Howell test. aP < 0.05 vs the control group.
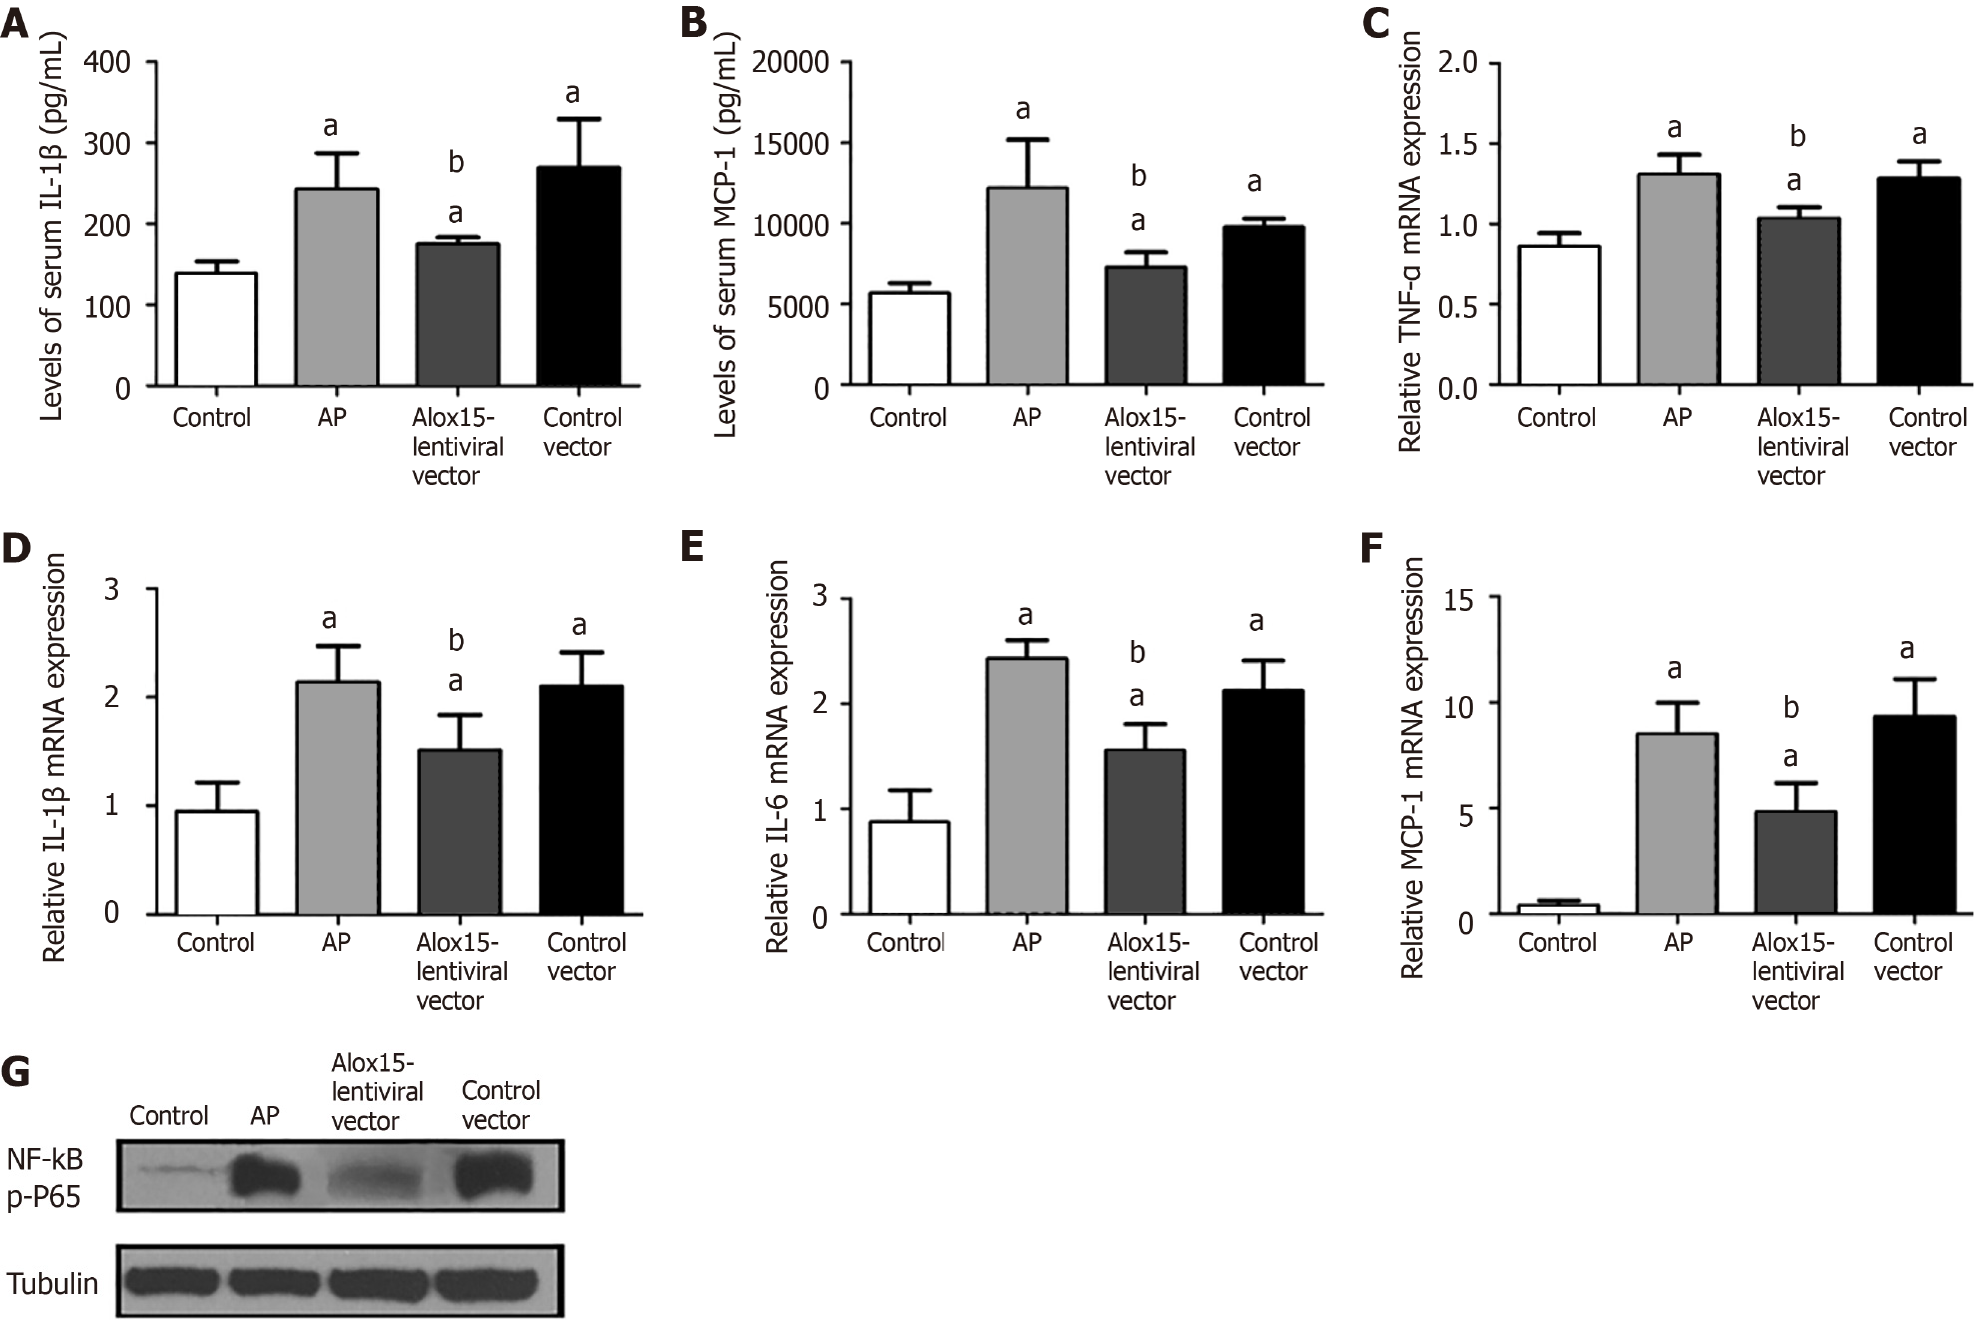
Figure 2 Expression of Alox15 decreases inflammation in cerulein-induced acute pancreatitis.
A: Serum levels of interleukin (IL)-1β; B: Serum levels of monocyte chemoattractant protein-1 (MCP-1); C-F: Pancreatic mRNA expression levels of pro-inflammatory mediators: Tumor necrosis factor-α, IL-1β, IL-6, MCP-1; G: The expression of NF-κB p-P65 in pancreatic tissue. Differences were assessed using one-way ANOVA and multiple comparisons were determined using Games-Howell test. aP < 0.05 vs the control group; bP < 0.05 the Alox15-lentiviral vector group vs the control vector group. TNF-α: Tumor necrosis factor-α; MCP-1: Monocyte chemoattractant protein-1; IL: Interleukin.
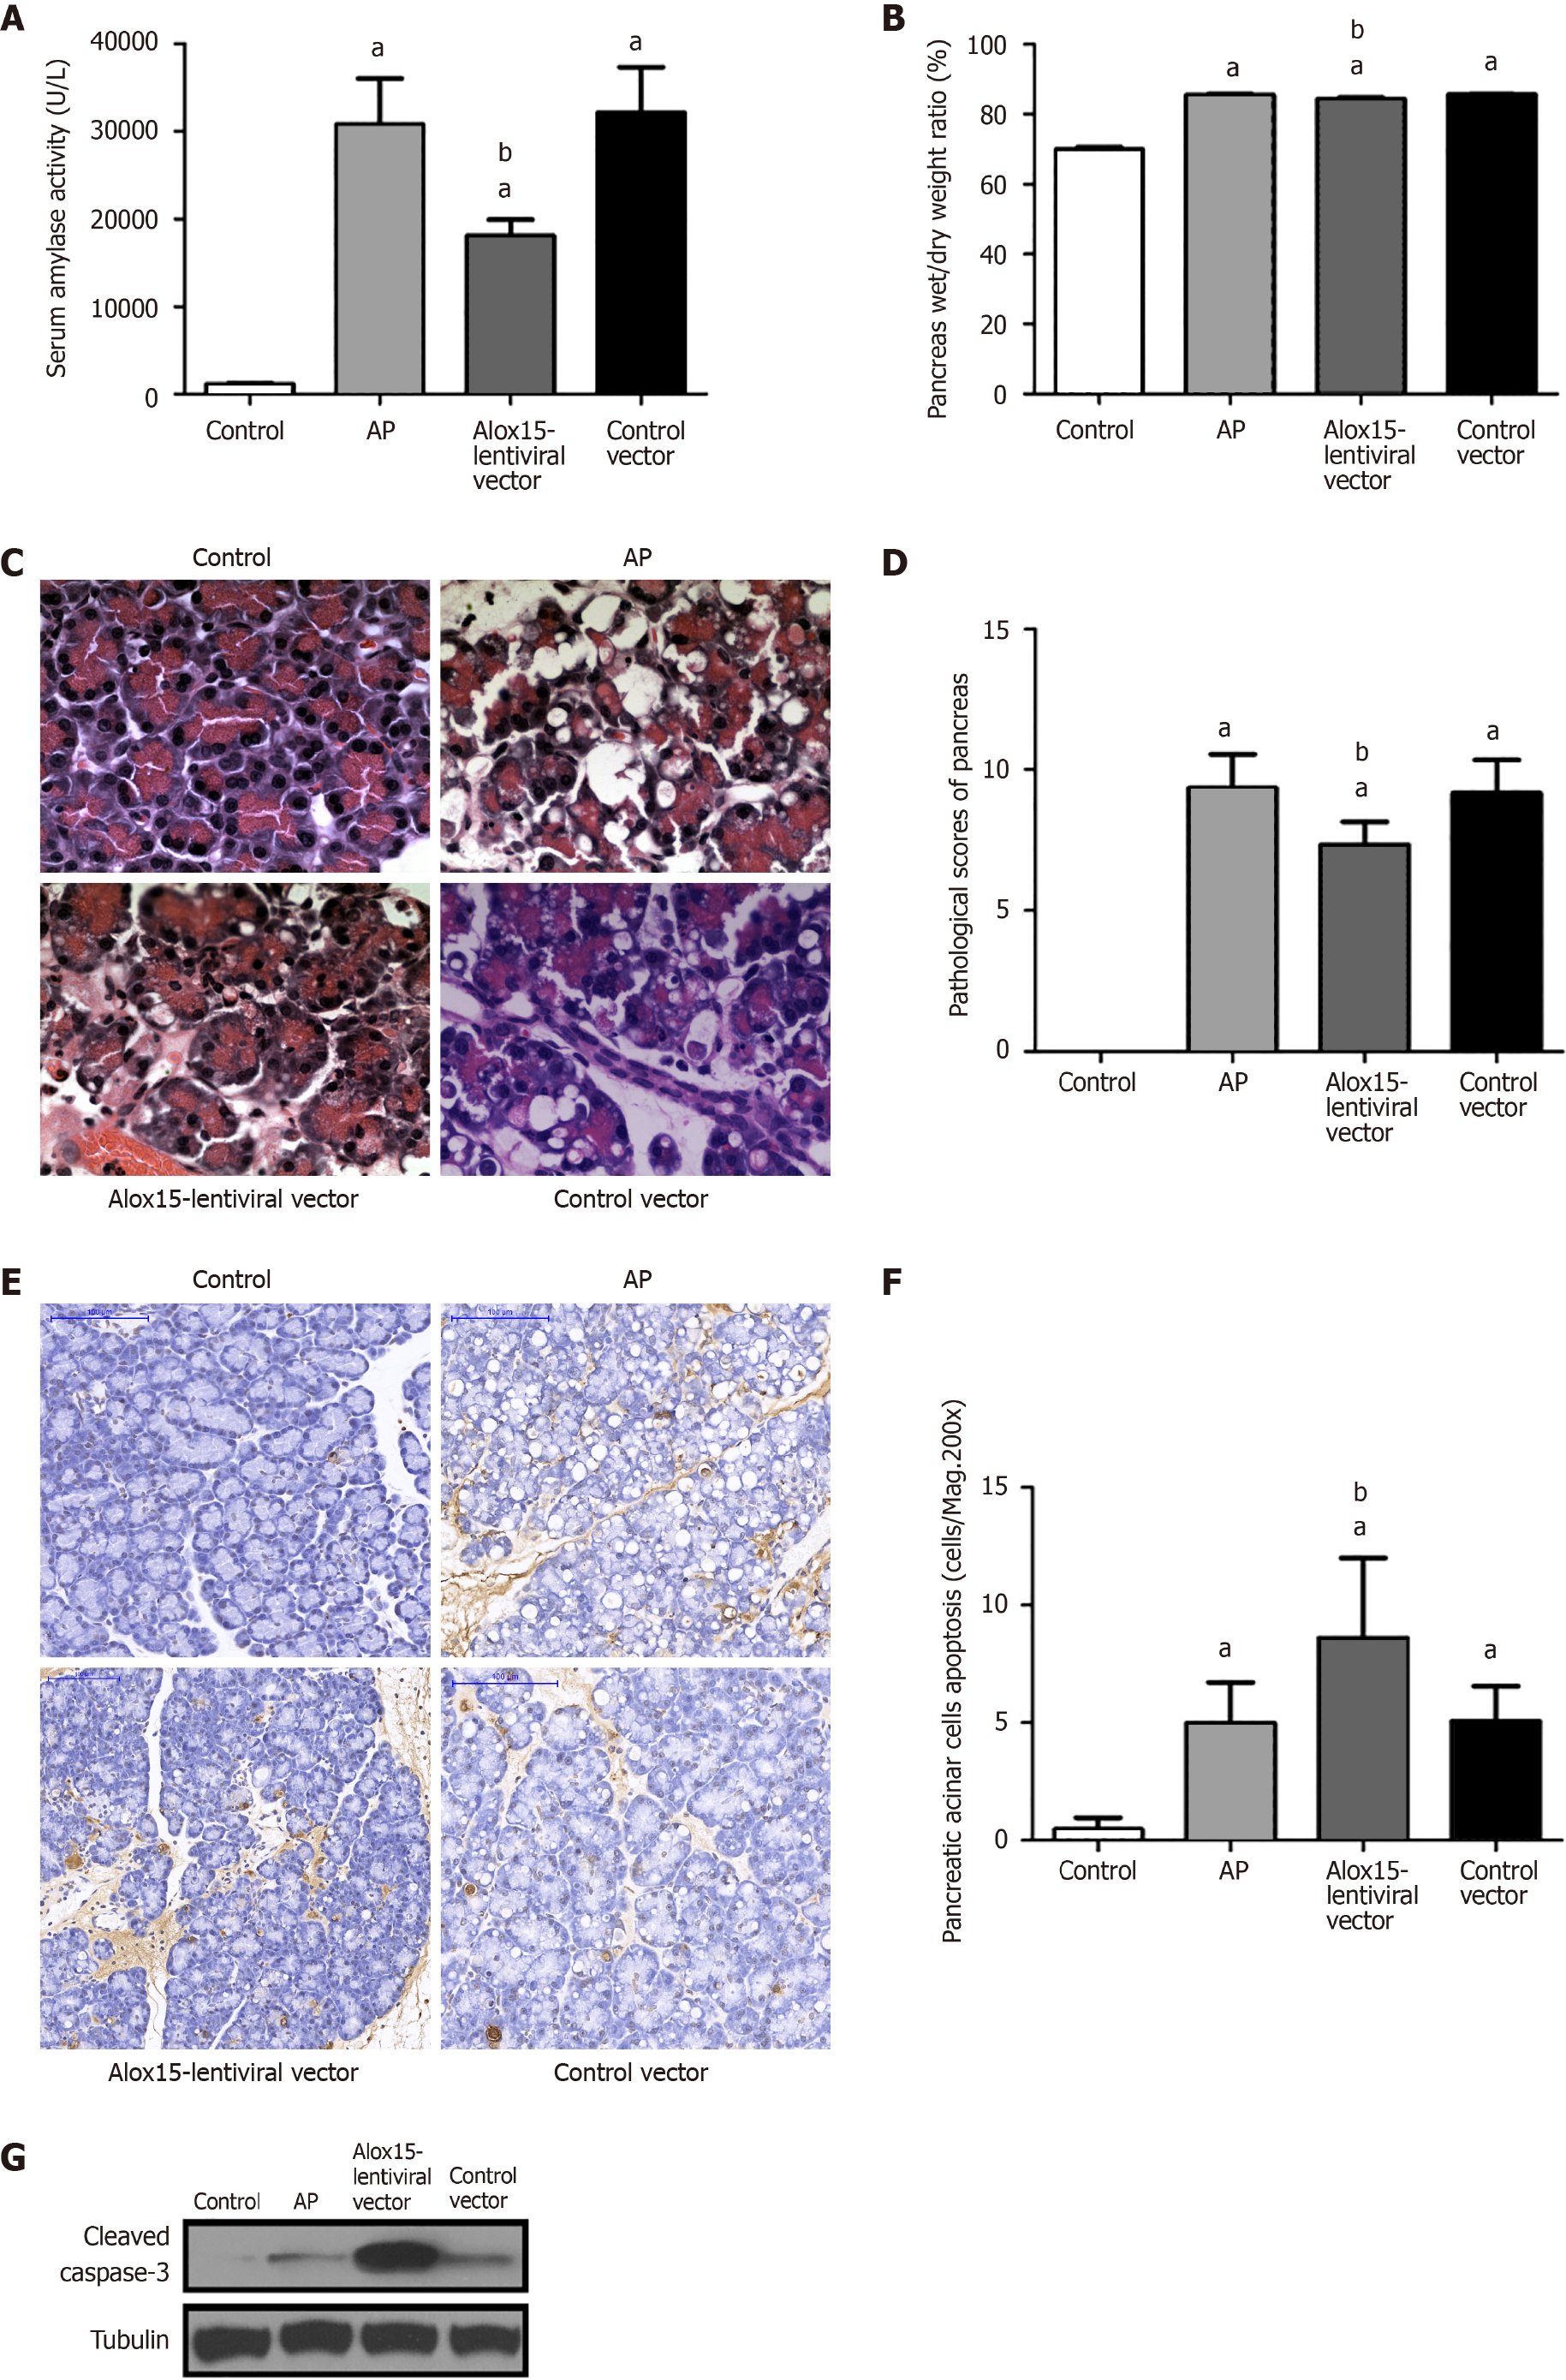
Figure 3 Expression of Alox15 attenuates cerulein-induced acute pancreatitis.
A: Serum amylase activity; B: Wet/dry weight ratio of pancreas tissue; C: Pathological changes in the pancreas; D: Pathological scores of the pancreas; E: TUNEL assay of pancreatic acinar cells apoptosis, the scale bar represents 100 μm; F: Microscopic quantitation of pancreatic acinar cells apoptosis (under a magnification 200 ×); G: Western blot analysis of cleaved caspase-3 in the pancreas tissue. Differences were assessed using one-way ANOVA and multiple comparisons were determined using Games-Howell test. aP < 0.05 vs the control group; bP < 0.05 the Alox15-lentiviral vector group vs the control vector group.
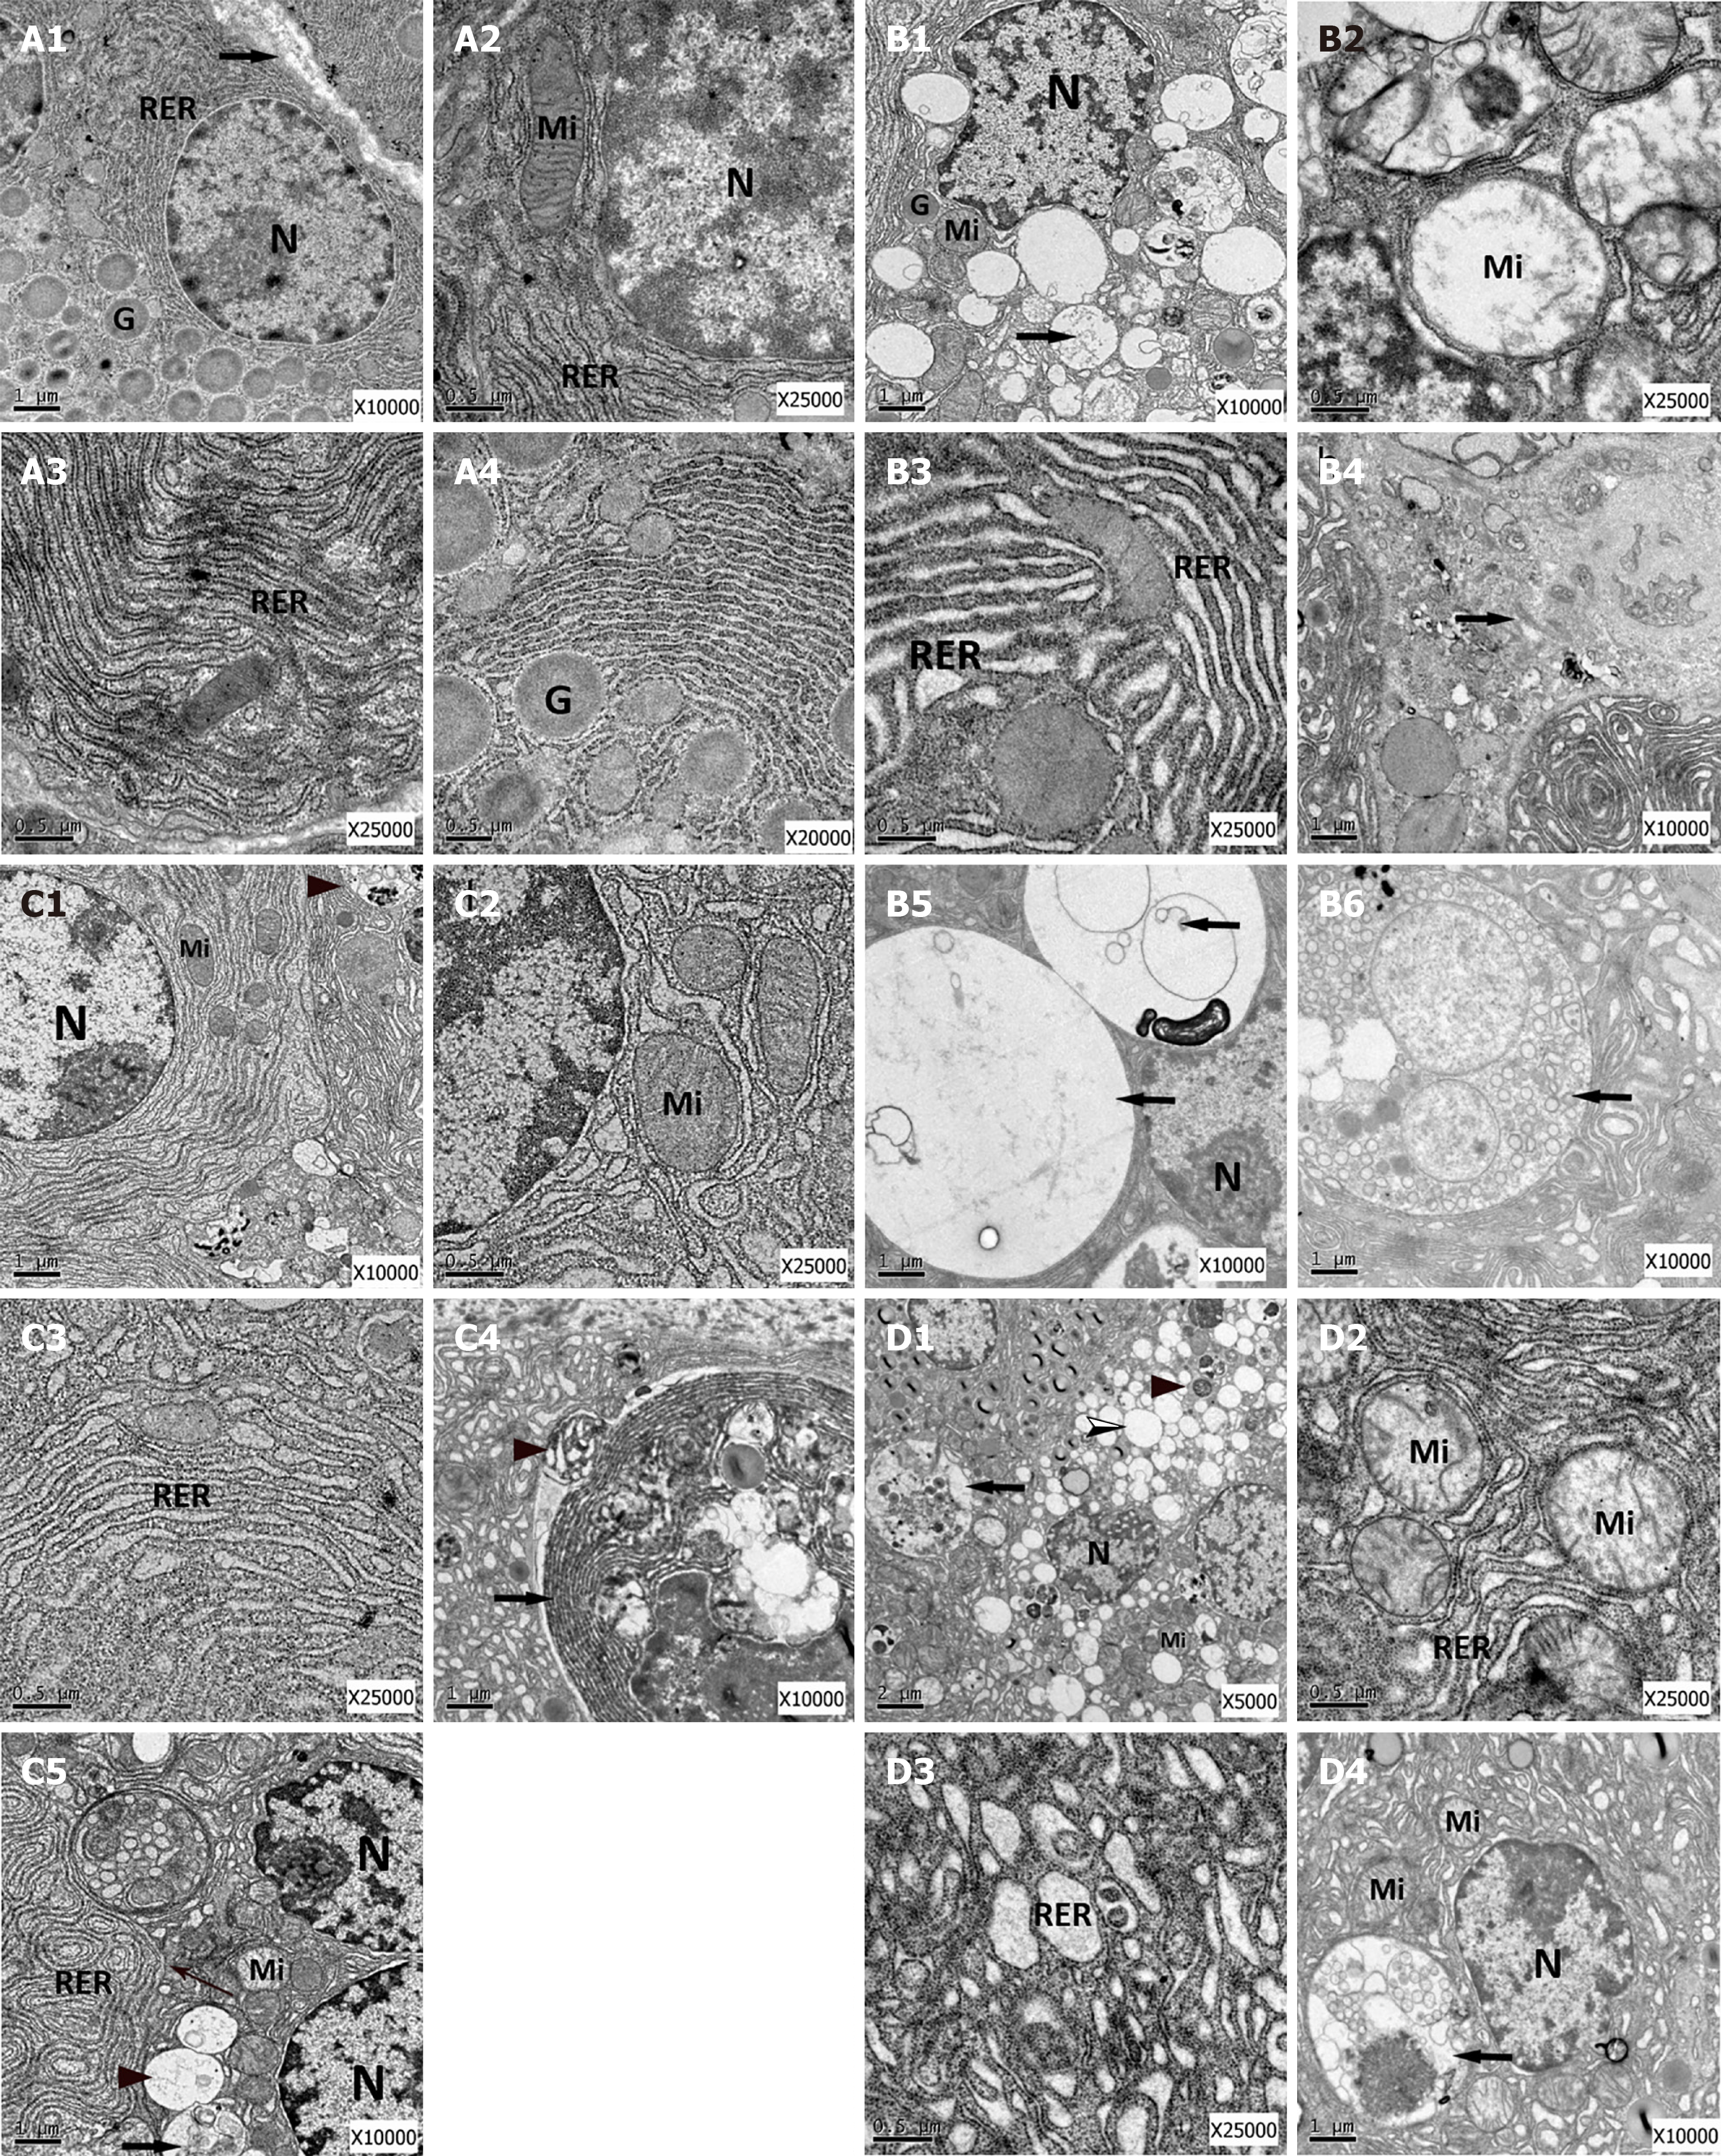
Figure 4 Transmission electron micrographs of the pancreas from the different groups key: Nucleus, mitochondria, zymogen granule, rough endoplasmic reticulum.
A: The control group. The pancreatic acinar cell showed a standard acinar cellular architecture with a round nucleus located and zymogen granules oriented toward the apical cell membrane. The depth of the cytoplasm was filled with the rough endoplasmic reticulum (RER). The intercellular space between the healthy pancreatic acinar cells was found to be tightly packed together (→) (scale bar = 1 um). The mitochondria were observed with recognizable cristae (scale bar = 0.5 um). The cytoplasm was filled with the RER with ribosomes attached on the surface, which were abundant in free ribosomes (scale bar = 0.5 um). There were many mature zymogen granules which were mainly high in density and spherical in shape (scale bar = 0.5 um); B: The acute pancreatitis group. The pancreatic acinar cell was smaller in size and showed mild pyknosis of the nucleus. Zymogen granules were significantly reduced. Autophagic vacuoles and autolysosomes (→) were present (scale bar = 1 um). The mitochondria were swollen, containing a disruption of cristae (scale bar = 0.5 um). Most of the RER showed a loss of regular pattern to dilated irregular sacs which were accompanied by some reduced numbers of attached ribosomes (scale bar = 0.5 um). Individual of pancreatic acinar cells showed necrosis (→) (scale bar = 1 um). Large autophagic vacuoles were present. Big autophagosome was observed in the cytoplasm (→) (scale bar = 1 um); C: The Alox15-lentiviral vector group. The pancreatic acinar cell showed minor pyknosis of the nucleus. Small autolysosome was present (▶) (scale bar = 1 um). The mitochondria exhibited slight swelling, and the cristae appeared partly disrupted (scale bar = 0.5 um). The RER in contrast to the control vector group (Figure 3B-G), did not show extensive dilatation (scale bar = 0.5 um). Apoptotic cell (→) and apoptosis body (▶) of the pancreatic acinar cell were present (scale bar = 1 um). Small autophagosome (↖), small autolysosome (→), and small autophagic vacuole (▶) were observed in the cytoplasm (scale bar = 1 um); D: The vector control group. Transmission electron micrographs of the pancreatic acinar cell were disorganized and were smaller in size. Nucleus exhibited mild pyknosis. Abundant autolysosome (→), autophagic vacuoles (➢) and secondary lysosome (▶) were present in the cytoplasm (scale bar = 2 um). The mitochondria were swollen, containing disrupted cristae (scale bar = 0.5 um). The RER showed dilation, some dilated to irregular sacs (scale bar = 0.5 um). Large autophagic vacuoles were present (→). (scale bar = 1 um). N: Nucleus; Mi: Mitochondria; G: Zymogen granule; RER: Rough endoplasmic reticulum.
- Citation: Sun HW, Bai YY, Qin ZL, Li RZ, Madzikatire TB, Akuetteh PDP, Li Q, Kong HR, Jin YP. Transfection of 12/15-lipoxygenase effectively alleviates inflammatory responses during experimental acute pancreatitis. World J Gastroenterol 2024; 30(42): 4544-4556
- URL: https://www.wjgnet.com/1007-9327/full/v30/i42/4544.htm
- DOI: https://dx.doi.org/10.3748/wjg.v30.i42.4544


