Copyright
©The Author(s) 2024.
World J Gastroenterol. Nov 7, 2024; 30(41): 4461-4480
Published online Nov 7, 2024. doi: 10.3748/wjg.v30.i41.4461
Published online Nov 7, 2024. doi: 10.3748/wjg.v30.i41.4461
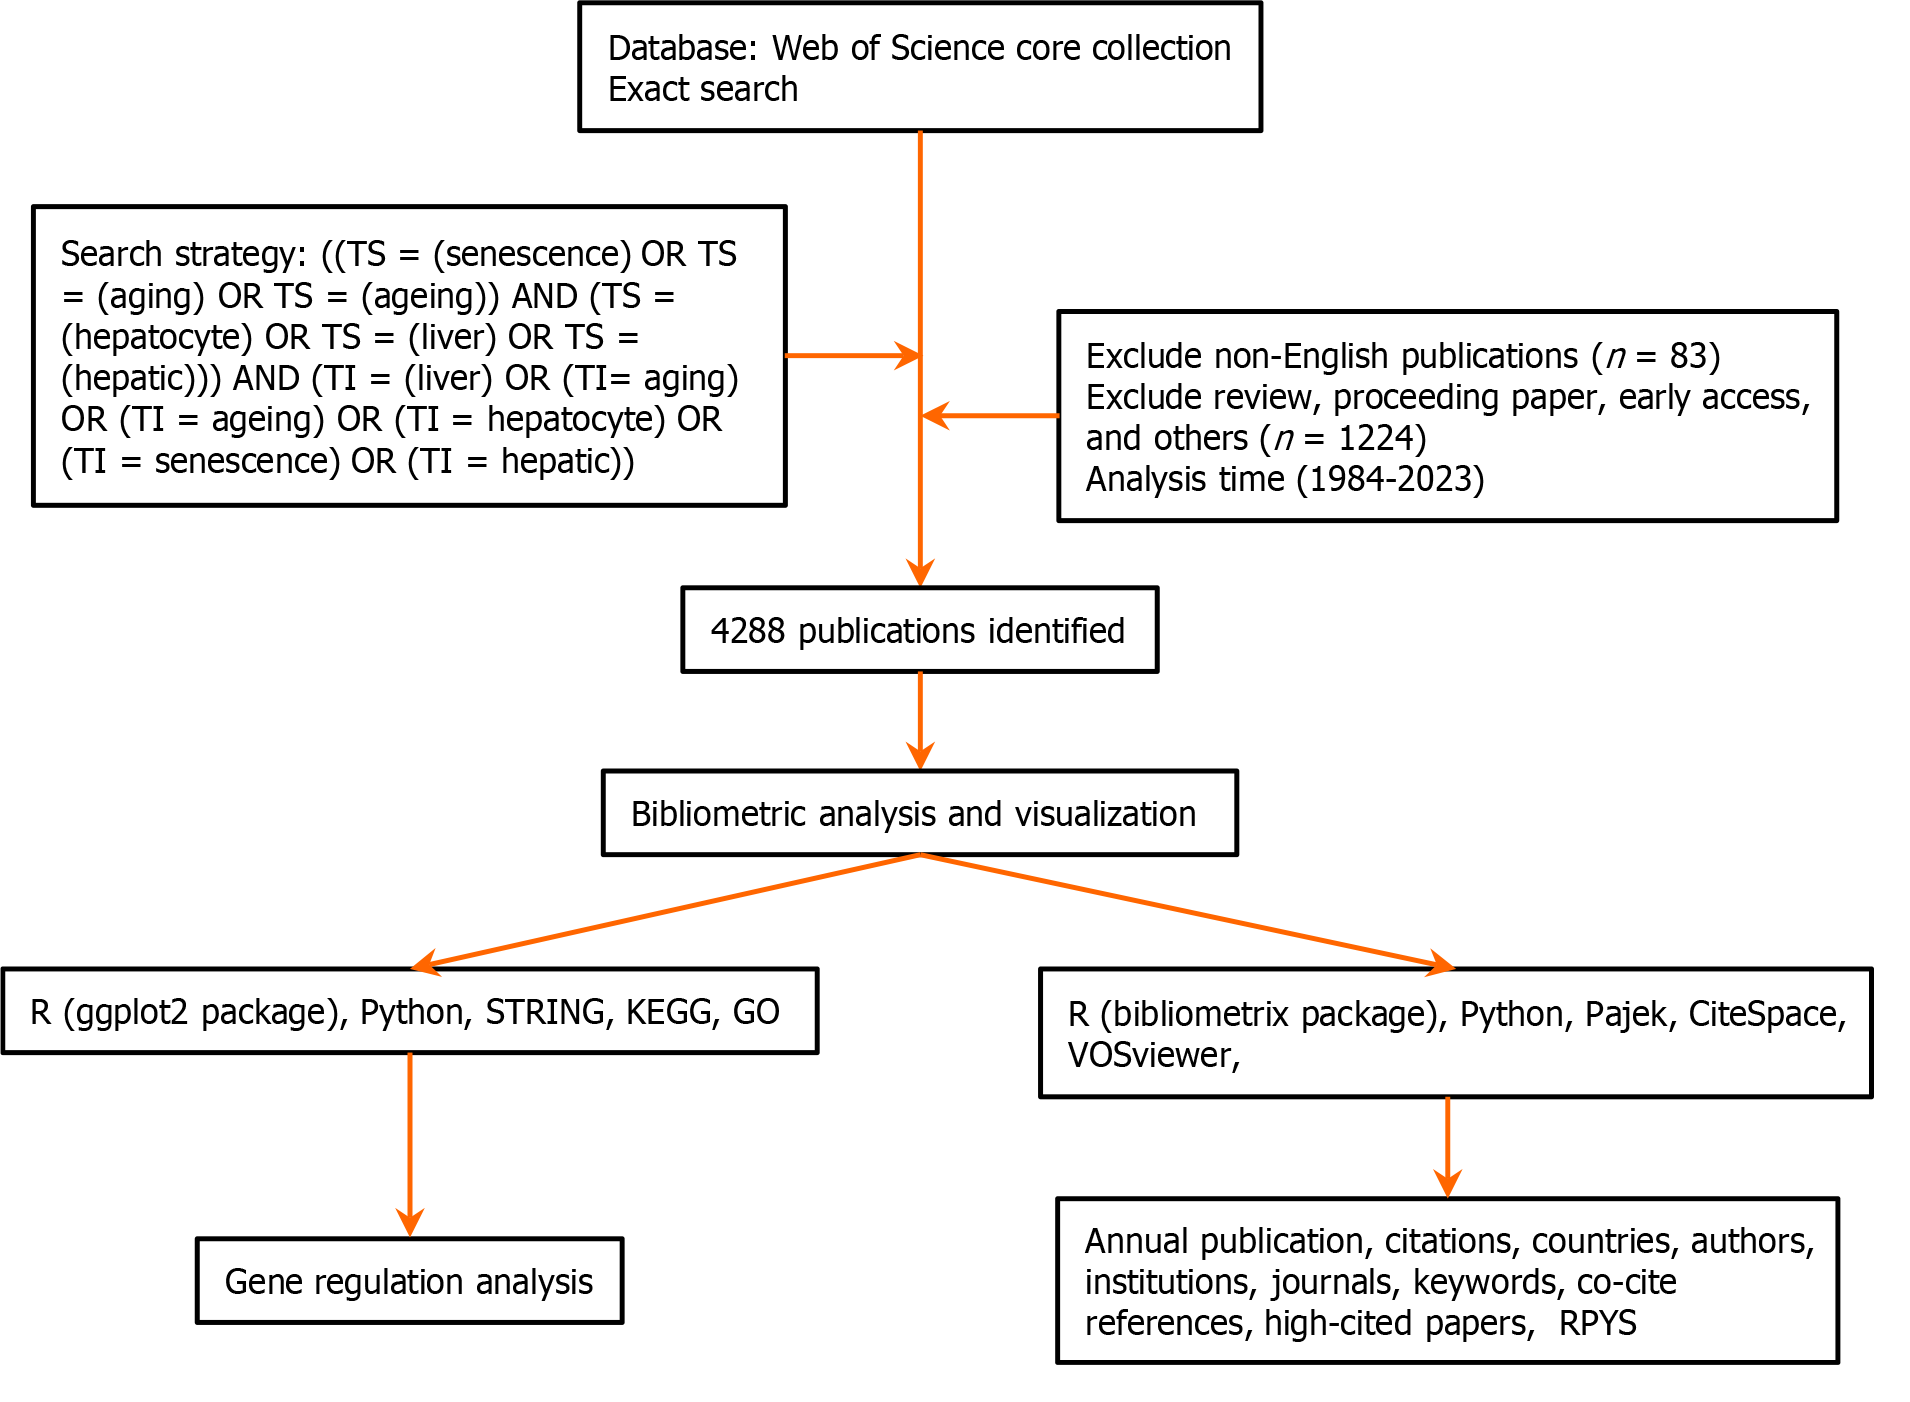
Figure 1 Detailed flowchart of the search strategy for screening publications.
KEGG: Kyoto Encyclopedia of Genes Genomes; GO: Gene Ontology; RPYS: Reference publication year spectroscopy.
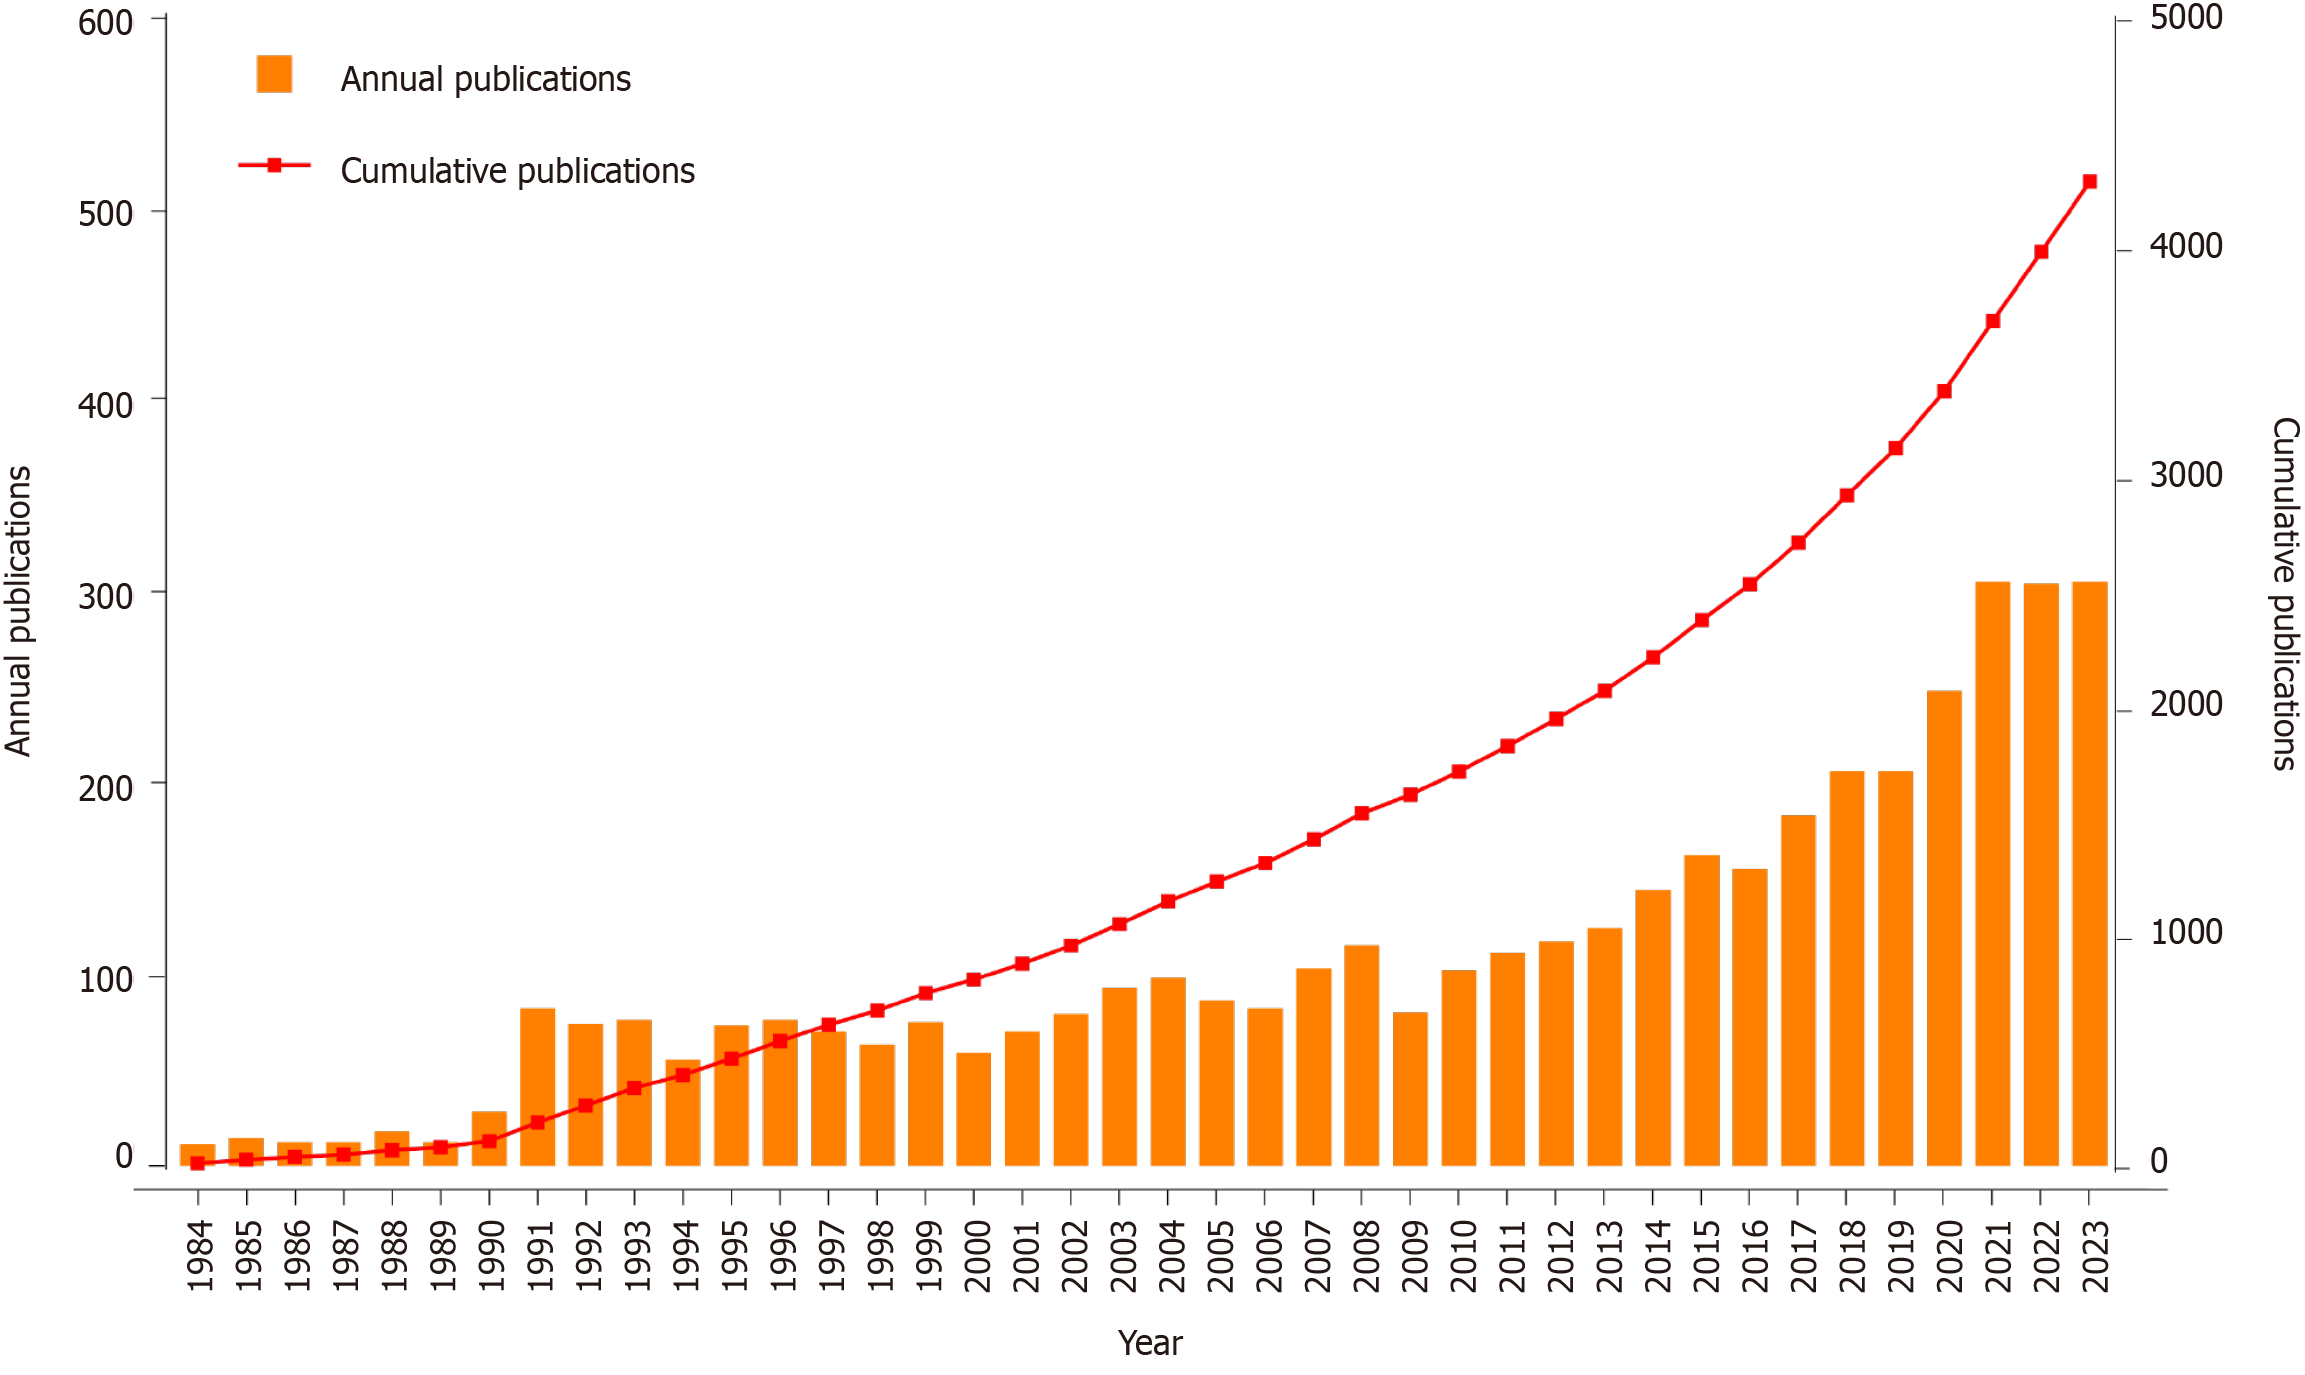
Figure 2
The annual number and the cumulative publications from 1984-2023.
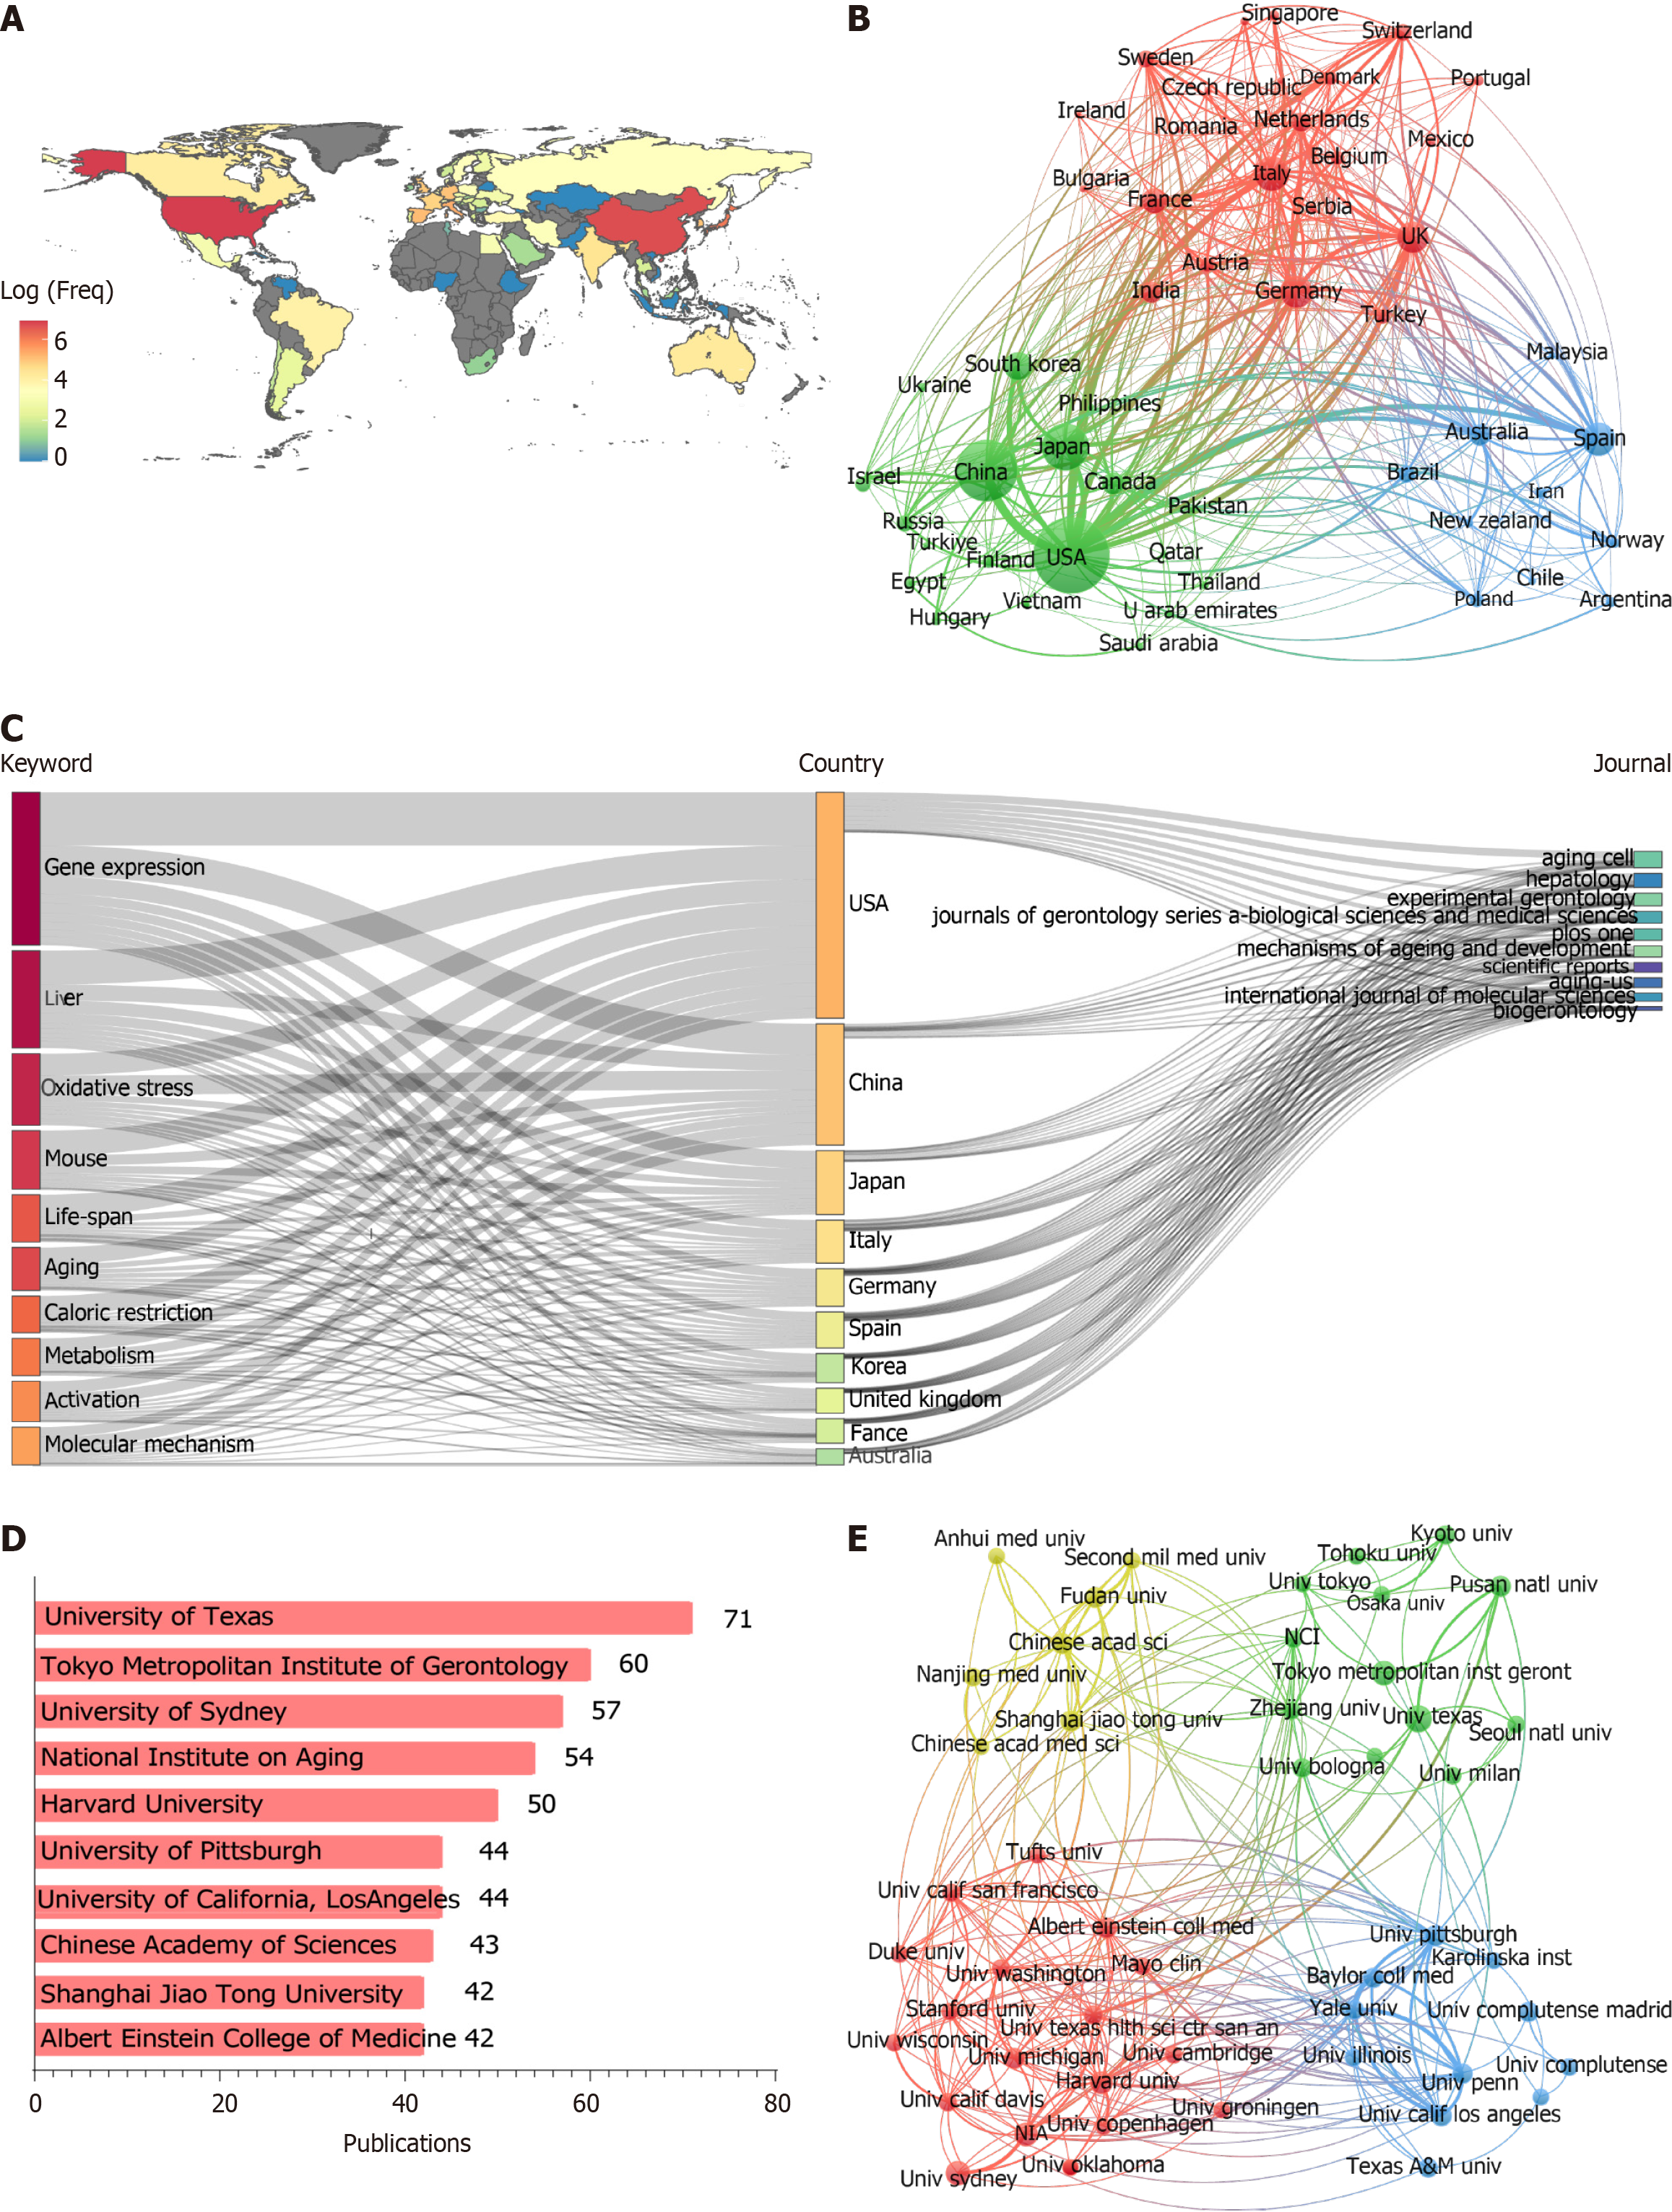
Figure 3 Analysis of publications by country and institution.
A: The distribution of countries (log-transformed scale of article count); B: Network maps showing countries involved in the research on liver aging, the size of the node indicates the number of papers; C: Three-field plot of keyword, countries and journals; D: The top 10 institutions ranked by publication count; E: Network maps of 49 institutions with at least 25 articles published in liver aging research. The node size represents the number of articles.
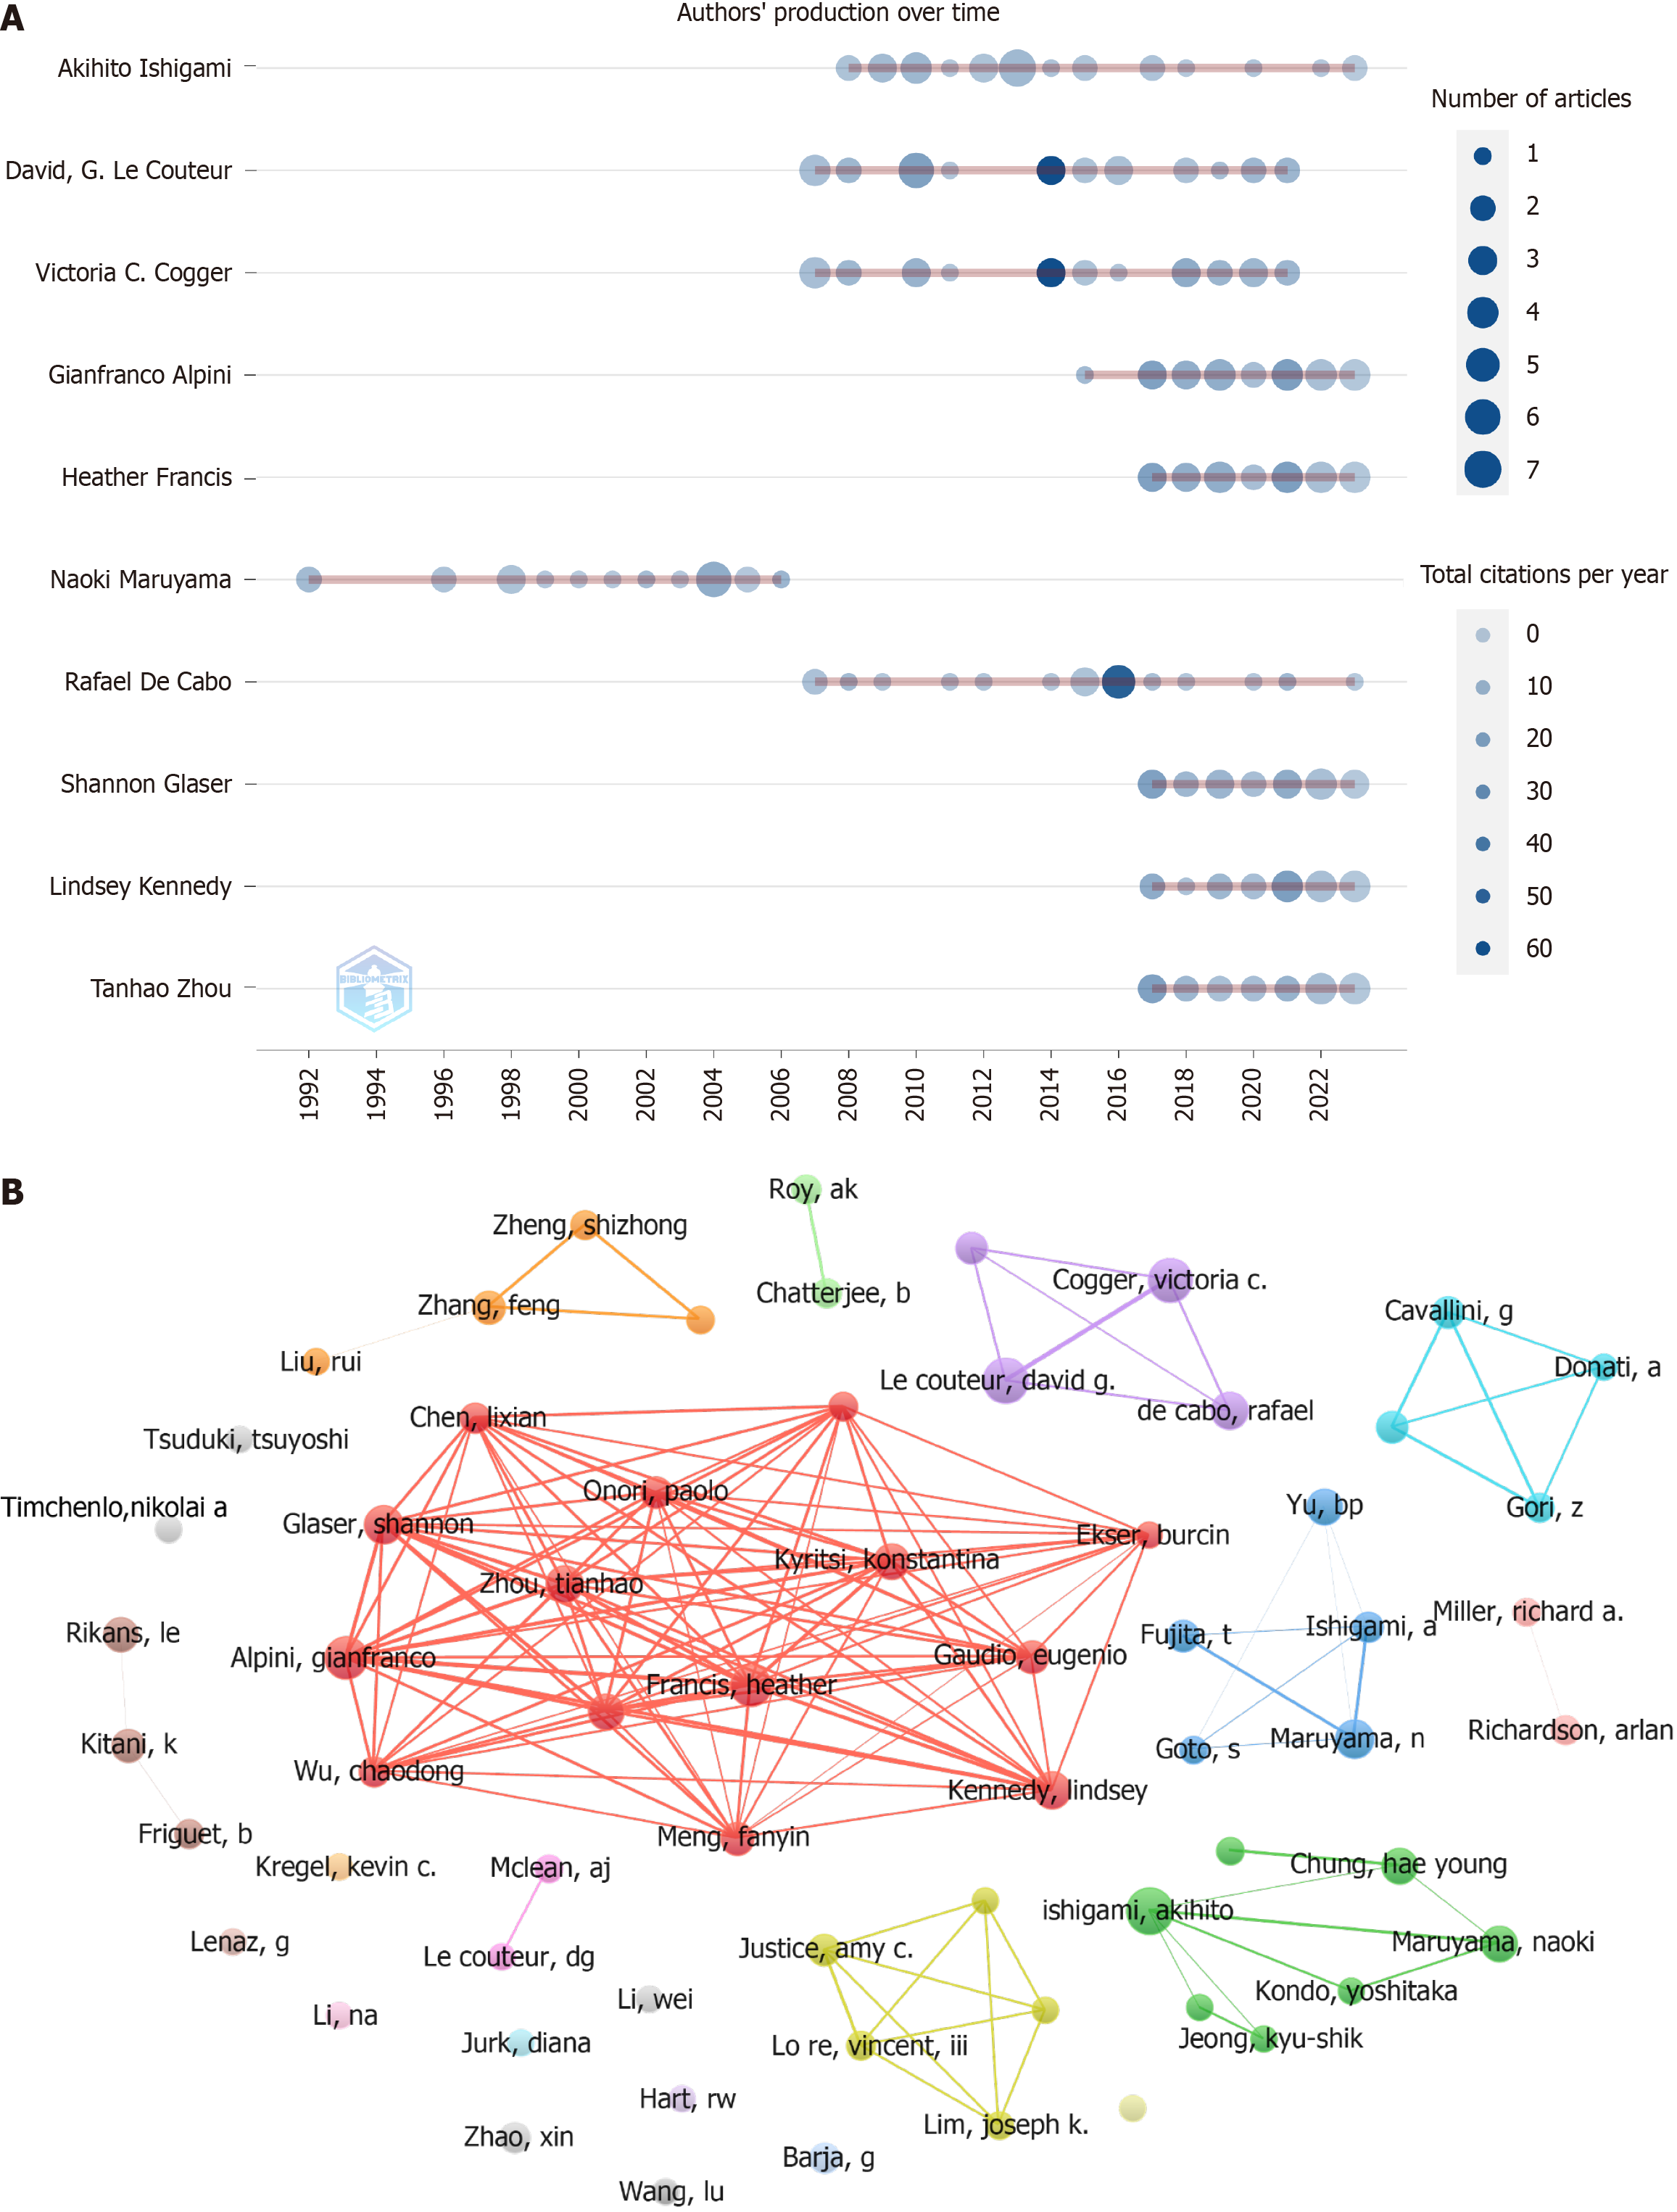
Figure 4 Authorship analysis in liver aging research.
A: Annual publication trends of the top 10 most prolific authors; B: Co-authorship network map of 65 authors, each with a minimum of 10 articles in liver aging research. The node size indicates the number of articles.
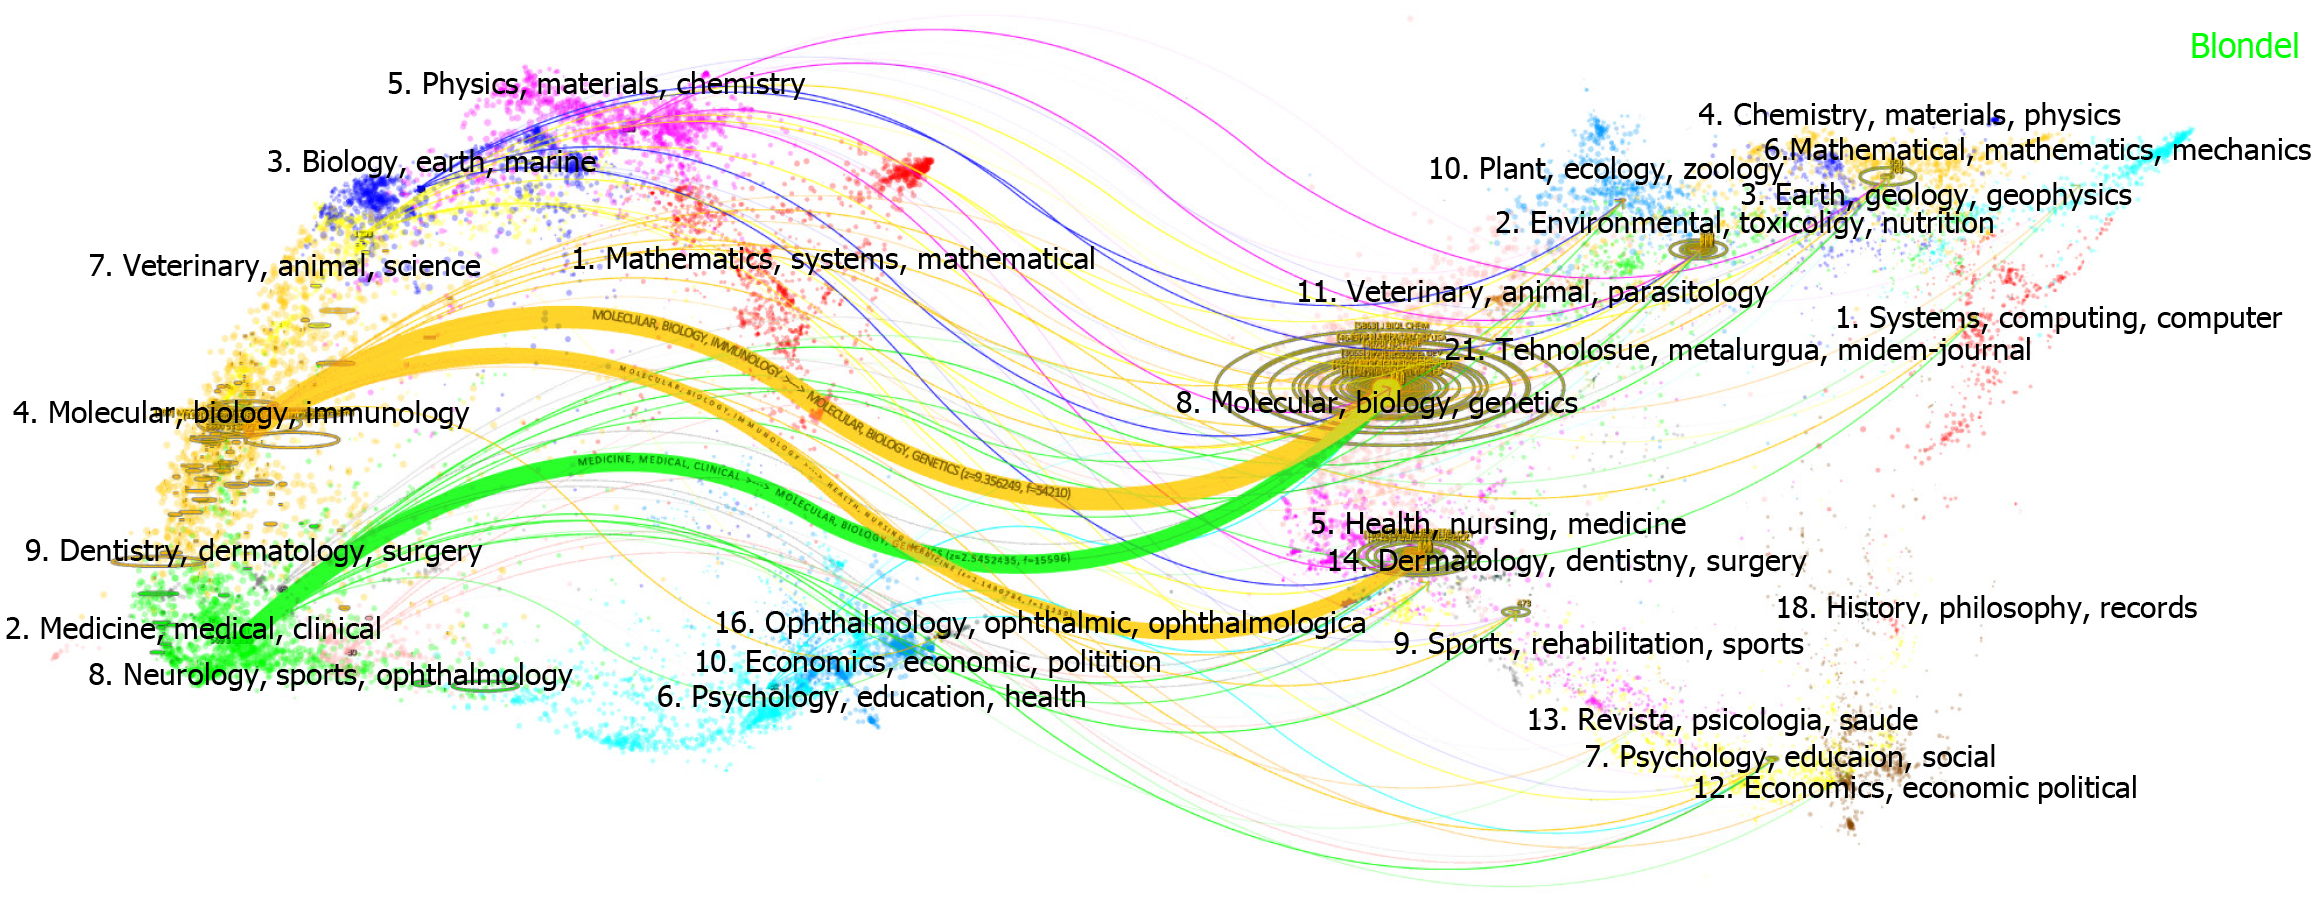
Figure 5 Dual-map overlay of journals in liver aging research.
The left side represents the citing journals and the right side represents the cited journals, and the lines’ hues indicate the different disciplines.
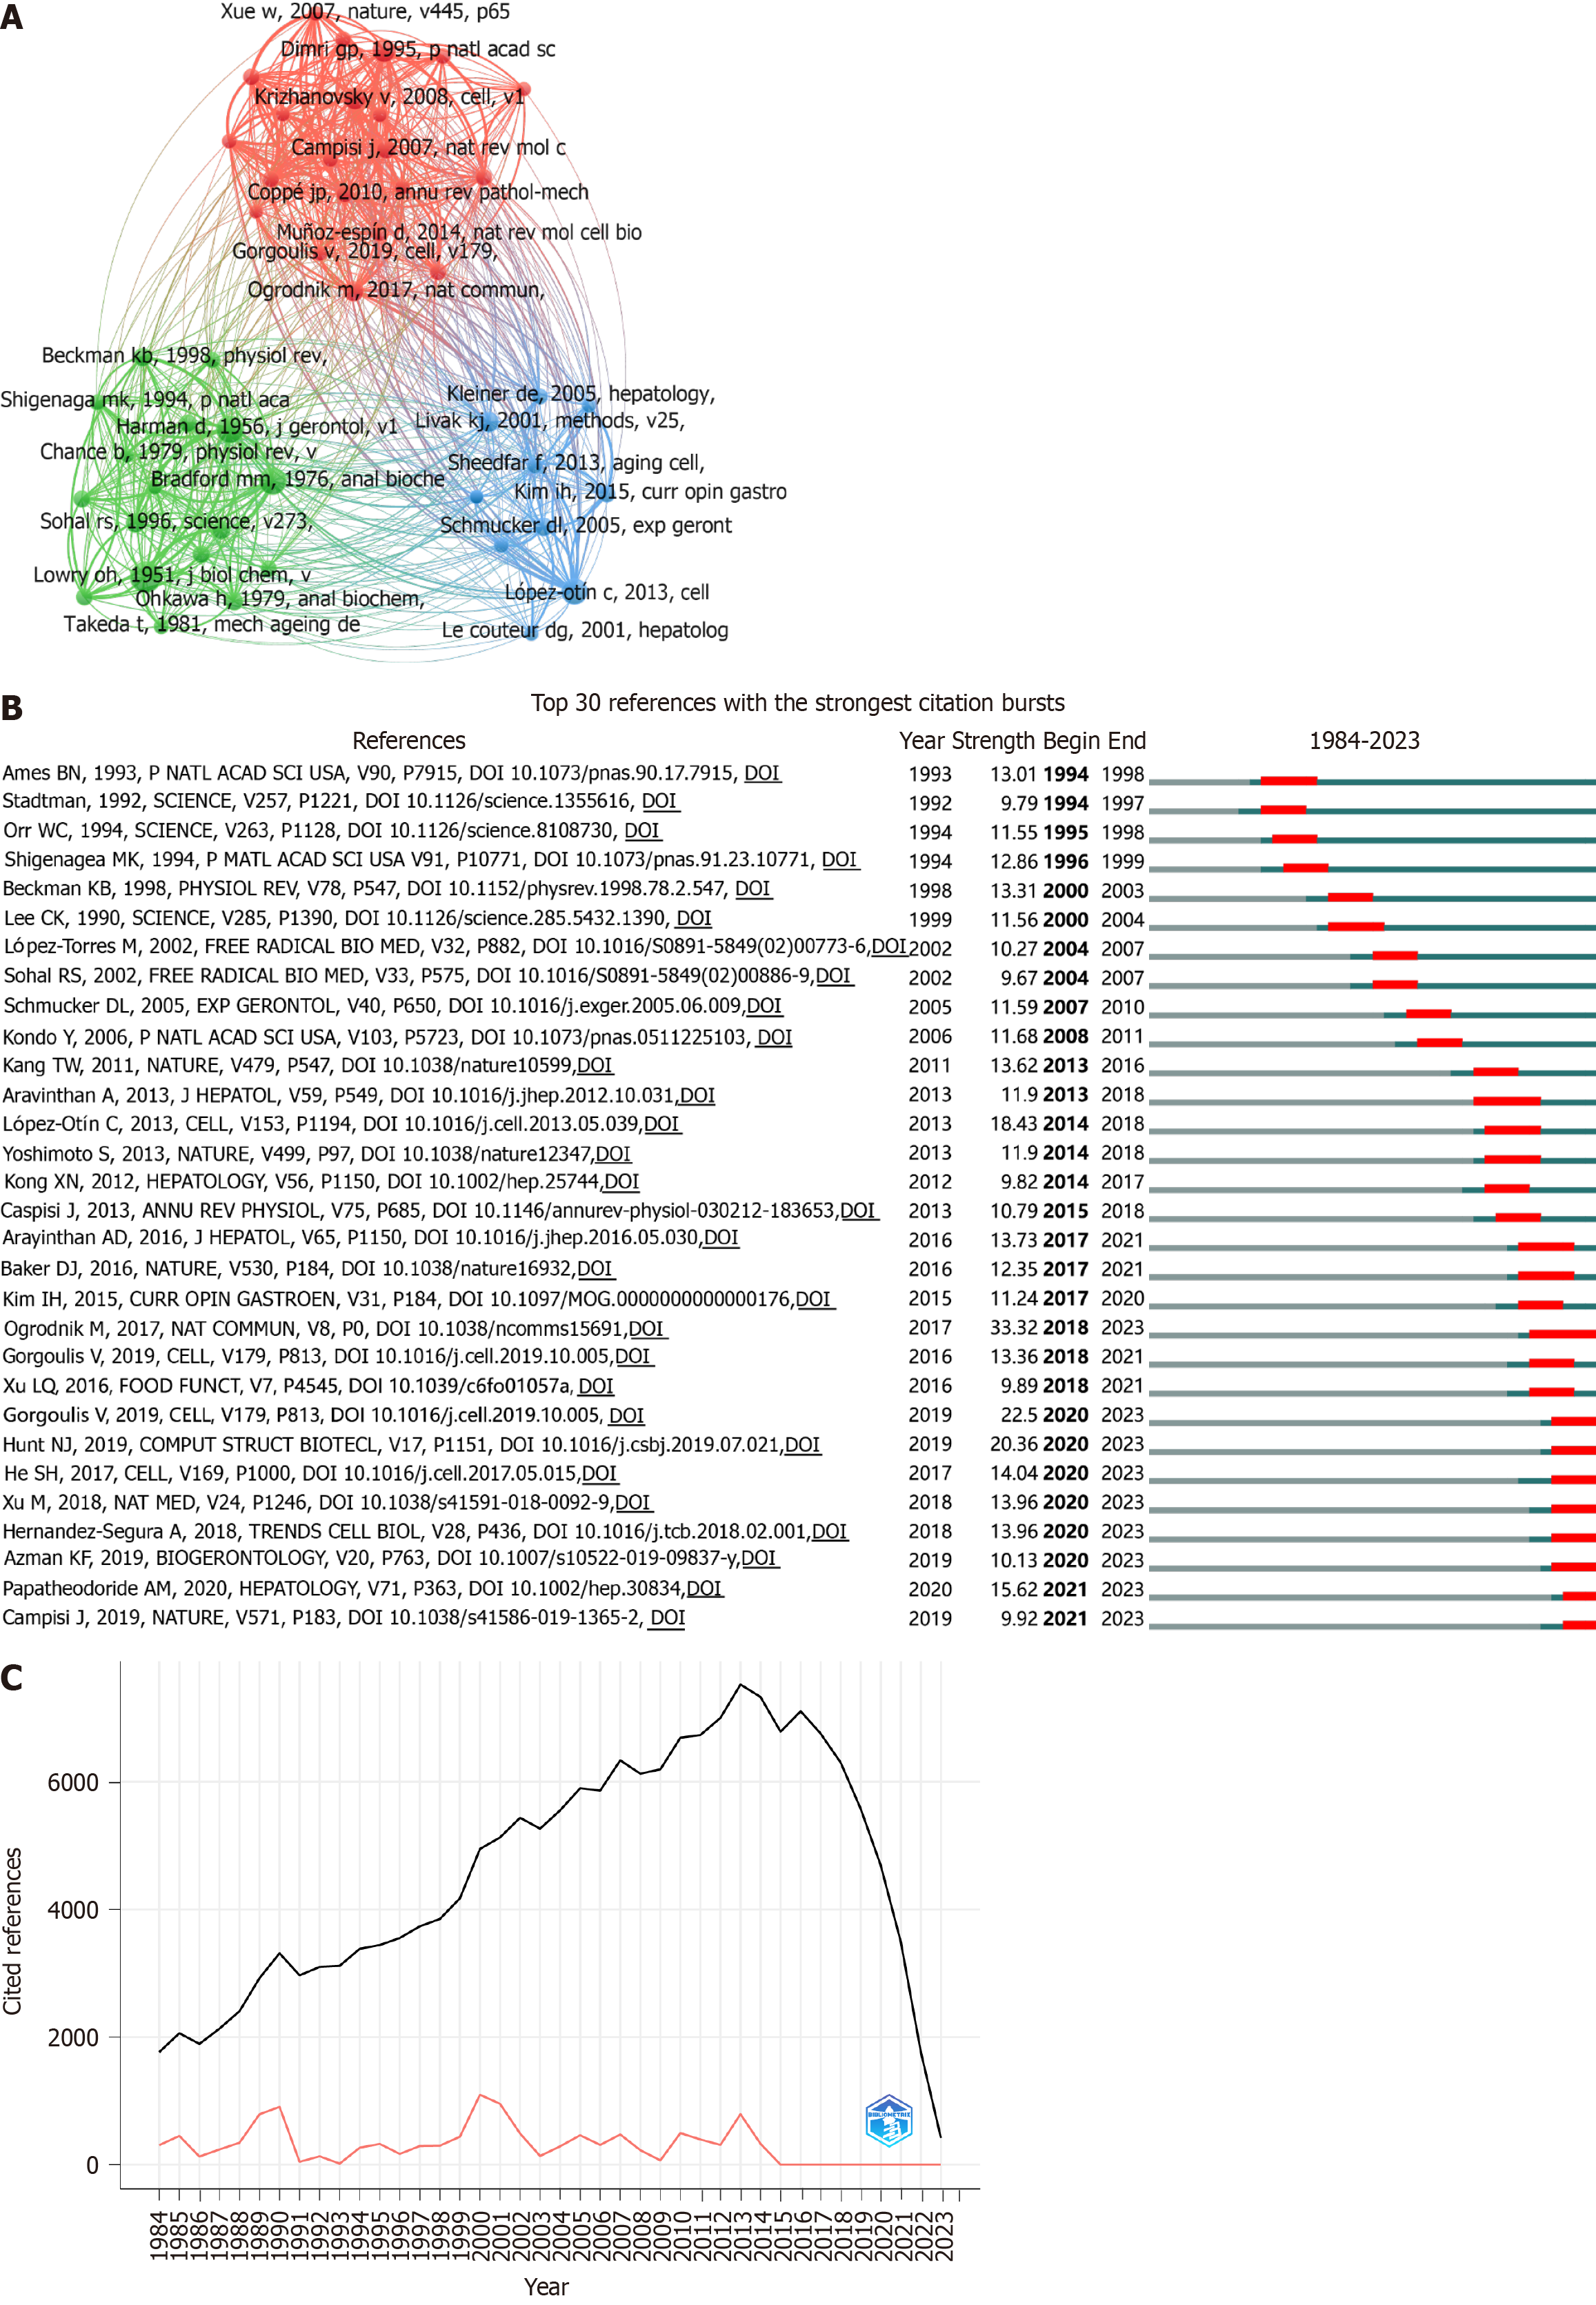
Figure 6 Citation analysis in liver aging research.
A: Network map of the top 48 co-cited references, each cited more than 45 times; B: Top 30 references with the strongest citation bursts, the red segment represents the period of emergence, with burst strength proportional of the segment length; C: Reference publication year spectroscopy (RPYS) revealing three citation peaks in 1990, 2000, and 2013.
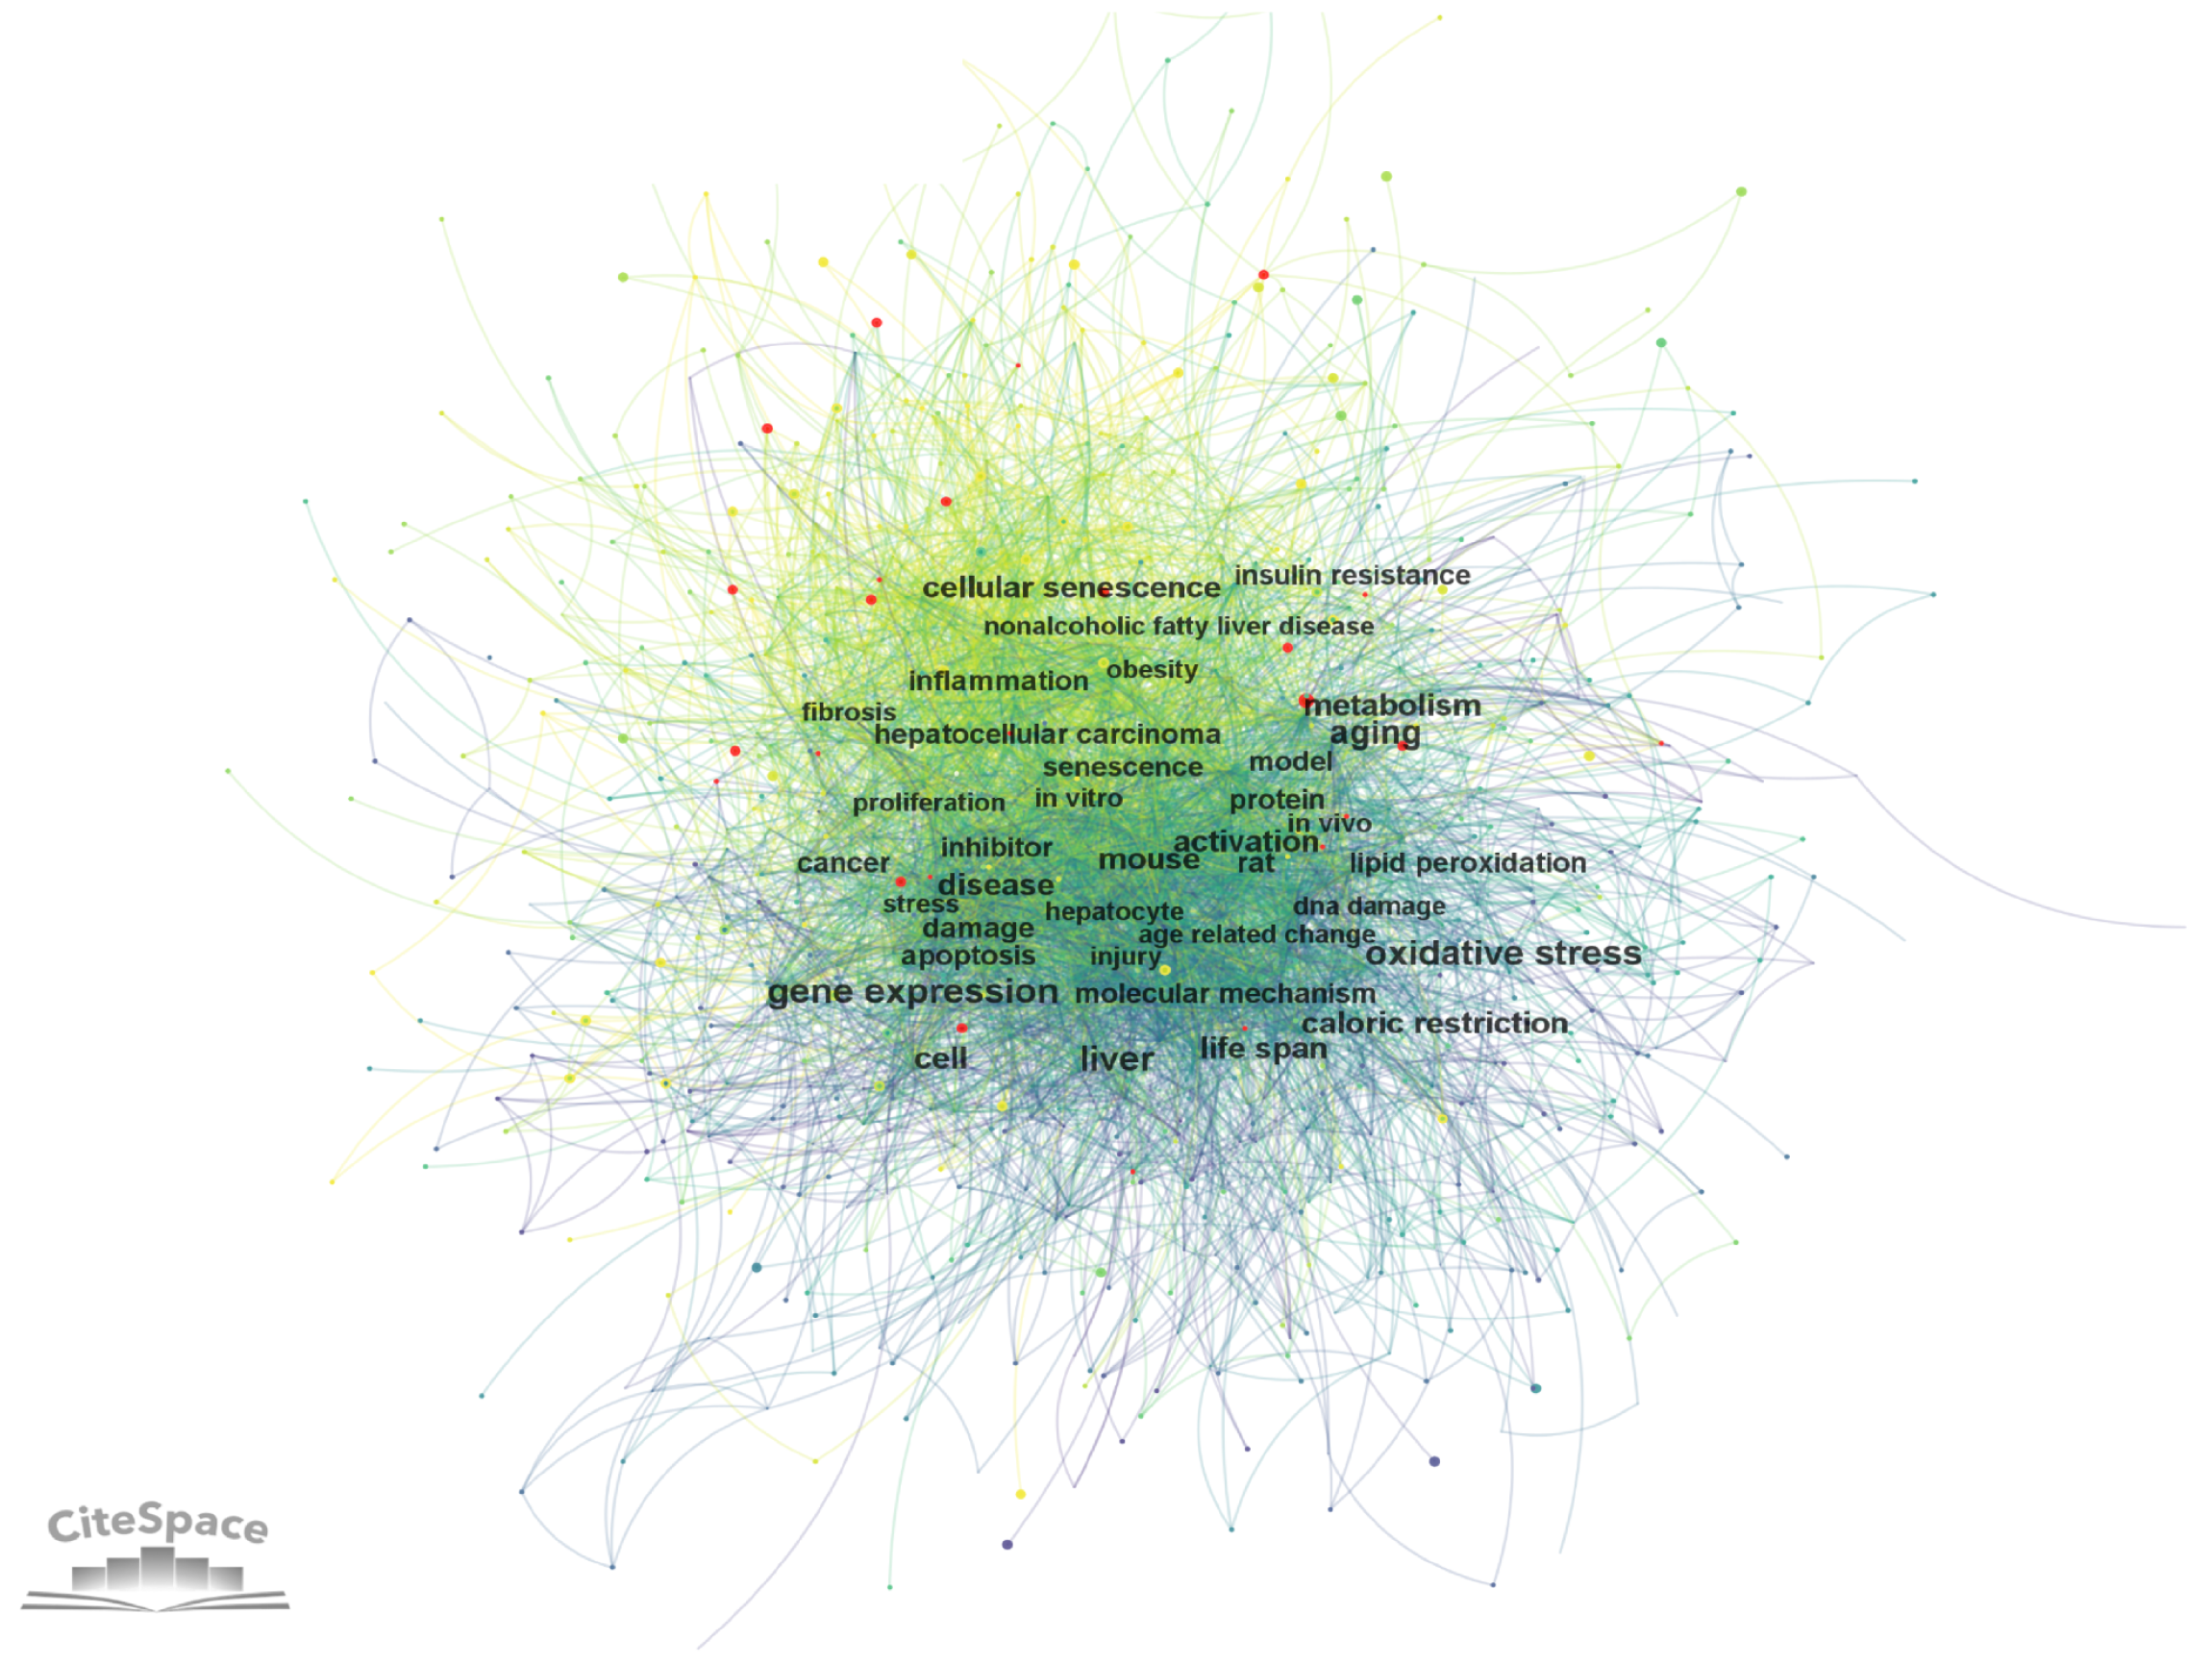
Figure 7
Co-occurrence network of keywords via CiteSpace.
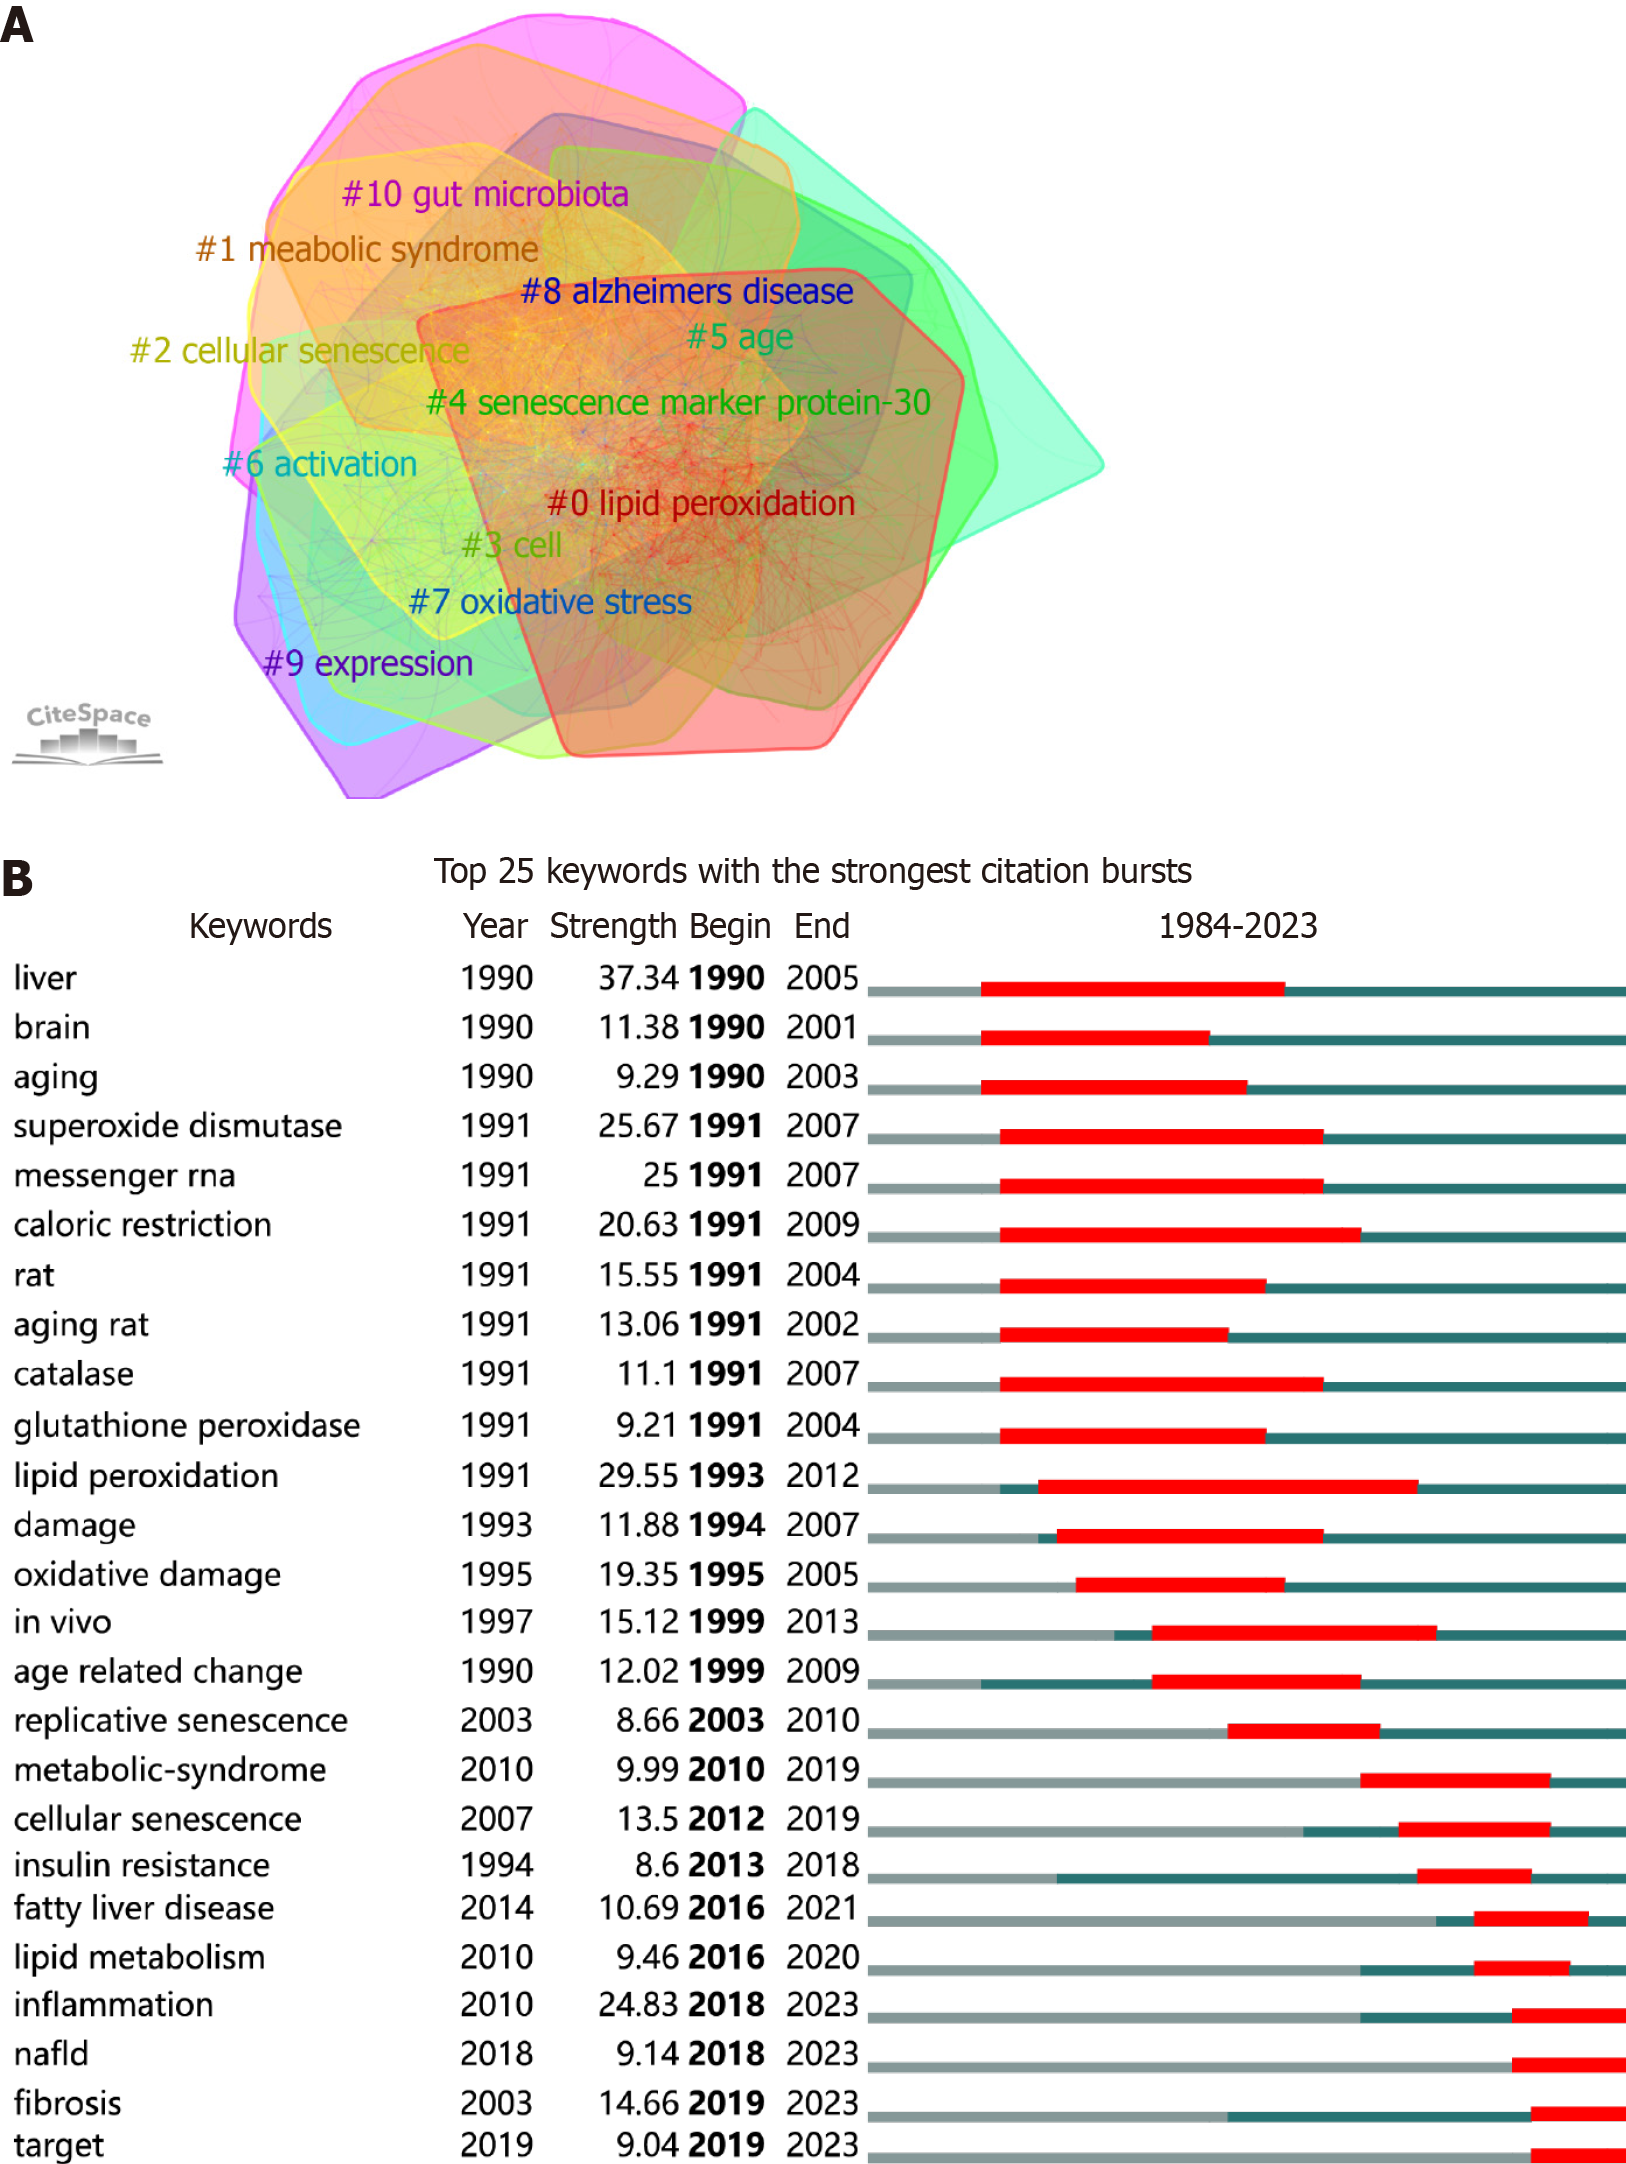
Figure 8 Keyword analysis in liver aging research.
A: Cluster map of keywords via CiteSpace; B: Top 25 keywords with robust citation bursts, the red segment indicates the period of emergence, with the burst strength proportional to the segment length.
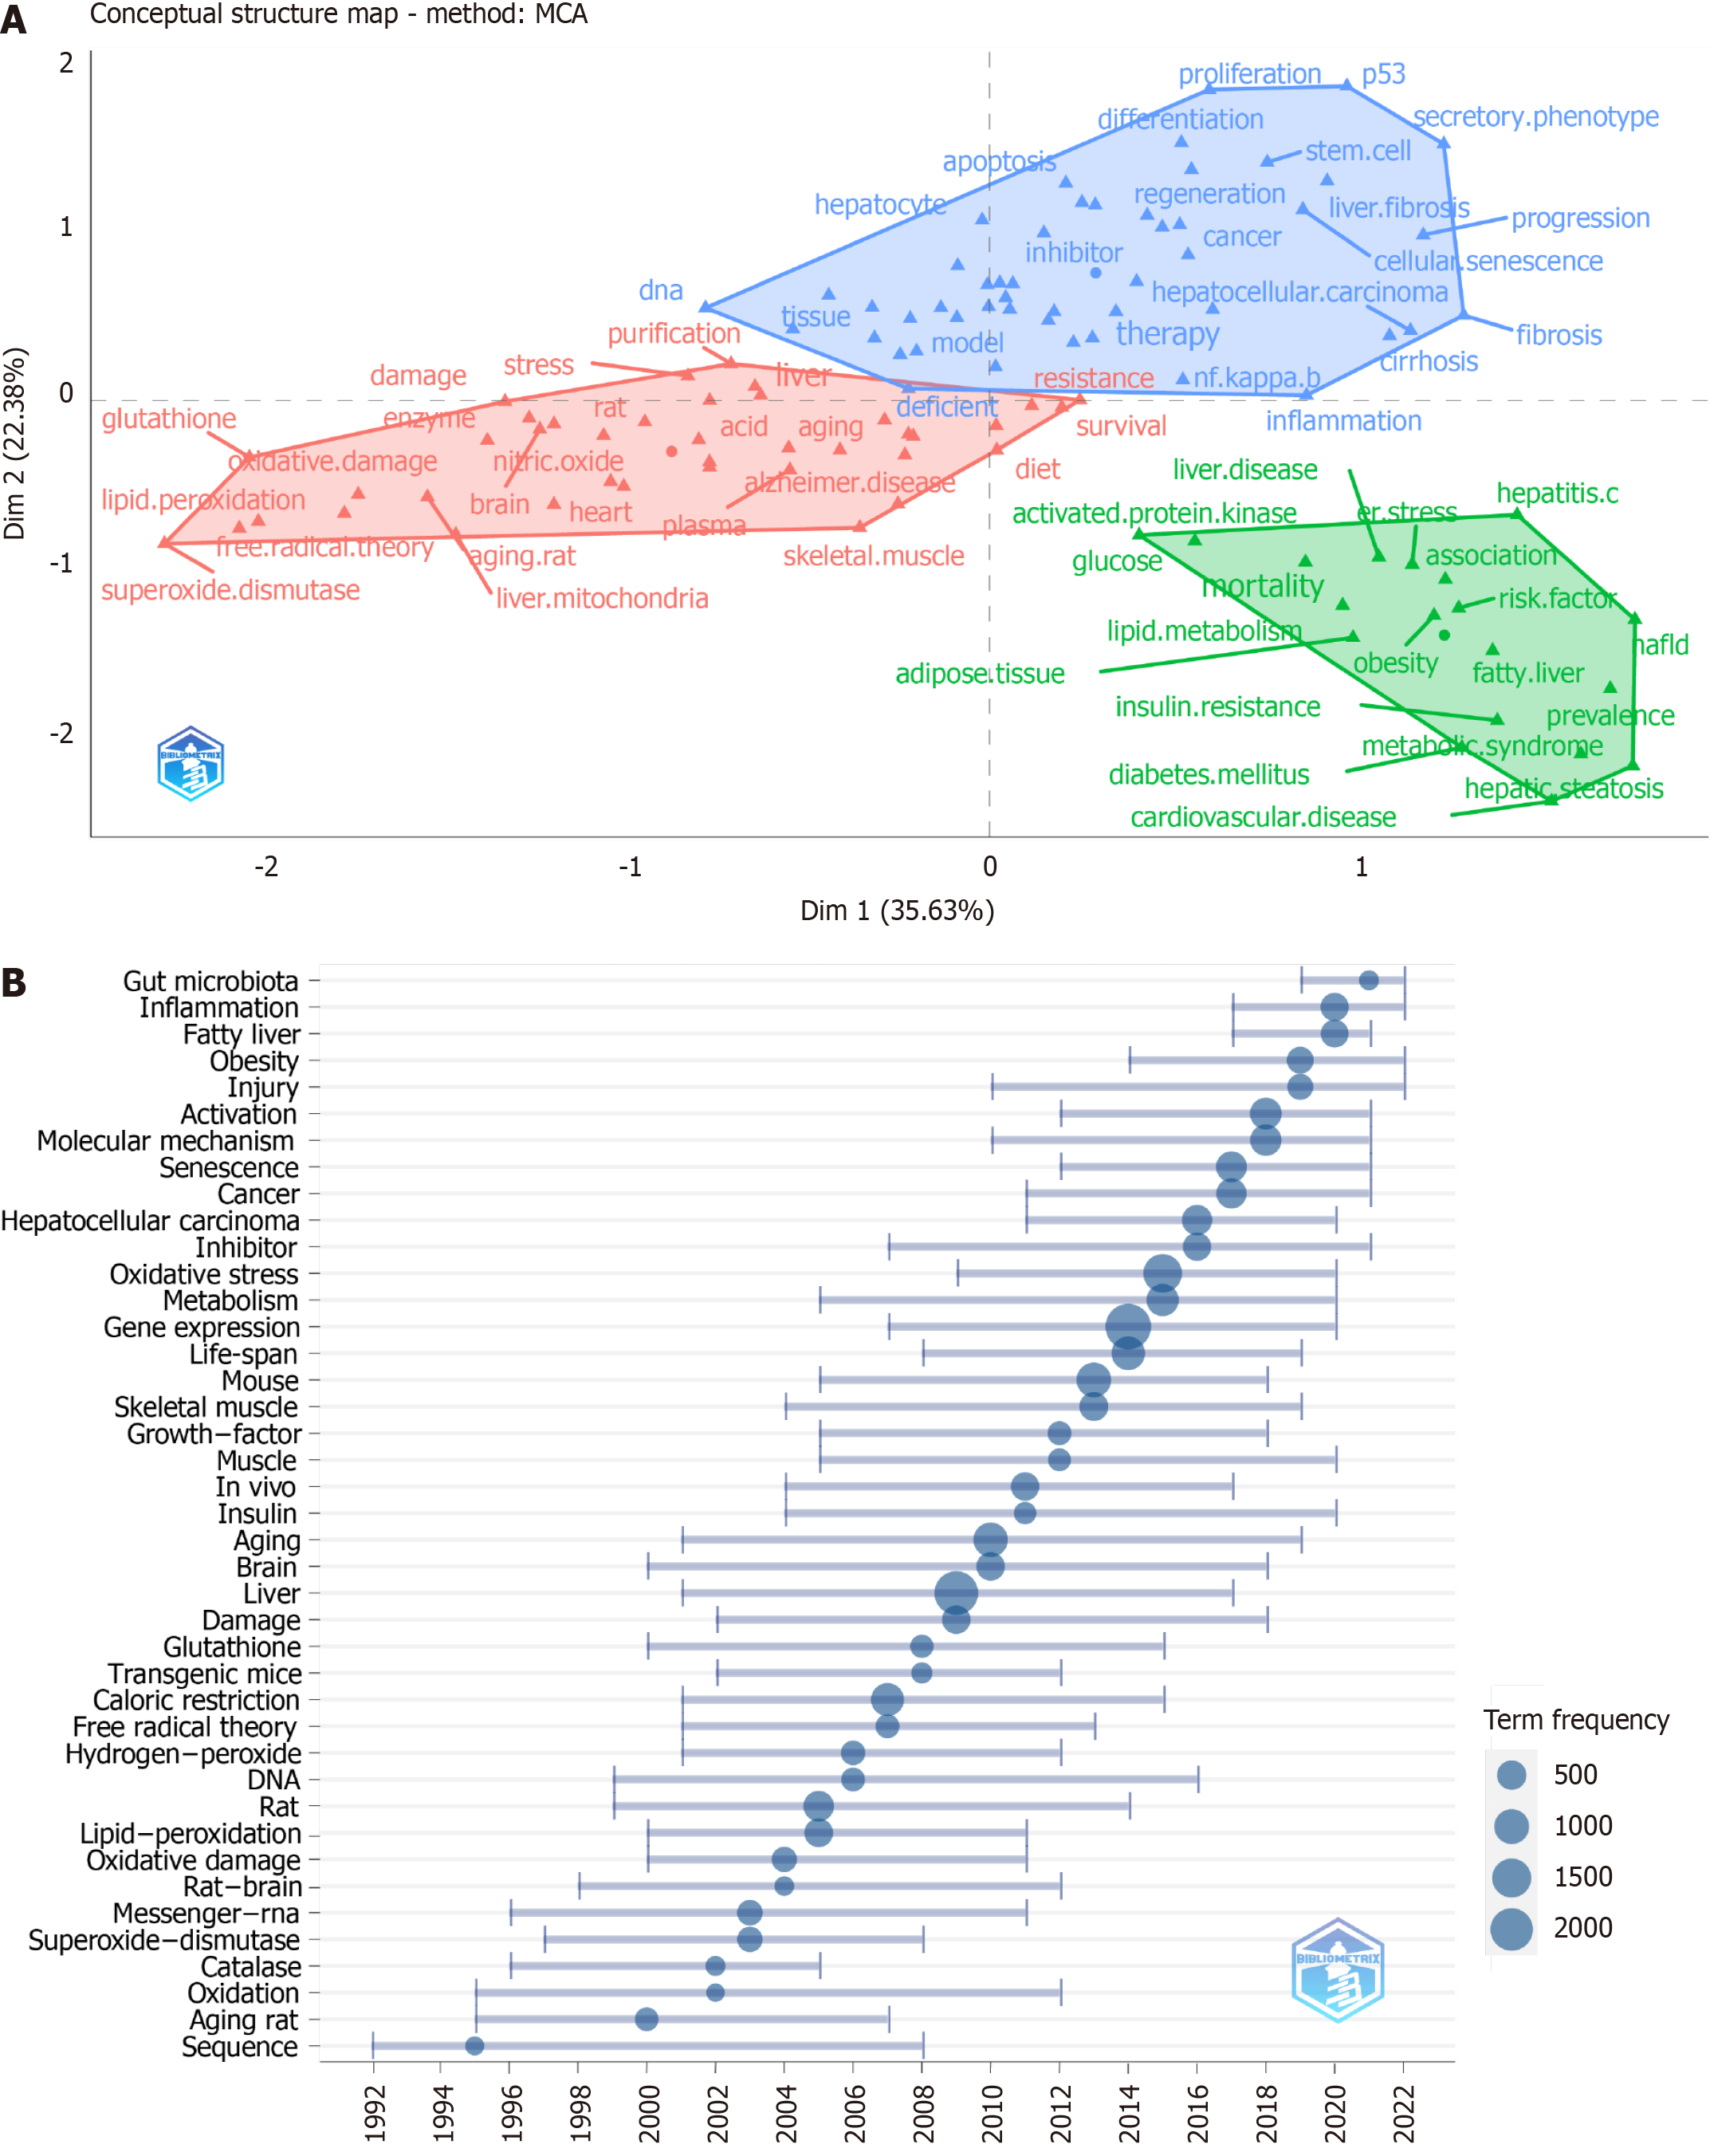
Figure 9 Research trends in liver aging research.
A: Conceptual structure map of keyword based on multiple correspondence analysis; B: Timeline of the research trends in liver aging. MCA: Multiple correspondence analysis.
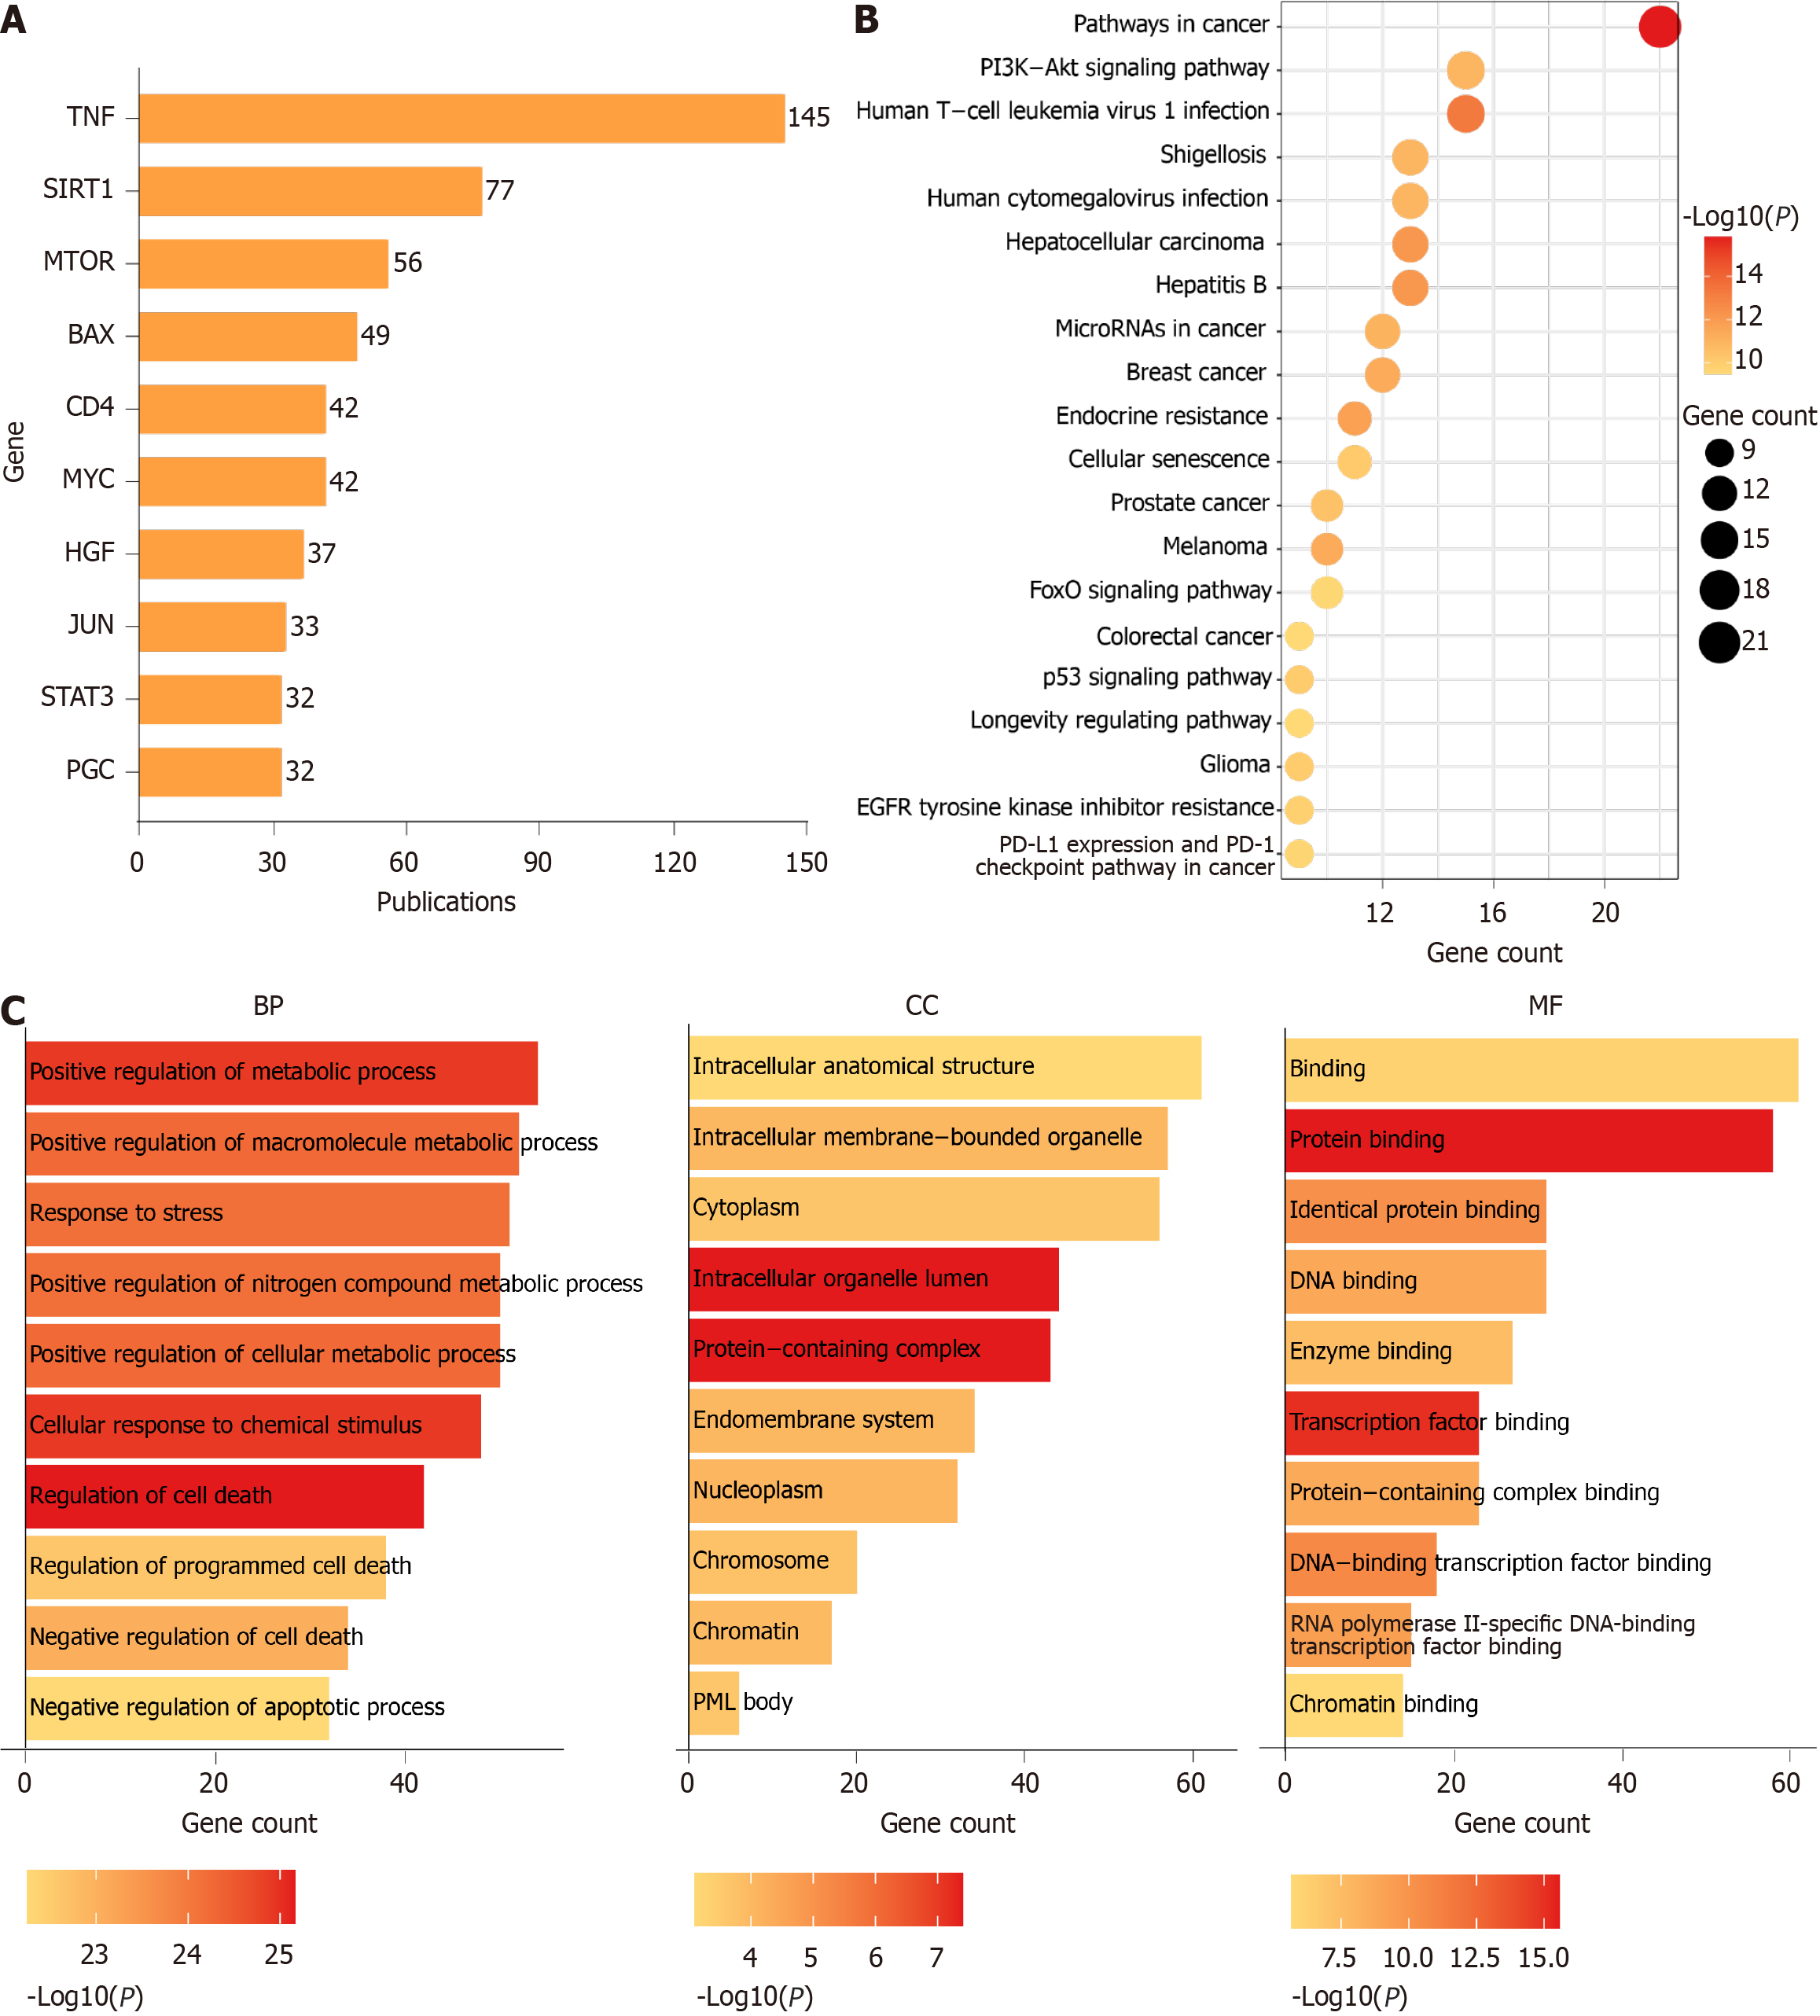
Figure 10 Gene analysis in liver aging research.
A: Top 20 genes reported in publication abstracts; B: Kyoto Encyclopedia of Genes Genomes pathway enrichment analysis of the top 64 genes; C: Gene Ontology enrichment analysis of the top 64 genes. BP: Biological process; MF: Molecular function; CC: Cellular component; TNF: Tumor necrosis factor; SIRT1: Sirtuin 1; mTOR: Mechanistic target of rapamycin; HGF: Hepatocyte growth factor; STAT3: Signal transducer and activator of transcription 3; PGC: Peroxisome proliferator-activated receptor gamma coactivator 1; PI3K: Phosphatidylinositol 3-kinase; Akt: Protein kinase B; FoxO: Forkhead box O; PD-L1: Programmed death-ligand 1; PD-1: Programmed cell death protein-1.
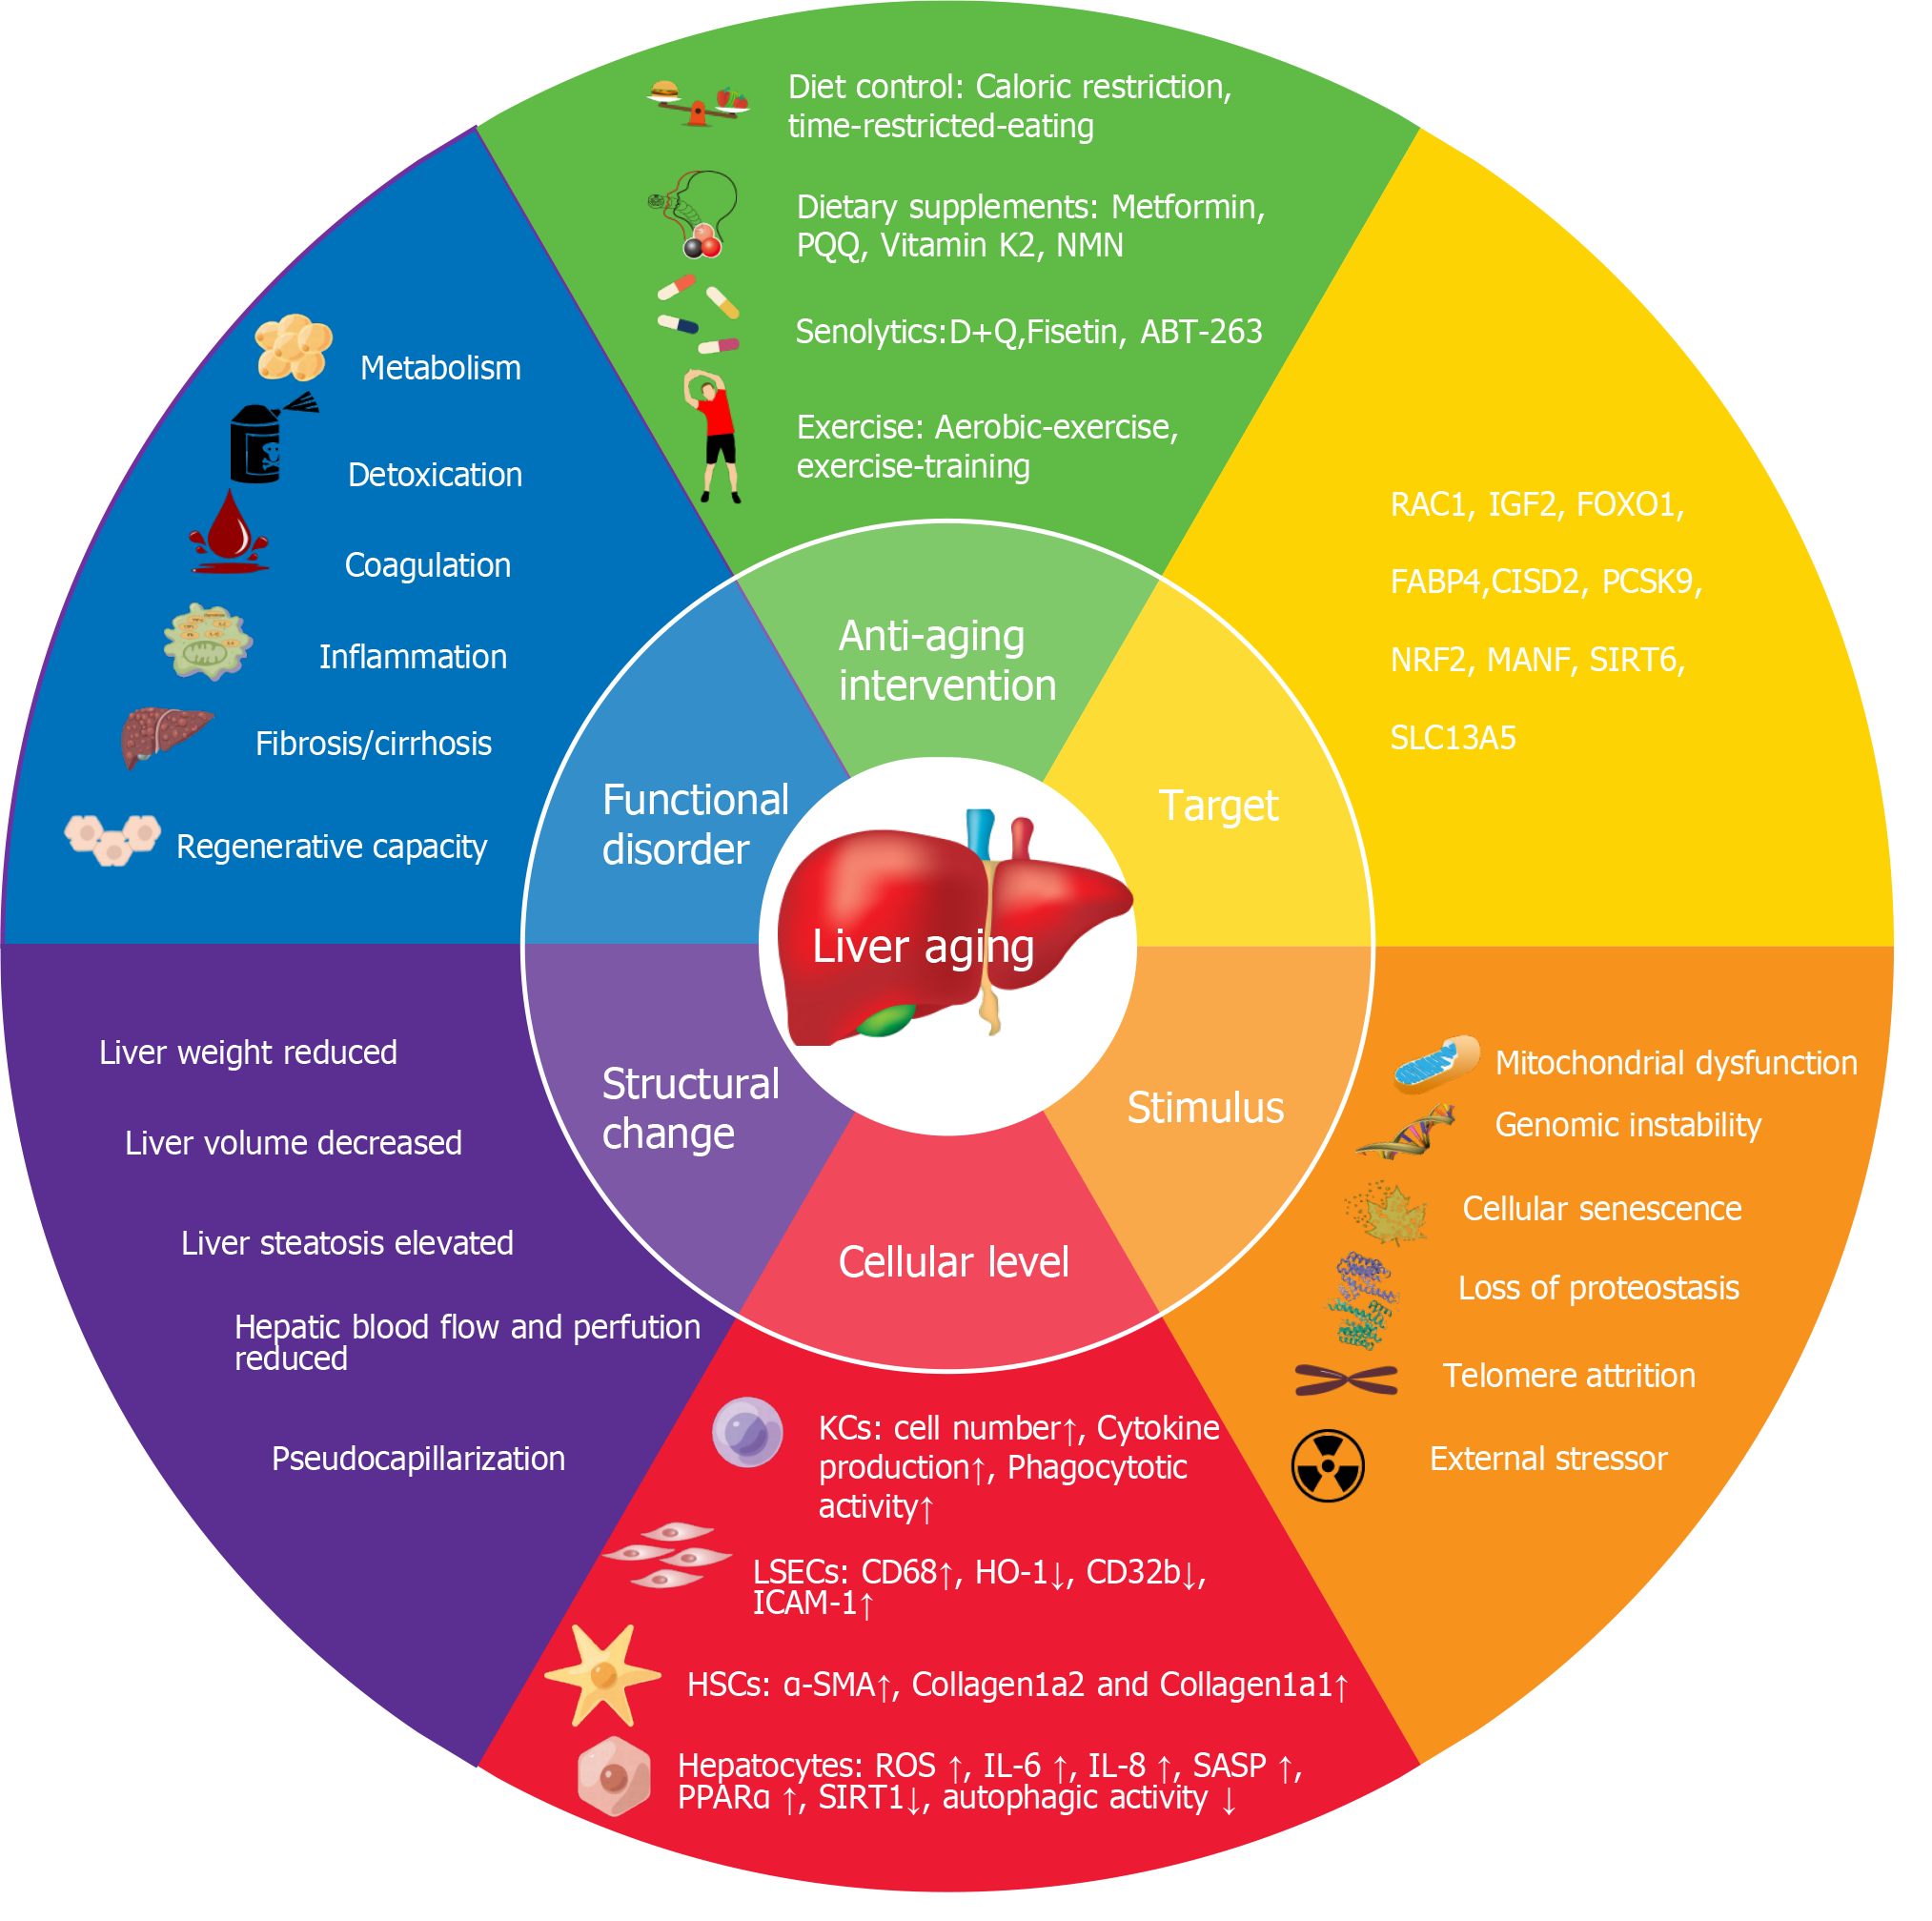
Figure 11 Holistic model in liver aging research.
The figure illustrates the stimuli of liver aging, cellular, structural and functional changes caused by liver aging, and interventions and targets for delaying liver aging. PQQ: Pyrroloquinoline quinone; NMN: Nicotinamide mononucleotide; FABP4: Fatty acid binding protein 4; RAC1, Ras-related C3 botulinum substrate 1; IGF2: Insulin-like growth factor 2; FOXO1: Forkhead box O1; CISD2: CDGSH iron–sulfur domain-containing protein 2; PCSK9: Proprotein convertase subtilisin/kexin type 9; MANF: Mesencephalic-astrocyte-derived neurotrophic factor; SIRT6: Sirtuin 6; SLC13A5: Solute carrier family 13 member 5; HO-1: Heme oxygenase 1; ICAM-1: Intercellular cell adhesion molecule-1; LSECs: Liver sinusoidal endothelial cells; HSCs: Hepatic stellate cells; α-SMA: Alpha-smooth muscle; ROS: Reactive oxygen species; KCs: Kupffer cells; DNMT1: DNA (cytosine-5-)- methyltransferase 1; D + Q: Dasatinib (D) and quercetin (Q); CD32b: Fc gamma receptor IIb; PPARα: Peroxisome proliferator activated receptor alpha; SASP: Senescence-associated secretory phenotype; IL: Interleukin.
- Citation: Han QH, Huang SM, Wu SS, Luo SS, Lou ZY, Li H, Yang YM, Zhang Q, Shao JM, Zhu LJ. Mapping the evolution of liver aging research: A bibliometric analysis. World J Gastroenterol 2024; 30(41): 4461-4480
- URL: https://www.wjgnet.com/1007-9327/full/v30/i41/4461.htm
- DOI: https://dx.doi.org/10.3748/wjg.v30.i41.4461


