Copyright
©The Author(s) 2024.
World J Gastroenterol. Oct 28, 2024; 30(40): 4354-4366
Published online Oct 28, 2024. doi: 10.3748/wjg.v30.i40.4354
Published online Oct 28, 2024. doi: 10.3748/wjg.v30.i40.4354
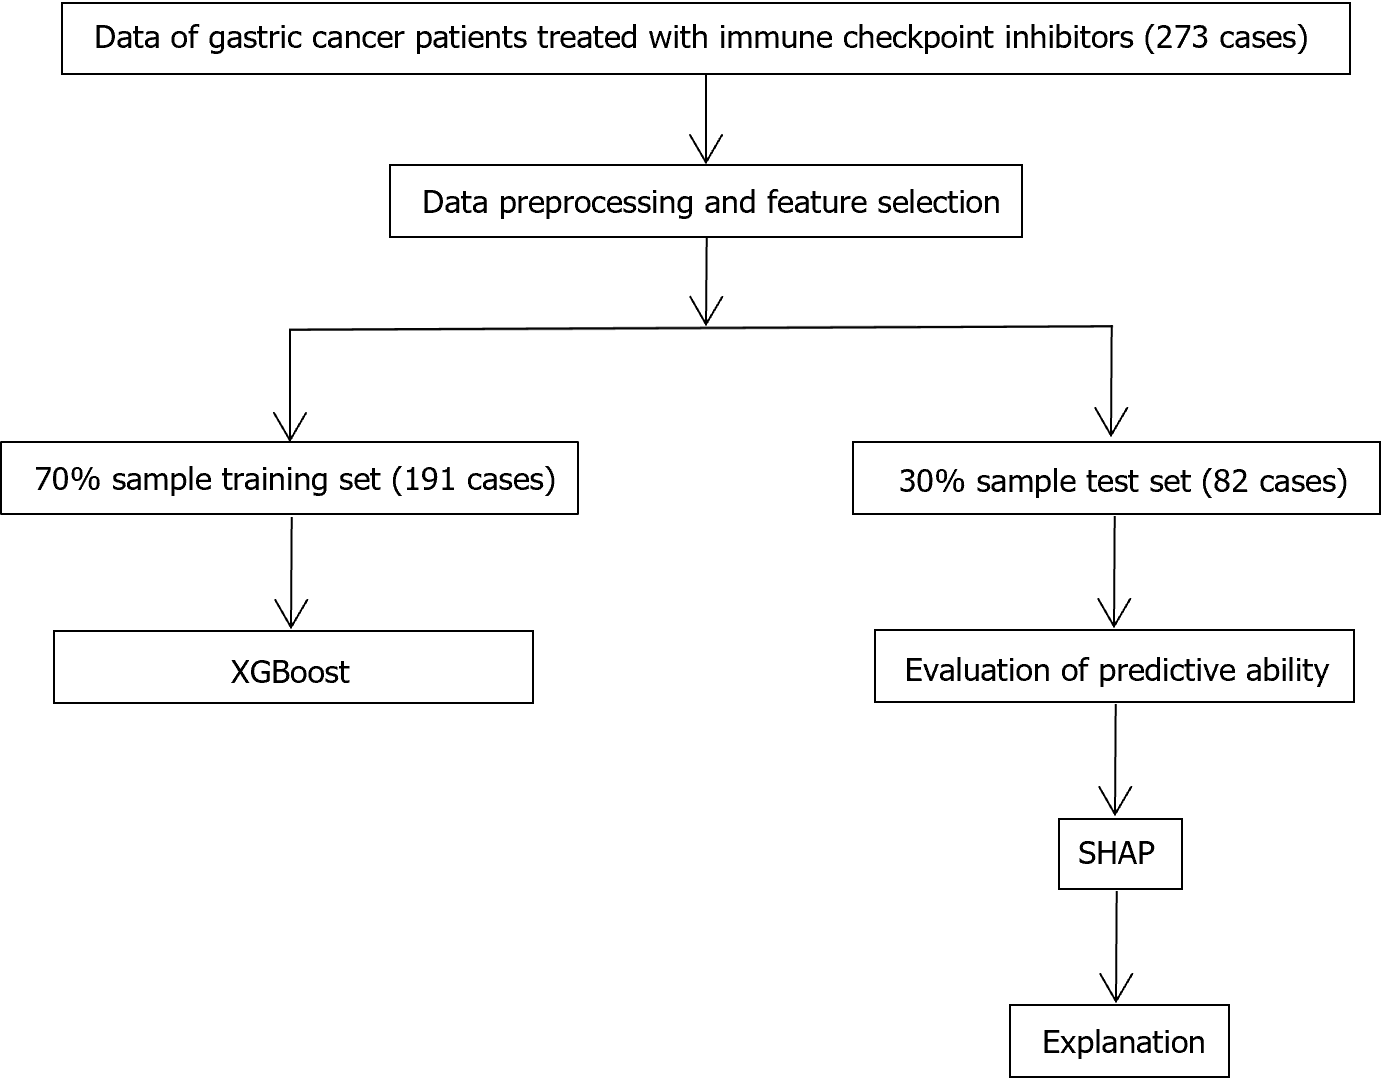
Figure 1 Flow chart of the study.
SHAP: Shapley additive explanation.
Figure 2 Kaplan-Meier survival curve analysis of risk score based on XGBoost.
A: When XGBoost was used to predict the patient’s overall survival, the Kaplan-Meier curve of the risk score in the training set; B: When XGBoost was used to predict the patient’s overall survival, the Kaplan-Meier curve of the risk score in the test set; C: When XGBoost was used to predict the patient’s progression-free survival, the Kaplan-Meier curve of the risk score in the training set; D: When XGBoost was used to predict the patient’s progression-free survival, the Kaplan-Meier curve of the risk score in the test set.
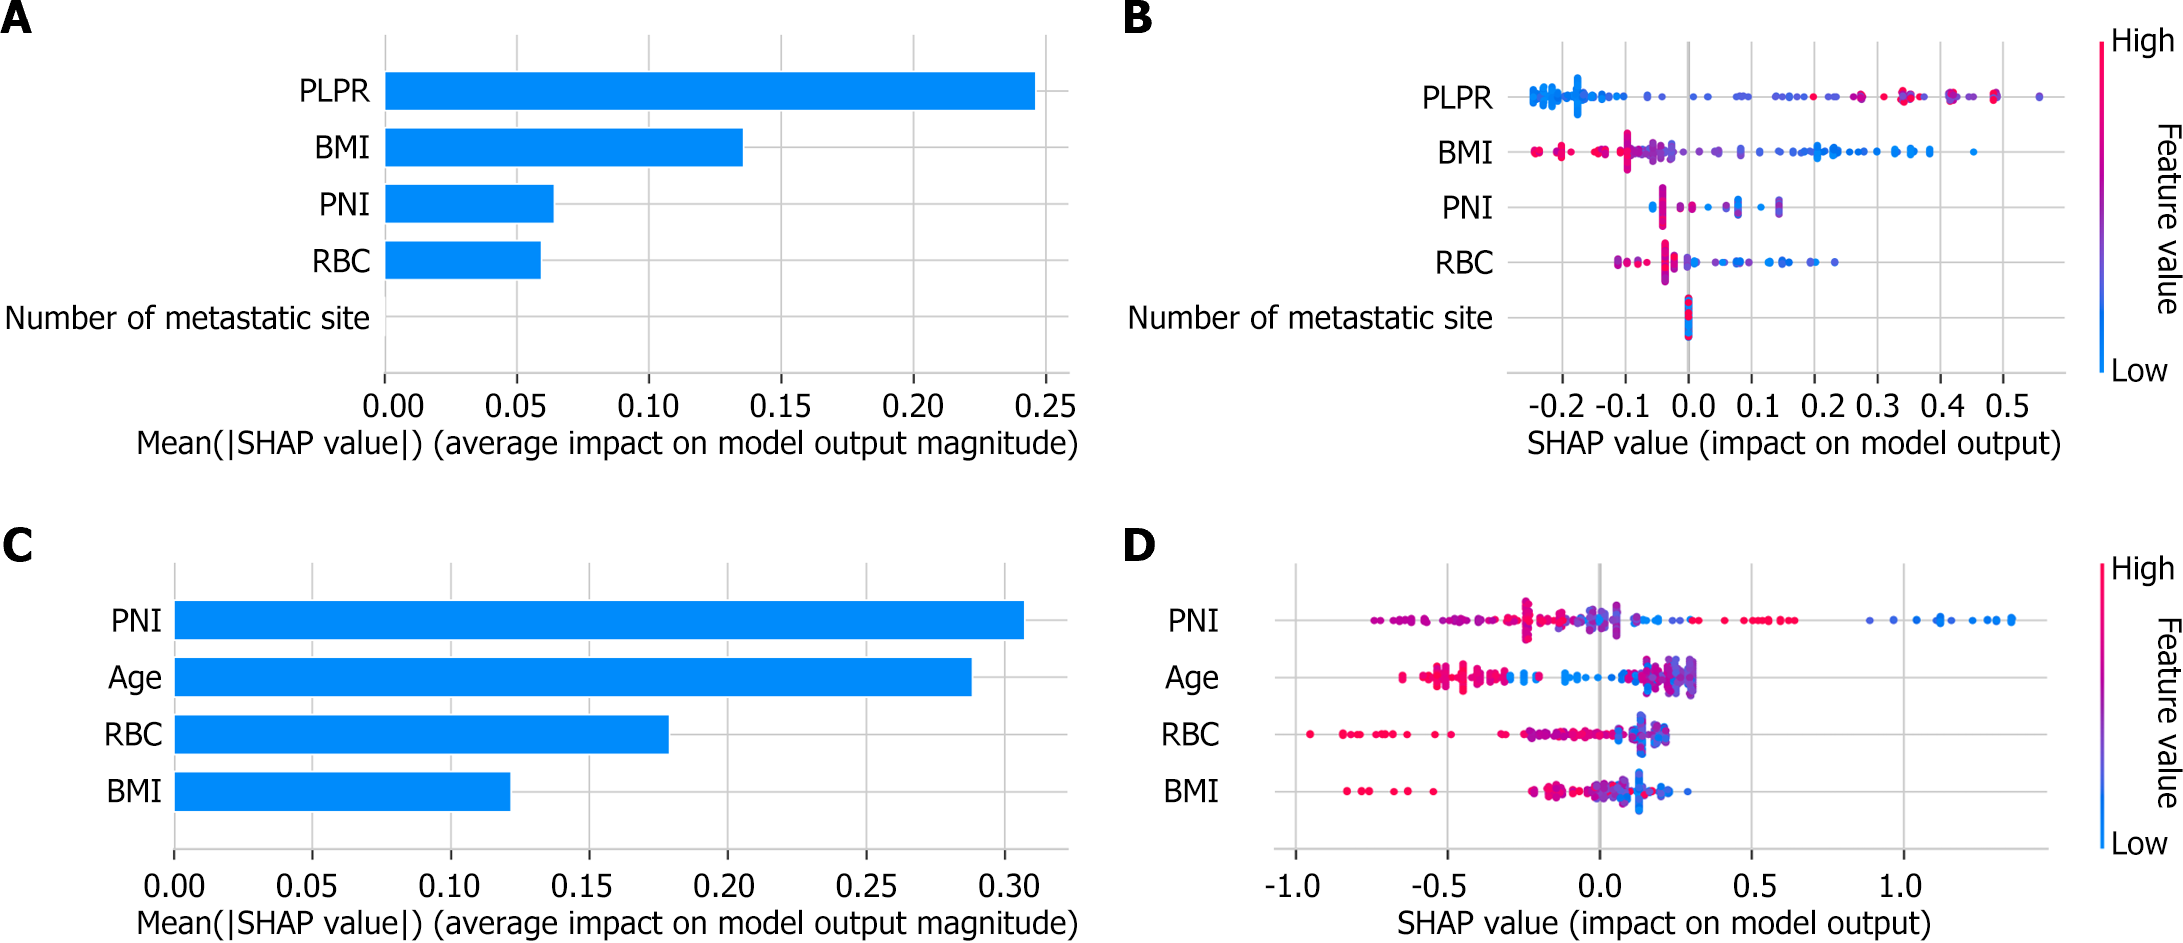
Figure 3 The Shapley additive explanation value analysis diagram of the XGBoost model is used to explain the importance and direction of the features that affect the overall survival and progression-free survival.
A: In the XGBoost model with overall survival as the endpoint, the average contribution of each feature to overall survival is shown; B: In the XGBoost model with overall survival as the endpoint, with the change of the size of the value of each feature, the distribution of their detailed Shapley additive explanation values; C: In the XGBoost model with progression-free survival as the endpoint, the average contribution of each feature to progression-free survival is shown; D: In the XGBoost model with progression-free survival as the endpoint, with the change of the size of the value of each feature, the distribution of their detailed Shapley additive explanation values. PLPR: Platelet count/(lymphocyte count × serum prealbumin); BMI: Body mass index; PNI: Serum albumin + 5 × lymphocyte count; RBC: Red blood cell; SHAP: Shapley additive explanation.
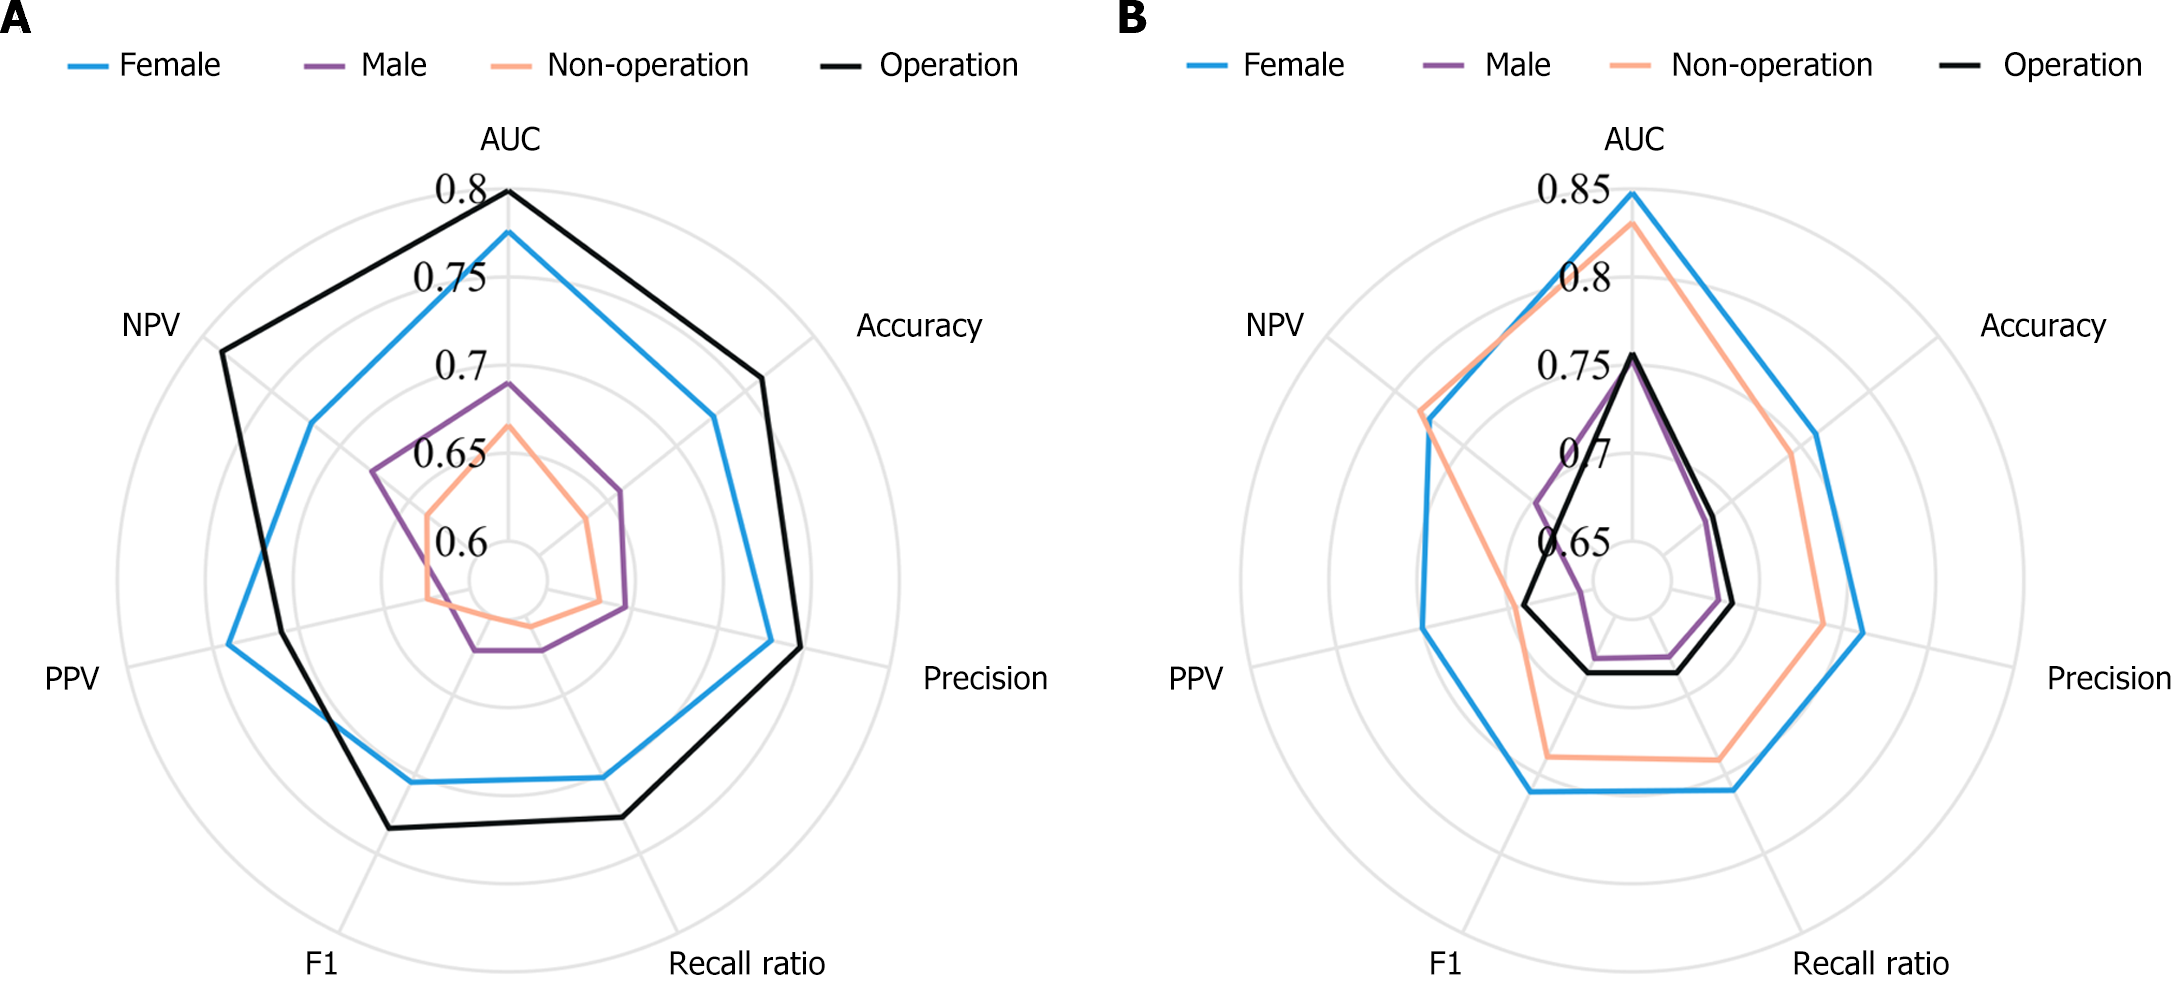
Figure 4 Performance in the four subgroups when XGBoost is used to predict the patient’s overall survival and progression-free survival.
A: The performance of XGBoost in predicting overall survival for female patients, male patients, non-surgically treated patients, and surgically treated patients; B: The performance of XGBoost in predicting progression-free survival for female patients, male patients, non-surgically treated patients, and surgically treated patients. NPV: Negative predictive value; PPV: Positive predictive value.
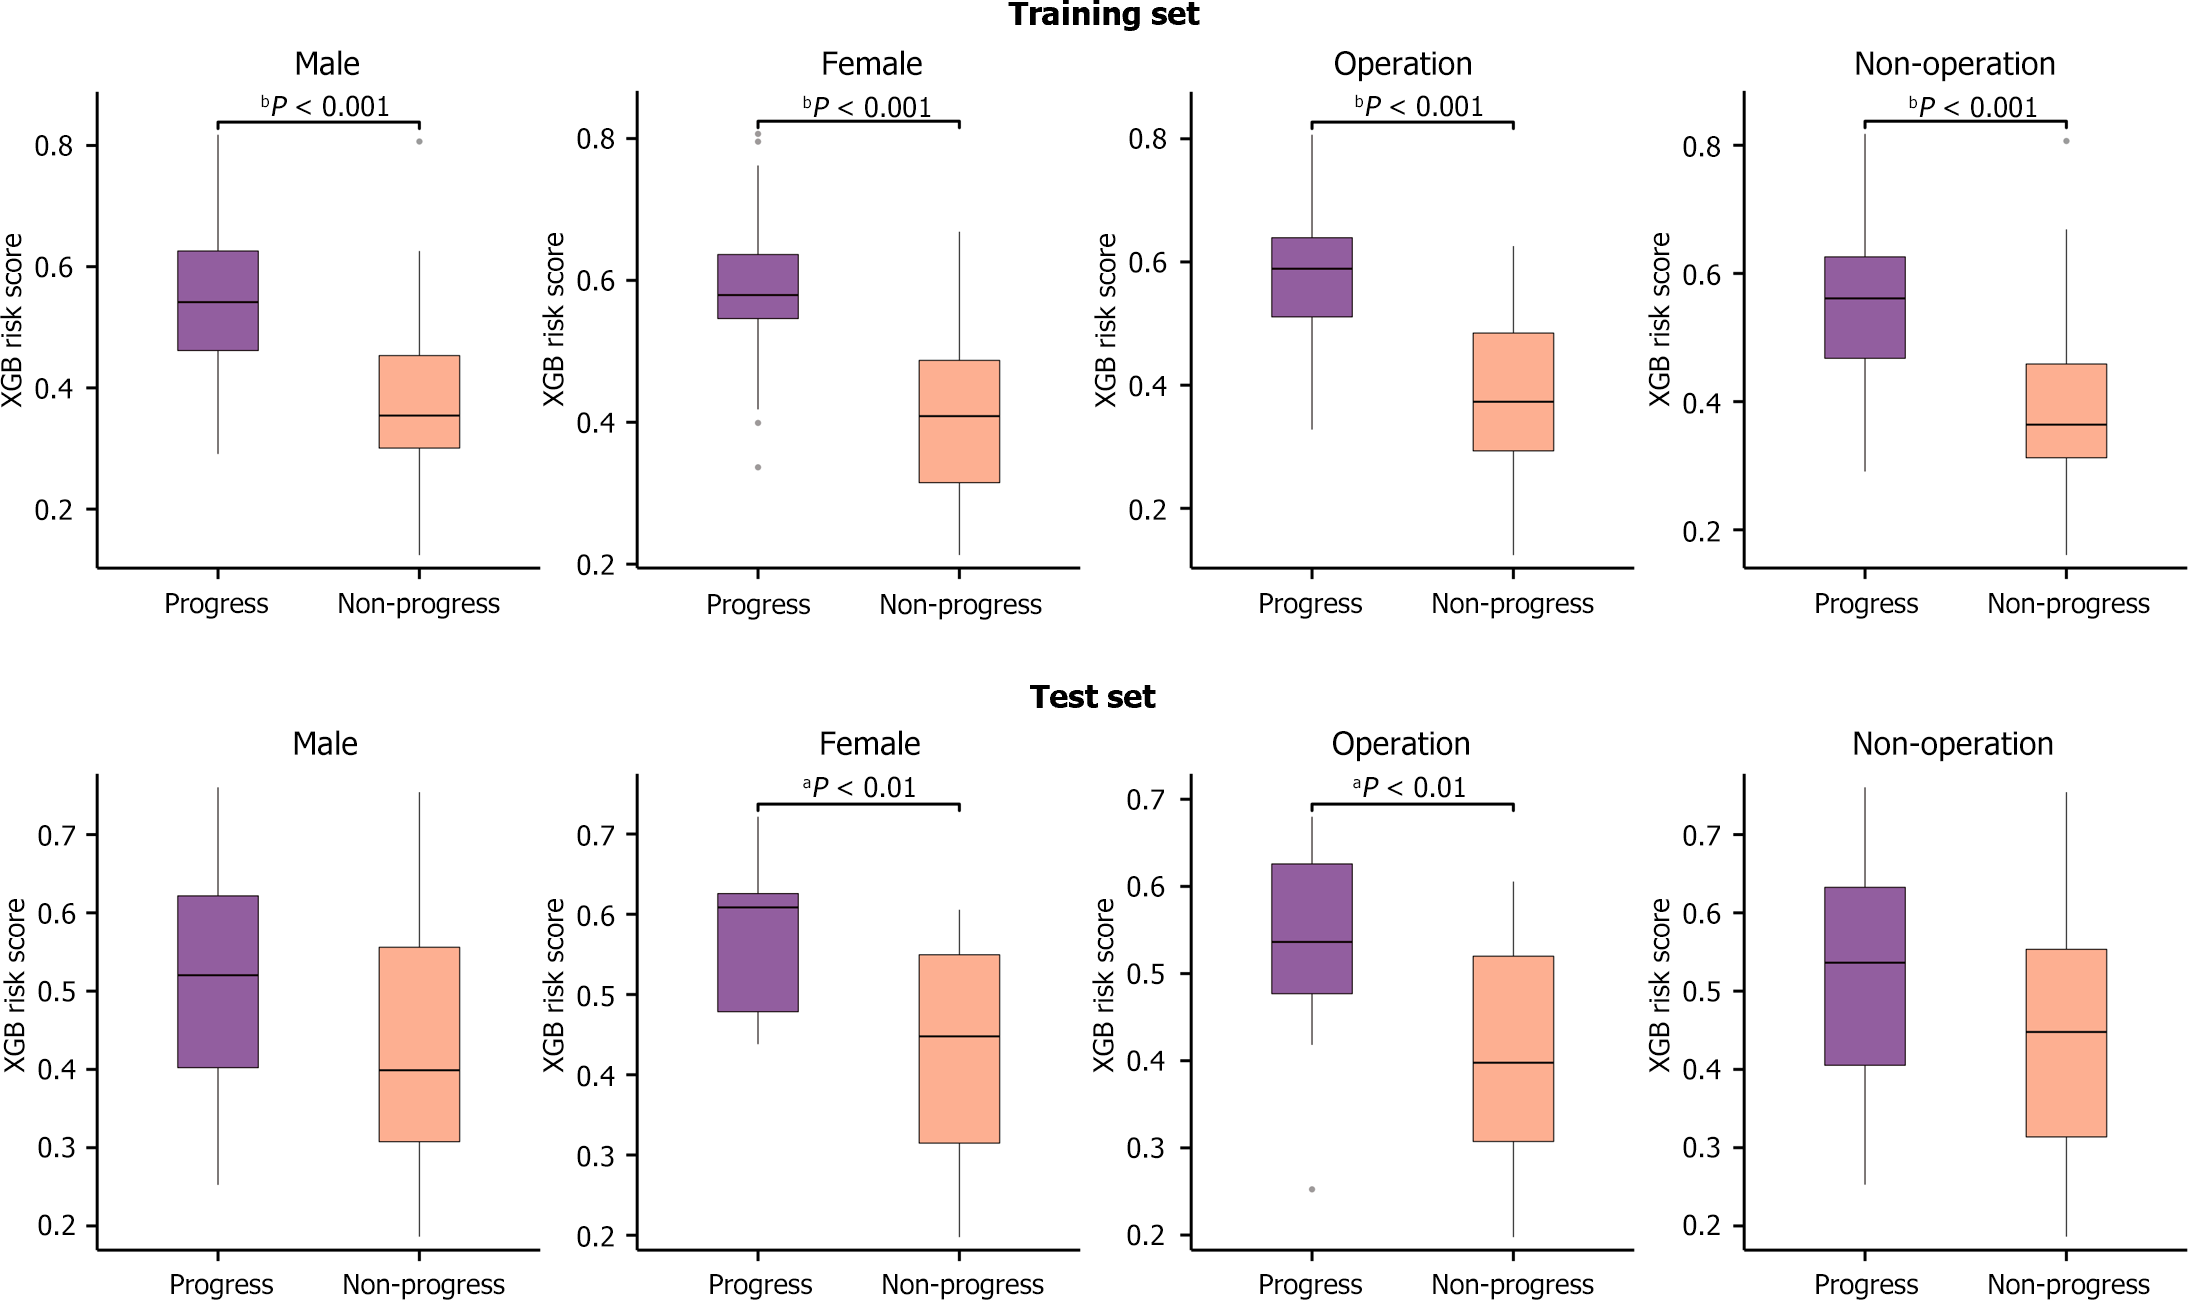
Figure 5 When XGBoost is used to predict overall survival, the distribution of risk scores in each subgroup of the training set, and the test set.
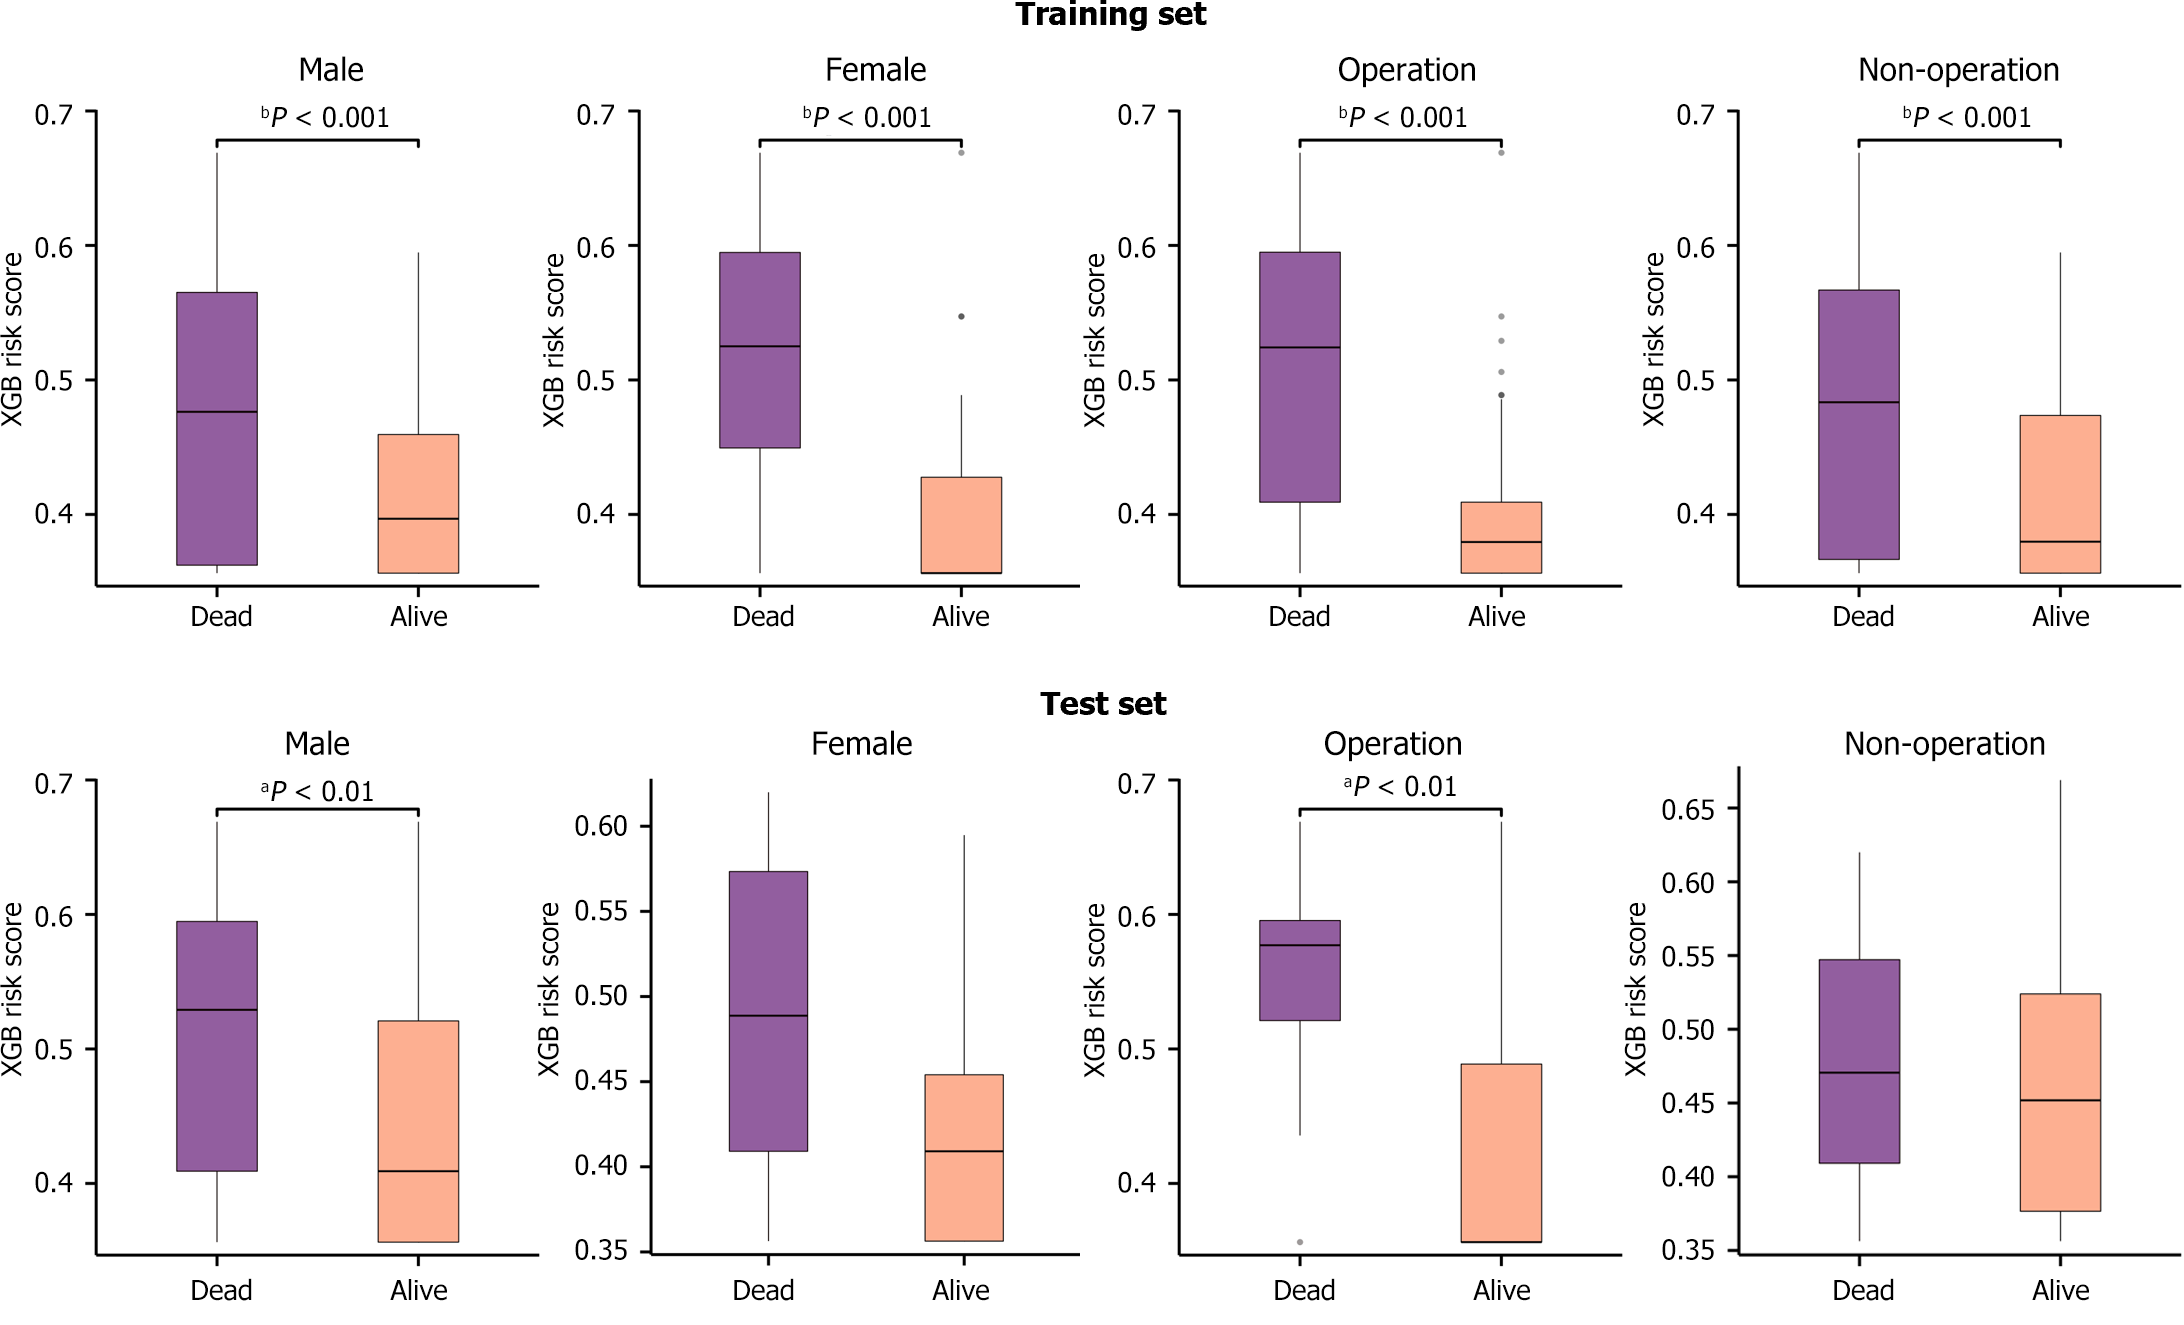
Figure 6 When XGBoost is used to predict progression-free survival, the distribution of risk scores in each subgroup of the training set, and the test set.
- Citation: Li HW, Zhu ZY, Sun YF, Yuan CY, Wang MH, Wang N, Xue YW. Machine learning algorithms able to predict the prognosis of gastric cancer patients treated with immune checkpoint inhibitors. World J Gastroenterol 2024; 30(40): 4354-4366
- URL: https://www.wjgnet.com/1007-9327/full/v30/i40/4354.htm
- DOI: https://dx.doi.org/10.3748/wjg.v30.i40.4354


